Profit Analysis and Supply Chain Planning Model for Closed-Loop Supply Chain in Fashion Industry

Abstract
:
1. Introduction
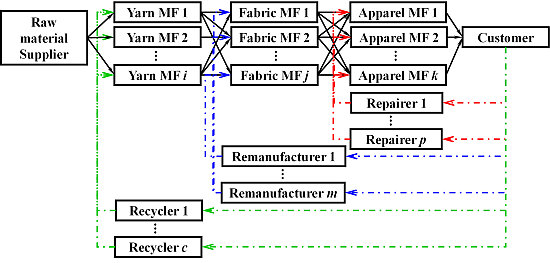
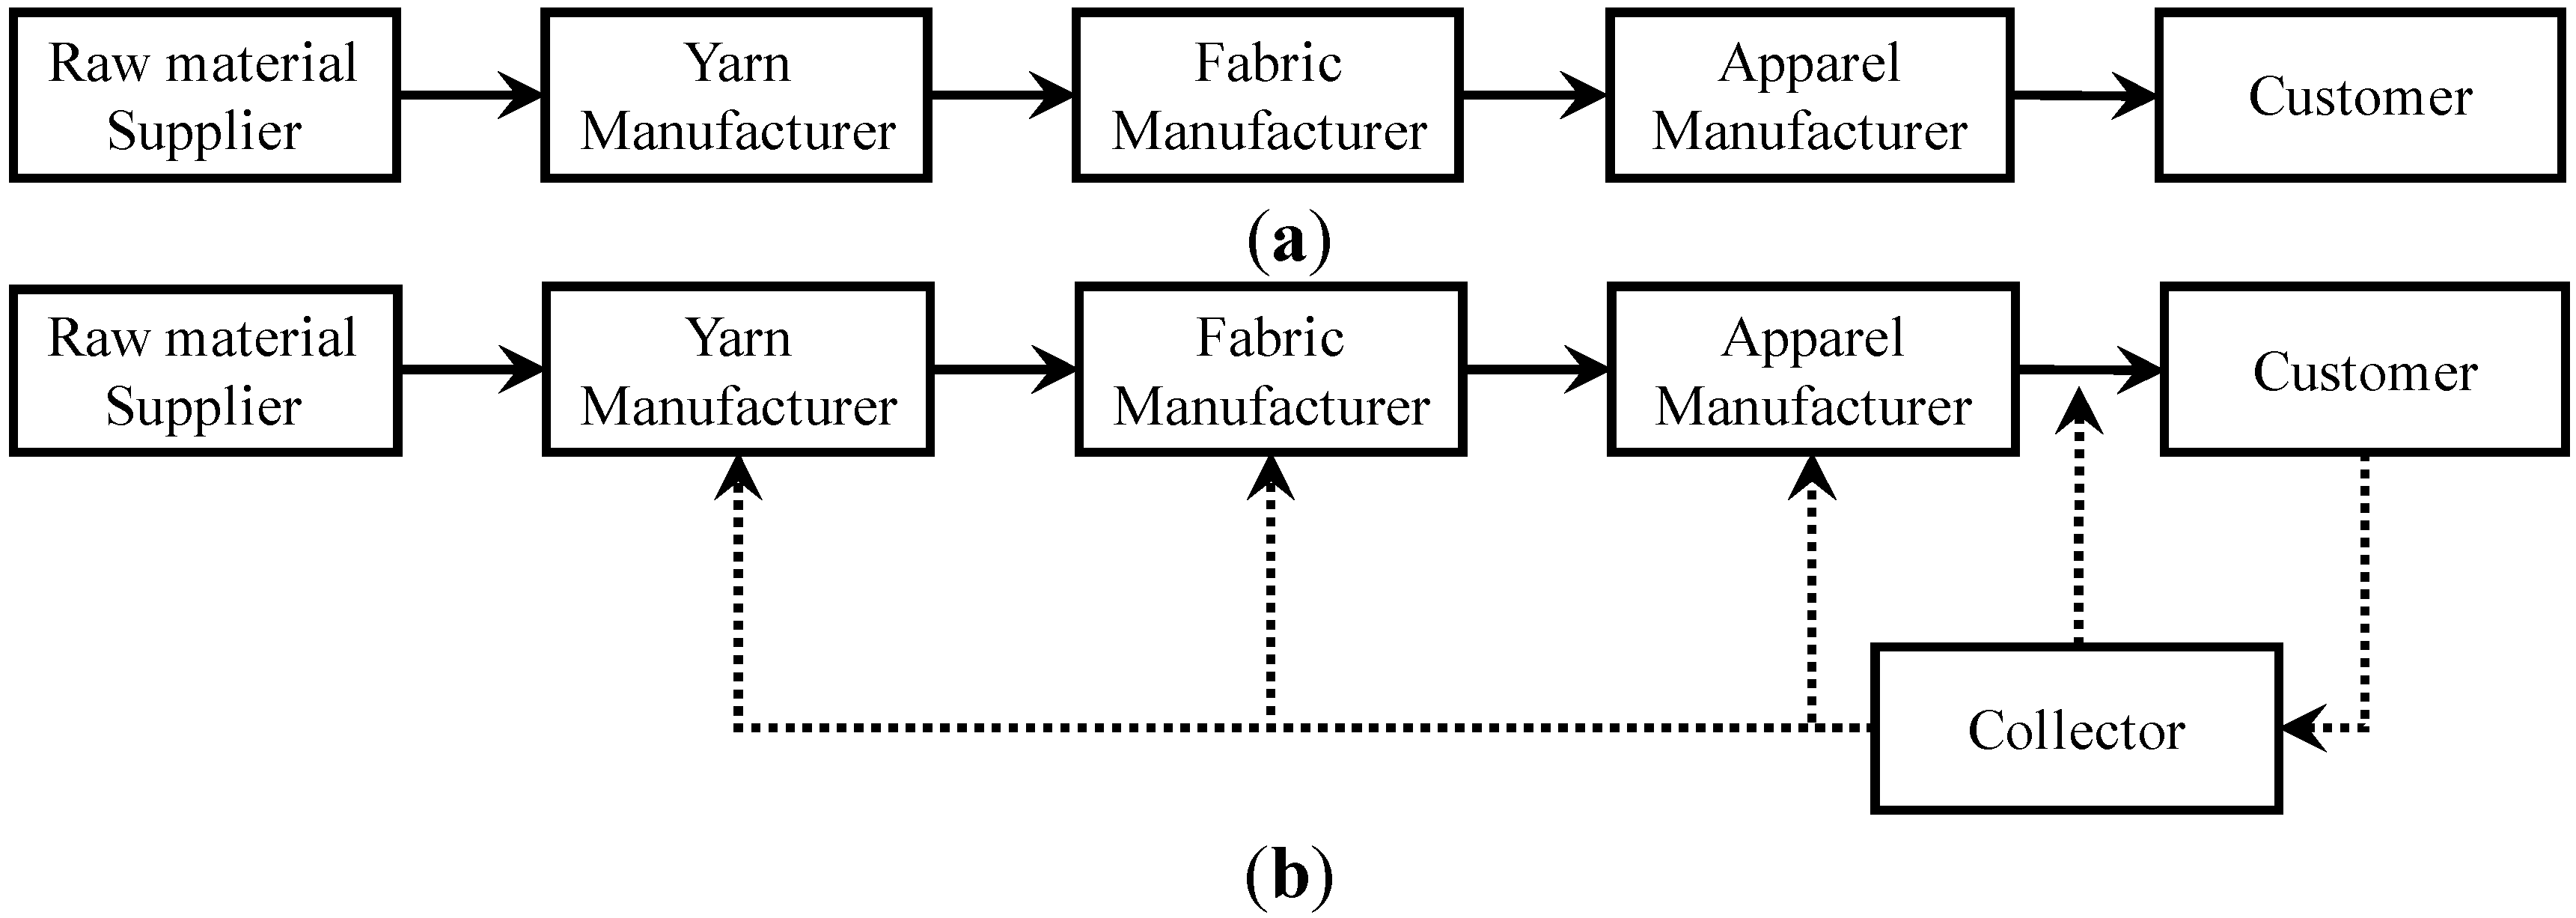
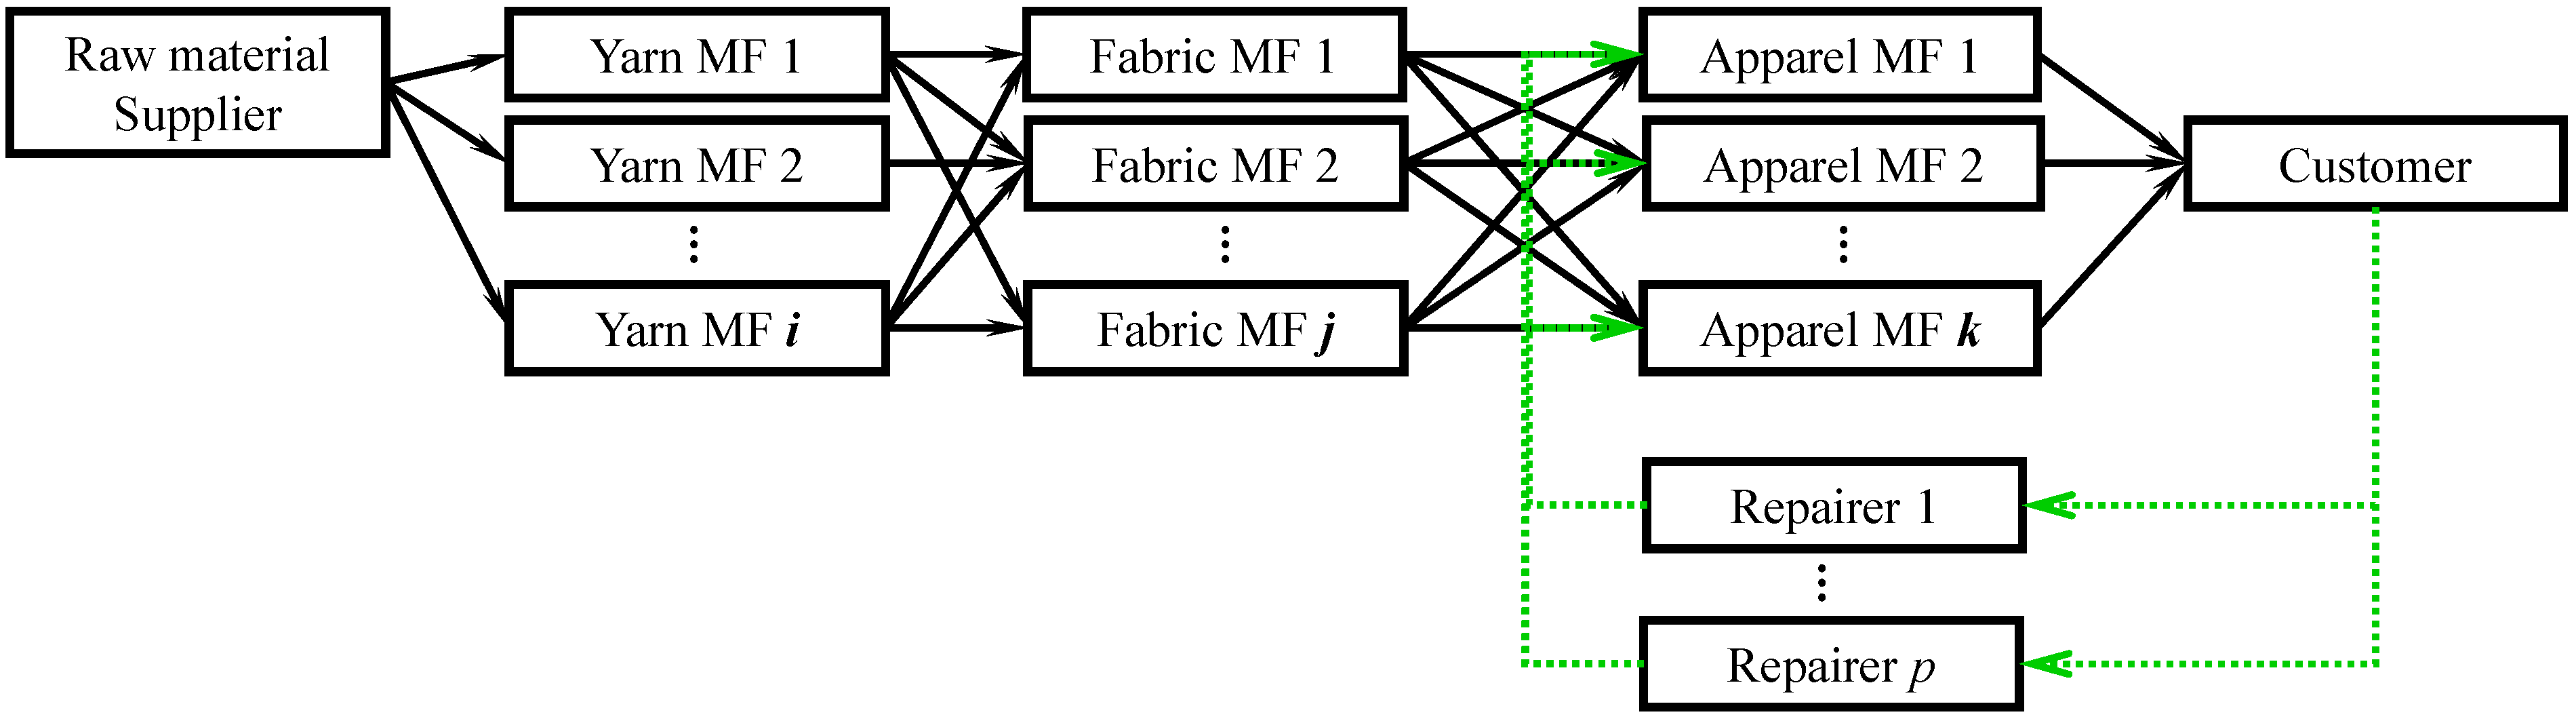
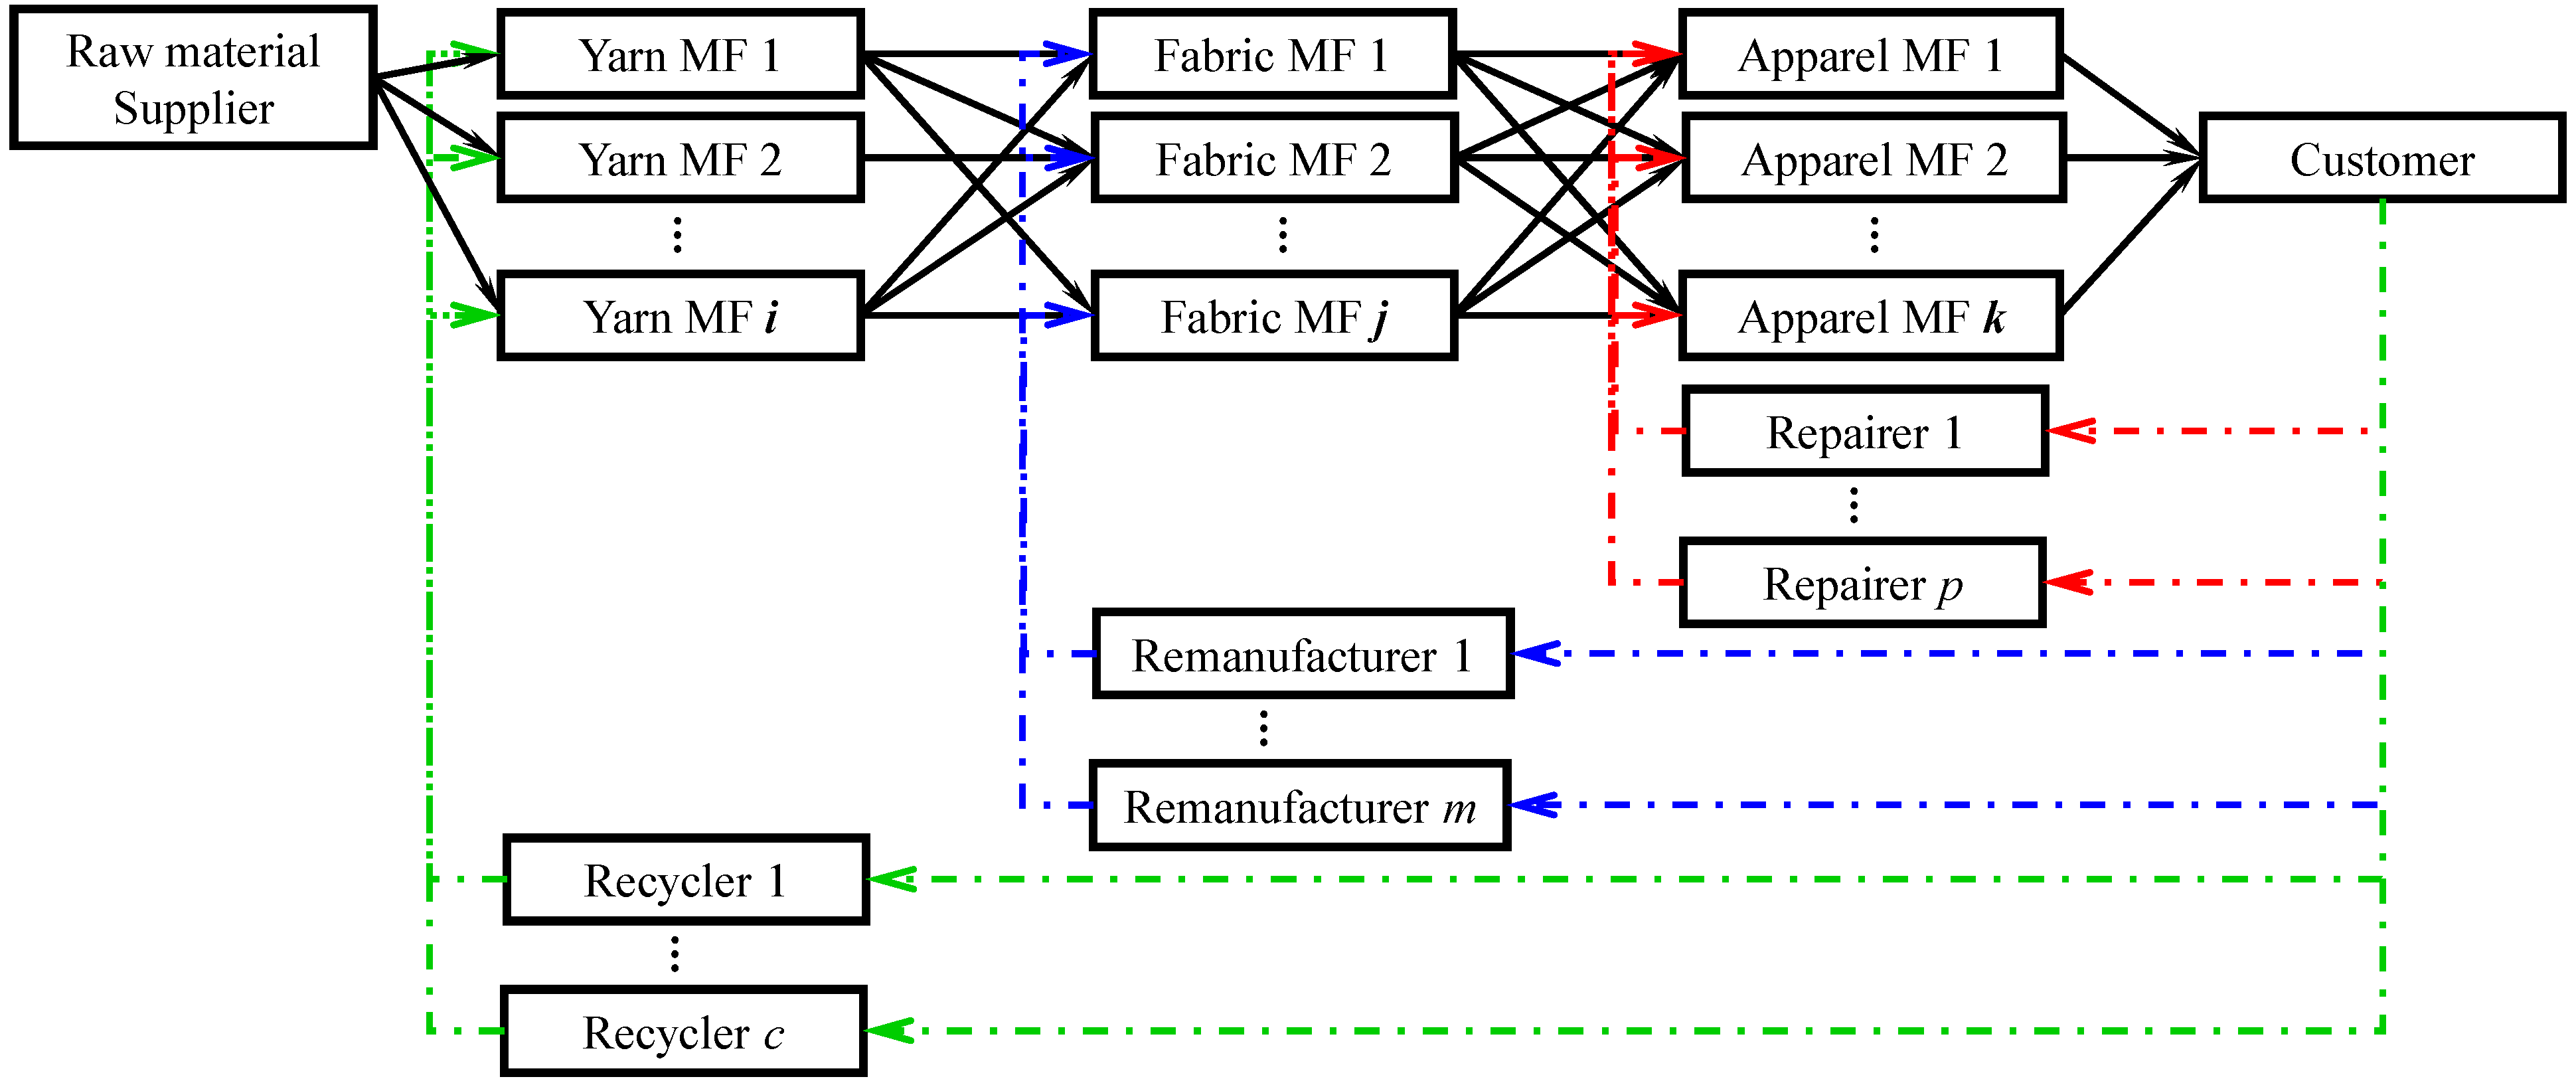
2. Structure of Closed-Loop Supply Chain (CLSC) in Fashion Industry


| Recycling | Remanufacturing | Repairing | |
|---|---|---|---|
| Collector | Recycler | Remanufacturer | Repairer |
| Level of Disassembly | To raw material | To yarn product | To fabric product |
| To semi-yarn product | To semi-fabric product | To semi-apparel product |
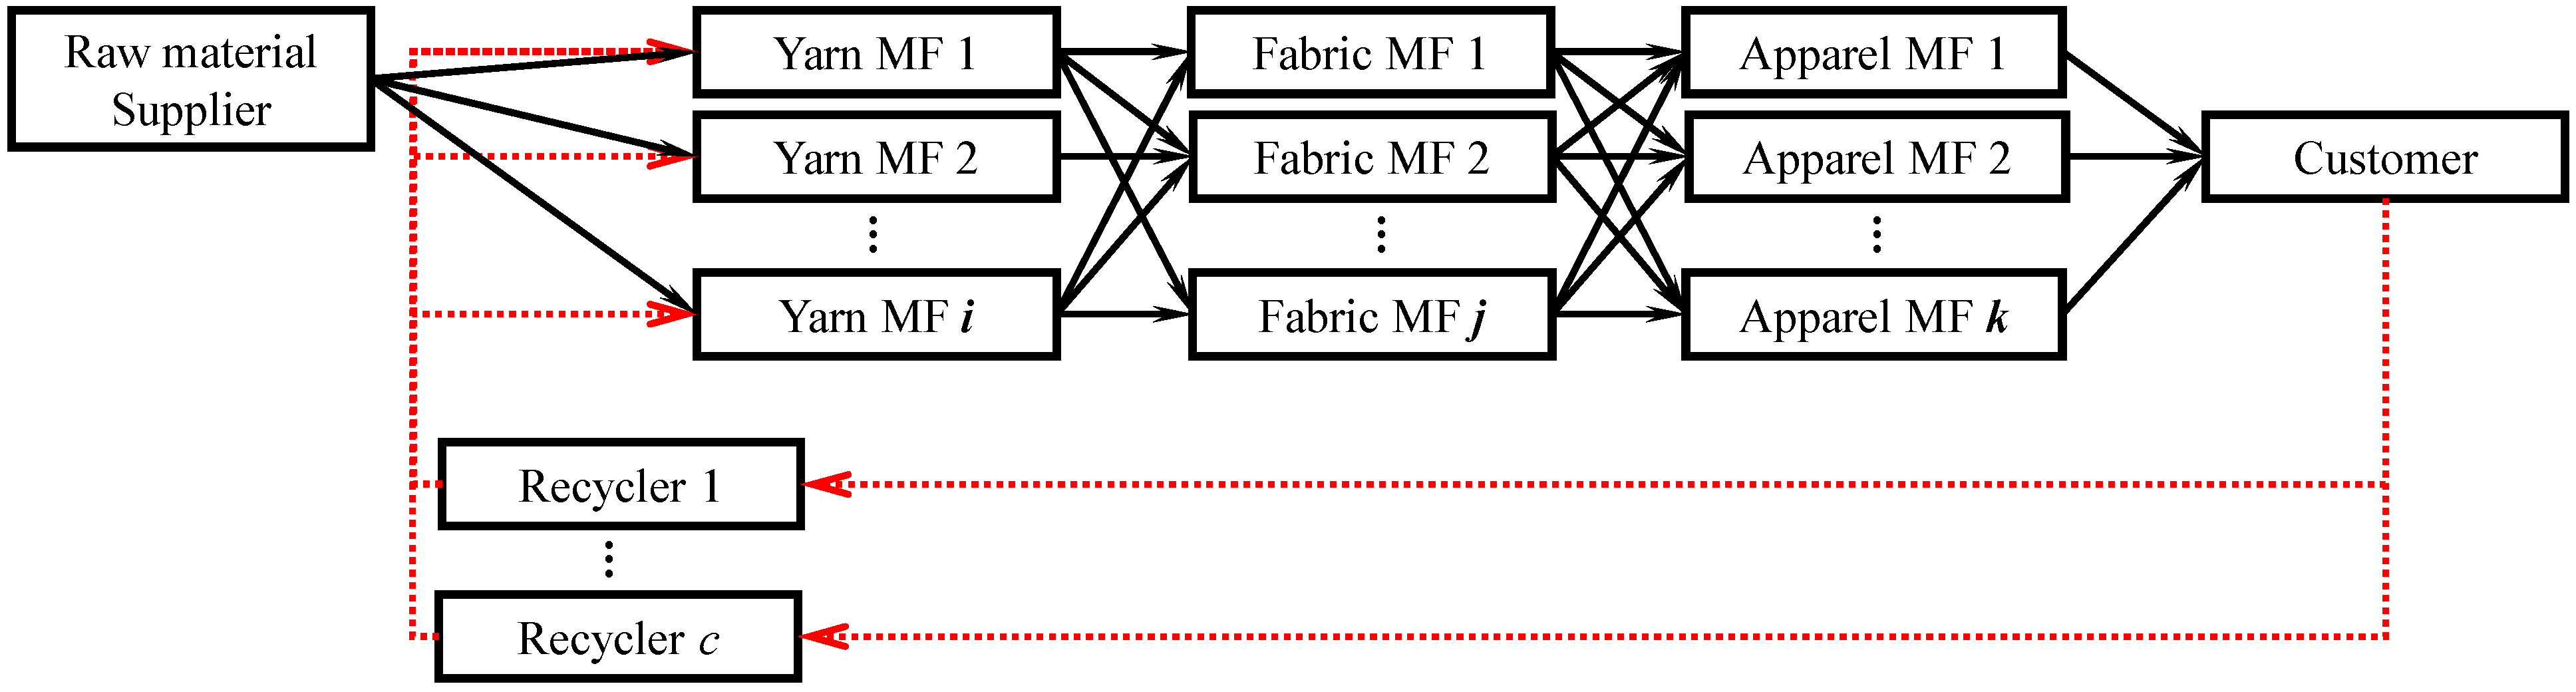
2.1. Recycling CLSC
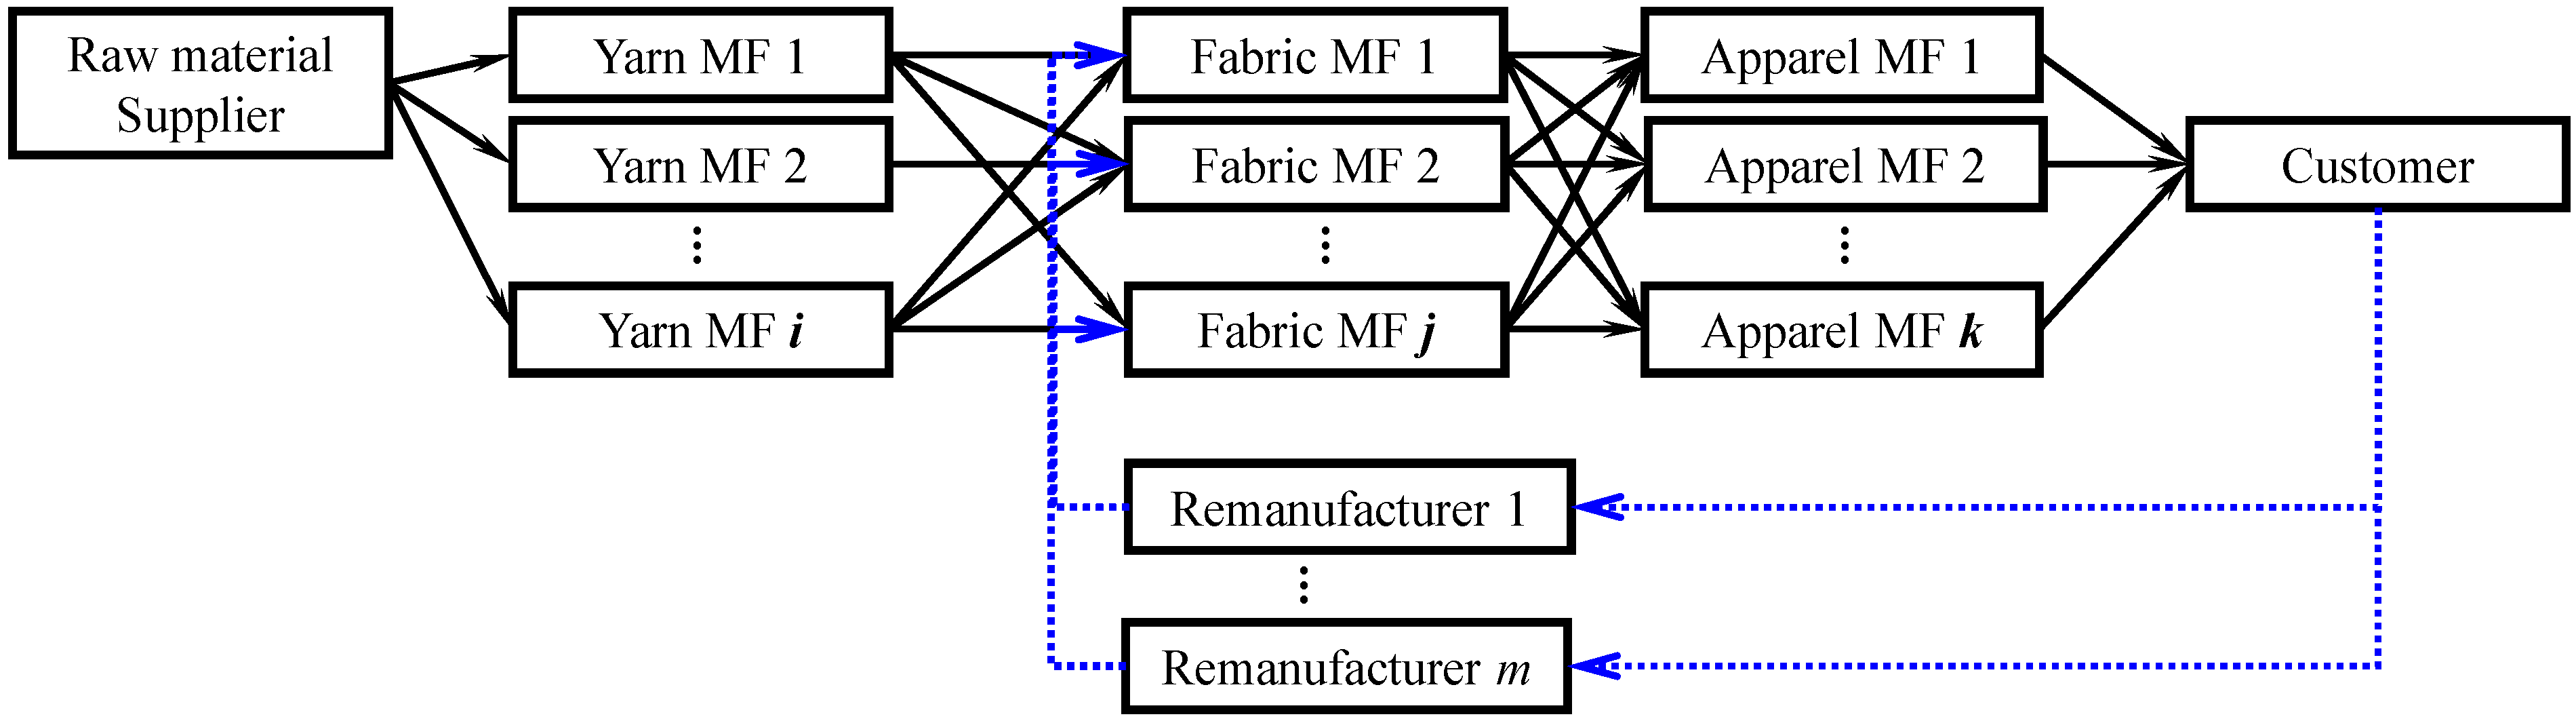
2.2. Remanufacturing CLSC
2.3. Repair CLSC

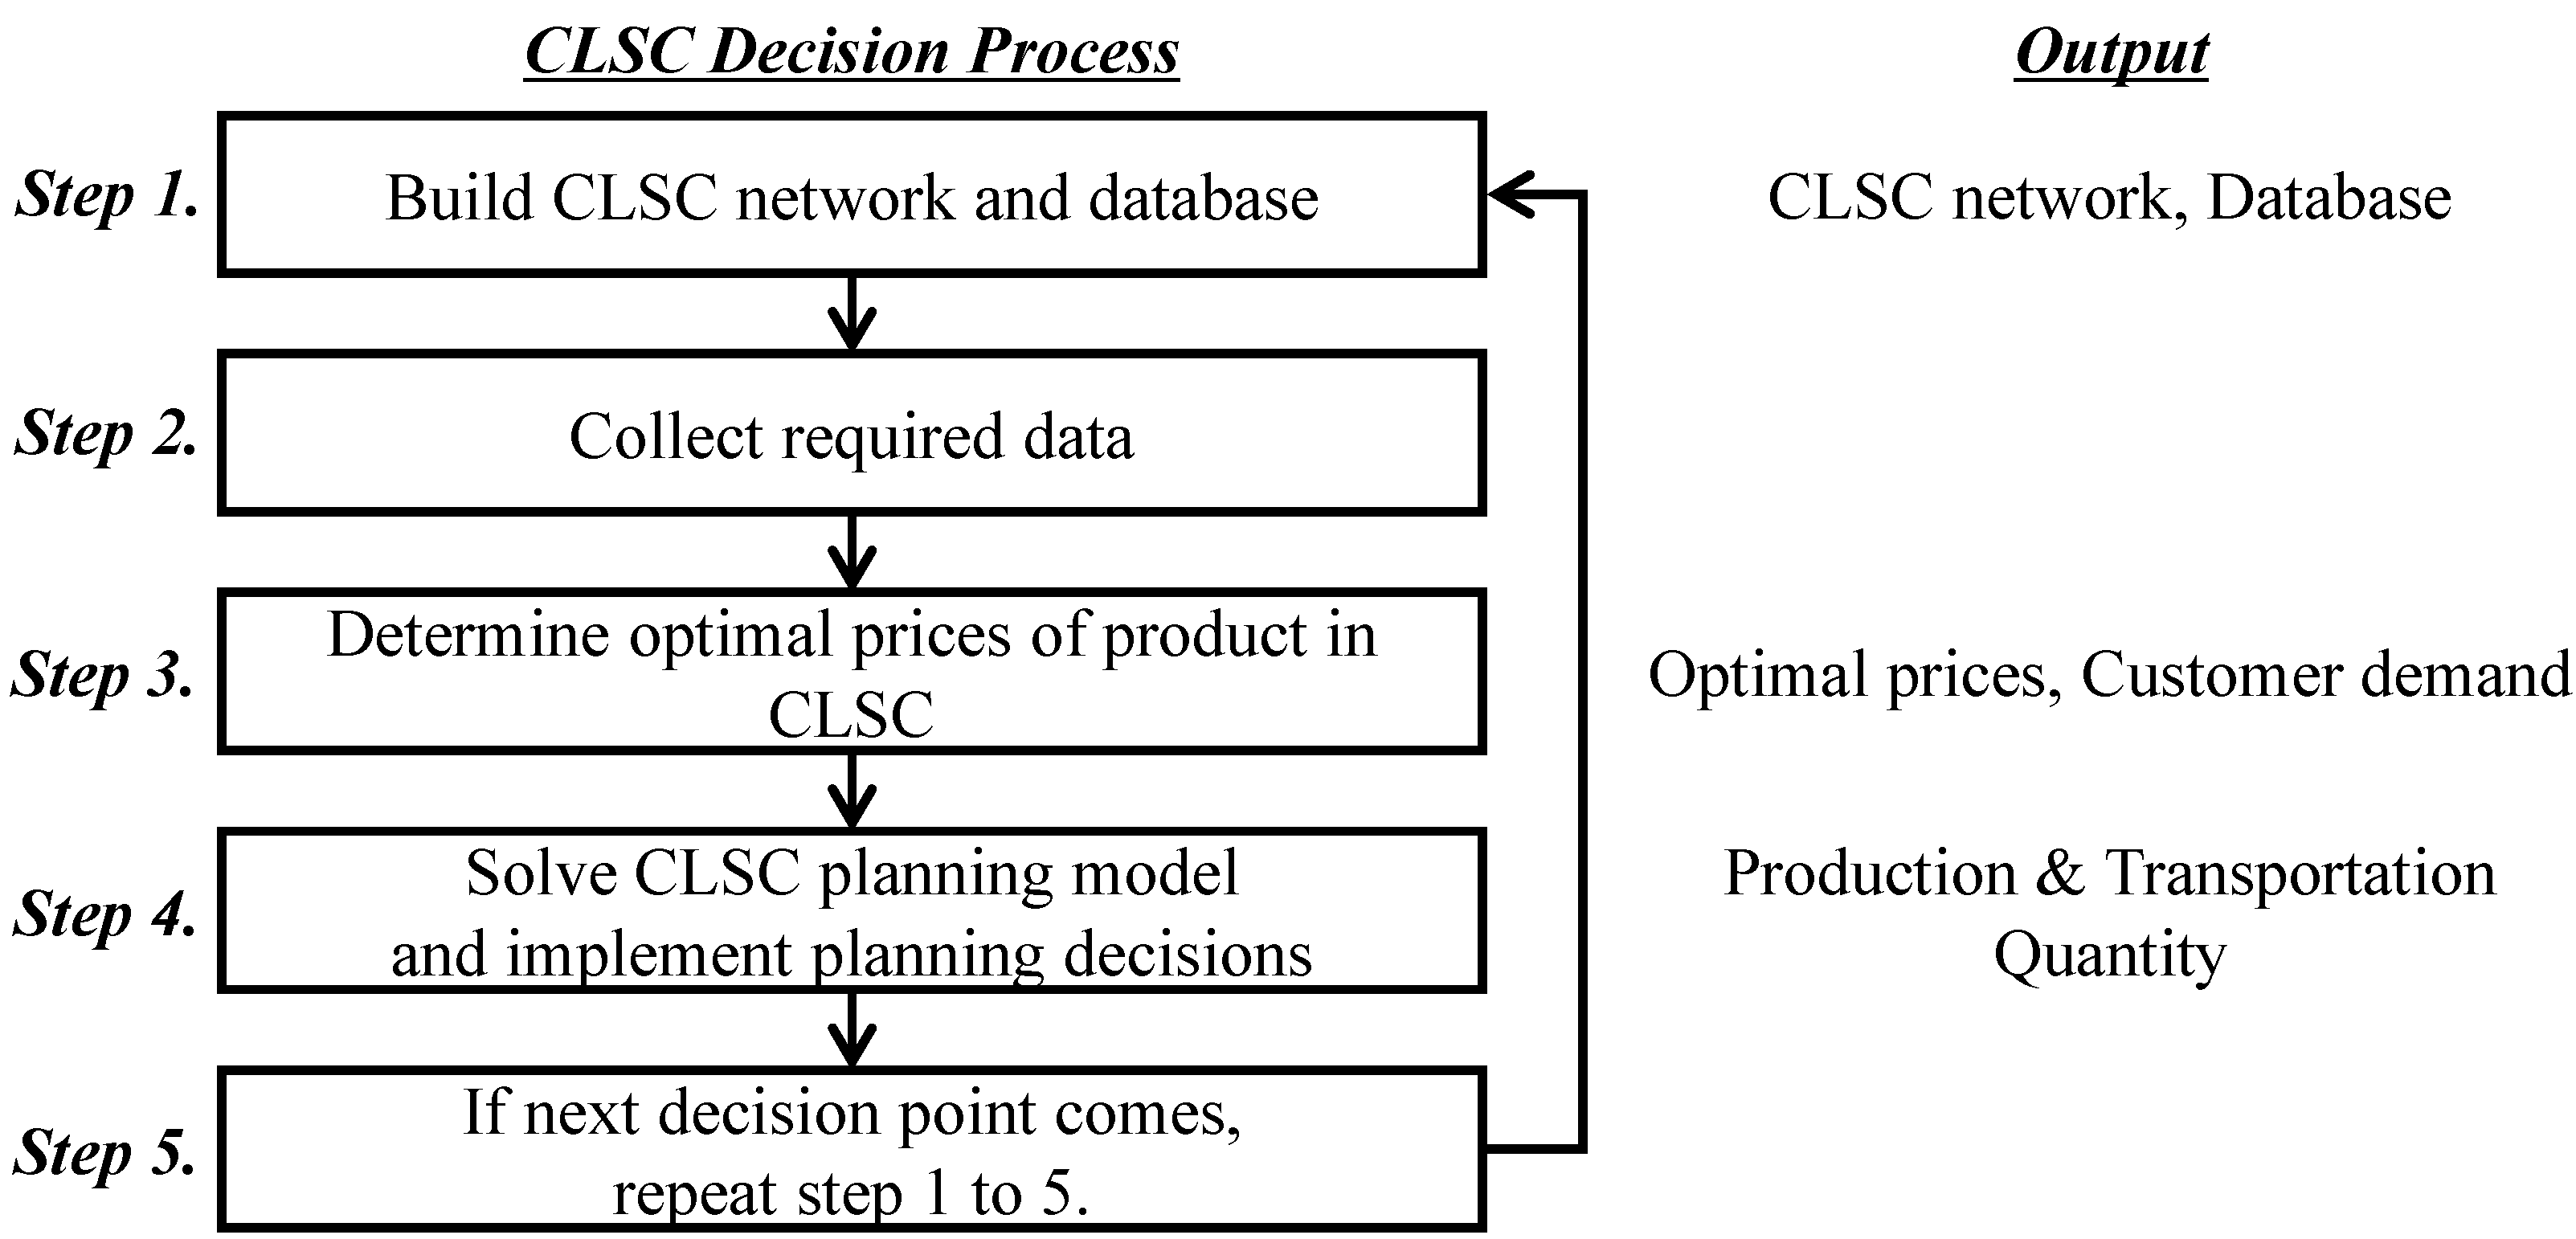
2.4. Overview of CLSC Decision Process
3. Profit Analysis in CLSC
3.1. Assumptions and Notations
- (A1)
- All costs incurred in CLSC fall into three categories: production cost, material cost and transportation cost. Production cost includes labor and operation cost. Transportation costs are paid by the receiver.
- (A2)
- Each member in CLSC pursues maximizing its own profit and tries to minimize the environmental damages as well.
- (A3)
- We consider five members of CLSC including raw material supplier, yarn, fabric, and apparel manufacturer, and collector.
- (A4)
- Regarding bill-of-materials (BOM) structure, one unit of apparel product consumes a units of fabric and b units of yarn products. Then one unit of fabric requires b/a units of yarn product.
- (A5)
- The linear demand function is given as D(A) = Φ−β∙A and Φ > β∙A, A is the selling price of product, Φ is primary demand (also called “base demand”) when selling price is 0, and β is price-demand sensitivity coefficient [3,44,45], i.e., the ratio of demand change to price change. Since the linear demand function reflects the behavior of market where the demand increases (decreases) as the price decreases (increases), β is interpreted as the ratio of increased (decreased) amount of demand to decreased (increased) amount of price so that the β value is always positive.
- (A6)
- CO2 emission is proportional to production and transportation volume.
3.2. Profit Analysis
3.2.1. Profit Analysis for Recycling CLSC
3.2.1.1. Apparel Manufacturer
3.2.1.2. Fabric Manufacturer
3.2.1.3. Yarn Manufacturer
3.2.1.4. Recycler
3.2.1.5. Sequence of Finding Optimal Prices
3.2.2. Profit Analysis for Remanufacturing CLSC
3.2.2.1. Apparel Manufacturer
3.2.2.2. Fabric Manufacturer
3.2.2.3. Yarn Manufacturer
3.2.2.4. Remanufacturer
3.2.3. Profit Analysis for Repair CLSC
3.2.3.1. Apparel Manufacturer
3.2.3.2. Fabric Manufacturer
3.2.3.3. Yarn Manufacturer
3.2.3.4. Repairer
3.2.4. Profit Analysis of Model G: Generalized CLSC

3.2.4.1. Apparel Manufacturer
3.2.4.2. Fabric Manufacturer
3.2.4.3. Yarn Manufacturer
3.2.4.4. Recycler
3.2.4.5. Remanufacturer
3.2.4.6. Repairer
4. CLSC Planning Model
5. Experimental Analysis
5.1. Data Preparation
| Apparel manufacturer | PCk(₩/unit) | Invk(M₩) | PEk(kgCO2/unit) | REk(tCO2) |
|---|---|---|---|---|
| k = 1 | 1200 | 22.0 | 928 | 2200 |
| k = 2 | 1400 | 23.5 | 916 | 2350 |
| k = 3 | 1600 | 20.9 | 904 | 2090 |
| k = 4 | 2000 | 24.3 | 880 | 2430 |
| Fabric manufacturer | PCj(₩/unit) | Invj(M₩) | PEj(kgCO2/unit) | REj(tCO2) |
| j = 1 | 220 | 16.2 | 786.8 | 1620 |
| j = 2 | 200 | 11.0 | 788.0 | 1100 |
| j = 3 | 180 | 14.0 | 789.2 | 1400 |
| j = 4 | 160 | 19.0 | 790.4 | 1900 |
| Yarn manufacturer | PCi(₩/unit) | Invi(M₩) | PEi(kgCO2/unit) | REi(tCO2) |
| i = 1 | 43 | 12.5 | 597.42 | 1250 |
| i = 2 | 26 | 18.0 | 598.44 | 1800 |
| i = 3 | 38 | 19.0 | 597.72 | 1900 |
| i = 4 | 43 | 17.0 | 597.42 | 1700 |
| Recycler | PCc(₩/unit) | RCc(₩/unit) | Invc(M₩) | PEi(kgCO2/unit) | REc(tCO2) |
|---|---|---|---|---|---|
| c = 1 | 950 | 1050 | 4.5 | 343 | 450 |
| c = 2 | 450 | 1200 | 4.2 | 373 | 420 |
| Remanufacturer | PCm(₩/unit) | RCm(₩/unit) | Invm(M₩) | PEi(kgCO2/unit) | REm(tCO2) |
| m = 1 | 765 | 680 | 7.8 | 354.1 | 780 |
| m = 2 | 740 | 950 | 8.9 | 355.6 | 890 |
| Repairer | PCp(₩/unit) | RCp(₩/unit) | Invp(M₩) | PEi(kgCO2/unit) | REp(tCO2) |
| p = 1 | 340 | 930 | 4.2 | 379.6 | 420 |
| p = 2 | 380 | 800 | 3.6 | 377.2 | 360 |
| Tjk (₩/unit) | k = 1 | k = 2 | k = 3 | k = 4 | TEjk (kgCO2/unit) | k = 1 | k = 2 | k = 3 | k = 4 |
|---|---|---|---|---|---|---|---|---|---|
| j = 1 | 7550 | 7700 | 3750 | 8320 | j = 1 | 367.50 | 345.00 | 937.50 | 252.00 |
| j = 2 | 7700 | 7500 | 3820 | 8300 | j = 2 | 345.00 | 375.00 | 927.00 | 255.00 |
| j = 3 | 7450 | 7600 | 3830 | 8310 | j = 3 | 382.50 | 360.00 | 925.50 | 253.50 |
| j = 4 | 7300 | 7600 | 3800 | 8270 | j = 4 | 405.00 | 360.00 | 930.00 | 259.50 |
| Tpk | k = 1 | k = 2 | k = 3 | k = 4 | TEpk | k = 1 | k = 2 | k = 3 | k = 4 |
| p = 1 | 2780 | 2300 | 3300 | 4040 | p = 1 | 1083.00 | 1155.00 | 1005.00 | 894.00 |
| p = 2 | 2620 | 2342 | 3500 | 3960 | p = 2 | 1107.00 | 1148.70 | 975.00 | 906.00 |
| Tij | j = 1 | j = 2 | j = 3 | j = 4 | TEij | j = 1 | j = 2 | j = 3 | j = 4 |
| i = 1 | 2100 | 2250 | 2160 | 1800 | i = 1 | 685.00 | 662.50 | 676.00 | 730.00 |
| i = 2 | 1700 | 2300 | 2165 | 1830 | i = 2 | 745.00 | 655.00 | 675.25 | 725.50 |
| i = 3 | 2000 | 2150 | 2190 | 1840 | i = 3 | 700.00 | 677.50 | 671.50 | 724.00 |
| i = 4 | 1800 | 2100 | 2185 | 1870 | i = 4 | 730.00 | 685.00 | 672.25 | 719.50 |
| Tmj | j = 1 | j = 2 | j = 3 | j = 4 | TEmj | j = 1 | j = 2 | j = 3 | j = 4 |
| m = 1 | 1400 | 4000 | 2105 | 1500 | m = 1 | 790.00 | 400.00 | 684.25 | 775.00 |
| m = 2 | 1460 | 4300 | 2095 | 1700 | m = 2 | 781.00 | 355.00 | 685.75 | 745.00 |
| Tri | i = 1 | i = 2 | i = 3 | i = 4 | TEri | i = 1 | i = 2 | i = 3 | i = 4 |
| r = 1 | 700 | 640 | 880 | 170 | r = 1 | 695.00 | 704.00 | 668.00 | 774.50 |
| Tci | i = 1 | i = 2 | i = 3 | i = 4 | TEci | i = 1 | i = 2 | i = 3 | i = 4 |
| c = 1 | 920 | 540 | 590 | 200 | c = 1 | 662.00 | 719.00 | 711.50 | 770.00 |
| c = 2 | 760 | 600 | 710 | 190 | c = 2 | 686.00 | 710.00 | 693.50 | 771.50 |
| Apparel MF | Optimal price (₩) | Fabric MF | Optimal price (₩) | Yarn MF | Optimal price (₩) |
|---|---|---|---|---|---|
| k = 1 | 344,107 | j = 1 | 305,393 | i = 1 | 226,324 |
| k = 2 | 344,233 | j = 2 | 305,654 | i = 2 | 226,275 |
| k = 3 | 342,677 | j = 3 | 305,531 | i = 3 | 226,393 |
| k = 4 | 344,932 | j = 4 | 305,343 | i = 4 | 226,053 |
| Repairer | Optimal price (₩) | Re-manufacturer | Optimal price (₩) | Recycler | Optimal price (₩) |
| p = 1 | 50,635 | m=1 | 50,723 | c=1 | 51,000 |
| p = 2 | 50,590 | m=2 | 50,845 | c=2 | 50,825 |
5.2. Numerical Results
| Apparel manufacturer | Production Quantity | Fabric manufacturer | Production Quantity | Yarn manufacturer | Production Quantity |
|---|---|---|---|---|---|
| k = 1 | 1118 | j = 1 | 1076 | i = 1 | 1358 |
| k = 2 | 1115 | j = 2 | 752 | i = 2 | 1450 |
| k = 3 | 1146 | j = 3 | 953 | i = 3 | 777 |
| k = 4 | 1101 | j = 4 | 1252 | i = 4 | 0 |
| Repairer | Production Quantity | Remanufacturer | Production Quantity | Recycler | Production Quantity |
| p = 1 | 0 | m = 1 | 448 | c = 1 | 0 |
| p = 2 | 448 | m = 2 | 0 | c = 2 | 448 |
| FQjk | k = 1 | k = 2 | k = 3 | k = 4 | YQij | j = 1 | j = 2 | j = 3 | j = 4 |
|---|---|---|---|---|---|---|---|---|---|
| j = 1 | 0 | 0 | 1076 | 0 | i = 1 | 496 | 0 | 505 | 357 |
| j = 2 | 0 | 667 | 70 | 15 | i = 2 | 580 | 0 | 0 | 870 |
| j = 3 | 0 | 0 | 0 | 953 | i = 3 | 0 | 751 | 0 | 26 |
| j = 4 | 1118 | 0 | 0 | 134 | i = 4 | 0 | 0 | 0 | 0 |
| PQpk | k = 1 | k = 2 | k = 3 | k = 4 | MQmj | j = 1 | j = 2 | j = 3 | j = 4 |
| p = 1 | 0 | 0 | 0 | 0 | m = 1 | 0 | 0 | 448 | 0 |
| p = 2 | 0 | 448 | 0 | 0 | m = 2 | 0 | 0 | 0 | 0 |
| rQri | i = 1 | i = 2 | i = 3 | i = 4 | CQci | i = 1 | i = 2 | i = 3 | i = 4 |
| r = 1 | 910 | 1450 | 777 | 0 | c = 1 | 0 | 0 | 0 | 0 |
| c = 2 | 448 | 0 | 0 | 0 |
5.3. Sensitivity Analyses
5.3.1. Production Cost

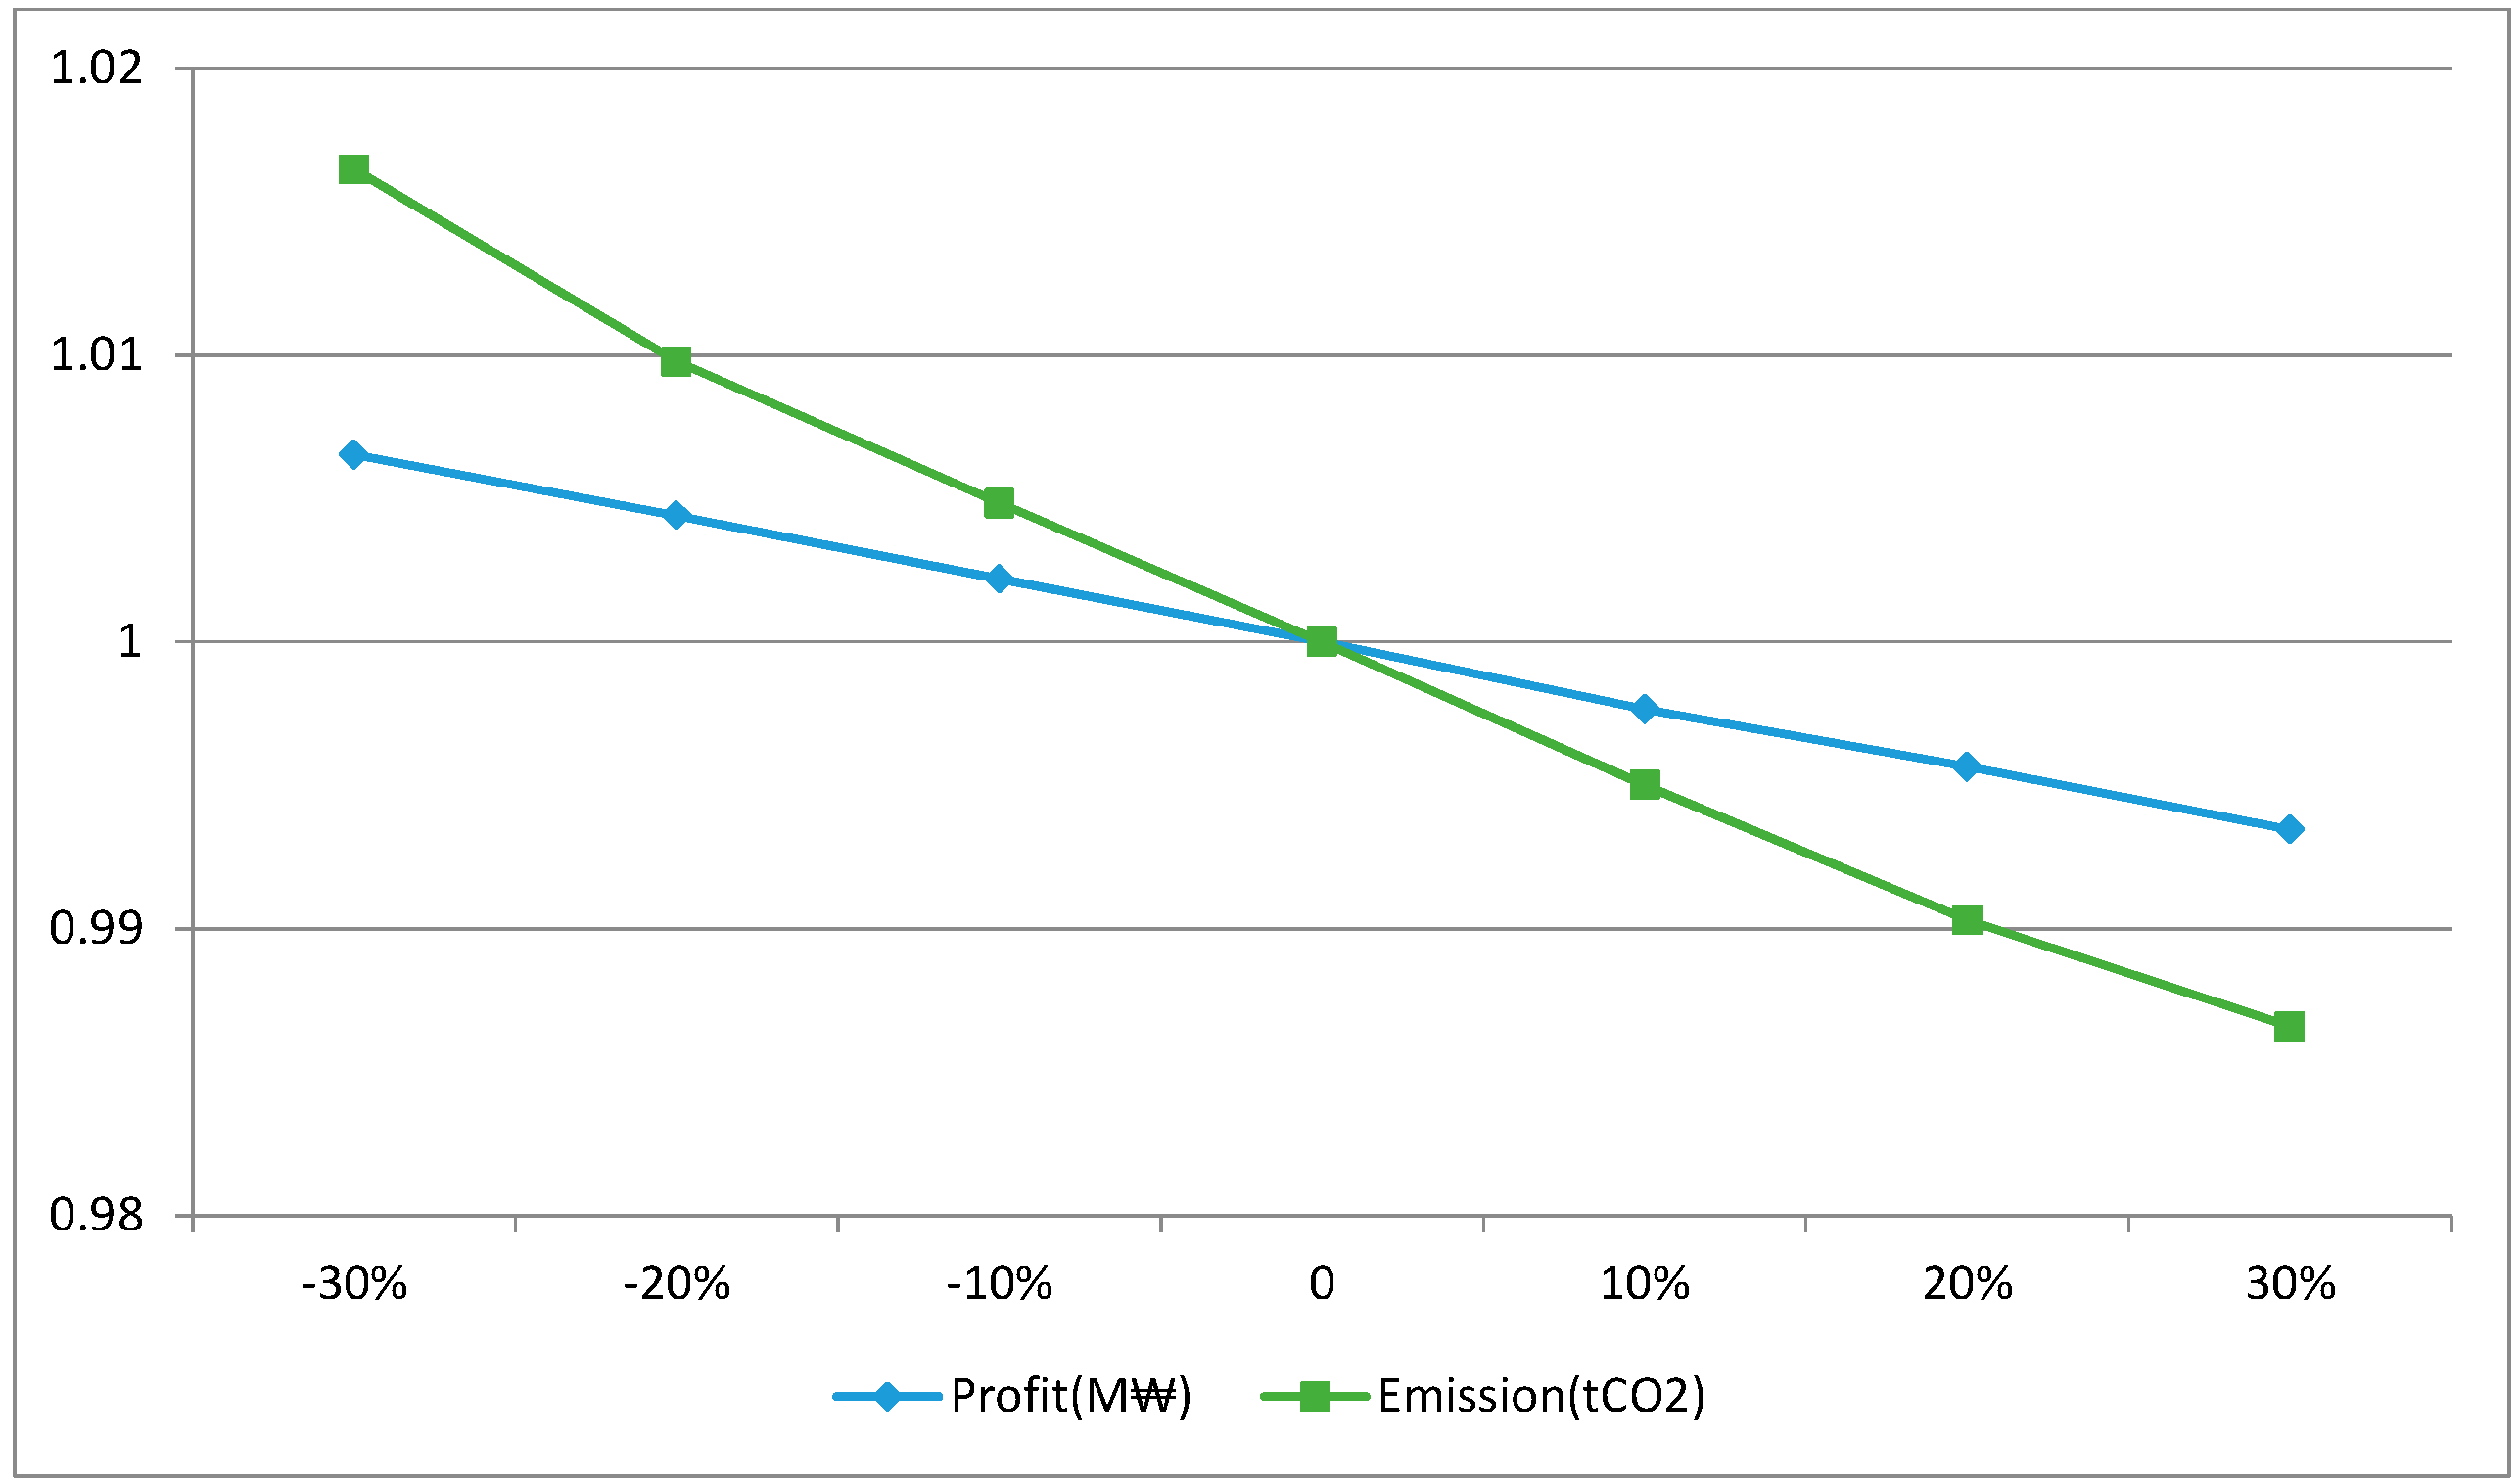
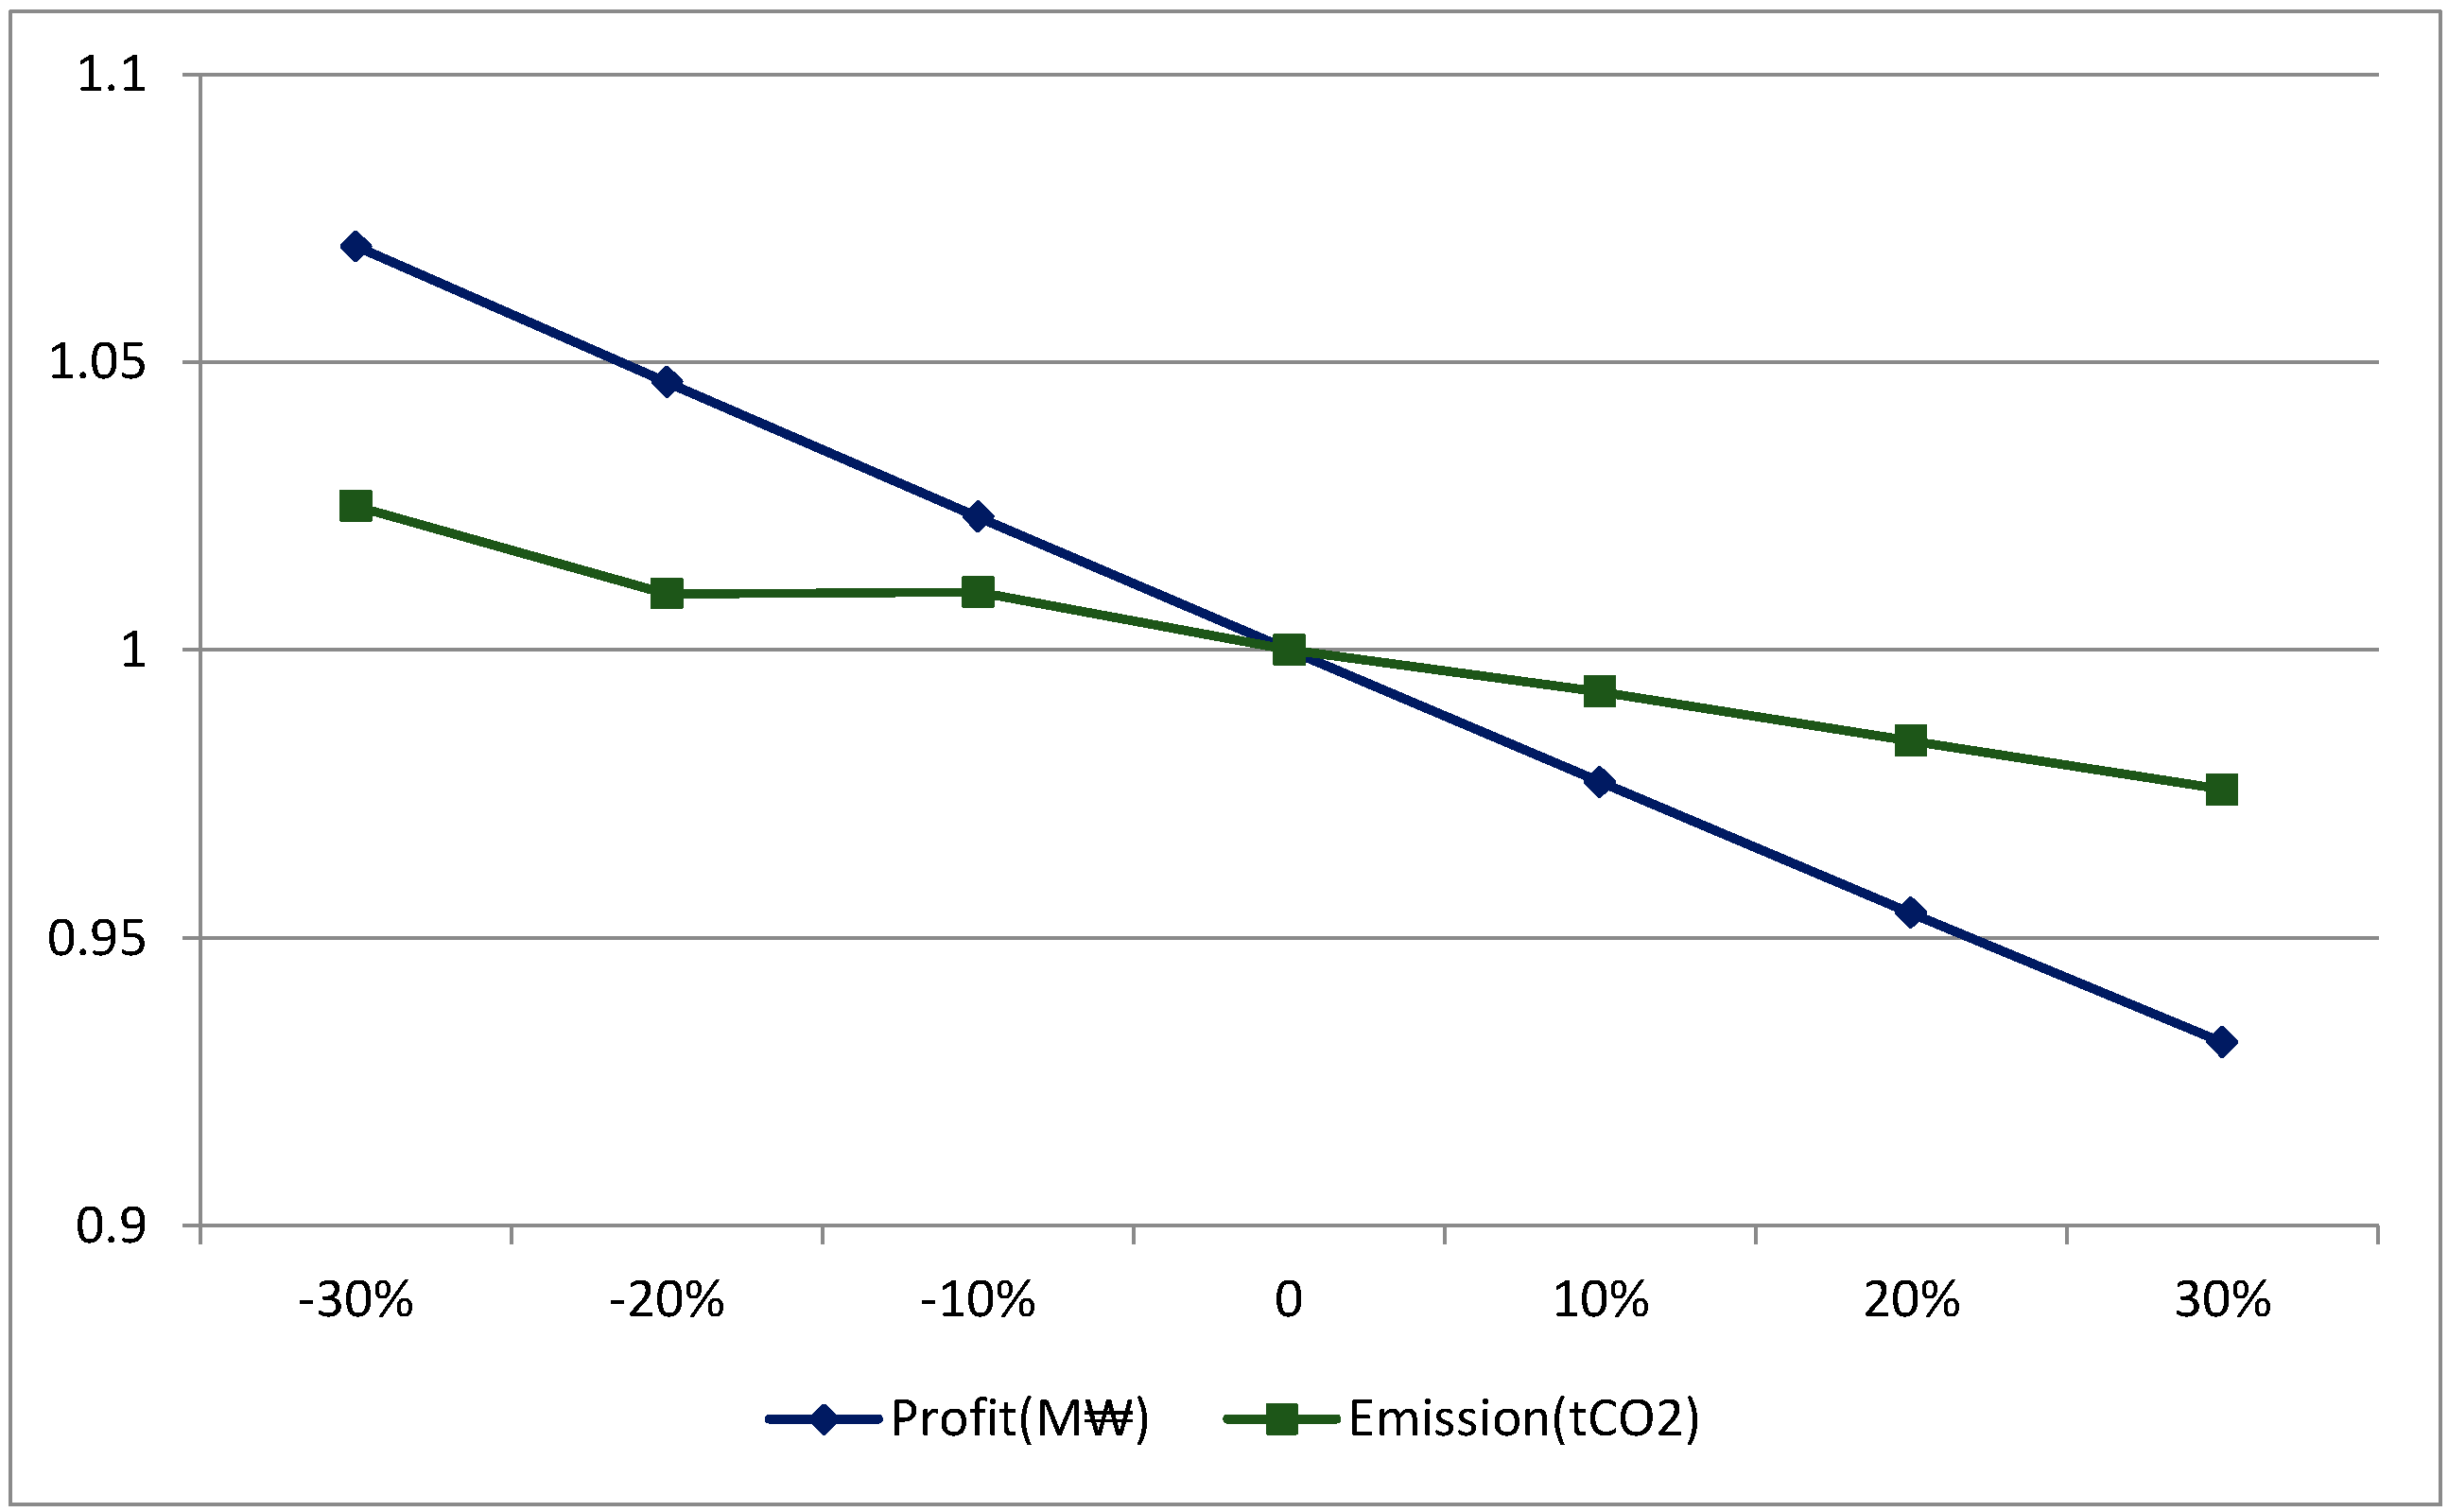
5.3.2. Raw Material Cost
5.3.3. Recovery Options
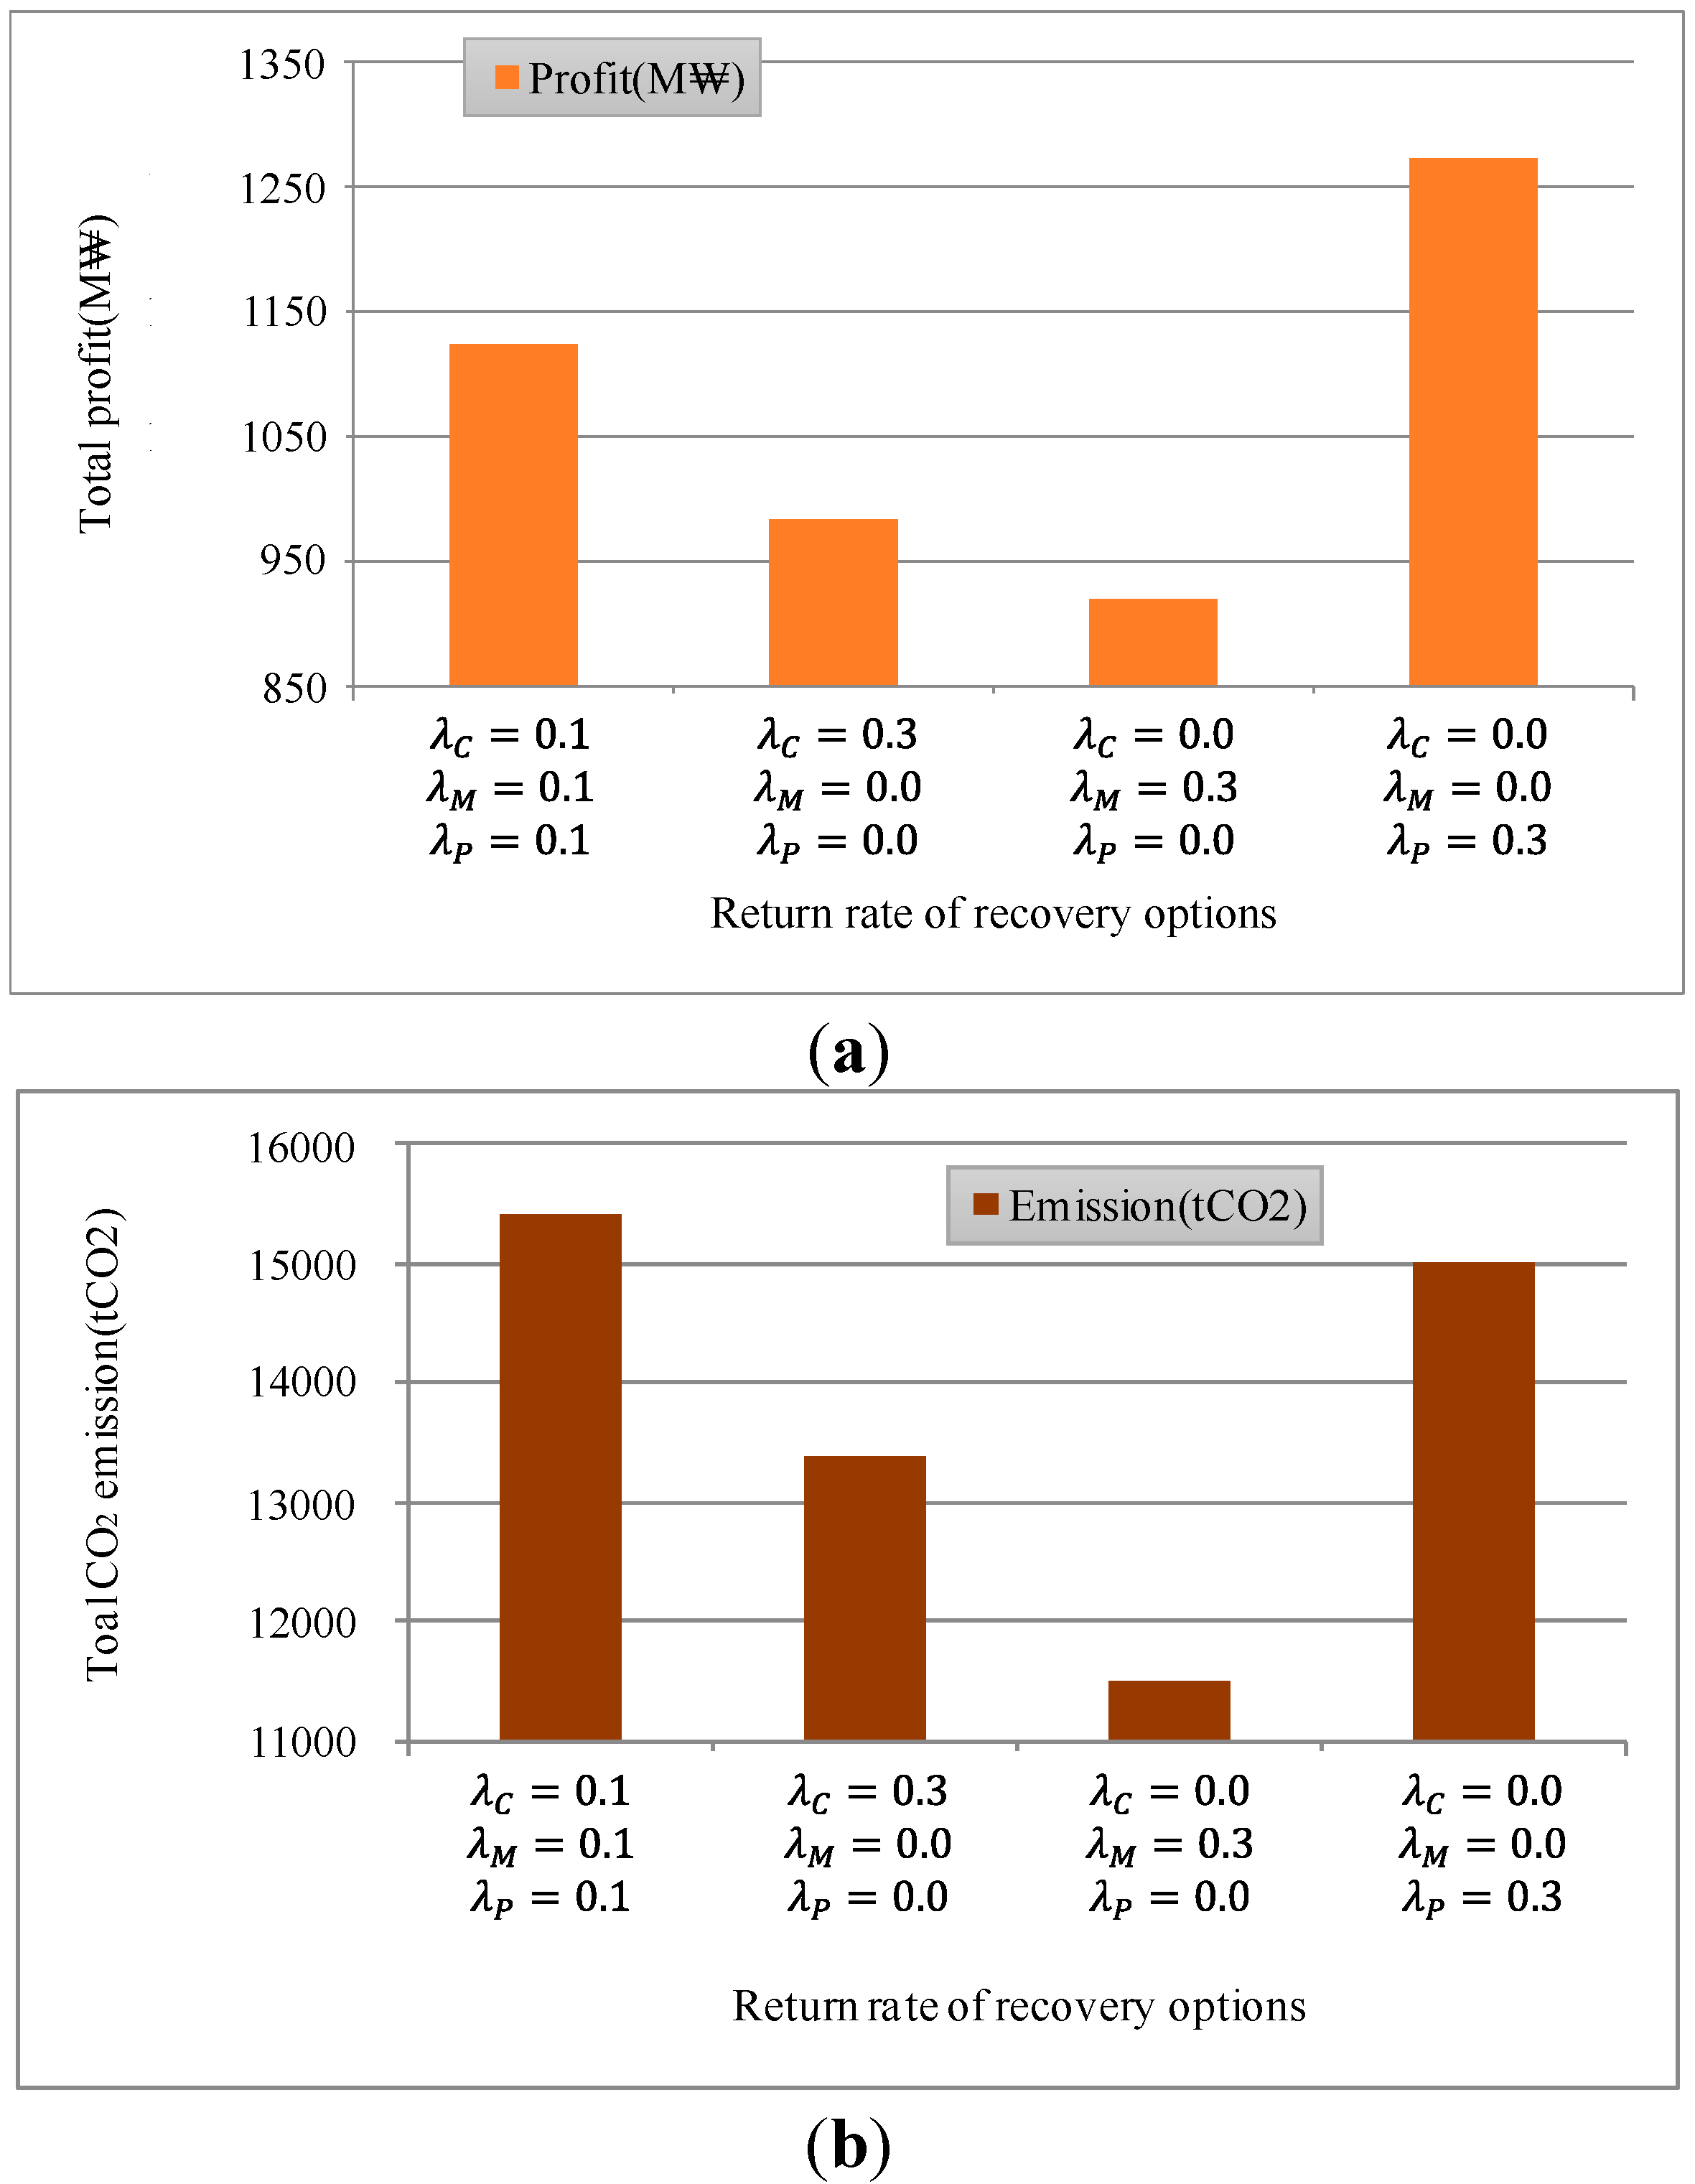
| Strategy (λC, λM, λP) | CO2 Emission Per Profit (t CO2/M₩) |
|---|---|
| (0.1, 0.1, 0.1) | 13.7113 |
| (0.3, 0.0, 0.0) | 13.6050 |
| (0.0, 0.3, 0.0) | 12.5256 |
| (0.0, 0.0, 0.3) | 11.7921 |
5.3.4. Weight of Objective Functions
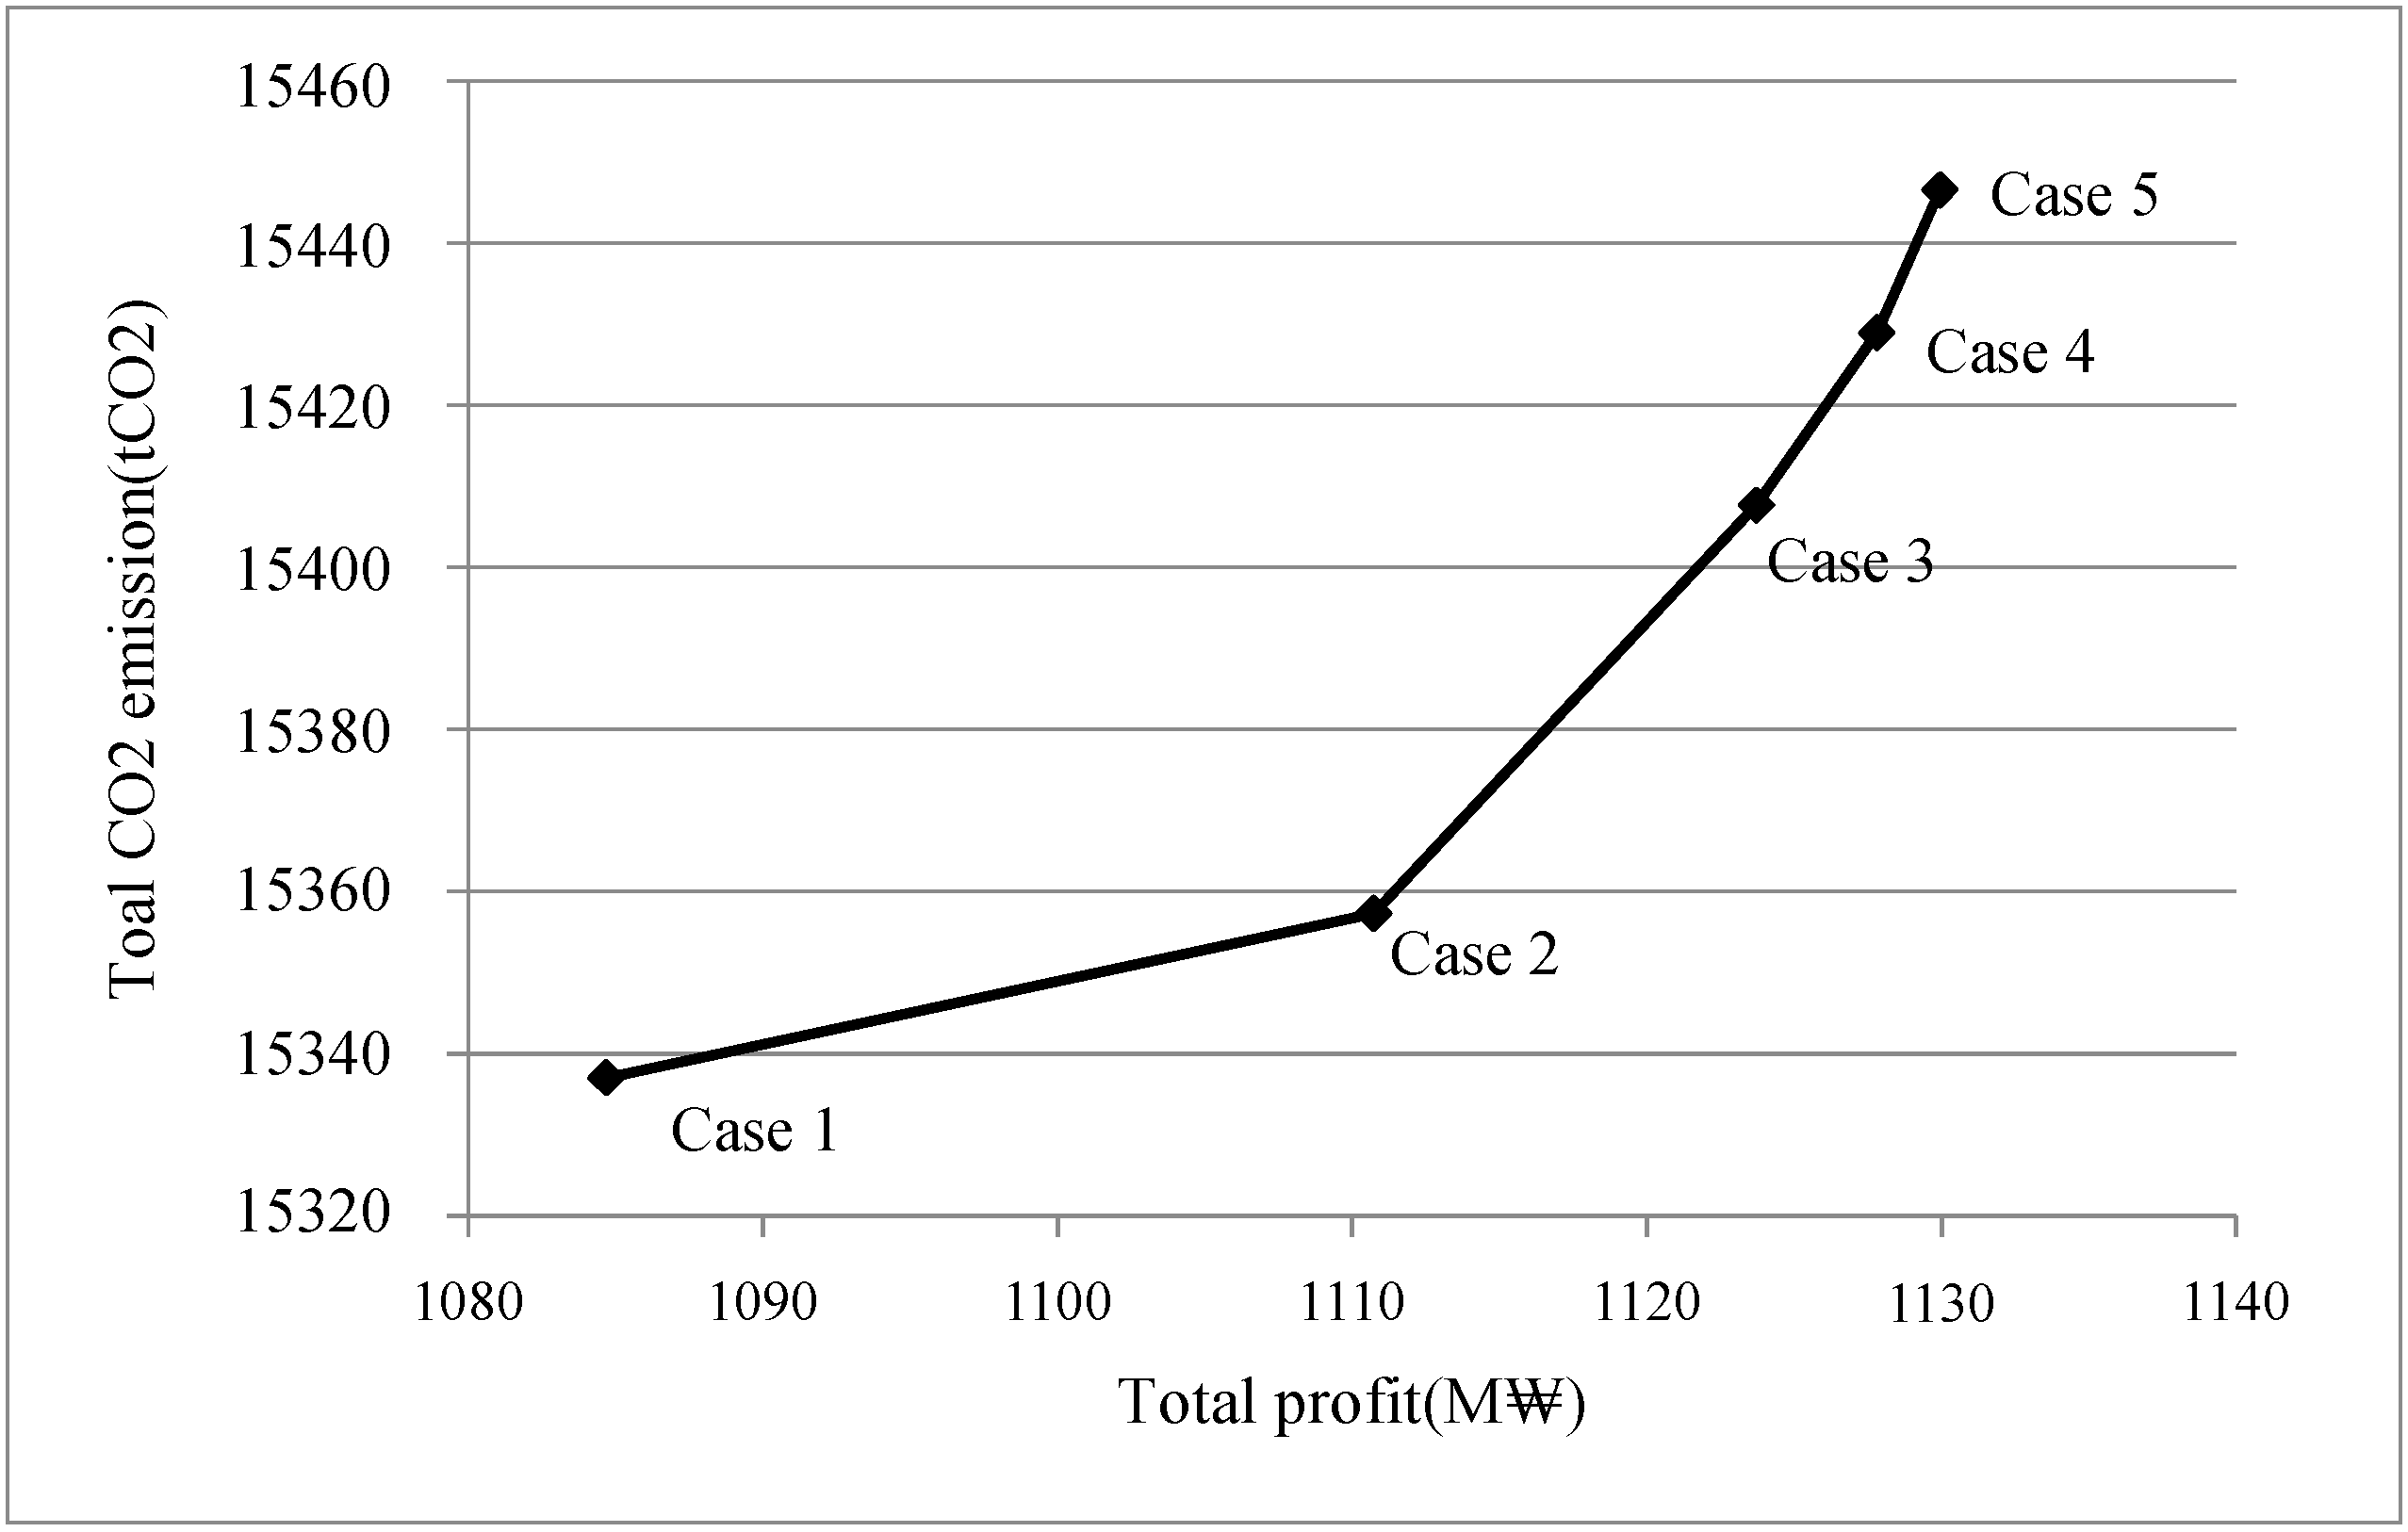
| (w1, w2) | (0,1) | (0.25, 0.75) | (0.5, 0.5) | (0.75, 0.25) | (1, 0) |
|---|---|---|---|---|---|
| Emission(t CO2) | 15337.00 | 15357.30 | 15407.69 | 15428.98 | 15446.60 |
| Profit(M₩) | 1084.70 | 1110.72 | 1123.72 | 1127.81 | 1129.94 |
| Emission/Profit | 14.14 | 13.83 | 13.71 | 13.68 | 13.67 |
6. Conclusions and Future Research
- Regarding trade-off between profit and emission, with our data set, the most profitable strategy also provides the best environmental efficiency in terms of tCO2/M₩. Even though this particular case may not be generalized, we see that technological innovation can make the CLSC more profitable in exchange for the smaller increase rate of CO2 emission.
- In the results, CO2 emission is less sensitive to raw material cost than CLSC profit is. Also, raw material cost gives the larger effects on both profit and CO2 emission than production cost does. This implies that the choice of cost drivers may bring significant results to profit and emission in different way.
- Proper combination of recovery options can make significant improvements on CLSC performances. This also implies that different objectives of CLSC require different combination of recovery options.
- Regarding the weights in the objective function of planning model, it is obvious that the choice of weights significantly affects CLSC performances. However, it should be note that proper choice of weights is extremely difficult because the resultant performances are more than just computing numbers and they may bring up different interpretations and implications. Instead, using the model, Pareto optimal weight sets are visibly obtained on the efficient-frontier curve of profit and CO2 emission.
Acknowledgments
Author Contributions
Notation
Indices
Index of yarn manufacturer (i = 1, 2, 3, …, I) | |
Index of fabric manufacturer (j = 1, 2, 3, …, J) | |
Index of apparel manufacturer (k = 1, 2, 3, …, K) | |
Index of recycler (c = 1, 2, 3, …, C) | |
Index of remanufacturer (m=1, 2, 3, …, M) | |
Index of repairer (p = 1, 2, 3, …, P) | |
Index of raw material supplier (r = 1) | |
Index of demand zone(d = 1) | |
Index of time period (t = 1, 2, 3, …, T) |
Decision variables (for profit analysis model) & Parameters (for CLSC planning model)
Selling price of apparel manufacturer k in period t | |
Selling price of fabric manufacturer j in period t | |
Selling price of yarn manufacturer i in period t | |
Selling price of recycler c in period t | |
Selling price of remanufacturer m in period t | |
Selling price of repairer p in period t |
Decision variables (for CLSC planning model)
Transportation quantity from yarn manufacturer i to fabric manufacturer j in period t | |
Transportation quantity from fabric manufacturer j to apparel manufacturer k in period t | |
Transportation quantity from apparel manufacturer k to demand zone d in period t | |
Transportation quantity from recycler c to yarn manufacturer I in period t | |
Transportation quantity from remanufacturer m to fabric manufacturer j in period t | |
Transportation quantity from repairer p to apparel manufacturer k in period t | |
Transportation quantity from raw material supplier r to yarn manufacturer i in period t | |
Inventory quantity for manufacturer i, j, k, c, m, p in period t | |
1: if production occurs at i(j, k, c, m p) in period t 0: otherwise |
Parameters
Market share ratio for manufacturer i, j, k, c, m, p in period t | |
Primary demand of each member (apparel, fabric, yarn, recycler, remanufacturer, repairer) in period t | |
Price-demand sensitivity coefficient of each member (apparel, fabric, yarn, recycler, remanufacturer, repairer) in period t | |
Demand quantity each member (apparel, fabric, yarn, recycler, remanufacturer, repairer, customer) in period t | |
Set of all connected manufacturer | |
Production and operation cost per unit for manufacturer i, j, k, c, m, p in period t () | |
Collection cost per unit for each recovery manufacturer c, m, or p in period t | |
Raw material cost per unit from r raw material supplier to i manufacturer in period t | |
Labor cost per unit for manufacturer i, j, k in period t | |
Operation cost per unit for manufacturer i, j, k, c, m, p in period t | |
Transportation cost per unit from r to i, i to j, j to k, c to i, m to j, p to k, k to d in period t | |
Investment cost per CO2 ton for CERs(Certified Emission Reductions) for manufacturer i, j, k, c, m, p in period t | |
Return ratio for each recovery type (recycle, remanufacturing, repair) in period t | |
Holding cost per unit for manufacturer i, j, k, c, m, p in period t | |
CO2 emission of production per unit for manufacturer i, j, k, c, m, p in period t | |
CO2 emission of transportation per unit from r to i, i to j, j to k, c to i, m to j, p to k in period t | |
Production capacity for manufacturer i, j, k, c, m, p in period t | |
Upper bound (restriction) for CO2 emission for manufacturer i, j, k, c, m, p in period t |
Conflicts of Interest
References
- World Commission on Environment and Development (WCED). Our Common Future; Oxford University Press: New York, NY, USA, 1987. [Google Scholar]
- Tonelli, F.; Evans, S.; Taticchi, P. Industrial sustainability: Challenges, perspectives, actions. Int. J. Bus. Innov. Res. 2013, 7, 143–163. [Google Scholar] [CrossRef]
- Savaskan, R.C.; Bhattacharya, S.; Wassenhove, L.N. Closed-loop supply chain models with product remanufacturing. Manag. Sci. 2004, 50, 239–252. [Google Scholar] [CrossRef]
- Taticchi, P.; Tonelli, F.; Pasqualino, R. Performance measurement of sustainable supply chains: A literature review and a research agenda. Int. J. Prod. Perform. Manag. 2013, 62, 782–804. [Google Scholar] [CrossRef]
- Kim, K.; Jeong, B.; Jung, H. Supply chain surplus: Comparing conventional and sustainable supply chains. Flex. Serv. Manuf. J. 2014, 26, 5–23. [Google Scholar] [CrossRef]
- De Brito, M.P.; van der Laan, E.A. Supply chain management and sustainability: Procrastinating integration in mainstream research. Sustainability 2010, 2, 859–870. [Google Scholar]
- Nagurney, A.; Yu, M. Sustainable fashion supply chain management under oligopolistic competition and brand differentiation. Int. J. Prod. Econ. 2012, 135, 532–540. [Google Scholar] [CrossRef]
- Caniato, F.; Caridi, M.; Crippa, L.; Moretto, A. Environmental sustainability in fashion supply chains: An exploratory case based research. Int. J. Prod. Econ. 2012, 135, 659–670. [Google Scholar] [CrossRef]
- Guide, V.D.R., Jr.; Jayaraman, V.; Srivastava, R.; Benton, W.C. Supply chain management for recoverable manufacturing systems. Interfaces 2000, 30, 125–142. [Google Scholar] [CrossRef]
- Guide, V.D.R., Jr.; van Wassenhove, L.N. The Evolution of Closed-Loop Supply Chain Research. Oper. Res. 2009, 57, 10–18. [Google Scholar] [CrossRef]
- Fleischmann, M.; Bloemhof-Ruwarrd, J.M.; Dekker, R.; der Lann, E.; Nunen, J.A.E.E.; von Wassenhove, L.N. Quantitative models for reverse logistics: A review. Eur. J. Oper. Res. 1997, 103, 1–17. [Google Scholar] [CrossRef]
- Mutha, A.; Pokharel, S. Strategic network design for reverse logistics and remanufacturing using new and old product returns. Comput. Ind. Eng. 2009, 56, 334–346. [Google Scholar] [CrossRef]
- Dat, Q.; Linh, D.T.T.; Chou, S.Y.; Yu, V.F. Optimizing reverse logistics costs for recycling end-of-life electrical and electronic products. Expert Syst. Appl. 2012, 39, 6380–6387. [Google Scholar] [CrossRef]
- Kusumastuti, R.D.; Piplani, R.; Lim, G.H. Redesigning closed-loop service network at a computer manufacturer: A case study. Int. J. Prod. Econ. 2008, 111, 244–260. [Google Scholar] [CrossRef]
- Lee, D.H.; Dong, M. A heuristic approach to logistics network design for end-of-lease computer products recovery. Transp. Res. E 2008, 44, 455–474. [Google Scholar] [CrossRef]
- Fleischmann, M.; Beullens, P.; Bloemhof-Ruwaard, J.M.; van Wassenhove, L.N. The impact of product recovery on logistics network design. Prod. Oper. Manag. 2001, 10, 156–173. [Google Scholar] [CrossRef]
- Sheu, J.B.; Chou, Y.H.; Hu, C.C. An integrated logistics operational model for green-supply chain management. Transp. Res. E 2005, 41, 287–313. [Google Scholar] [CrossRef]
- Kim, K.; Song, I.; Kim, J.; Jeong, B. Supply planning model for remanufacturing system in reverse logistics environment. Comput. Ind. Eng. 2006, 51, 279–287. [Google Scholar] [CrossRef]
- Amin, S.H.; Zhang, G.Q. A proposed mathematical model for closed-loop network configuration based on product life cycle. Int. J. Adv. Manuf. Technol. 2012, 58, 791–801. [Google Scholar] [CrossRef]
- Ostlin, J.; Sudin, E.; Bjorkman, M. Importance of closed-loop supply chain relationships for product remanufacturing. Int. J. Prod. Econ. 2008, 115, 336–348. [Google Scholar] [CrossRef]
- Akçali, E.; Çetinkaya, S. Review: Quantitiative models for inventory and production planning in closed-loop supply chain. Int. J. Prod. Res. 2011, 49, 2373–2407. [Google Scholar] [CrossRef]
- Jayaraman, V. Production planning for closed-loop supply chains with product recovery and reuse: An analytical approach. Int. J. Prod. Res. 2006, 44, 981–998. [Google Scholar] [CrossRef]
- Lee, J.; Gen, M.; Rhee, K. Network model and optimization of reverse logistics by hybrid genetic algorithm. Comput. Ind. Eng. 2009, 56, 951–964. [Google Scholar] [CrossRef]
- Pishvaee, M.S.; Torabi, S.A. A possibilistic programming approach for closed-loop supply chain network design under uncertainty. Fuzzy Sets Syst. 2010, 161, 2668–2683. [Google Scholar] [CrossRef]
- Shi, J.; Zhang, G.; Sha, J. Optimal production planning for a multi-product closed loop system with uncertain demand and return. Comput. Ind. Eng. 2011, 38, 641–650. [Google Scholar]
- Zhou, Y.S.; Wang, S.Y. Generic model of reverse logistics network design. J. Transp. Syst. Eng. Inf. Technol. 2008, 8, 71–78. [Google Scholar]
- Shih, L. Reverse logistics system planning for recycling electrical appliances and computers in Taiwan. Resou. Conserv. Recycl. 2001, 32, 55–72. [Google Scholar] [CrossRef]
- Qu, X.; Williams, J.A.S. An analytical model for reverse automotive production planning and pricing. Eur. J. Oper. Res. 2008, 190, 756–767. [Google Scholar] [CrossRef]
- Üster, H.; Easwaran, G.; Akçali, E.; Çetinkaya, S. Benders decomposition with alternative multiple cuts for a multi-product closed-loop supply chain network design model. Naval Res. Logist. 2007, 54, 890–907. [Google Scholar] [CrossRef]
- Zhou, F. Study on the implementation of green supply chain management in textile enterprises. J. Sustain. Dev. 2009, 2, 75–79. [Google Scholar]
- De Brito, M.P.; Carbone, V.; Blanquart, C.M. Towards a sustainable fashion retail supply chain in Europe: Organisation and performance. Int. J. Prod. Econ. 2008, 114, 534–553. [Google Scholar] [CrossRef]
- Baskaran, V.; Nachiappan, S.; Rahman, S. Indian textile suppliers’ sustainability evaluation using the grey approach. Int. J. Prod. Econ. 2012, 135, 647–658. [Google Scholar] [CrossRef]
- Allwood, J.M.; Laursen, S.E.; Russell, S.N.; de Rodríguez, C.M.; Bocken, N.M.P. An approach to scenario analysis of the sustainability of an industrial sector applied to clothing and textiles in the UK. J. Clean. Prod. 2008, 16, 1234–1246. [Google Scholar] [CrossRef]
- Wu, G.C.; Ding, J.H.; Chen, P.S. The effects of GSCM drivers and institutional pressures on GSCM practices in Taiwan’s textile and apparel industry. Int. J. Prod. Econ. 2012, 135, 618–636. [Google Scholar] [CrossRef]
- Velavan, R.; Rudramoorthy, R.; Balachandran, S. Emission reduction opportunities for small and medium scale textile sector in India. J. Sci. Ind. Res. 2009, 68, 630–633. [Google Scholar]
- Lin, B.; Moubarak, M. Mitigation potential of carbon dioxide emissions in the Chinese textile industry. Appl. Energy 2014, 113, 781–787. [Google Scholar] [CrossRef]
- Abraham, N. The apparel aftermarket in India—A case study focusing on reverse logistics. J. Fash. Market. Manag. 2011, 15, 211–227. [Google Scholar]
- Hansen, K.T. Dealing with used clothing: Salaula and the construction of identity in Zambia’s Third Republic. Public Cult. 1994, 6, 503–523. [Google Scholar] [CrossRef]
- Bocken, N.M.P.; Short, S.W.; Rana, P.; Evans, S. A literature and practice review to develop sustainable business model archetypes. J. Clean. Prod. 2014, 65, 42–56. [Google Scholar] [CrossRef]
- Shen, B. Sustainable fashion supply chain: Lessons from H&M. Sustainability 2014, 6, 6236–6249. [Google Scholar] [CrossRef]
- Hu, Z.H.; Chen, X.J.; Wang, Y.F. Sustainable rent-based closed-loop supply chain for fashion products. Sustainability 2014, 6, 7063–7088. [Google Scholar] [CrossRef]
- Taticchi, P.; Garengo, P.; Nudurupati, S.S.; Tonelli, F.; Pasqualino, R. A review of decision-support tools and performance measurement and sustainable supply chain management. Int. J. Prod. Res. 2014. [Google Scholar] [CrossRef]
- Thierry, M.; Salomon, M.; Nunen, J.V.; Wassenhove, L.V. Strategic issues in product recovery management. Calif. Manag. Rev. 1995, 37, 114–135. [Google Scholar] [CrossRef]
- Choi, T.M.; Li, Y.; Xu, L. Channel leadership, performance and coordination in closed loop supply chains. Int. J. of Prod. Econ. 2013, 146, 371–380. [Google Scholar] [CrossRef]
- Liu, N.; Choi, T.M.; Yuen, M.C.W.; Ng, F. Optimal pricing, modularity and return policy under mass customization. IEEE Trans. Syst. Man Cybern. A 2012, 42, 604–614. [Google Scholar] [CrossRef]
- The South India Textile Research Association Coimbatore (SITRA). Online Survey of Raw Material Cost and Yarn Selling Price. Available online: http://rmcysp.sitraonline.org/12_Survey%20report.pdf (accessed on 21 April 2014).
- Barnes, L.; Lea-Greenwood, G. Fast fashioning the supply chain: Shaping the research agenda. J. Fash. Market. Manag. 2006, 10, 259–271. [Google Scholar]
- Haynes, S.; Jones, N. Fast fashion: A financial snapshot. J. Fash. Market. Manag. 2006, 10, 282–300. [Google Scholar]
© 2014 by the authors; licensee MDPI, Basel, Switzerland. This article is an open access article distributed under the terms and conditions of the Creative Commons Attribution license (http://creativecommons.org/licenses/by/4.0/).
Share and Cite
Oh, J.; Jeong, B. Profit Analysis and Supply Chain Planning Model for Closed-Loop Supply Chain in Fashion Industry. Sustainability 2014, 6, 9027-9056. https://doi.org/10.3390/su6129027
Oh J, Jeong B. Profit Analysis and Supply Chain Planning Model for Closed-Loop Supply Chain in Fashion Industry. Sustainability. 2014; 6(12):9027-9056. https://doi.org/10.3390/su6129027
Chicago/Turabian StyleOh, Jisoo, and Bongju Jeong. 2014. "Profit Analysis and Supply Chain Planning Model for Closed-Loop Supply Chain in Fashion Industry" Sustainability 6, no. 12: 9027-9056. https://doi.org/10.3390/su6129027
APA StyleOh, J., & Jeong, B. (2014). Profit Analysis and Supply Chain Planning Model for Closed-Loop Supply Chain in Fashion Industry. Sustainability, 6(12), 9027-9056. https://doi.org/10.3390/su6129027