1. Introduction
The rapid development of the economy has substantially increased energy demand and caused serious environmental problems in China [
1]. Two key issues accompany the development and are suggested as major concerns. One is congestion. A greater consumption of resources cannot necessarily produce more output. It creates a poor economic state when firms invest excessive input in production units. Cooper
et al. [
2] describe the situation thusly: “congestion is said to when the output that is maximally possible can be increased by reducing one or more inputs without improving any other inputs or outputs. Conversely, congestion may occur when some outputs are reduced by increasing one or more inputs without improving any other inputs or outputs.” Identifying and managing the factors which affect congestion is an intriguing aspect of the research in Data Envelopment Analysis (DEA). Many efforts have been made by researchers to explore whether congestion occurs and how its effects impose on productive and managerial practice. For example, Färe and Grosskopf [
3] propose a DEA framework to quantitatively analyze the congestion. Sueyoshi [
4] introduces the congestion issue in its dual equations and discusses the economic implications for production economics.
Another concern is the byproducts that accompany the consumption of energy. As a resource input, energy generates a lot of pollutants and damage to the environment during the production process. For example, Korhonen and Luptacik [
5] treat emissions directly as input and suggest they should be decreased to measure the eco-efficiency of coal-fired power plants in a European country. Thus, outputs are suggested to better identify whether they are desirable. Specifically, when congestion is involved with the desirability of the outputs, it may be difficult to distinguish which input is responsible for the desirable or undesirable outputs. Sueyoshi and Goto [
6] extend the concept of congestion by identifying its characteristics as either “desirable (good)” and “undesirable (bad).” Such a situation often occurs when the outputs are classified as desirable or undesirable. For example, desirable congestion can occur between the inputs and undesirable outputs. That is, undesirable outputs can be increased by decreasing one or more inputs while retaining any other inputs or outputs as constant. This type of congestion is desirable for managers. Based on the definition, Wu
et al. [
7] examine the situation where desirable and undesirable outputs coexist simultaneously.
Although previous research has attempted to illustrate the varying status of congestion and describe congestion in a concise and practical way, there has been little effort to make a distinct difference between inefficiency and congestion. For example, some researchers identify congestion as one type of inefficiency that affects performance and profits of firms severely in real practical applications [
8], while others extend congestion to include some of those inefficiencies, which exaggerates the extent of congestion [
9]. In order to better illustrate how inefficiencies differ from congestion, we take as an example an inefficient decision making unit (DMU), which we have an incentive to make efficient. Without loss of generality, we discuss the situation in an output orientation. If the inefficient inputs and outputs are projected onto the efficient frontier defined by [
9], it needs three sequential projections: (1) hold the inputs constant and increase the outputs to reach the frontier; (2) decrease the inputs and increase the outputs while retaining the unit’s efficiency, that is, having the unit move along the efficient frontier; and (3) hold the outputs constant and decrease the inputs while retaining the unit’s efficiency, which implies that the unit also shifts along the frontier. According to [
9], the first projection reflects managerial inefficiencies and the last two projections reflect congestion. Such classifications eliminate the distinction between congestion and inefficiency. Previous studies focusing on congestion do not make further comment on the issue. However, in related inefficiency studies, such classification may lead to confusion and is seen as paradoxical.
In order to remedy the confusion between inefficiency and congestion in the existing literature, we first introduce the concept of inefficiencies with different characteristics based on previous literature and propose a more precise definition of congestion. Based on the three projections as [
10] describes, we class them as managerial inefficiency, congestion, and technical inefficiency, respectively. We also propose a mathematical formulation to illustrate inefficiencies and congestion. Then we propose modified models to separate technical inefficiency from congestion and analyze the properties that determine whether and how congestion and inefficiencies occur. Since undesirable output is accompanied by desirable output, it is necessary to incorporate additional considerations into existing DEA models so as to properly decrease the undesirable output and increase the desirable output. Thus, a new approach for measuring congestion with undesirable outputs is applied to analyzing congestion in industry in 31 administrative regions of China. We are trying to identify the factors which may restrict China’s economic development and to make some policy proposals for the government.
The remainder of this article has the following structure:
Section 2 provides a literature review.
Section 3 briefly introduces the theoretical background of slack variables in DEA models and distinguishes technical inefficiency, managerial inefficiency, and congestion. We describe the mathematical concept of technical and managerial inefficiency, or congestion, more accurately. A modified DEA framework evaluating inefficiencies and congestion is proposed in
Section 4.
Section 5 proposes a method for identifying desirable and undesirable congestion. In
Section 6, we present an empirical example to verify the feasibility of the proposed approach. Conclusions are made in the last section.
2. Literature Review
After the first paper that discussed congestion with a solid theoretical basis [
11], many efforts have been made by researchers to explore whether congestion occurs and how congestion impacts on productive and managerial practices. Here we review the studies related to our paper; these can be classified into four categories: the first category studies the generation and effect of congestion; the second category discusses model development and the application of congestion measurements; the third category investigates the relationship between inefficiency and congestion; and the fourth considers undesirable problems in the DEA framework for measuring congestion.
Several papers have investigated the generation and effect of congestion. For example, Färe and Grosskopf [
12] suggest a procedure for identifying those input factors that cause congestion. Cooper
et al. [
13] explore an integrative model to estimate congestion and identify the sources of congestion. Flegg [
14] finds that the generation of congestion may be different for three alternative methods. Simões and Marques [
15] determine and compare the influence of congestion on efficiency using different methodologies.
Some other papers highlight congestion measurement using different models. Khodabakhshi [
16] proposes a one-model approach based on relaxed combination of inputs in order to simplify the calculation process. Noura
et al. [
17] study a new method which requires considerably less computation and proves equivalent to [
13]. Khoveyni
et al. [
18] propose a slack-based DEA approach to identify congestion for the evaluated DMUs. Other papers study the application of the proposed model. Kao [
19] applies the new model approach to measure the congestion effect of Taiwan’s forests. Simões and Marques [
20] apply three different methodologies to compare congestion measurement and evaluate the performance of Portuguese hospitals. The above literature studies focus on the identification and measurement of congestion and do not involve other kinds of inefficiencies.
Distinguishing between different kinds of inefficiencies can help managers make better use of resources to produce higher output and achieve optimal allocation of resources. Cooper
et al. [
2] investigate the management of congestion in Chinese industry, and discuss how elimination of managerial inefficiency can contribute to output augmentation without reducing employment in the textile and automobile industries. Cooper
et al. [
13] suggest that inefficiency is the necessary condition for the presence of congestion. Tone and Sahoo [
9] propose the congestion-weak model to identify weak congestion, but their model cannot separate congestion from technical inefficiency. Brockett
et al. [
10] introduce a method for discussing congestion and technical inefficiency. They investigate how managerial inefficiencies are identified and calculated separately from the effect of congestion. Marques and Simões [
21] use three different approaches to estimate the influence of congestion on the technical efficiency of the airport. Their work tells us how to reasonably consider managerial and technical inefficiencies. However, their studies do not distinguish technical inefficiency from congestion in the production processes. In addition, the above approaches only consider traditional scenarios, which ignore undesirable output.
There is a body of work dealing with the undesirable problem in DEA framework. For example, Färe
et al. [
22] propose a model to deal with the undesirable output problem. Hailu and Veeman [
23] suggest treating undesirable output as input for the reason that the producer wishes to increase desirable output and decrease input and undesirable output. Seiford and Zhu [
24] introduce a new method to deal with undesirable output via data transformation. Ji and Wang [
25] apply Seiford’s linear transformation method to evaluate efficiency with respect to the undesirable output. Jahanshahloo
et al. [
26] present an alternative method for dealing with undesirable input and output in non-radial DEA models. Huang
et al. [
27] consider undesirable output when measuring bank efficiency with a two-stage network model. Li
et al. [
28] also investigate desirable and undesirable outputs in evaluating the performance of electric power supply companies in China. In addition, the undesirable issues are extended to identify congestion based on output characteristics. Sueyoshi and Goto [
6] classify the concept of congestion into “undesirable (bad) congestion” and “desirable (good) congestion.” They also propose that Wu
et al. [
7] introduce a new approach for measuring congestion with undesirable outputs and discuss the congestion of the industry in 31 administrative regions of China.
Thus, with respect to the production of undesirable output, how to identify desirable and undesirable congestion, as well as make an appropriate input resources investment, is an urgent problem for firms today and in the future. Our current work differs from these previous papers in two main ways. First, whereas most of the existing literatures focus on congestion measurement, the bulk of our analysis is to make a differentiation between technical inefficiency, managerial inefficiency, and congestion. In particular, we show how to project the inefficient units into the efficient frontier by eliminating the inefficiencies given the existence of congestion. Second, we extend the conventional congestion concept to encompass undesirable and desirable congestion when undesirable output is included.
3. Definition
3.1. A Numerical Example
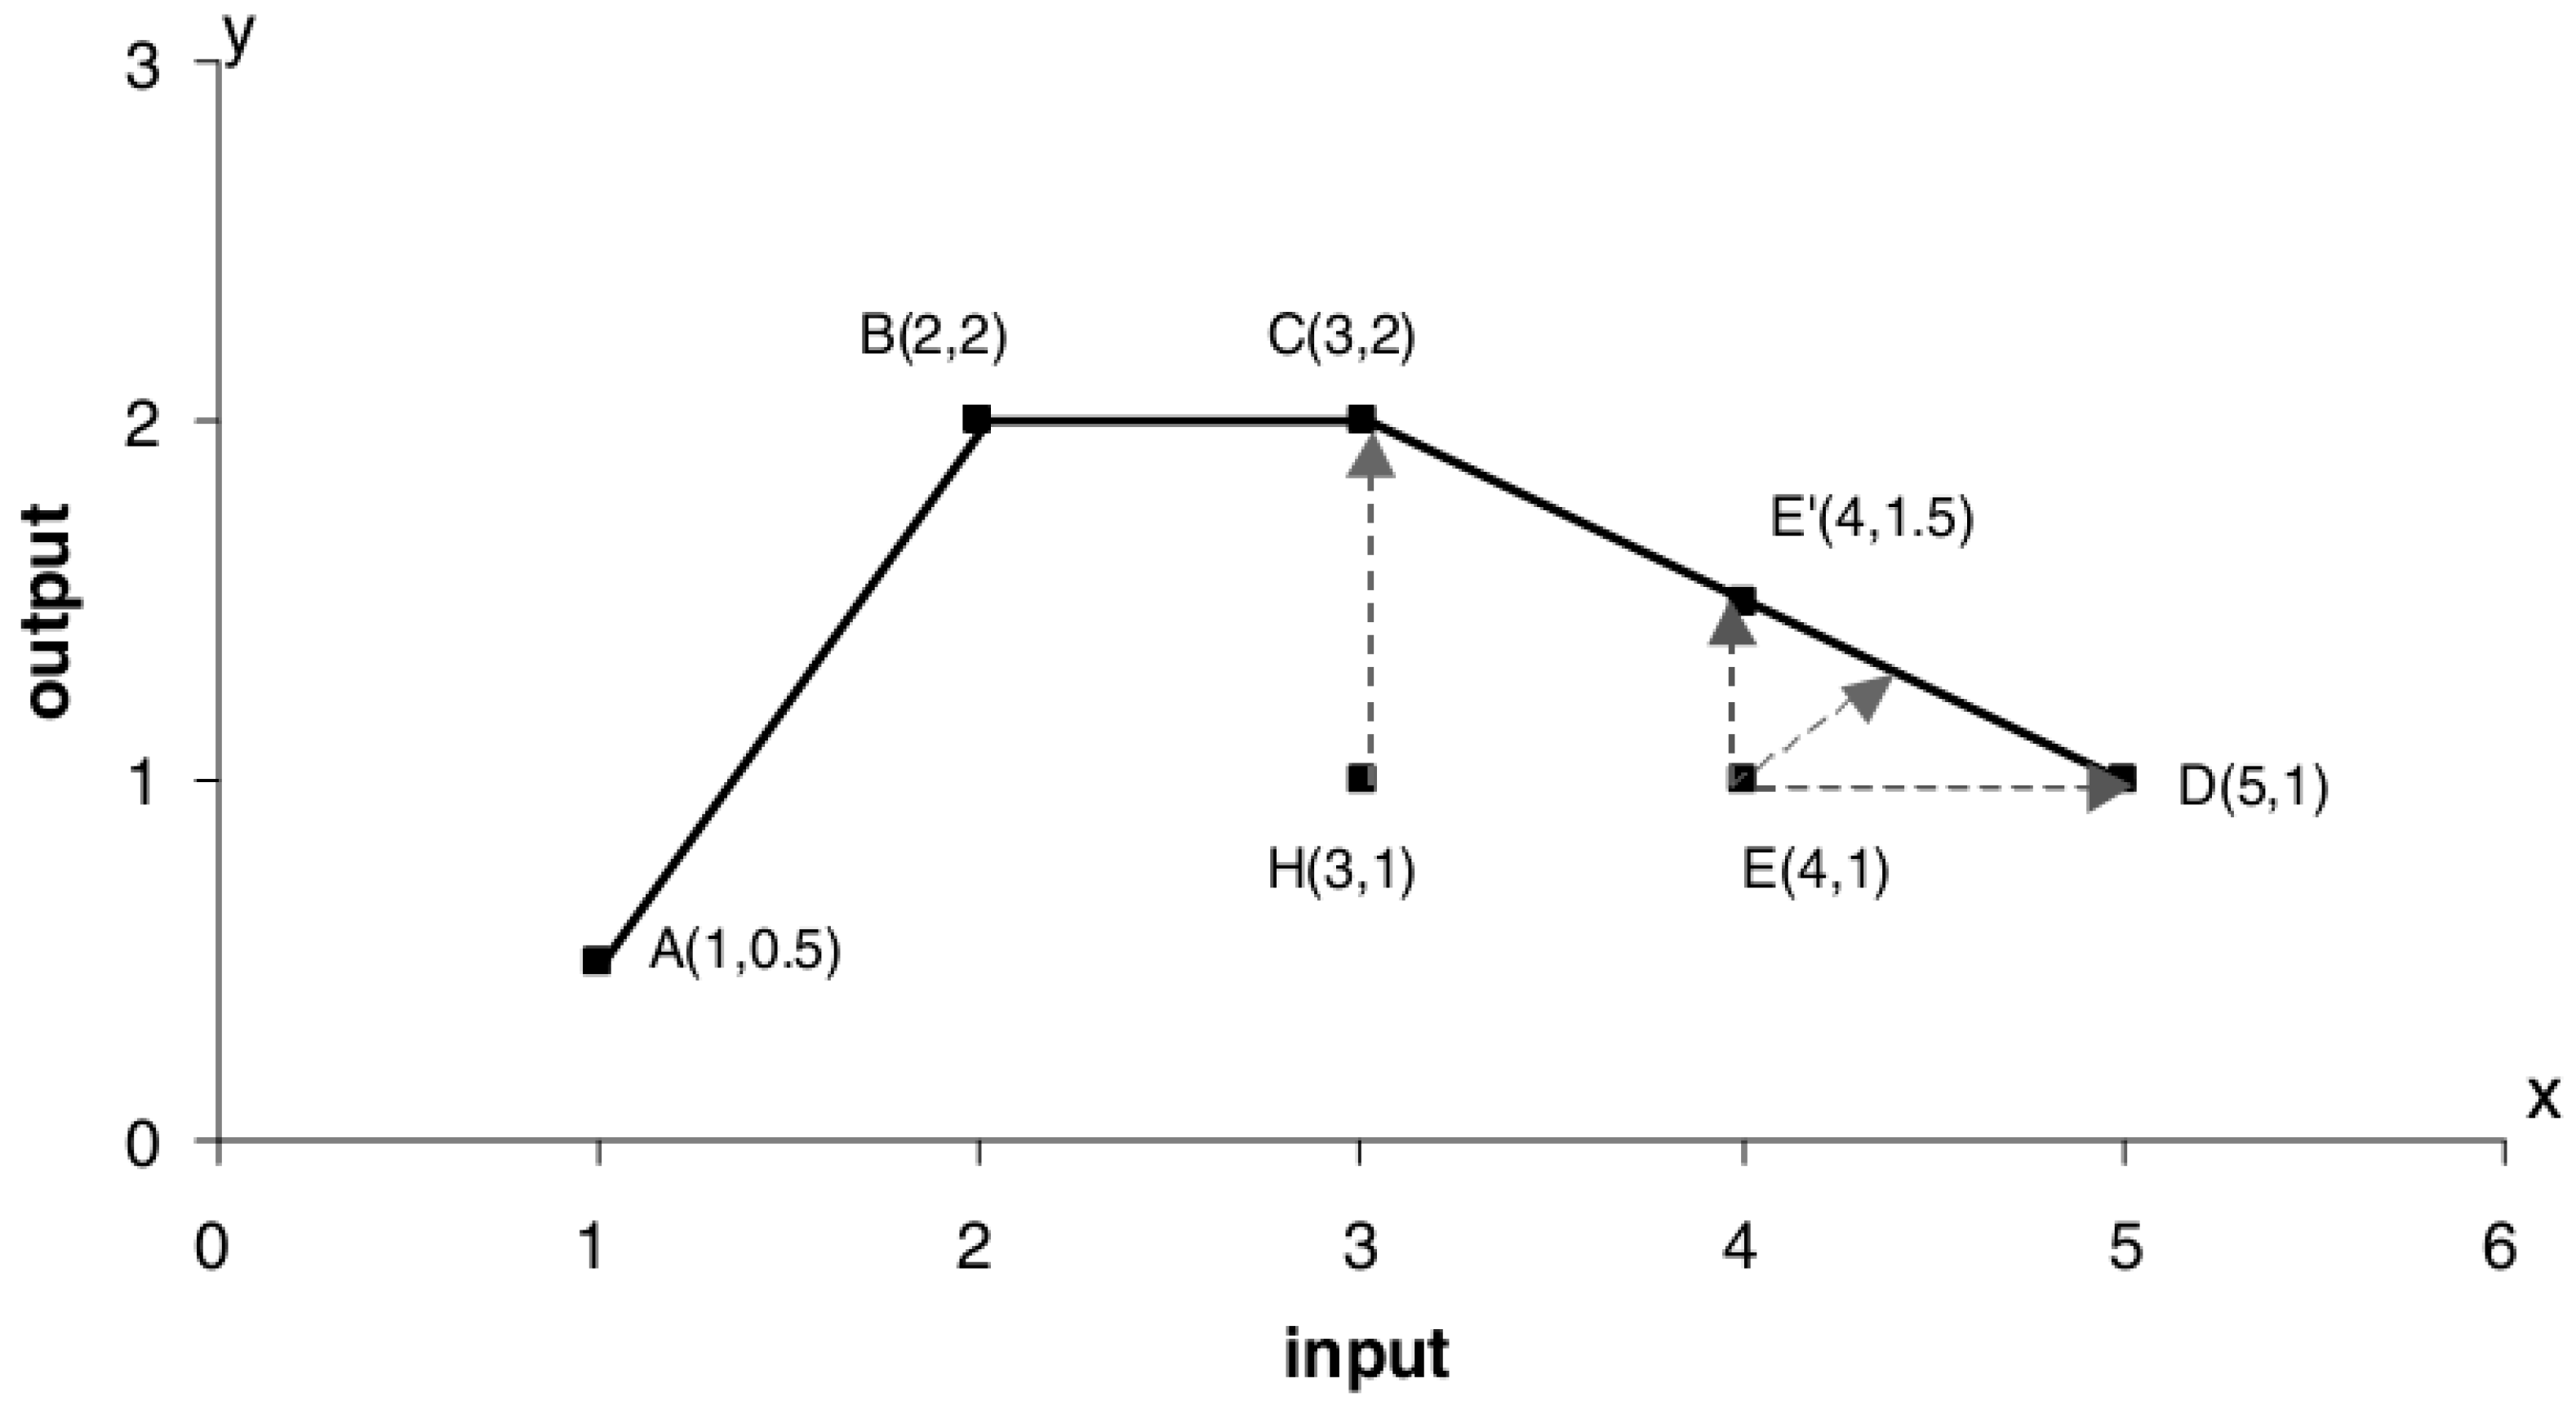
As illustrated in
Figure 1, initiated by [
10], six points help to make a clear distinction between technical inefficiency, congestion, and managerial inefficiency. For simplicity’s sake, a unit is assumed to consume a single input to produce a single output. The value on the left in any of the parentheses corresponds to an input amount and that on the right corresponds to an output amount. Thus, (1, 0.5) alongside point A means that DMU A utilizes one unit of input to produce half a unit of output. The frontier is composed of a piecewise segment with the points ABCD. Any inefficient unit is suggested to move along the frontier via a typical path depicted as follows. We take point E as an example. First, hold the input constant and increase the output to reach the frontier; second, move along the frontier as the input is decreased and the output is increased simultaneously; third, hold the output constant and decrease the input along the frontier. Following these three steps, point E is projected to E’, C, and B sequentially. In [
9], the projection from E’ to B is defined as the congestion. However, that may be not the case. In the third step, although the input decreases, the output does not increase, which does not accord with the definition of congestion [
13]. Next, we will make definitions of inefficiencies and congestion according to the projections and three steps.
Based on the above analysis and the definitions in literature, we divide congestion in [
9] into two parts, technical inefficiency and congestion. In [
2,
10], managerial inefficiency is defined as the output augmentation without reducing input, which corresponds to the move from E to E’ in
Figure 1 (the first projection). The second projection displays an input reduction and an output increase. It is defined as congestion, which corresponds to the move from E’ to C. According to [
10], technical inefficiency is defined as a decrease of the input without increasing the output, which corresponds to the move from C to B.
3.2. Mathematical Expression of Technical Inefficiency, Managerial Inefficiency, and Congestion
In congestion-related literature, the definitions of inefficiency and congestion lack a formal and unified mathematical expression. In particular, some of them are not accurate and may be paradoxical. In order to better describe congestion and inefficiencies, we give mathematical representations to illustrate them in a precise way.
Take
n observed DMUs, each of which consumes
m inputs and produce
s outputs. The input and output variables of
DMUj are
xij(
i = 1,…,
m) and
yij(
r = 1,…,
s), respectively. For simplicity’s sake, we denote vectors
xj and
yj as the vectors of the inputs and outputs of
DMUj, and
X and
Y as the matrix of the inputs and outputs of the DMUs, respectively. The new production possibility set
SNEW related to the input-output correspondence is formulated as:
Therefore, the mathematical definition of congestion and the two types of inefficiency are as follows:
Managerial inefficiency: For any given DMU0(x0, y0), if there exists a on the SNEW frontier which satisfies and , managerial inefficiency occurs and is measured as
Congestion: For any given , which is derived from DMU0(x0, y0) and has managerial inefficiency excluded preliminarily, if there exists a new on the SNEW frontier such that and , congestion occurs and is measured according to the following formula:
(1) Output deficiency:
(2) Input redundancy: under the condition of
Technical inefficiency: For any given , which is derived from and has managerial inefficiency and congestion excluded preliminarily, if there exists a on the SNEW frontier such that and , technical inefficiency occurs and is measured as
Thus, we can use the above definitions to estimate the inefficiencies and congestion of an inefficient DMU, and project it onto the efficient frontier by eliminating managerial inefficiency, congestion, and technical inefficiency, respectively. It is worth noting that the definitions are given under the condition that the outputs are desirable for the decision makers; we then extend them by incorporating different classifications of outputs. That is, desirable and undesirable outputs are taken into consideration simultaneously and congestion is divided between desirable congestion and undesirable congestion.
4. Identifying Inefficiencies and Congestion
In this section, we first identify managerial inefficiency and then classify congestion and technical inefficiency based on the definition proposed by [
9]. For simplicity’s sake, we do not take undesirable outputs into consideration.
4.1. Identifying Managerial Inefficiency
Banker
et al. [
29] introduce the BCC model to estimate the efficiency of an evaluated DMU under the variable returns to scale setting:
In order to identify to what extent the output can be increased maximally, and to estimate managerial inefficiency of the evaluated DMU, similar to the BCC model, we project all the DMUs onto the
SNEW frontier using the following model:
It is worth noting that the first constraint of Model (3) differs from the BCC model in that the slacks of inputs are ignored. In this way, we can keep
x unchanged so as to investigate managerial inefficiency. If
DMU0(
x0,
y0) is inefficient and is not on the frontier
SNEW, we project it through Equations (4) and (5).
where
are the optimal solutions of Model (3). Following the equation,
xi0 remains unchanged, and
yr0 increases according to the corresponding proportion and slack of Equation (5). Thus, the new input-output vector
is on the frontier
SNEW. Based on the characteristics of managerial inefficiency, we can obtain the following property:
Property 1. If one or more of the slacks for the evaluated DMU0, managerial inefficiency occurs and is measured by for output r.
4.2. Identifying Congestion and Technical Inefficiency
With the above transformation, (
x0,
y0) is converted to
, and the evaluated
DMU0 is projected onto the frontier
SNEW. Obviously, managerial inefficiency is extracted from
DMU0. Based on the new
, we begin with the model of [
9] and classify the congestion of [
9] into congestion and technical inefficiency:
The objective of Model (6) is to maximize the slacks of the outputs as a first priority. Given that the outputs are optimized, Model (6) allows us to maximize the slacks of the inputs as a secondary priority. Denote
as the optimal vector of Model (6). Tone and Sahoo [
9] illustrate that
is congested if and only if
, as derived from Model (6). Specifically, congestion is measured by
and
as the input redundancy and output shortage, respectively. The projected inputs and outputs are obtained from:
However, in real applications, this is not the case. We take the following data analysis as an illustration. We apply the data of
Figure 1 and list them in
Table 1.
Table 1.
The difference between inefficiency and congestion.
Table 1.
The difference between inefficiency and congestion.
| DMU | x | y | y* | | | xc | yc |
|---|
| Model (5) | Models (7) and (8) | Models (10) and (11) |
|---|
| A | 1 | 0.5 | 0.5 | 1 | 0.5 | 1 | 0.5 |
| B | 2 | 2 | 2 | 2 | 2 | 2 | 2 |
| C | 3 | 2 | 2 | 2 | 2 | 3 | 2 |
| D | 5 | 1 | 1 | 2 | 2 | 3 | 2 |
| E | 4 | 1 | 1.5 | 2 | 2 | 3 | 2 |
| H | 3 | 1 | 2 | 2 | 2 | 3 | 2 |
In
Table 1, the second and third columns represent the original input and output of the units. The fourth column is obtained from Equation (5) and identifies the managerial inefficiency of the units. From Model (6), all the points are projected onto the frontier point B. This implies that the congestion contains the line segment BC. However, although point C has 1 unit in excess of the input, there is no output reduction associated with the input excess. According to [
10], the line segment BC can represent the technical inefficiency, as defined above, instead of congestion.
In an effort to better distinguish technical inefficiency from congestion, we propose a modified model as follows:
Denote
as the optimal solution vector of Model (9). The only difference between Models (9) and (6) lies in that Model (9)’s secondary objective is to minimize the slacks of the inputs given that the slacks of outputs are maximized preliminarily. That is, in Model (9), the objective is to maximize the outputs first and then to minimize the inputs while retaining the first objective value of
at the optimum level. Similar to Equations (7) and (8), we can obtain the projected inputs and outputs as:
In this way, technical inefficiency is excluded from the congestion. According to the transformation, we can project all the points with congestion to point C, and the congestion can be identified and estimated by the following properties:
Property 2. If one or more of the slacks and for the evaluated , congestion occurs. Specifically, if , input redundancy occurs and is measured by or If , output shortage occurs and is measured by or
Property 3. If for the evaluated , technical inefficiency occurs and the input redundancy is measured by
Since
and
are the improvements derived from Models (7), (8), (10), and (11), respectively, we can identify technical inefficiency and congestion and distinguish them in a precise way. The results are clearly illustrated by the last two columns in
Table 1.
5. Identifying Desirable and Undesirable Congestion
In the previous section, we proposed several models for identifying managerial inefficiency and divided congestion as defined by [
9] into congestion and technical inefficiency based on the related literature and real applications. However, this model cannot depict a situation where undesirable outputs do exist. As [
6] suggested, desirable and undesirable congestion exist when the outputs are classified as desirable and undesirable. Specifically, desirable congestion can occur between inputs and undesirable outputs, whereas undesirable congestion occurs between inputs and desirable outputs. When some of the undesirable outputs decrease while other outputs remain constant when some of the inputs increase, desirable congestion occurs. Such a situation is desirable for decision makers if the marginal cost is lower than the marginal loss derived from undesirable outputs. With such an incentive, we extend the above models to illustrate a situation in which the undesirable outputs are considered simultaneously.
We begin with the definition of desirable congestion and then propose modified models to incorporate undesirable output and desirable congestion to better identify congestion that is preferable to the decision maker.
Denote the desirable and undesirable outputs as grj(r = 1,…s) and utj(t = 1,…q), respectively, and uj as the vector of the undesirable outputs of DMUj. The definition of desirable congestion is as follows:
Desirable congestion: For any given
, which is derived from
when managerial inefficiency is excluded preliminarily, if there exists a new
on the
SNEW frontier such that
and
, desirable congestion occurs and is measured according to the following formula:
- (1)
Output deficiency:
- (2)
Input redundancy:
under the condition of
We reformulate Model (9) as follows:
where
and
are the slacks of desirable output
r and undesirable output
t, respectively. Since desirable/undesirable output shortage is related to undesirable/desirable congestion, we use the superscripts “U” and “D” to denote undesirable and desirable congestion. Obviously, undesirable outputs are taken into consideration and are incorporated into Model (12). Compared with Model (9), Model (12) extends the objective by maximizing the slacks of desirable and undesirable outputs simultaneously; also, an additional constraint
is added. It is worth noting that
has been converted using a transformation similar to Model (5).
In real applications, as the input increases, both desirable outputs and undesirable outputs may decrease simultaneously. Thus, undesirable congestion occurs when some of the desirable outputs decrease, whereas desirable congestion occurs when some of the undesirable outputs decrease. This definition is different from [
7] in that a reduction in input results in an increase in desirable outputs and decrease in undesirable outputs simultaneously.
We also utilize a two-stage process similar to [9] to solve Model (13). In the first stage, the slacks of desirable outputs and undesirable outputs are maximized simultaneously. That is, the first two parts of the objective function denoted by
are maximized. In the second stage,
is minimized based on the objective value of the O1 at the first stage.
Thus, we can obtain the optimal solution vector
and project the original inputs and outputs as follows:
Based on the optimal solution above, we propose the following two properties:
Property 4. If
or
in the concerned
, and
, congestion is observed in the
. Undesirable congestion occurs if
, whereas desirable congestion occurs if
. Specifically, both desirable and undesirable congestion exist simultaneously if
and
Property 5. If
and
in the concerned
, and
, no congestion is observed in the
In an effort to better examine technical inefficiency, Model (6) is extended to consider undesirable outputs simultaneously:
Denote the optimal solution vector of Model (16) as
, and the projected inputs and outputs are obtained as:
According to Property 3, technical inefficiency can be distinguished from congestion by subtracting
from
. In addition, input congestion is estimated as
7. Conclusions
In recent decades, the economy of China has witnessed rapid development, which causes serious environmental problems that arouse widespread concern in society. This paper studies the difference between technical inefficiency and congestion based on definitions from research and real practice. Based on a review of previous literature, we classify congestion as defined by [
9] into two parts, technical inefficiency and congestion, and propose mathematical expressions for technical inefficiency, managerial inefficiency, and congestion. We then propose several modified models to identify various inefficiencies. The models are extended by incorporating desirable and undesirable congestion simultaneously. Our methodology can contribute to a better trade-off between economic development and environmental protection.
There are three main contributions of this study. First, congestion is defined well by separating conventional congestion into a new defined congestion and technical inefficiency, which has been defined by other research and accords with production practice. Although technical inefficiency may be smaller in magnitude and may not occur when there are multiple inputs and outputs, it is nontrivial in real applications because of its significant difference from congestion.
Second, we extend the understanding of congestion by positing a situation in which desirable and undesirable congestion are taken into consideration simultaneously. Although several studies have discussed this issue, their identification is based on an inappropriate classification of congestion and will result in a misunderstanding of congestion. From this perspective, we propose desirable and undesirable congestion based on the differentiation of technical inefficiency from conventional congestion and explore modified models to better identify them.
Thirdly, the proposed approach can be verified by applying it to the identification of congestion in China’s economic development. We find that several districts exhibit managerial inefficiency and congestion. To solve this problem, we apply the proposed method to these districts to eliminate their managerial inefficiency and congestion. We also find that if the same amount of inputs produces a larger amount of outputs, then the number of congestion DMUs will be less. All these results can be used by the government to promote the development of the economy.
Future research into this approach will involve several aspects. We can deal with resource allocation under centralized organizations, considering congestions in the DEA framework. The opportunities present for research into possibilities for reallocating congesting inputs between different DMUs will result in output increase. Other possibilities for research include considering the relationship between desirable outputs and undesirable outputs, where an increase in undesirable outputs decreases the vector of desirable outputs.


