Citizen Assessment as Policy Tool of Urban Public Services: Empirical Evidence from Assessments of Urban Green Spaces in China

Abstract
:1. Introduction
2. Background and Methods
2.1. Background


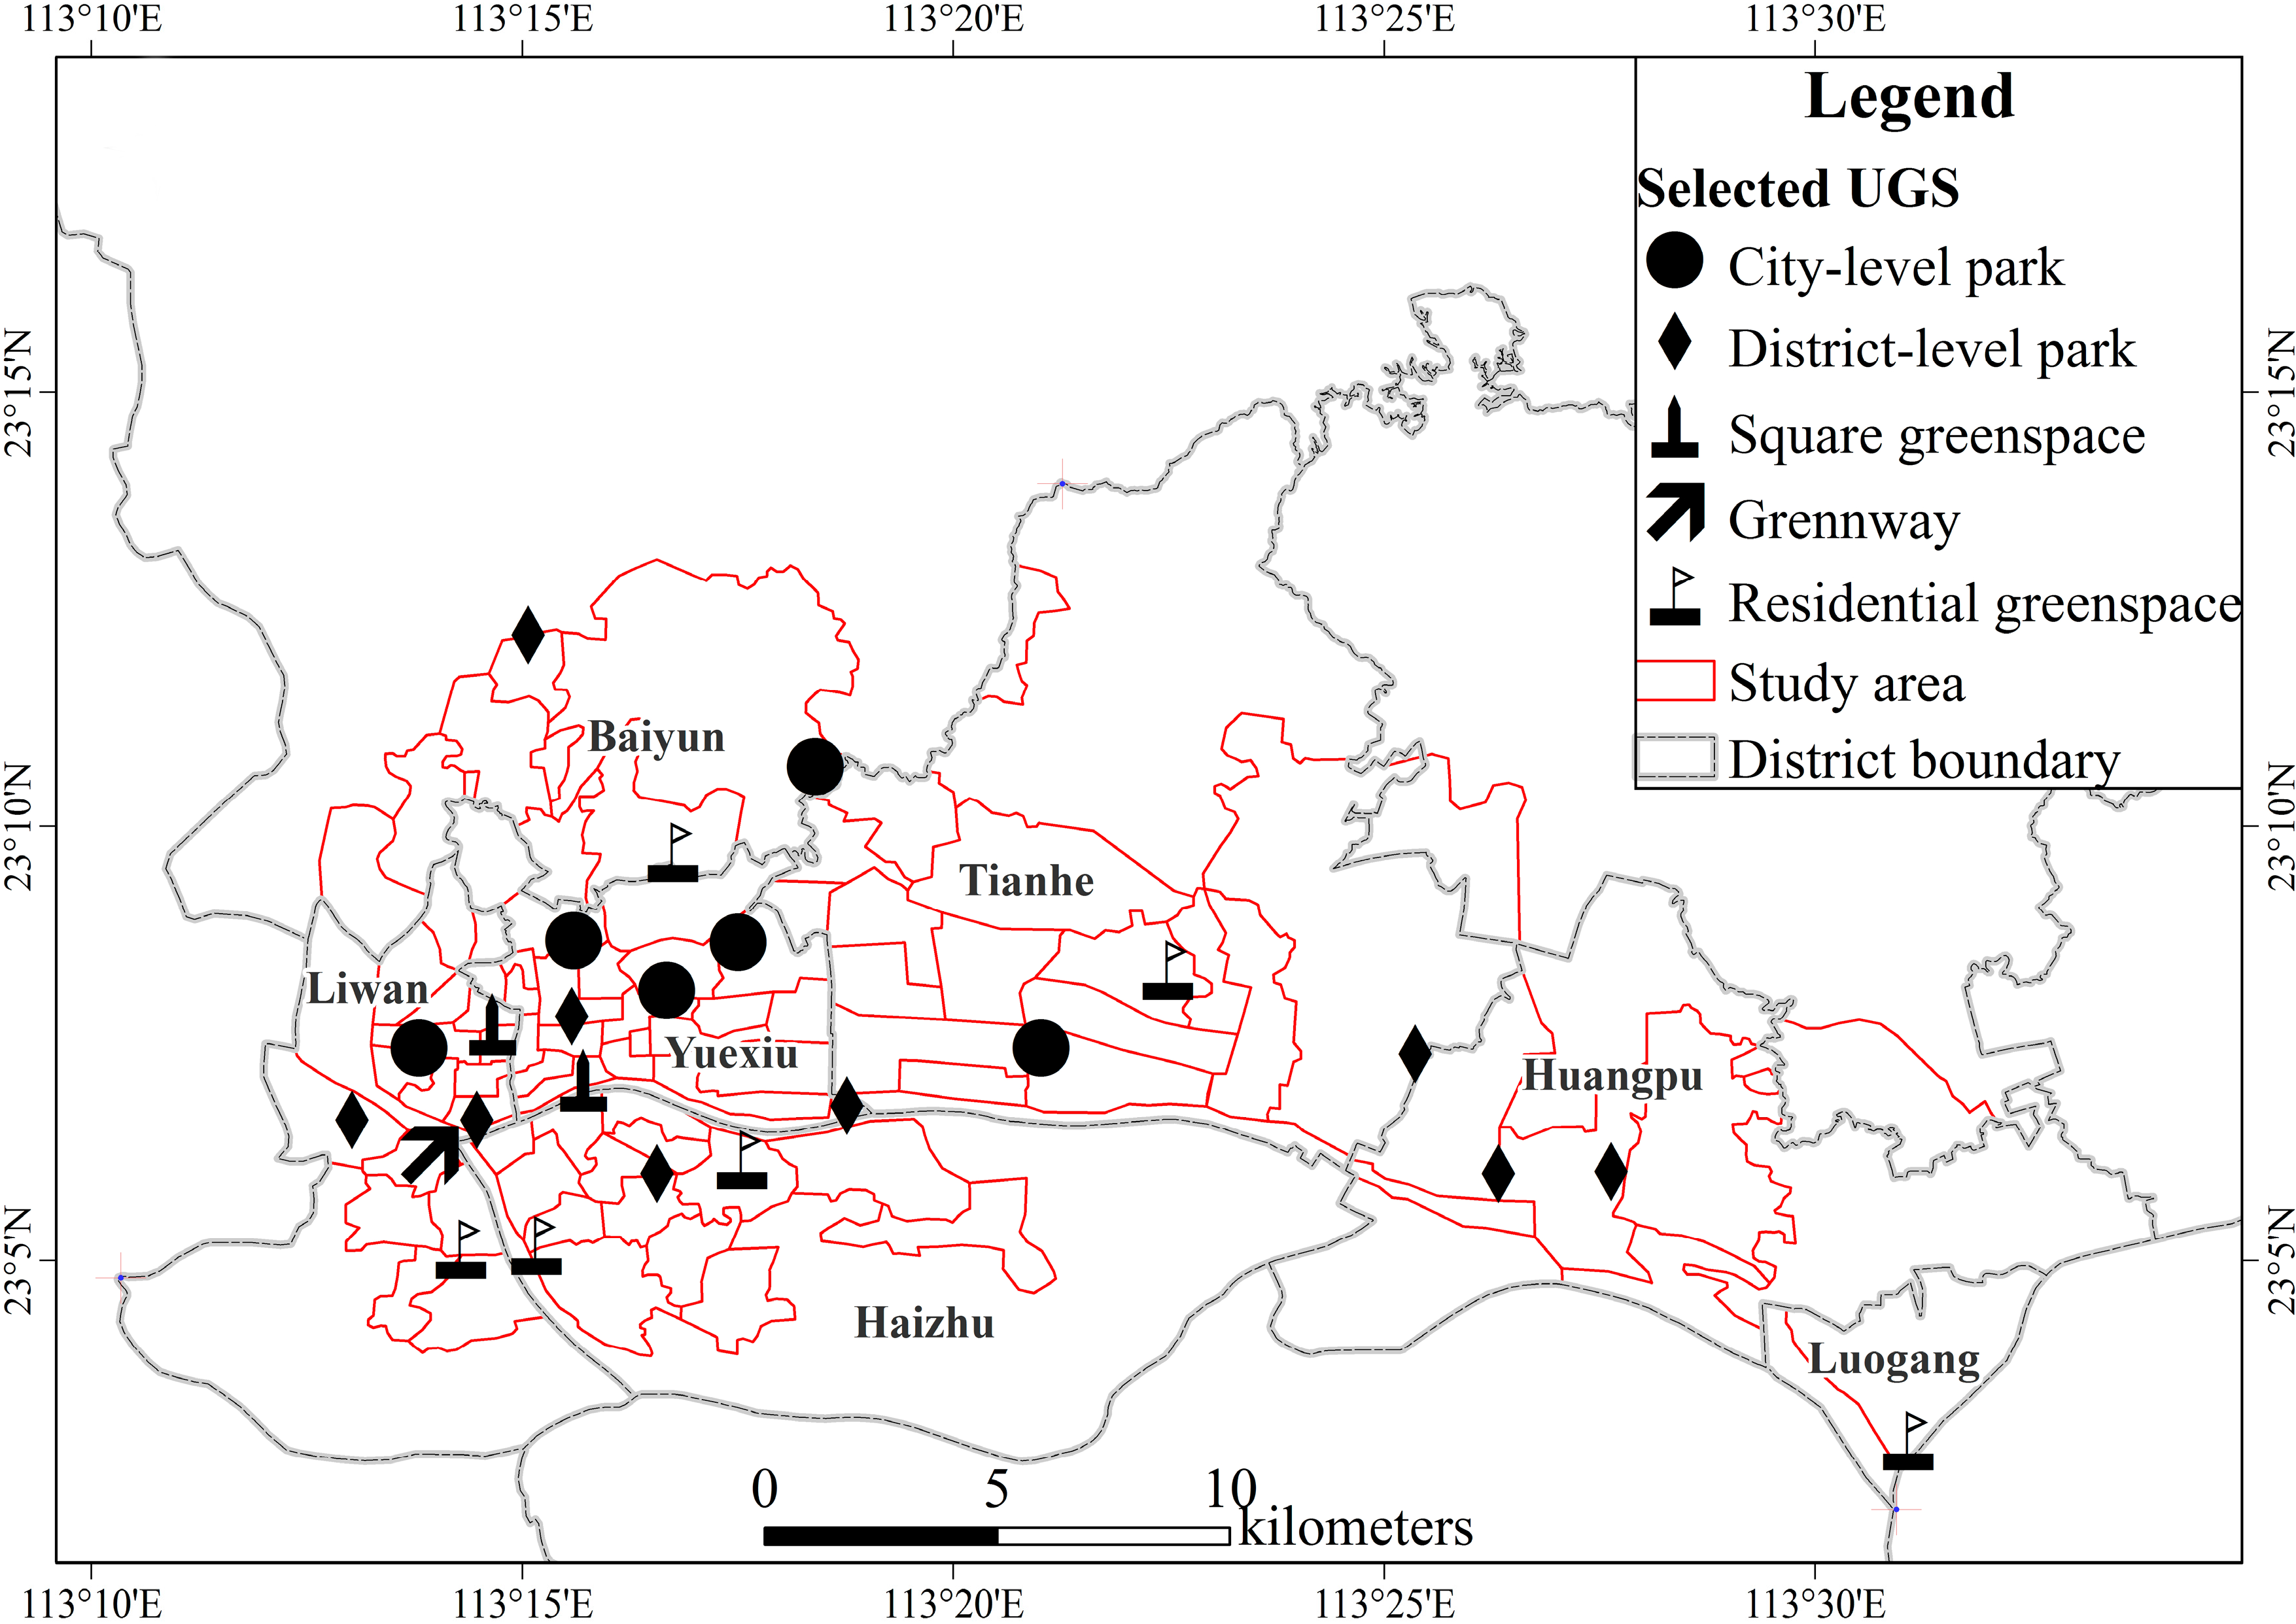
| District a | Park Number | Park Area (hm2) | Park Number per 10,000 Persons | Park Area per Capita (m2) |
|---|---|---|---|---|
| Liwan | 12 | 79.07 | 0.17 | 1.12 |
| Yuexiu | 14 | 458.19 | 0.12 | 3.98 |
| Tianhe | 23 | 574.98 | 0.37 | 9.28 |
| Huangpu | 14 | 67.27 | 0.73 | 3.49 |
| Haizhu | 9 | 192.11 | 0.10 | 2.19 |
| Baiyun | 48 | 356.36 | 0.63 | 4.68 |
| Total | 120 | 1727.98 | 0.28 | 3.99 |
2.2. Methods
3. Results
3.1. Characteristics of the Sample
| Variable a | Category | Survey (%) | Census (%) | Difference b (%) |
|---|---|---|---|---|
| Gender (X2 = 0.71; p = 0.400) | Male | 56.8 | 52.8 | 4.0 |
| Female | 43.2 | 47.2 | −4.0 | |
| Age (X2 = 2.25; p = 0.691) | 15–24 | 30.2 | 24.5 | 5.7 |
| 25–29 | 18.4 | 16.4 | 2.0 | |
| 30–49 | 35.0 | 39.6 | −4.6 | |
| 50–59 | 6.9 | 8.1 | −1.2 | |
| ≥60 | 9.5 | 11.4 | −1.9 | |
| Education level (X2 = 52.96; p = 0.000) | Lower secondary school | 22.2 | 53.4 | −31.2 |
| Upper secondary school | 36.6 | 29.3 | 7.3 | |
| University or higher | 41.2 | 17.3 | 23.9 | |
| Household monthly income per capita (RMB) (X2 = 1.16; p = 0.560) | <1000 | 36.4 | 34.3 | 2.1 |
| 1000–3000 | 42.8 | 47.9 | −5.1 | |
| ≥3000 | 20.8 | 17.8 | 3.0 | |
| District (X2 = 16.11; p = 0.024) | Baiyun | 14.8 | 14.0 | 0.8 |
| Dongshan | 7.4 | 12.3 | −4.9 | |
| Fangcun | 11.0 | 4.9 | 6.1 | |
| Haizhu | 21.2 | 21.6 | −0.4 | |
| Huangpu | 14.2 | 8.0 | 6.2 | |
| Liwan | 7.4 | 10.5 | −3.1 | |
| Tianhe | 16.4 | 21.1 | −4.7 | |
| Yuexiu | 7.8 | 7.6 | 0.2 |
3.2. Assessment of UGSs
3.2.1. Individual Assessments’ Variation across Dimensions and Types of UGSs
| Assessment Dimension | Respondent Rating b | Mean c | ||||
|---|---|---|---|---|---|---|
| 1 | 2 | 3 | 4 | 5 | ||
| Vegetation conditions | 13.01 | 40.02 | 36.69 | 5.49 | 0.67 | 2.38 |
| Supporting facilities | 5.25 | 34.28 | 36.98 | 17.12 | 3.67 | 2.79 |
| Environmental amenities | 8.18 | 38.52 | 30.87 | 12.11 | 4.46 | 2.66 |
| Landscape aesthetics | 7.19 | 39.59 | 45.11 | 6.12 | 1.46 | 2.55 |
| Management and maintenance | 11.33 | 45.31 | 30.59 | 9.83 | 1.15 | 2.43 |
| Overall average | 7.76 | 37.43 | 36.36 | 12.80 | 2.72 | 2.64 |
Assessment Variation across Dimensions of UGSs
Assessment Variation across Types of UGSs
| Assessment Dimension | Type of UGSs a (Pillai’s Trace = 0.21; p = 0.000) | ||||||
|---|---|---|---|---|---|---|---|
| 1 (32.3%) | 2 (27.9%) | 3 (23.2%) | 4 (16.6%) | F Value (df = 3) | p | p in Scheffe Comparison | |
| Vegetation conditions | 2.16 | 2.35 | 2.58 | 2.63 | 22.55 | 0.000 | p b(3,4) = 0.913 |
| Supporting facilities | 2.52 | 2.88 | 2.89 | 3.05 | 24.91 | 0.000 | p(1,2), p(1,3), p(1,4) = 0.000 |
| Environmental amenities | 2.37 | 2.63 | 2.92 | 2.99 | 16.12 | 0.000 | p b(3,4) = 0.985 |
| Landscape aesthetics | 2.42 | 2.56 | 2.63 | 2.66 | 6.28 | 0.000 | p(1,3) = 0.010, p(1,4) = 0.003 |
| Management and maintenance | 2.19 | 2.51 | 2.52 | 2.66 | 13.46 | 0.000 | p(1,2), p(1,3), p(1,4) = 0.000 |
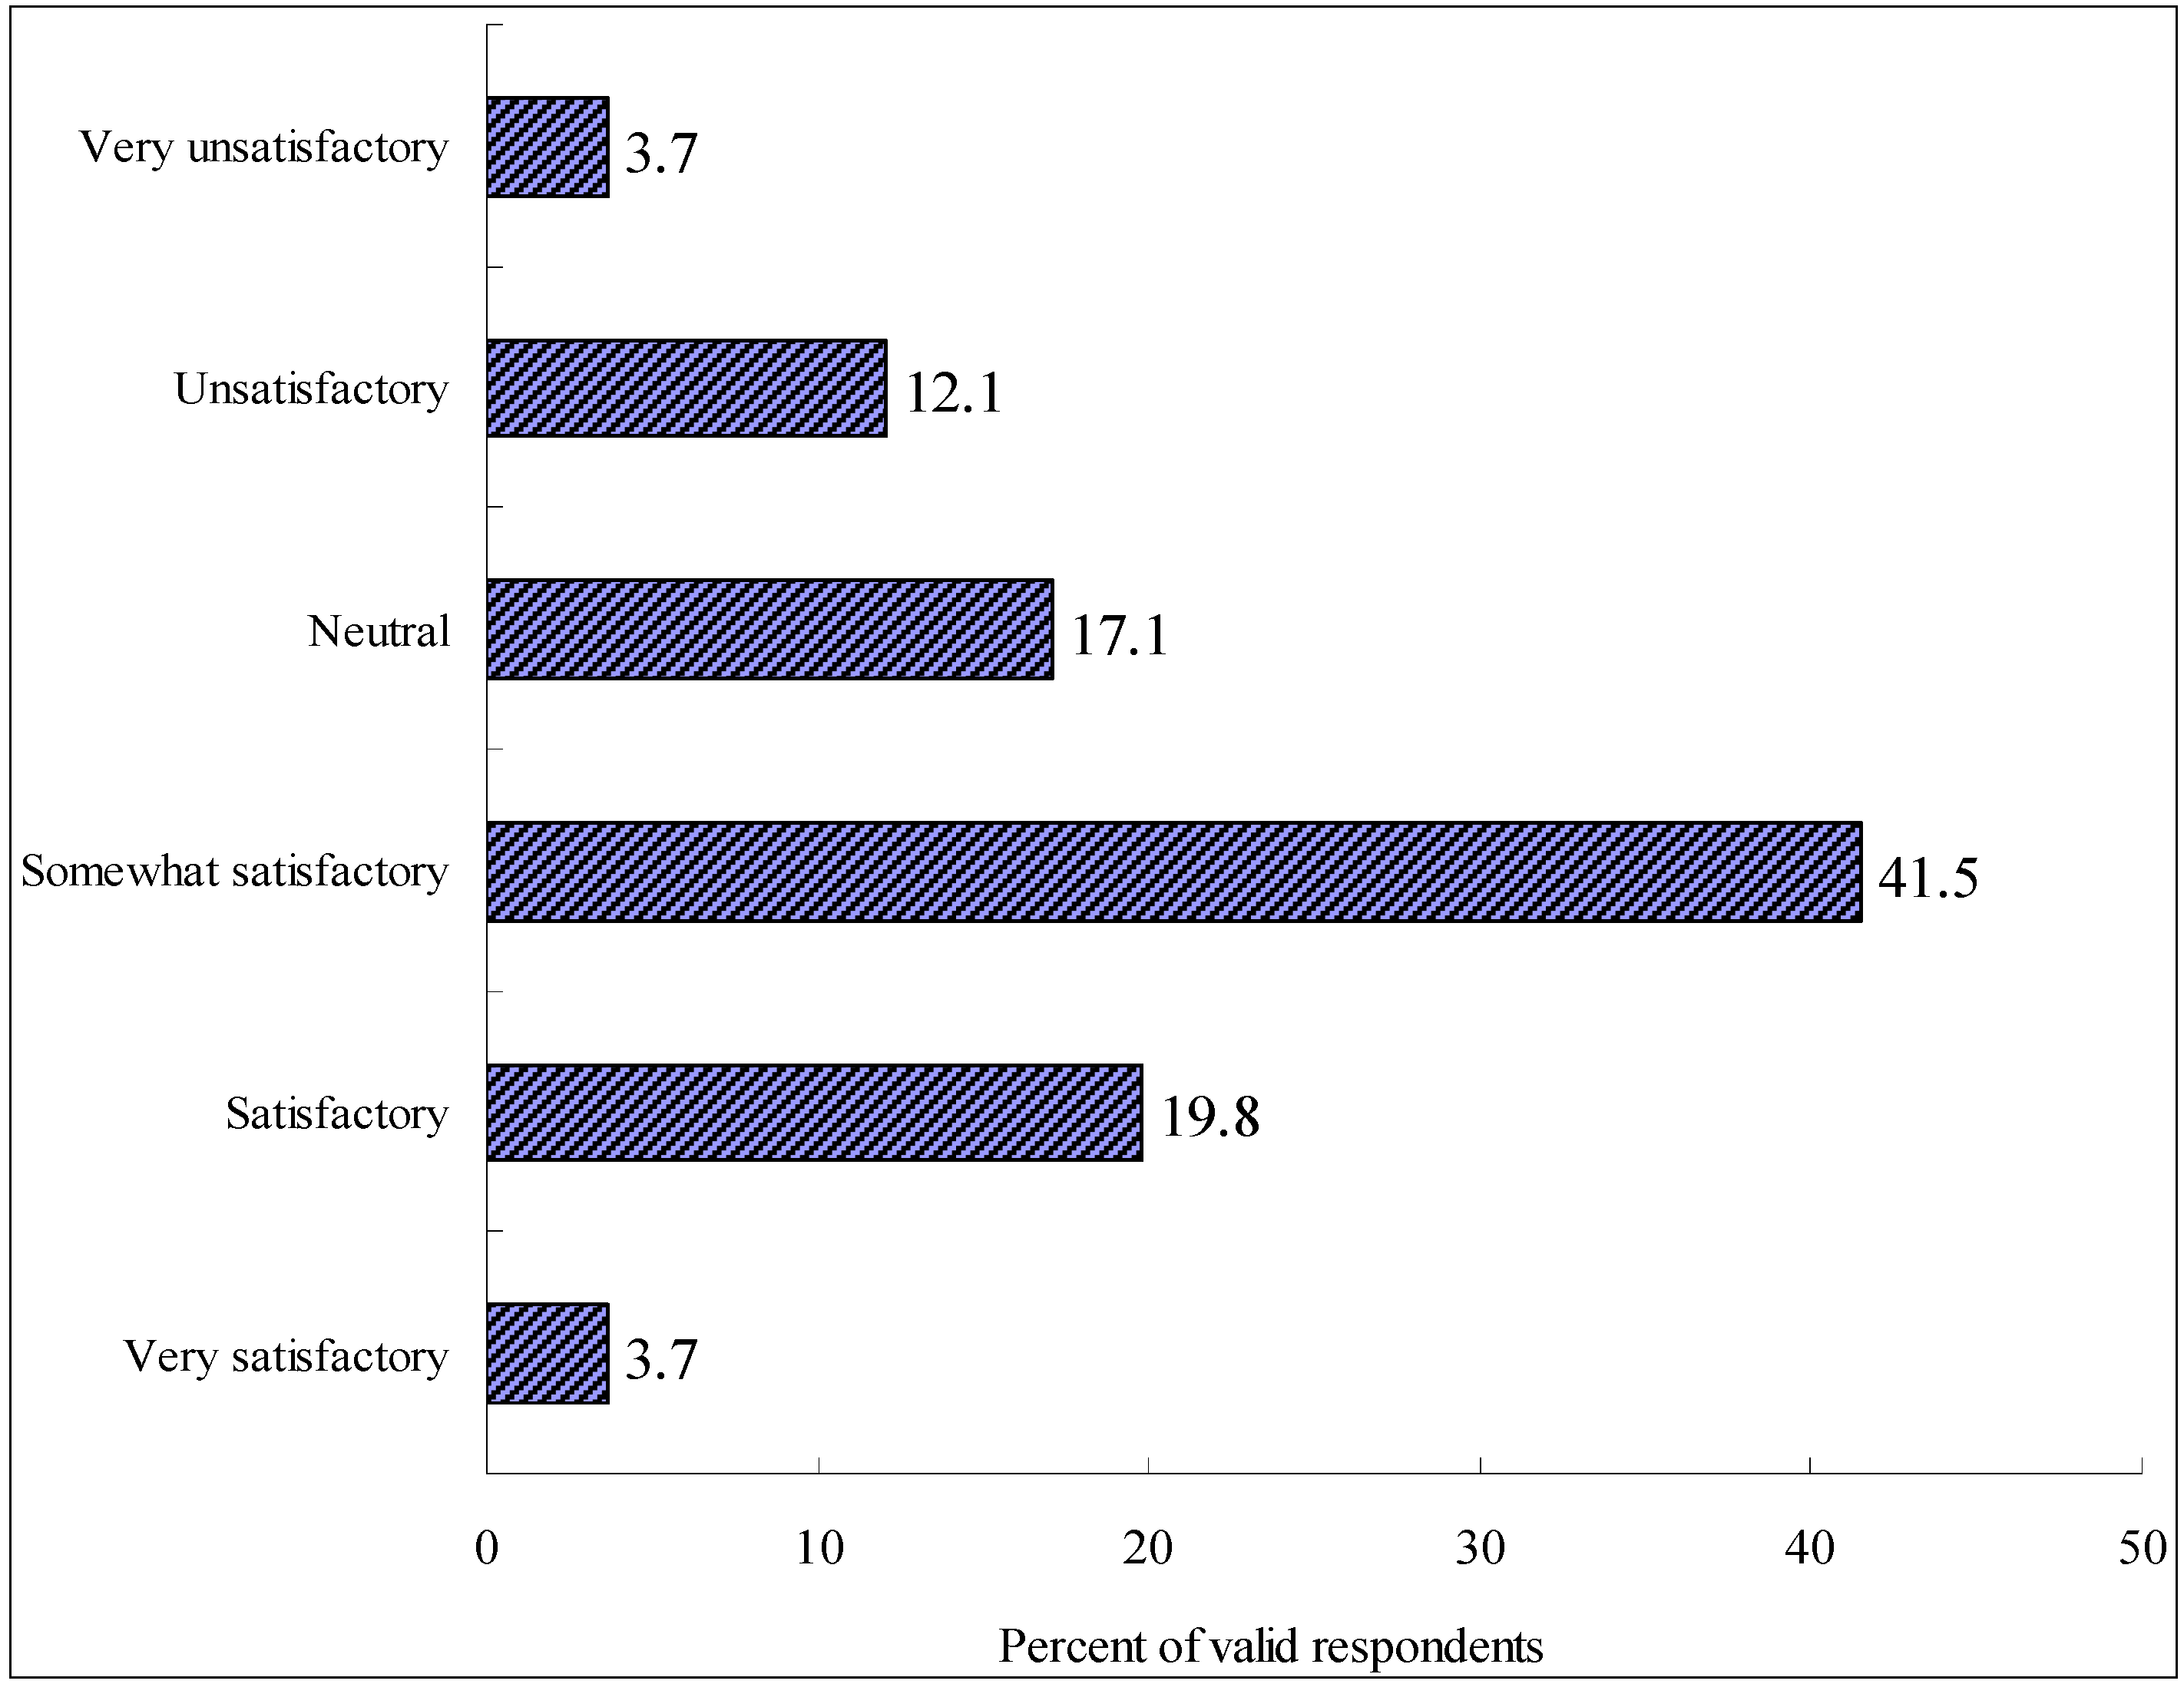
3.2.2. Overall Assessment and Socio-Demographic Effects
| Variable | Beta | t | p |
|---|---|---|---|
| Marital status a | 0.11 | 2.58 | 0.010 |
| New and old districts | −0.07 | −1.79 | 0.074 |
| Occupation | 0.05 | 1.25 | 0.211 |
4. Discussion
5. Conclusions
Acknowledgments
Author Contributions
Conflicts of Interest
Appendix
| Assessment Dimension | Assessment Indicator |
|---|---|
| Vegetation conditions | Vegetation quality |
| Vegetation cover ratio | |
| Tree shade | |
| Tree height | |
| Vegetation health | |
| Vegetation visual diversity | |
| Supporting facilities | Information board location |
| Message on information board | |
| Information board number | |
| Information board quality | |
| Table/bench number | |
| Table/bench quality | |
| Table/bench comfort | |
| Table/bench location | |
| Shelter number | |
| Shelter quality | |
| Shelter comfort | |
| Shelter location | |
| Dustbin number | |
| Dustbin design | |
| Dustbin location | |
| Toilet number | |
| Toilet cleanness | |
| Toilet comfort | |
| Environmental amenities | Quietness |
| Air quality | |
| Water quality | |
| Landscape aesthetics | Building number |
| Scenic beauty | |
| Landscape design | |
| Management and maintenance | Vegetation tending |
| Facility maintenance | |
| Cleanliness | |
| Safety |
References
- Kelly, J.M. Citizen satisfaction and administrative performance measures: Is there really a link? Urban Aff. Rev. 2003, 38, 855–866. [Google Scholar]
- Van Ryzin, G.G.; Charbonneau, É. Public service use and perceived performance: An empirical note on the nature of the relationship. Public Admin. 2010, 88, 551–563. [Google Scholar] [CrossRef]
- Ferrari, P.A.; Manzi, G. Citizens evaluate public services: A critical overview of statistical methods for analysing user satisfaction. J. Econ. Policy Reform 2014, 17, 236–252. [Google Scholar] [CrossRef]
- Licari, M.J.; McLean, W.; Rice, T.W. The condition of community streets and parks: A comparison of resident and nonresident evaluations. Public Admin. Rev. 2005, 65, 360–368. [Google Scholar] [CrossRef]
- Kelly, J.M.; Swindell, D. The case for the inexperienced user: Rethinking filter questions in citizen evaluation surveys. Am. Rev. Public Admin. 2003, 33, 91–108. [Google Scholar] [CrossRef]
- Schachter, H.L. Objective and subjective performance measures: A note on terminology. Admin. Soc. 2010, 42, 550–567. [Google Scholar] [CrossRef]
- Stipak, B. Citizen satisfaction with urban services: Potential misuse as a performance indicator. Public Admin. Rev. 1979, 39, 46–52. [Google Scholar] [CrossRef]
- Fitzgerald, M.; Durand, R.F. Citizen evaluations and urban management: Service delivery in an era of protes. Public Admin. Rev. 1980, 40, 520–525. [Google Scholar] [CrossRef]
- Brudney, J.L.; England, R.E. Urban policy making and subjective service evaluations: Are they compatible? Public Admin. Rev. 1982, 42, 127–135. [Google Scholar]
- Brown, K.; Coulter, P.B. Subjective and objective measures of police service delivery. Public Admin. Rev. 1983, 43, 50–58. [Google Scholar] [CrossRef]
- Hero, R.E.; Durand, R. Explaining citizen evaluations of urban services: A comparison of some alternative models. Urban Aff. Q. 1985, 20, 344–354. [Google Scholar] [CrossRef]
- Yang, Y. Adjusting for perception bias in citizens’ subjective evaluations: A production function perspective. Public Perform. Manag. Rev. 2010, 34, 38–55. [Google Scholar] [CrossRef]
- Clifton, J.; Díaz-Fuentes, D.; Fernández-Gutiérrez, M. The impact of socio-economic background on satisfaction: Evidence for policy-makers. J. Regul. Econ. 2014, 46, 183–206. [Google Scholar] [CrossRef]
- Charbonneau, É.; van Ryzin, G.G. Performance measures and parental satisfaction with new york city schools. Am. Rev. Public Admin. 2012, 42, 54–65. [Google Scholar]
- Parks, R.B. Linking objective and subjective measures of performance. Public Adm. Rev. 1984, 44, 118–127. [Google Scholar] [CrossRef]
- Percy, S.L. In defense of citizen evaluations as performance measures. Urban Aff. Q. 1986, 22, 66–83. [Google Scholar] [CrossRef]
- Im, T.; Lee, S.J. Does management performance impact citizen satisfaction? Am. Rev. Public Admin. 2012, 42, 419–436. [Google Scholar] [CrossRef]
- Kelly, J.M.; Swindell, D. A multiple-indicator approach to municipal service evaluation: Correlating performance measurement and citizen satisfaction across jurisdictions. Public Admin. Rev. 2002, 62, 610–621. [Google Scholar] [CrossRef]
- Cohen, P.; Potchter, O.; Schnell, I. A methodological approach to the environmental quantitative assessment of urban parks. Appl. Geogr. 2014, 48, 87–101. [Google Scholar] [CrossRef]
- Dolesh, R.J.; Vinluan, M.H.; Phillips, M. The values of public parks and recreation in America. Parks Recreat. 2006, 41, 14–17. [Google Scholar]
- Chiesura, A. The role of urban parks for the sustainable city. Landsc. Urban Plan. 2004, 68, 129–138. [Google Scholar] [CrossRef]
- Eizenberg, E. The changing meaning of community space: Two models of ngo management of community gardens in new york city. Int. J. Urban Reg. Res. 2012, 36, 106–120. [Google Scholar] [CrossRef]
- Rosol, M. Public participation in post-fordist urban green space governance: The case of community gardens in berlin. Int. J. Urban Reg. Res. 2010, 34, 548–563. [Google Scholar] [CrossRef] [PubMed]
- Anderson, L.M.; Schroeder, H.W. Application of wildland scenic assessment methods to the urban landscapes. Landsc. Plan. 1983, 10, 219–237. [Google Scholar]
- Collier, M.J.; Scott, M.J. Industrially harvested peatlands and after-use potential: Understanding local stakeholder narratives and landscape preferences. Landsc. Res. 2008, 33, 439–460. [Google Scholar] [CrossRef]
- Strycker, L.A.; Duncan, S.C.; Duncan, T.E.; Chaumeton, N.R.; He, H. Use of a local worker survey as a source of neighborhood information. Environ. Behav. 2008, 40, 726–741. [Google Scholar] [CrossRef] [PubMed]
- Van Herzele, A.; Wiedemann, T. A monitoring tool for the provision of accessible and attractive urban green spaces. Landsc. Urban Plan. 2003, 63, 109–126. [Google Scholar]
- Giles-Corti, B.; Broomhall, M.H.; Knuiman, M.; Collins, C.; Douglas, K.; Ng, K.; Lange, A.; Donovan, R.J. Increasing walking: How important is distance to, attractiveness, and size of public open space? Am. J. Prev. Med. 2005, 28, 169–176. [Google Scholar] [CrossRef]
- Broyles, S.T.; Mowen, A.J.; Theall, K.P.; Gustat, J.; Rung, A.L. Integrating social capital into a park-use and active-living framework. Am. J. Prev. Med. 2011, 40, 522–529. [Google Scholar] [CrossRef] [PubMed]
- Kaczynski, A.T.; Wilhelm Stanis, S.A.; Besenyi, G.M. Development and testing of a community stakeholder park audit tool. Am. J. Prev. Med. 2012, 42, 242–249. [Google Scholar] [CrossRef] [PubMed]
- Hayward, D.G.; Weitzer, W.H. The public’s image of urban parks: Past amenity, present ambivalence, uncertain future. Urban Ecol. 1984, 8, 243–268. [Google Scholar] [CrossRef]
- Jim, C.Y. Green-space preservation and allocation for sustainable greening of compact cities. Cities 2004, 21, 311–320. [Google Scholar] [CrossRef]
- Shan, X.-Z. Attitude and willingness toward participation in decision-making of urban green spaces in China. Urban For. Urban Green. 2012, 11, 211–217. [Google Scholar] [CrossRef]
- Yang, S. Public participation in the chinese environmental impact assessment (eia) system. J. Environ. Assess. Policy Manag. 2008, 10, 91–113. [Google Scholar] [CrossRef]
- Jim, C.Y.; Chen, W.Y. Recreation-amenity use and contingent valuation of urban greenspaces in guangzhou, China. Landsc. Urban Plan. 2006, 75, 81–96. [Google Scholar] [CrossRef]
- Huang, S.-C.L. The impact of public participation on the effectiveness of, and users’ attachment to, urban neighborhood parks. Landsc. Res. 2010, 35, 551–562. [Google Scholar] [CrossRef]
- Gao, J. How does chinese local government respond to citizen satisfaction survey? A case study of foshan city. Aust. J. Public Admin. 2012, 71, 136–147. [Google Scholar] [CrossRef]
- Heberer, T. Evolvement of citizenship in urban china or authoritarian communitarianism? Neighborhood development, community participation, and autonomy. J. Contemp. China 2009, 18, 491–515. [Google Scholar]
- Wang, Q. China’s environmental civilian activism. Science 2010, 328, 824–825. [Google Scholar] [CrossRef] [PubMed]
- Guangzhou Statistical Bureau. Guangzhou Statistical Yearbook; China Statistics Press: Beijing, China, 2006. (In Chinese) [Google Scholar]
- The Trust for Public Land (TPL). Camden. In New Jersey: The Role of Parks and Greenspace in Redevelopment; TPL: San Francisco, CA, USA, 2004. [Google Scholar]
- Han, X.; Jin, L.; Chen, L. Characteristics of the parks in guangzhou and development strategies. Trop. Geogr. 2008, 28, 382–387. (In Chinese) [Google Scholar]
- Guangzhou Municipal Landscape Bureau. Urban Green Space System Planning of Guangzhou (Urban Area, 2001–2020); Guangzhou Municipal Landscape Bureau: Guangzhou, China, 2002. (In Chinese) [Google Scholar]
- Yuen, B. Use and experience of neighborhood parks in singapore. J. Leis. Res. 1996, 28, 293–311. [Google Scholar]
- Dunnett, N.; Swanwick, C.; Wooley, H. Improving Urban Parks, Play Areas and Green Spaces; Department for Transport, Local Government and the Regions: London, UK, 2002. [Google Scholar]
- Bell, S.; Morris, N.; Findlay, C.; Travlou, P.; Montarzino, A.; Gooch, D.; Gregory, G.; Ward Thompson, C. Nature for People: The Importance of Green Spaces to East Midlands Communities; English Nature: Peterborough, UK, 2004. [Google Scholar]
- Guangzhou Census Office. Tabulation on the 2000 Population Census of Guangdong Province (Guangzhou); Guangdong Economic Press: Guangzhou, China, 2002. (In Chinese) [Google Scholar]
- Kornblum, W.; Hayes, C.; Allen, R. Public Use of Urban Parks: A Methods Manual for Park Managers and Community Leaders; The Urban Institute: Washington, DC, USA, 2001; pp. 23–31. [Google Scholar]
- Jim, C.Y.; Chen, W.Y. Perception and attitude of residents toward urban green spaces in Guangzhou (China). Environ. Manag. 2006, 38, 338–349. [Google Scholar] [CrossRef]
- Jim, C.Y. Heterogeneity and differentiation of the tree flora in three major land uses in Guangzhou City, China. Ann. For. Sci. 2002, 59, 107–118. [Google Scholar] [CrossRef] [Green Version]
- Kelly, J.M.; Swindell, D. Service quality variation across urban space: First steps toward a model of citizen satisfaction. J. Urban Aff. 2002, 24, 271–288. [Google Scholar] [CrossRef]
- Shingler, J.; van Loon, M.E.; Alter, T.R.; Bridger, J.C. The importance of subjective data for public agency performance evaluation. Public Admin. Rev. 2008, 68, 1101–1111. [Google Scholar] [CrossRef]
- Carmona, M.; Sieh, L. Performance measurement in planning—Towards a holistic view. Environ. Plan. C Gov. Pol. 2008, 26, 428–454. [Google Scholar] [CrossRef]
- Frank, N. Measuring public service: Assessment and accountability—To ourselves and others. J. Plan. Educ. Res. 2008, 27, 499–506. [Google Scholar] [CrossRef]
© 2014 by the authors; licensee MDPI, Basel, Switzerland. This article is an open access article distributed under the terms and conditions of the Creative Commons Attribution license (http://creativecommons.org/licenses/by/4.0/).
Share and Cite
Shan, X.-Z.; Yu, X. Citizen Assessment as Policy Tool of Urban Public Services: Empirical Evidence from Assessments of Urban Green Spaces in China. Sustainability 2014, 6, 7833-7849. https://doi.org/10.3390/su6117833
Shan X-Z, Yu X. Citizen Assessment as Policy Tool of Urban Public Services: Empirical Evidence from Assessments of Urban Green Spaces in China. Sustainability. 2014; 6(11):7833-7849. https://doi.org/10.3390/su6117833
Chicago/Turabian StyleShan, Xi-Zhang, and Xijun Yu. 2014. "Citizen Assessment as Policy Tool of Urban Public Services: Empirical Evidence from Assessments of Urban Green Spaces in China" Sustainability 6, no. 11: 7833-7849. https://doi.org/10.3390/su6117833
APA StyleShan, X.-Z., & Yu, X. (2014). Citizen Assessment as Policy Tool of Urban Public Services: Empirical Evidence from Assessments of Urban Green Spaces in China. Sustainability, 6(11), 7833-7849. https://doi.org/10.3390/su6117833