1. Introduction
In 2012, 12.4 billion tons of oil equivalent (toe) of energy resources [
1] in total were consumed in the world. Of that, the percentage of oil is 33%, of coal is 30% and the fraction of gas is 24%. Together, coal, oil and gas currently make up about 87% of the total energy resource consumption.
The role of gas in the global energy balance in the last century has risen steadily and will grow in the future with the development of new fields, with conventional gas and shale gas, as well. In this regard, it should be noted that Russia is one of the world’s largest gas producers. Total proven gas reserves in Russia are 32.9 trillion m3, while the production in 2012 was 592.3 billion m3.
Gas, like all energy resources, is extracted in order to obtain energy. Obviously, energy costs differ for each energy resource. EROI is the ratio of how much energy is gained from an energy production process compared to how much of that energy (or its equivalent from some other source) is required to extract, grow,
etc. [
2]. The higher the EROI, the more efficient the energy resource is.
A large percent of this research is dedicated to the calculation of the energy efficiency of production of various energy resources as published in recent years. In this regard, it should be noted that the Swiss online scientific journal, Sustainability, in 2011, published 21 articles dedicated to the EROI. That issue posted the results of research and calculations of the EROI for gas. The EROI for gas production in the Appalachian basin for the period 1985–2003 was 87:1 [
3]. The EROI for conventional gas production in Canada declined from 38:1 in 1993 to 15:1 in 2005 [
4]. In addition, we should note the calculation for the EROI of gas from the Marcellus Shale at the wellhead, 85:1 [
5], and another research study estimates the EROI for shale gas at the start of the pipeline as 17:1 [
6].
Russia is one of the largest gas-producing countries, and therefore, it is important to calculate the energy efficiency of oil production in Russia.
Federal bill No. 261 “On Energy Saving and Enhanced Energy Efficiency” was adopted in Russia at the end of 2009. The focus was “on energy saving and on the increase of energy efficiency”. This bill talked about the need for an energy audit in industrial enterprises, including oil and gas production and processing. Therefore, gas-producing companies that had not been keeping a systematic account of the consumed energy were now being compelled to account for the consumption of energy in all production sectors: exploration and production, logistic, processing and sales. Some companies provided data on energy consumption in their annual reports, and based on these data, there is now an opportunity to calculate the EROI for gas production in Russia.
The purpose of this article is to calculate the EROI for gas production in Russia. For this purpose, the data published in the annual reports of gas production companies will be used.
2. Data for the EROI Calculation
2.1. Hydrocarbon Production and Energy Consumption in Russia
Russian statistics agency provides data on hydrocarbon production and energy consumption for production and transportation of oil and gas. Open access data is available since 2005 [
7].
Rosstat collects all of the necessary information and forms an energy balance. On the balance sheet, there is information about oil and gas production, as well as the total energy consumption for the production of oil and gas combined (
Table 1).
Energy consumption includes:
Energy for drilling and construction;
Energy for extraction and primal processing;
Energy for transportation of hydrocarbons.
Unfortunately, there is no data on the energy consumption separate for each activity sector, and there is no data on embodied energy consumption.
In the future, Rosstat’s methodology of the calculation of energy consumption should be revisited and developed to show more data, at least with separation for activity sectors.
Table 1.
Hydrocarbon production in Russia.
Table 1.
Hydrocarbon production in Russia.
| No. | Title | 2005 | 2006 | 2007 | 2008 | 2009 | 2010 | 2011 | 2012 |
|---|
| 1 | Production |
| 1.1 | Oil production, Mtoe | 470.0 | 480.3 | 490.7 | 487.8 | 494.1 | 505.1 | 512.2 | 518.5 |
| 1.2 | Gas production, Mtoe | 516.9 | 529.4 | 525.5 | 535.6 | 471.0 | 525.4 | 541.1 | 528.1 |
| 1.3 | Total production, Mtoe | 986.9 | 1009.6 | 1016.2 | 1023.4 | 965.0 | 1030.5 | 1053.3 | 1046.6 |
| 2 | Consumption |
| 2.1 | Energy resource, Mtoe | 8.9 | 8.9 | 13.1 | 12.3 | 9.5 | 9.1 | 8.5 | 10.1 |
| 2.1.1 | Gas | 8.8 | 8.7 | 12.7 | 11.7 | 9.2 | 8.7 | 8.3 | 10.0 |
| 2.1.2 | Oil | 0.1 | 0.1 | 0.4 | 0.6 | 0.3 | 0.3 | 0.1 | 0.1 |
| 2.2 | Fuels, Mtoe | 1.6 | 1.9 | 1.6 | 1.5 | 1.1 | 1.5 | 0.8 | 0.7 |
| 2.3 | Electricity, Mtoe | 14.2 | 16.4 | 17.1 | 18.5 | 18.9 | 19.7 | 20.8 | 21.7 |
| 2.4 | Thermal energy, Mtoe | 2.4 | 2.5 | 2.2 | 2.2 | 2.4 | 2.2 | 2.1 | 2.0 |
| 2.5 | Total consumption, Mtoe | 27.2 | 29.6 | 34.0 | 34.5 | 31.9 | 32.4 | 32.2 | 34.5 |
2.2. Gas Producing Companies
In Russia, there are several companies whose main specialization is gas production. The two largest companies are OJSC “Gazprom” and OJSC “NOVATEK”. In addition to these two major companies, there are a number of small-scale regional companies. In this article, we will talk about one of these: OJSC “Yakutsk Fuel and Energy Company (YATEC)”, which is producing and selling gas in the territory of the Republic of Sakha (Yakutia).
In Russia, there is no independent organization that makes an estimation of energy consumption in oil and gas companies. Because of that, it is hard to make any estimation about the quality of data given in reports. At the moment, the data in reports is a black box and for the purpose of deep analysis of the EROI, we need to open it to understand how and what data is collected, the methodology, etc. Right now we do not have access to this information. For the purpose of preliminary calculation, we should trust these data (as far as we trust any information given in reports in general).
2.2.1. OJSC “Gazprom”
The Gazprom Group has the largest gas reserves among oil-gas companies in the world. As of December 31, 2013, Gazprom Group’s hydrocarbon reserves in Russia were 35,669 billion m
3 of natural gas and 1381.2 Mt of gas condensate. At the end of 2013, the Gazprom Group was developing 131 hydrocarbon fields in Russia [
8].
The main region of the Group’s activities is the Yamalo-Nenets region: more than half of Gazprom’s gas proven reserves and more than 80% of its producing assets are located in the region. The specificity of the current activities of OJSC “Gazprom” is that the company is forced to form new gas production centers due to natural depletion of the fields. Currently, Gazprom forms the new gas production centers: Yamal, Yakutsk, Irkutsk, Sakhalin, Kamchatka and Krasnoyarsk.
In Yakutia, it has been decided to develop the Chayandinskoye field (about 1.2 trillion m3 of gas reserves), to build the gas pipeline “Power of Siberia” and processing facilities in the Amur region. Gas production is scheduled to begin in 2018.
In connection with the formation of new gas production centers, an issue of gas processing gets special importance. At present, the installed capacities for hydrocarbon raw material processing of Gazprom Group are 53.4 billion m3 for natural gas. It turns out that only a small share of the produced gas is processed, and the remaining share goes on sale without processing. This is due to the fact that currently, the major portion of the produced gas in terms of composition is single-component and does not require processing. Therefore, after cleaning and drying, the gas is sent directly to the consumer. After beginning development of the fields in the new gas production centers, it will be necessary to expand the gas processing capacities, because the composition of gases of the new fields is multi-component.
The forming of new gas production centers will require constructing new infrastructure, gas pipelines and gas processing plants. Construction and operation will require a significant amount of materials and energy. This, as well as an increasing transportation leg will reduce the EROI for the gas production. The exact calculation of the EROI could be done after the beginning of the development of fields at the new gas production centers.
Publication of data on energy consumption in the annual reports began only in 2010. Reports provide data on the energy consumption without separation by the sectors of activities (
Table 2). Data includes energy consumption for production and transportation of gas in total.
Table 2.
Data from annual reports of OJSC “Gazprom”.
Table 2.
Data from annual reports of OJSC “Gazprom”.
| No. | OJSC “Gazprom” | 2010 | 2011 | 2012 | 2013 |
|---|
| 1 | Production figures | | | | |
| 1.1 | Gas condensate, Mt | 11.3 | 12.1 | 12.8 | 14.7 |
| 1.2 | Gas production, Gm3 | 508.6 | 513.2 | 487 | 487 |
| 1.3 | Wells commissioned | 88 | 187 | 298 | 133 |
| 2 | Energy consumption | | | | |
| 2.1 | Electricity, GWh | 15,400 | 16,900 | 15,400 | 15,200 |
| 2.2 | Heat energy, Tcal | 23,400 | 23,600 | 25,200 | 22,600 |
We should note that reports have very little data on energy consumption and no data on material consumption at all. For advanced EROI calculation, it is important to have a detailed report on energy consumption with separation by activity sector and, in the best case, field by field energy consumption with the following data:
Drilling new wells, new construction;
Gas production;
Gas transportation;
Operation maintenance work (equipment repairs, other auxiliary work, etc.).
At the moment, we do not have such data in the public domain. However, we believe that the company can provide it in future reports.
2.2.2. OJSC “NOVATEK”
NOVATEK is the second largest producer of natural gas in Russia. The company’s main activities are the exploration, development, processing, transportation and sale of natural gas. The development and processing assets of the company are mainly concentrated in the Yamalo-Nenets region.
As of 31 December 2013, NOVATEK’s proved reserves totaled 12,537 million barrels of oil equivalent. In 2013, in total, 10 fields were under development [
9].
Unfortunately, in the reports, the data on energy consumption are provided without separation by activity sectors (
Table 3). Data include energy consumption for production and transportation of gas in total.
Table 3.
Data from annual reports of activities of OJSC “NOVATEK”.
Table 3.
Data from annual reports of activities of OJSC “NOVATEK”.
| No. | OJSC “NOVATEK” | 2010 | 2011 | 2012 | 2013 |
|---|
| 1 | Production figures | | | | |
| 1.1 | Liquid hydrocarbons, Mt | 3.6 | 4.1 | 4.3 | 4.7 |
| 1.2 | Gas production, bln m3 | 37.8 | 53.5 | 57.3 | 62.2 |
| 1.3 | Wells commissioned | | 12 | 42 | 87 |
| 2 | Energy costs in total | | | | |
| 2.1 | Electricity, GWh | 189.6 | 228.8 | 269 | 279 |
| 2.2 | Heat energy, Tcal | 236.9 | 237.1 | 202 | 184.7 |
| 2.3 | Gas for own needs, Mm3 | 229.4 | 465.7 | 665 | 826 |
| 2.4 | Fuel, kt | 19.2 | 4.7 | 48.7 | 35.2 |
Again, very little data is given, without separation by activity sectors and without data on material consumption. We do not have additional data on energy and material consumption in the public domain from the NOVATEK Company.
2.2.3. OJSC “YATEC”
The company YATEC produces gas in the Republic of Sakha (Yakutia). The gas produced by the company is completely consumed within the republic.
The main field is Srednevilyuiskoye. Recoverable reserves of the field at the end of 2013 are 129.8 billion m3 of gas and 5679 Mt of condensate. Srednevilyuiskoye field has been in development for 28 years. At the end of 2013, 32.5 billion m3 of gas and 1,923 Mt of condensate were produced in total. The annual gas production depends on the need for gas in the central region of the republic. Currently, annual gas production in Srednevilyuiskoye field is approximately 1.6 billion m3 and 80 Mt of condensate.
The authors received the necessary data for the calculation of the EROI during personal interviews with geologists and technical representatives of the company. For accurate values of the weight of equipment and materials, it would be necessary to look up the technical documents, invoices,
etc. First, this is closed information. Second, all construction work was done 25 years ago, and it would take great efforts to find those documents. Because of that, we asked representatives to give the highest possible estimation, by sizing “no more than”. For example, the weight of the well casing for each well is 291 t and cement, 250 t. As a comparison, in [
5], values were taken as 94–121 t of steel, 170 t of cement.
On field electricity and thermal energy are produced by a gas turbine station. Energy costs are directly proportional to production volume. Currently, the volume of production has stabilized at the point of 1.6 billion m3 per year. Production of this amount of gas requires burning of about 13 million m3 of gas. The produced electricity and thermal energy are both used for all technological needs and the needs of the village next to the field. In addition, about 1500 tons of fuel are annually consumed for operation needs (repairs of wells and equipment, transportation of goods, etc.). We do not have data on the company’s energy consumption in the previous years. This is because YATEC is a small company, and managers and company owners right now do not see any advantage in providing public reports on energy and material consumption.
The results of laboratory analysis of the characteristics of the produced gas and condensate from Srednevilyuiskoye field are the following:
- (1)
Calorific value of gas, 8428 kcal/m3 or 35.4 MJ;
- (2)
Calorific value of condensate, 9880 kcal/kg or 41.5 MJ.
At the end of 2013, 77 wells were drilled in total. Approximately 400 tons of fuel were consumed to drill each well. This included place preparation, transportation of the drilling rig, drilling and delivery of materials. In total, drilling of 77 wells took about 30,800 tons of fuel. The mass of steel casing for all wells is about 22,464 tons. The mass of cement for fixing the casing in one well for the conditions of Srednevilyuiskoye field is about 250 tons. In total, all wells required 19,250 tons of cement. Twenty six of 77 wells were decommissioned. About 1300 tons of fuel and 2000 tons of cement were required for decommissioning in total.
The mass of the on-field gas pipelines is 10,180 tons of steel. Construction of the gas pipelines took about 3000 tons of fuel.
On the field, there are tanks for the storage of gas condensate. The total volume of tanks is 64,000 m3. The mass of the tanks is 2600 tons of steel.
The system of gas preparation includes two plants for drying and purification of gas. The mass of the first plant is 950 tons of steel, and the mass of the second one is 800 tons.
Furthermore, an area of 160,000 m
2 has been concreted. The average thickness of the concrete layer is 30 cm, and it took about 24,000 tons of cement (
Table 4).
Table 4.
Materials and fuel used on Srednevilyuiskoye field.
Table 4.
Materials and fuel used on Srednevilyuiskoye field.
| No. | Materials | Quantity, mt |
|---|
| 1 | Fuel | 35,100 |
| 2 | Steel in total | 36,994 |
| 2.1 | Well casing | 22,464 |
| 2.2 | on-field gas pipeline | 10,180 |
| 2.3 | Plants for gas preparation | 1750 |
| 2.4 | Tanks | 2600 |
| 3 | Cement | 45,250 |
At the bottom line, we must conclude that at the moment, reports from gas companies have very few data on energy and material consumption. The data that are given in reports are enough to make a preliminary EROI calculation, but not enough to make advanced calculations and analysis. This can be done in the future with additional data provided in reports.
Unfortunately, we do not have any independent database on the energy consumption issue that we can use in addition to the data from companies reports.
3. EROI Methodology
There are three approaches to calculating EROI [
2], which have been repeatedly spoken of in previously published articles. The first consists of calculating the energy spent for production, which is expressed in energy units (kWh, Gcal, fuel tons,
etc.) and then relate it with an extracted volume of energy. However, often, it happens that there is no data on the consumption of energy. In this case, it is possible to utilize the second approach and calculate EROI through energy intensities. The second approach is used more often, as it often appears too difficult to obtain data on the consumption of energy and materials. The third way is to use a combined approach.
In this article, we will focus on the first method.
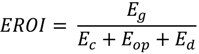
As it was written in previous articles, the definition and general formula of the EROI calculation for the lifetime of any energy project is as follows [
10]:
where:
Eg, energy gained;
Ec, energy input to construction;
Eop, energy required to operate and maintain the project;
Ed, energy required for decommission.
The most difficult question is what to consider as “an energy input” for each project’s stage? There are five boundaries for energy inputs, and for each boundary, a special EROI is determined [
10]:
- (1)
Direct energy and material inputs (EROI1,d);
- (2)
Direct and indirect energy and material inputs (EROIstnd);
- (3)
Direct and indirect energy and material inputs and indirect labor consumption (EROI1,lab);
- (4)
Direct and indirect energy and material inputs, indirect labor consumption and auxiliary services consumption (EROI1,aux);
- (5)
Direct and indirect energy and material inputs, indirect labor consumption, auxiliary services consumption and environmental (EROI1,env).
In this article, we will calculate EROI
1,d, but before, we must specify all energy inputs for the gas field development project. The energy and material inputs for the following activities will be considered as “direct”:
- (1)
Construction:
Drilling rig mobilization, site preparation, demobilization;
Well drilling;
Well completion;
Steel for well casing;
Concrete for well casing;
On-site engines and similar equipment;
Steel and construction for associated necessary pipelines;
- (2)
Operation:
Electricity used for gas extraction;
Electricity used for gas primary processing and compression;
Thermal energy used for heating;
Energy and materials for additional drilling and construction;
Energy and materials for repairs;
- (3)
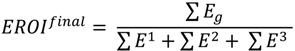
All activities can be divided into three stages of the gas field development project (
Figure 1).
Figure 1.
Energy input and output from a gas field development project.
Figure 1.
Energy input and output from a gas field development project.
Based on the scheme, we can specify EROI formulas for gas production:
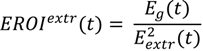
- (1)
EROI for extraction in one year:
EROIextr (t) shows the impact of reserve depletion on the energy profitability of project. It can be very useful to exclude all additional energy that is needed to drill new wells, etc., to see how reserve depletion influences energy efficiency.
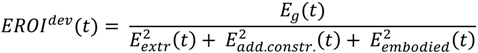
- (2)
EROI for field development in one year:
EROIdev (t) shows the impact of reserve depletion and the intensity of additional construction on the energy profitability of the project. Depending on drilling and construction intensity, it can significantly vary from year to year.
- (3)
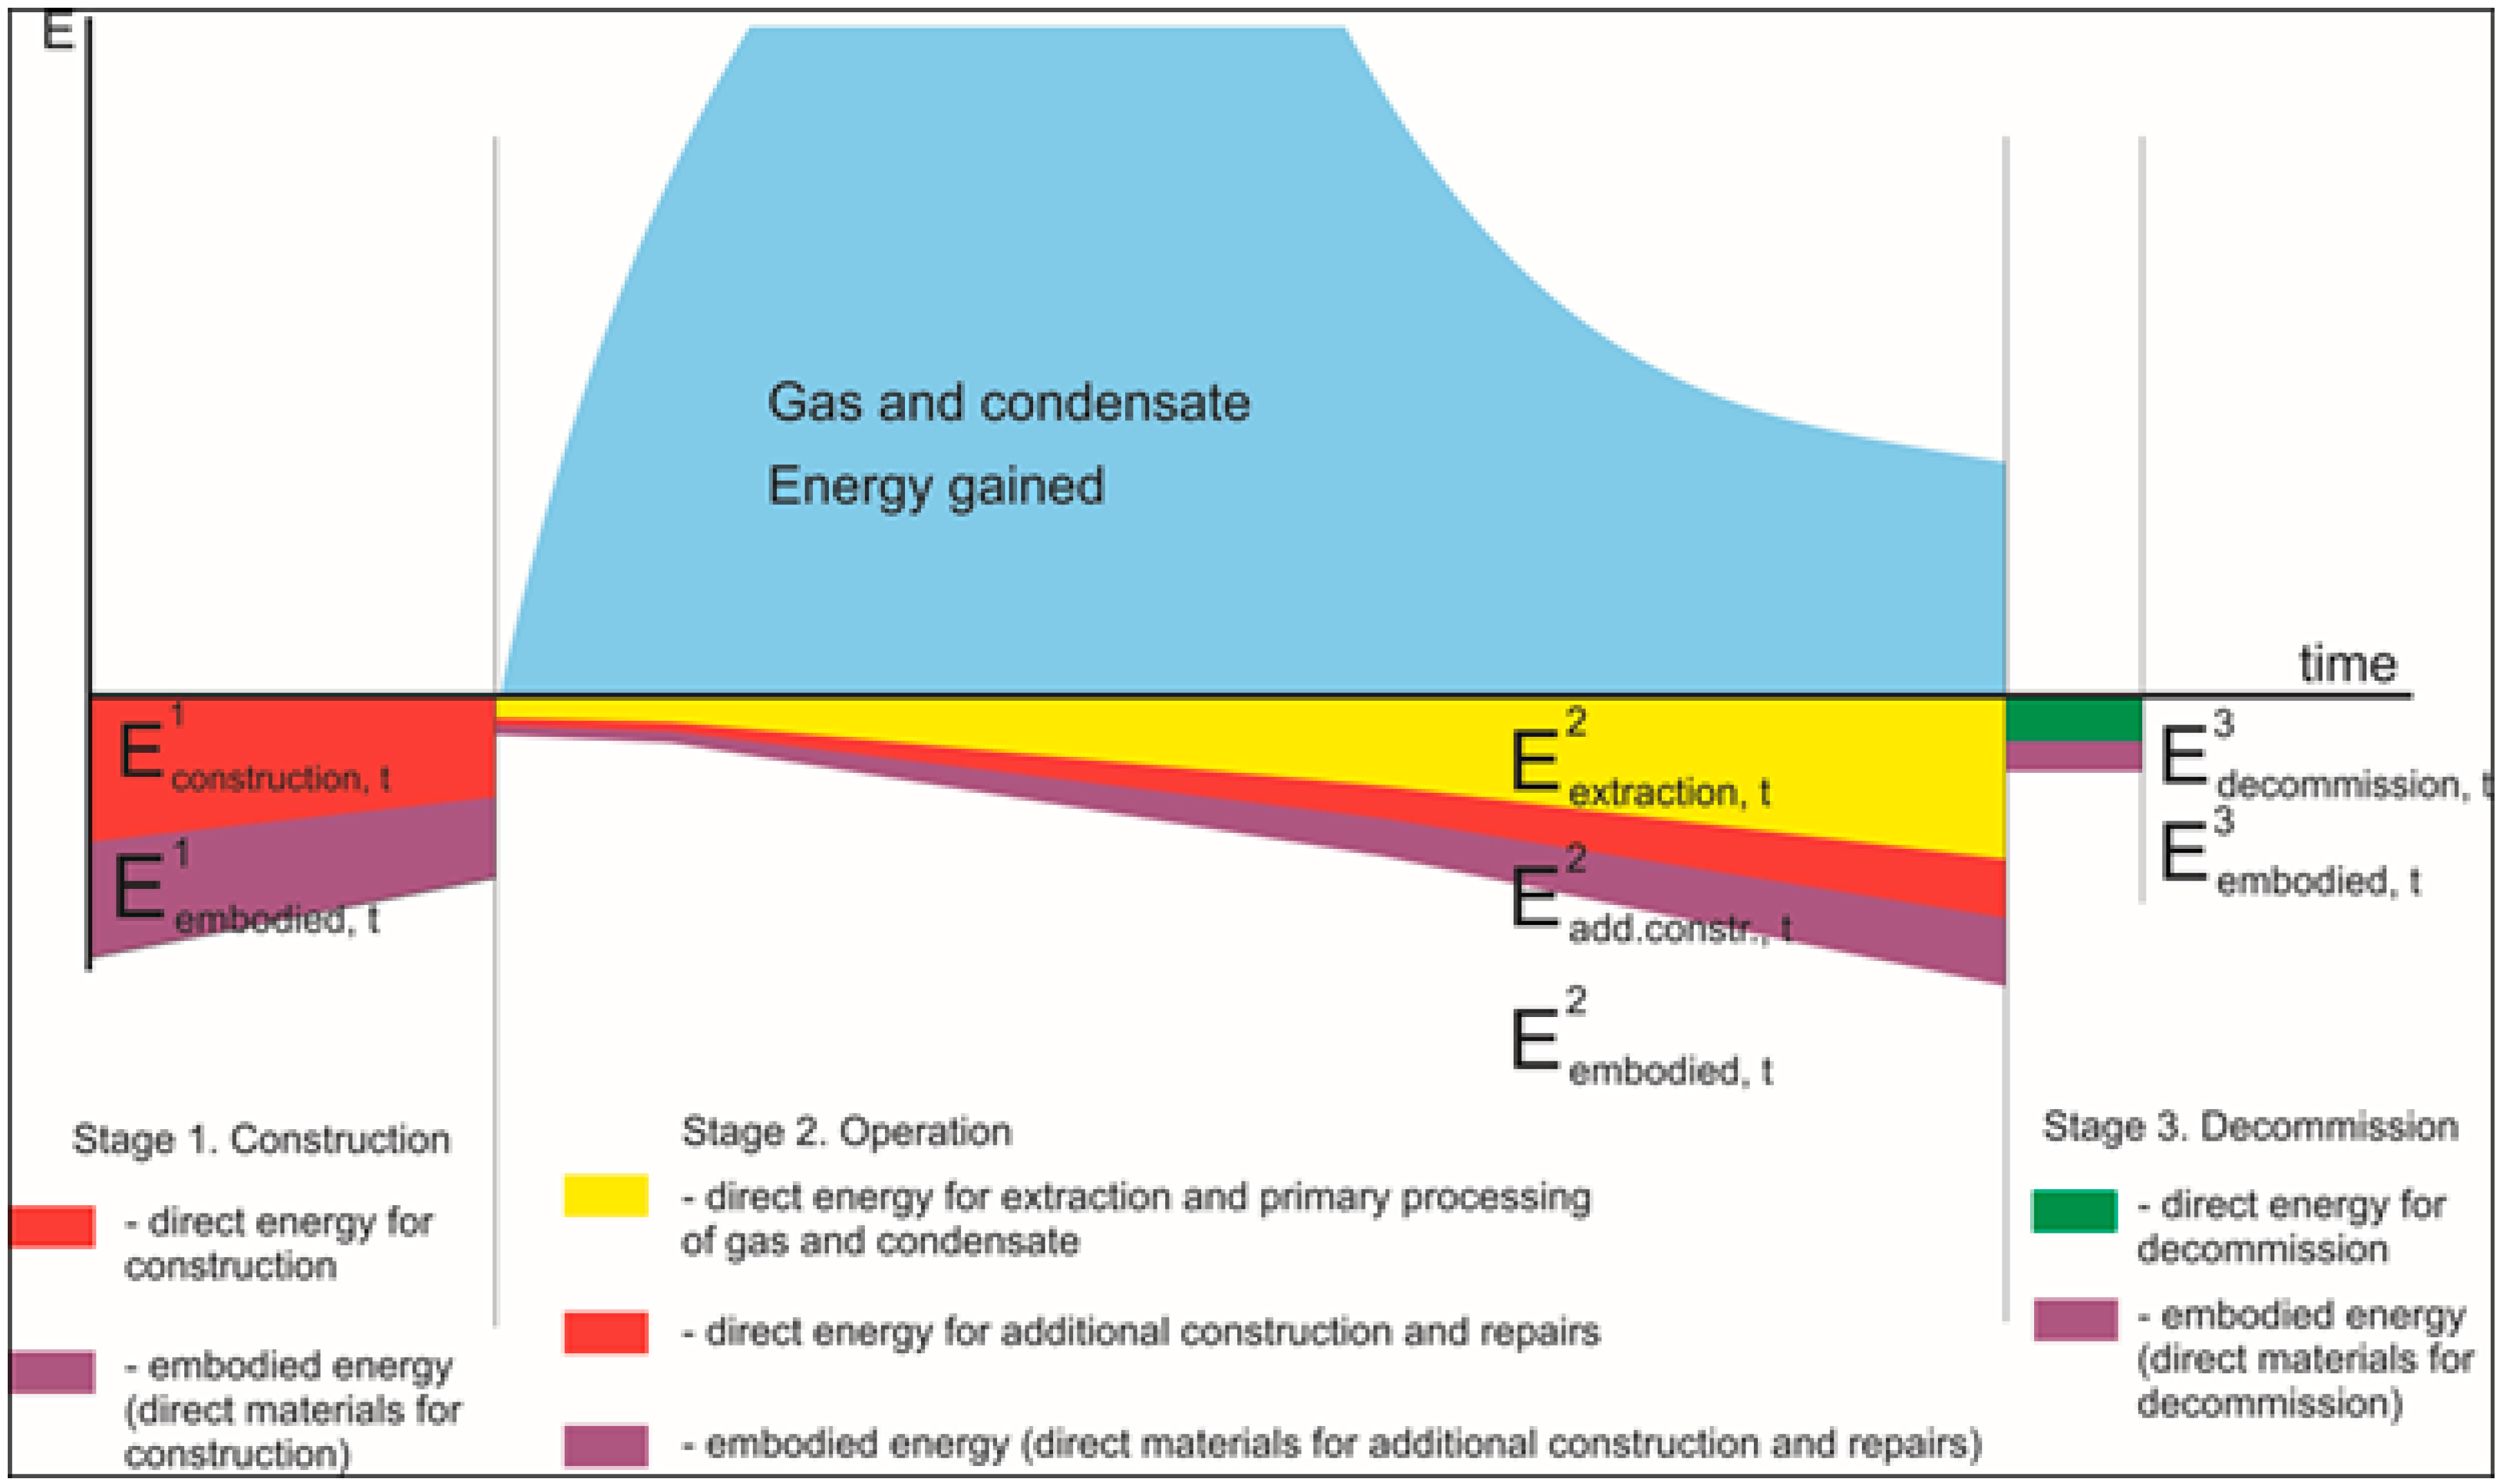
EROI final for the entire lifetime (or for certain years of the project’s life):
where:
∑Е1 = ∑Е1construction +∑Е1embodied
∑Е2 = ∑Е2extraction + ∑Е2add.constr. + ∑Е2embodied
∑Е3 = ∑Е3decomm. +∑Е3embodied
EROIfinal shows the energy result for the lifetime of the project. It should be noted that decommission energy costs can be incurred during the project operation time.
In this article, because of the lack of data, we will calculate a modified EROI
dev for hydrocarbon production in Russia, OJSC “Gazprom” and OJSC “NOVATEK”. In addition to energy for extraction and additional construction, we will add energy for gas transportation. Furthermore, only part of the embodied energy will be taken into calculation; to be specific, the embodied energy for materials used for well construction. The formula is:
For OJSC “YATEC”, EROI
extr(t) and EROI
final will be calculated for 28 years of development. In order to calculate the EROI, the following conversion factors will be used (
Table 5).
Table 5.
Conversion factors.
Table 5.
Conversion factors.
| Entity | MJ | Tons of Oil Equivalent |
|---|
| 1 ton of oil | 41,868 | 1 |
| 1000 m³ of natural gas | 36,000 | 0.86 |
| For producing of 1 MWh are used | - | 0.209 |
| For producing of 1 Gcal are used | - | 0.992 |
| For production of 1 t of steel are used | 31,250 | 0.746 |
| For production of 1 t of cement are used | 5000 | 0.119 |
It is necessary to note that comparisons of consumed electric power, thermal energy and an energy equivalent of fossil fuels are very important issues. In Russia, a widespread practice of an assessment of the production efficiency of electric power and thermal energy is specific to fuel consumption in the production of 1 kWh and 1 Gcal. In our calculations, we will use the actual values of the consumption of fuel for production electric power and heat energy at JSC “Tatneft” enterprises, the data is displayed in the table above.
Unfortunately, we do not have data on material consumption for gas production in the public domain. We only can give an estimation of steel and cement consumption based on the quantity of commissioned wells. We will assume that each well requires about 180 mt of steel and 200 mt of cement. For accurate calculations, of course, we need official data. All companies have such data, and it can be given in annual reports along with energy consumption.
In this article, we will not give an estimation of embodied energy, which is connected with additional on-field equipment, because there is no data in the public domain.
Data on the energy consumption for the production of steel and cement are taken from the report of the British Scientists from the University of Bath [
11].
4. Results
4.1. EROI for Hydrocarbon Production in Russia
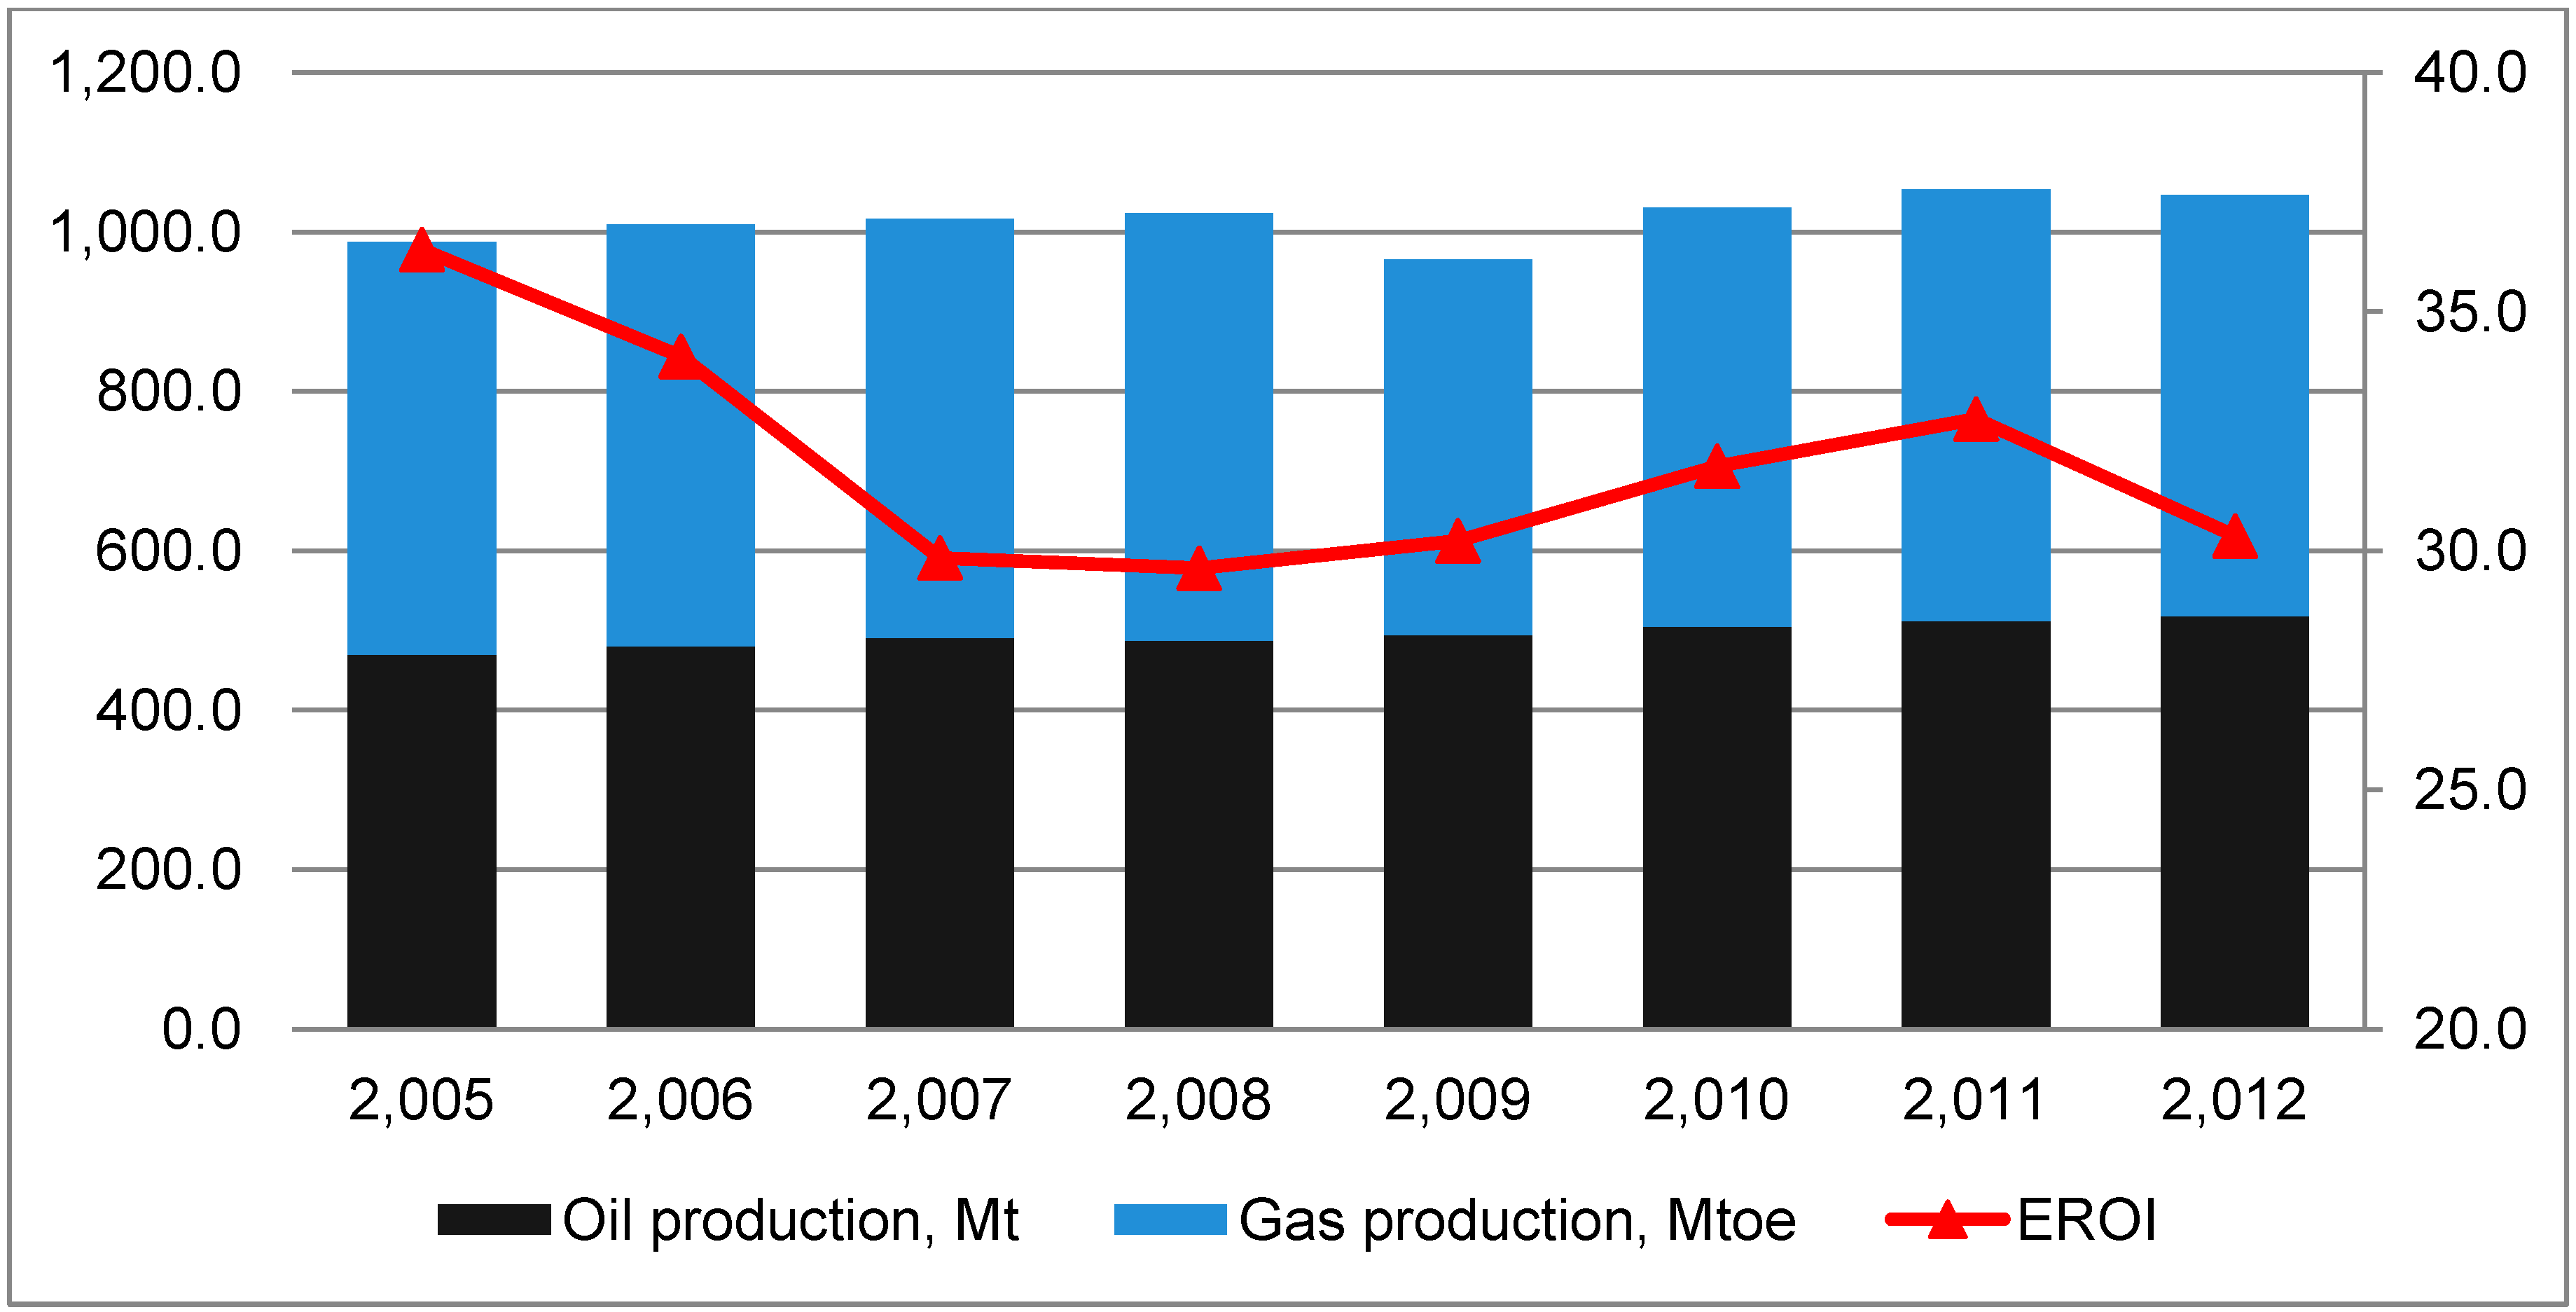
According to Russian statistic agency data, the EROI for oil and gas production and transportation is about 30 (
Table 6,
Figure 2).
Table 6.
Hydrocarbon production in Russia.
Table 6.
Hydrocarbon production in Russia.
| No. | Title | 2005 | 2006 | 2007 | 2008 | 2009 | 2010 | 2011 | 2012 |
|---|
| 1 | Production, Mtoe | 986.9 | 1009.6 | 1016.2 | 1023.4 | 965.0 | 1030.5 | 1053.3 | 1046.6 |
| 2 | Energy consumption, Mtoe | 27.2 | 29.6 | 34.0 | 34.5 | 31.9 | 32.4 | 32.2 | 34.5 |
| 3 | EROIdev and transp | 36 | 34 | 30 | 30 | 30 | 32 | 33 | 30 |
Figure 2.
Hydrocarbon production in Russia, Mtoe (left scale) and EROI (right scale) (data: Rosstat, author’s calculations).
Figure 2.
Hydrocarbon production in Russia, Mtoe (left scale) and EROI (right scale) (data: Rosstat, author’s calculations).
Obviously, with reserve depletion, production becomes more costly. The growth of energy consumption in turn leads to a decrease of the EROI. This is entirely consistent with the fact that until 2008, the EROI was continually declining. However, after 2008, the EROI increased from 30 to 33. In our opinion, this increase is due to new energy strategies in all oil and gas companies. In addition, in 2012, it decreased to 30. We believe this is mainly because of decreasing of the EROI for gas production, as will be shown below. Another factor is that the potential of energy savings is exhausting.
4.2. EROI for Gas Production in Companies
4.2.1. OJSC “Gazprom”
On the basis of data provided in the reports, we can calculate the EROI
dev and transp for OJSC “Gazprom” (
Table 7).
Table 7.
Conversion and calculation of the EROIdev and transp.
Table 7.
Conversion and calculation of the EROIdev and transp.
| No. | OJSC “Gazprom” | 2010 | 2011 | 2012 | 2013 |
|---|
| 1 | Hydrocarbons production, ktoe | 448,696 | 453,452 | 431,620 | 433,864 |
| 2 | Energy consumption, ktoe | 5540 | 5873 | 5718 | 5419 |
| 3 | Steel consumption, ktoe | 11.8 | 25.1 | 40.0 | 17.9 |
| 4 | Cement consumption, ktoe | 2.1 | 4.5 | 7.1 | 3.2 |
| 5 | EROI without embodied energy (1/2) | 81.0 | 77.2 | 75.5 | 80.1 |
| 6 | EROI with embodied energy (1/(2 + 3 + 4)) | 80.8 | 76.8 | 74.9 | 79.8 |
As can be seen from the calculations, the EROI is relatively high compared to the average EROI for hydrocarbon production in Russia.
The calculations demonstrate that the EROI is slightly declining. Among the possible factors, two main ones can be noted:
- (1)
The depletion of existing fields and the need for the development of new fields located in remote areas;
- (2)
Construction of new lines for the main gas pipeline and increasing energy consumption in transportation.
4.2.2. OJSC “NOVATEK”
On the basis of these data, we can calculate the EROI
dev and transp for OJSC “NOVATEK” (
Table 8).
Table 8.
Conversion and calculation of the EROI.
Table 8.
Conversion and calculation of the EROI.
| No. | OJSC “NOVATEK” | 2010 | 2011 | 2012 | 2013 |
|---|
| 1 | Hydrocarbons production, ktoe | 36,108 | 50,110 | 53,578 | 58,192 |
| 2 | Energy costs, ktoe | 280 | 477 | 697 | 822 |
| 3 | Steel consumption, ktoe | | 1.6 | 5.6 | 11.7 |
| 4 | Cement consumption, ktoe | | 0.3 | 1.0 | 2.1 |
| 5 | EROI without embodiment energy (1/2) | 129.1 | 105.2 | 76.9 | 70.8 |
| 6 | EROI with embodiment energy (1/(2 + 3 + 4)) | 129.1 | 104.7 | 76.2 | 69.6 |
As can be seen from the table, along with the increase in production, the EROI significantly declined during the period 2010–2013. Answers, such as the factors and how they reduce EROI, can be given only with additional data on energy consumption. At the moment, it can be assumed that the decrease of the EROI is associated with increased drilling activity and involvement in the development of more energy costly gas fields.
4.2.3. OJSC “YATEK”
We have all of the data to calculate the EROI
extr at the start of pipeline on Srednevilyuiskoye field (
Table 9).
Table 9.
The EROI for the gas and condensate production on Srednevilyuiskoye field in 2013.
Table 9.
The EROI for the gas and condensate production on Srednevilyuiskoye field in 2013.
| No. | Name | Quantity | Oil Equivalent, kt |
|---|
| 1 | Production in 2013 | | |
| 1.1 | Gas, Mm3 | 1623 | 1372.3 |
| 1.2 | Condensate, t | 80,267 | 79.6 |
| 2 | Operational costs in 2013 | | |
| 2.1 | Gas, Mm3 | 13 | 11.0 |
| 2.2 | Fuel, t | 1500 | 1.5 |
| 2.3 | EROIextr (1.1 + 1.2)/(2.1 + 2.2) | | 116 |
In 2013, there were not any capital works (drilling, decommissioning, etc.) All material and energy costs were made to maintain gas production and to do minor repairs of field equipment. EROIextr for gas production calculated at the start of the pipeline is 116; this is a high value. The pressure of gas at the wellhead is enough to make primal procession of gas and to put it in the pipeline. We must underline that it is EROIextr for compressed gas at the start of the pipeline. Taking into calculation the energy costs for transportation (500 km pipeline), the EROI will decline, and in Yakutsk, it is expected to be below 100.
For calculation of EROI
final, we need data on operational energy consumption for the entire lifetime. We do not have these data. The authors made the assumption (realizing that this is a very significant assumption) that the operating energy costs in the past were proportionally the same as now. Then, we made a calculation of the EROI
final for the whole period of field development: the ratio of total output of energy for 28 years to the volume of all (direct and embodied) energy consumed during the same period (
Table 10).
With certain conditions, we can say that the EROI of the gas production on Srednevilyuiskoye field at the start of the pipeline for 28 years stands at 80. This is a high value, and this once again confirms the fact that the traditional gas is a highly efficient energy resource, both economically and energetically.
Table 10.
The EROIfinal of the gas and condensate production on Srednevilyuiskoye field for 28 years of development.
Table 10.
The EROIfinal of the gas and condensate production on Srednevilyuiskoye field for 28 years of development.
| No. | Name | Quantity | Oil Equivalent, kt |
|---|
| 1 | Production for 28 years | | |
| 1.1 | Gas, mln m3 | 32,500 | 27,479.2 |
| 1.2 | Condensate, kt | 1923 | 1906.1 |
| 1.3 | Total | | 29,385.3 |
| 2 | Operational costs | | |
| 2.1 | Gas, mln m3 | 281 | 237.9 |
| 2.2 | Fuel, t | 42,000 | 44.1 |
| 2.3 | Material and fuel capital costs | | 70 |
| 2.4 | Decommissioning costs | | 0.9 |
| 2.5 | Total | | 223.4 |
| 3 | EROI (1.3/2.5) | | 83 |
5. Discussion of the Results
Calculations show that the EROI of the gas production in Russia is declining (
Table 11).
Table 11.
EROI for gas production.
Table 11.
EROI for gas production.
| No. | Company | 2010 | 2011 | 2012 | 2013 |
|---|
| 1 | Gazprom | 81 | 77 | 75 | 80 |
| 2 | NOVATEK | 129 | 105 | 76 | 70 |
| 3 | YATEC | - | - | - | 116 |
| 4 | Hydrocarbon production in Russia | 32 | 33 | 30 | - |
It should be kept in mind that the calculations for Gazprom and NOVATEK include energy costs for the production and transportation of gas. Without transportation at the start of the pipeline, we calculated the EROI for traditional gas at about 116. For shale gas, the EROI of course must be lower, because more drilling activity is needed, as well as fracturing. As we might have expected, the EROI for the gas production is high; however, we need more accurate calculations with additional data.
It should be noted that the EROI for gas production is higher than the average EROI for hydrocarbon production in Russia. This means that the EROI for oil production must be below the average level. At the same time, the EROI for the gas production is declining, and this means that the gas production is negatively affecting the dynamics of the EROI for hydrocarbon production in Russia.
Accurate calculation and deep analysis of EROI
extr and EROI
dev requires more data, specifically:
- (1)
Energy cost for extraction;
- (2)
Energy cost for additional drilling and construction;
- (3)
Material costs;
- (4)
Energy cost for transportation.
Companies have these data, and it can be published in reports.
In fact, the question should be wider than just calculating EROI for particular energy resources. We should put the question of the introduction of an energy audit by analogy with the financial audit. Calculation of the energy efficiency should be based on the analysis of actual data of energy consumption by sectors of activities. From this point of view, we emphasize that the EROI should be considered as part of the more general issue of the introduction of an energy audit in the oil and gas industry.
An energy audit should be based on the same principles as a financial audit. It is necessary to work out in detail the list of data to be collected, and that will be the basis of all calculations. Further, we should define the list of performance indicators, which also will include EROI. Methods of calculation of indicators should be the same for all companies, in order to have an opportunity to compare the performance of one company with another.


