A Dynamic Model for Construction and Demolition (C&D) Waste Management in Spain: Driving Policies Based on Economic Incentives and Tax Penalties


Abstract
:
1. Introduction
2. Generation and Recycling of C&D Waste in the EU

| Country | RCD * | % Recycled | Country | RCD * | % Recycled |
|---|---|---|---|---|---|
| Denmark | 5,27 | 94% | Malta | 0,8 | 0% |
| Estonia | 1,51 | 92% | Netherlands | 23,9 | 98% |
| Finland | 5,21 | 26% | Poland | 38,19 | 28% |
| France | 85,65 | 45% | Portugal | 11,42 | 5% |
| Germany | 72,40 | 86% | Romania | 21,71 | 0% |
| Greece | 11,04 | 5% | Slovakia | 5,38 | 0% |
| Hungry | 10,12 | 16% | Slovenia | 2,00 | 53% |
| Ireland | 2,54 | 80% | Spain | 31,34 | 14% |
| Italy | 46,31 | 0% | Sweden | 10,23 | 0% |
| Letonia | 2,32 | 46% | UK | 99,10 | 75% |
| Lithuania | 3,45 | 60% | EU-27 | 531,38 | 46% |
| Luxembourg | 0,67 | 46% |
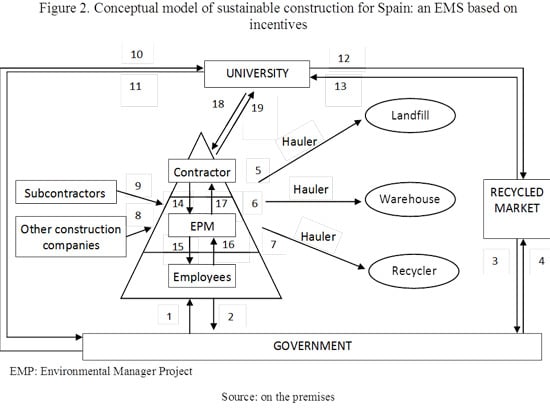
3. Policy Implications in the 3R Regulations: A Conceptual Model of Sustainable Construction for Spain
| Political Barriers | Non reliability data on recovery and recycling rates of C&D waste in the EU and its manner of collection |
| Lack of control over C&D waste management plans approved by national and regional governments | |
| Legislation independent and highly dispersed at regional level | |
| Social Barriers | Lack of coordination between the agents involved in C&D waste management |
| No initiatives to launch information and awareness programs for agents involved in the sector | |
| Lack of enforcement and unclear responsibility of the 3Rs regulations | |
| Economic Barriers | Constructors usually do not include specific allocations for C&D management |
| Constructors do not facilitate waste management plans by including them in the technical specifications | |
| Constructors do not currently fulfill their obligations as producers of hazardous waste due to the high costs of managing C&D waste and the imprecision of current legislation | |
| Technical Barriers | Constructors do not make provision for the use of recycled material |
| Technical standards do not make provision for the use of recycled material | |
| No EU legislation to regulate installations for the treatment of C&D waste |
3.1. The Role of Government in the 3R Regulations
3.2. The Role of Universities in the 3R Regulations
3.3. The Role of Construction Companies in the 3R Regulations
- (a)
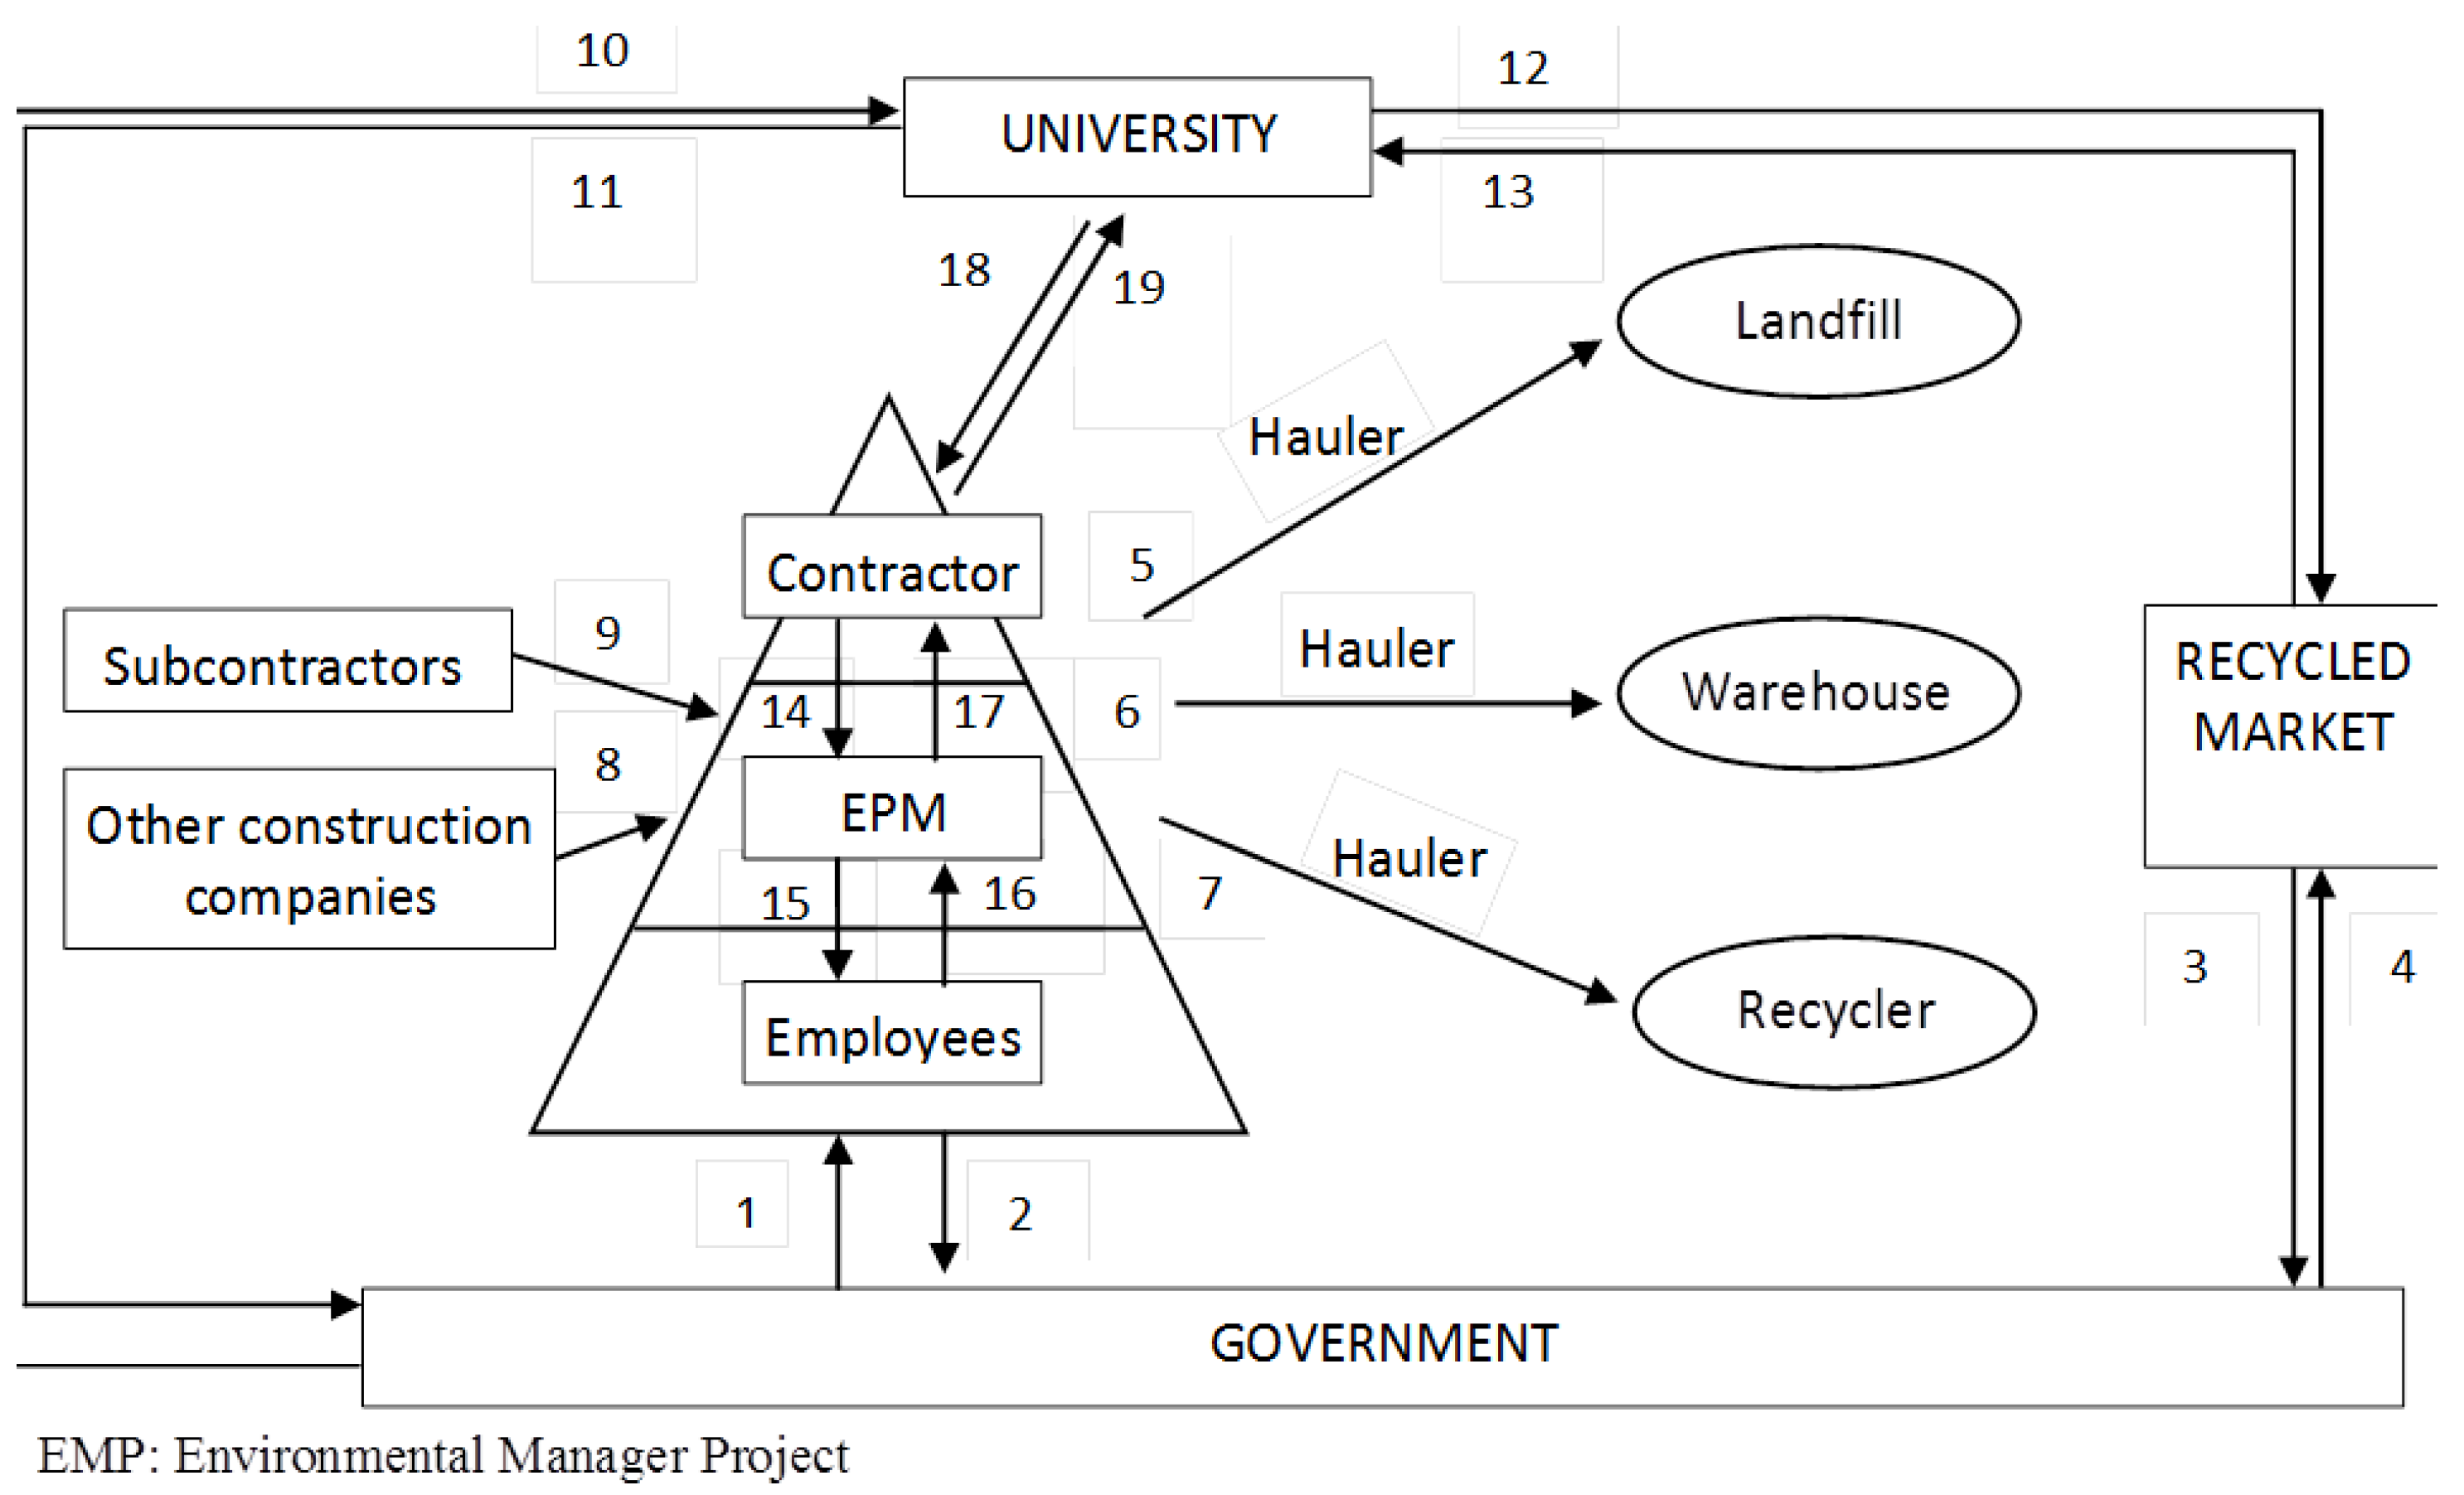
- Generation reduction: In the generation phase, it is essential to monitor the collection and selection of different materials at the beginning of the cycle to eliminate the costs and storage space. Since the reduction of waste by construction companies (generators) has become a very complex task, the importance of specialized staff for directing the waste management tasks has emerged as an important new topic [25]. Reinforcing the external control of public supervisors, an effective in-house measure would be the creation of the so-called Environmental Project Manager (EPM). Its main function would be to enforce mandatory source separation with the advantages of time and cost savings in the subsequent recycling process and preventing the severe barrier to recycling through the pretreatment of waste prior to being taken to landfill [23,26]. This information would be forwarded to the managing directors and will serve to review and improve waste management plans in the future (Lines 14 and 17). The channels of information flow from top to bottom and from bottom to top (lines 15 and 16). On the other hand, despite the lack of European legislation to regulate installations for the treatment of C&D wastes, it would be highly recommended the creation of a net of public facilities [3]. Technology difficulties can be avoided by means of grants to purchase equipment that minimize waste generation and reduce adverse effects on human health [26]. The development of green technologies (low waste building technology) will help increase employees’ work safety and raise awareness of C&D waste environmental problems. As large capital investments are not normally required, the cost to the construction companies is reduced. Otherwise, there could be tax benefits (for example, accelerated depreciation) for purchases over a certain amount of money. Indeed, funded firms are significantly more R&D-active than non-funded firms [27]. In any case, this expenditure could be considered as an investment because it leads to a reduction in costs (reducing the amount of waste generated) and, therefore, the negative externalities caused by C&D waste. These grants can also be applied in the recycled plants (Line 4).
- (b)
- Disposal recovery: The main political measures for reducing the quantities of waste disposed in landfills are an effective charge system [24]. Waste management aimed at recycling is expensive because it is necessary to transport waste to recycling plants after the previous process of separation. Without the existence of adequate controls, construction companies have a high incentive to send the waste directly to landfill without treatment. Therefore, under the principle “the polluter must pay” [14], an effective measure may be increasing the cost of landfill disposal by means of effluent charges. The greater the amount of waste deposited, the greater the charge to pay and, therefore, greater incentives to recycle. The Spanish legislation (PNIR) recommends implementing a deposit-refund system whose rates vary with the volume of waste. This system guarantees that contractors manage their own C&D waste in an adequate way before any building or demolition permit is provided by the local authorities. C&D waste, once separated, would be brought to a warehouse for recycling (Line 6). The rest of it would be taken to landfills (Line 5). Landfill taxes or even landfill bans for specific materials might be applied to reinforce this measure.In this competition between recycling and disposal, the main measure for reducing the percentage fraction going to disposal will be tax differentiation. On one side, levies on virgin construction material increase its price and discourage its use for recovery materials (tax differentiation). This will be especially effective in places where raw materials and adequate disposal sites are scarce [18]. On the other side, the introduction of tax benefits to the use of recycled waste, as discussed next, further strengthens incentives for recycling.
- (c)
- Reuse-recycle: Firstly, the location of recycled plants is a crucial aspect for reducing transport costs and providing incentives for construction companies to recover materials from waste (Line 7). Second, a growing demand is also necessary and it depends on external factors. The recycled market would be reduced because consumers perceive less value in recycled materials [13]. To avoid this, the government needs to provide a regulatory environment to develop the recycling market, requiring certain quality standards for these products. In this case, the role of universities on developing products is crucial (Lines 4 and 12). As a complementary measure, the recycled market can also grow by promoting the use of recycled materials through the implementation of reduced sales taxes on new construction using quality recycled material (Line 3).With regard to the external relations of construction companies, two kinds of relationships can be considered: contractors–subcontractors and contractors–contractors. In the first case, business opportunities and competitiveness between companies can lead them to compare their own techniques with those of its competitors, establishing a benchmark to compare the performance of different options in the management of waste [28], including the use of recycled products. In this case, the goal of implementing economic policy instruments will be to create incentives and comparative advantage over other companies through costs (e.g., subsidies for the purchase of machinery or incorporation of new techniques for recycling) or via income (e.g. incorporate recycled materials as a condition in the award of public projects). Another option is the creation of eco-industrial parks, a community of businesses located together on a common property using each other’s wastes as materials for production (Line 8). In the second case, responsibility is dissipated among various agents. The contractor will have the final responsibility (EPR) in order to avoid the enormous costs of assigning responsibilities to each agent. The government should establish a list of authorized subcontractors with a fair price. The implementation of administrative charges for non-compliance [24] forces construction companies to keep track of the generation of waste across the project, including subcontractors’ activities (Line 9).
3.4. The Role of the Recycled Market in the 3R Regulations
4. A Model Based on Final Destination Wastes: An Application for Reusing Recycled Aggregates in Spain
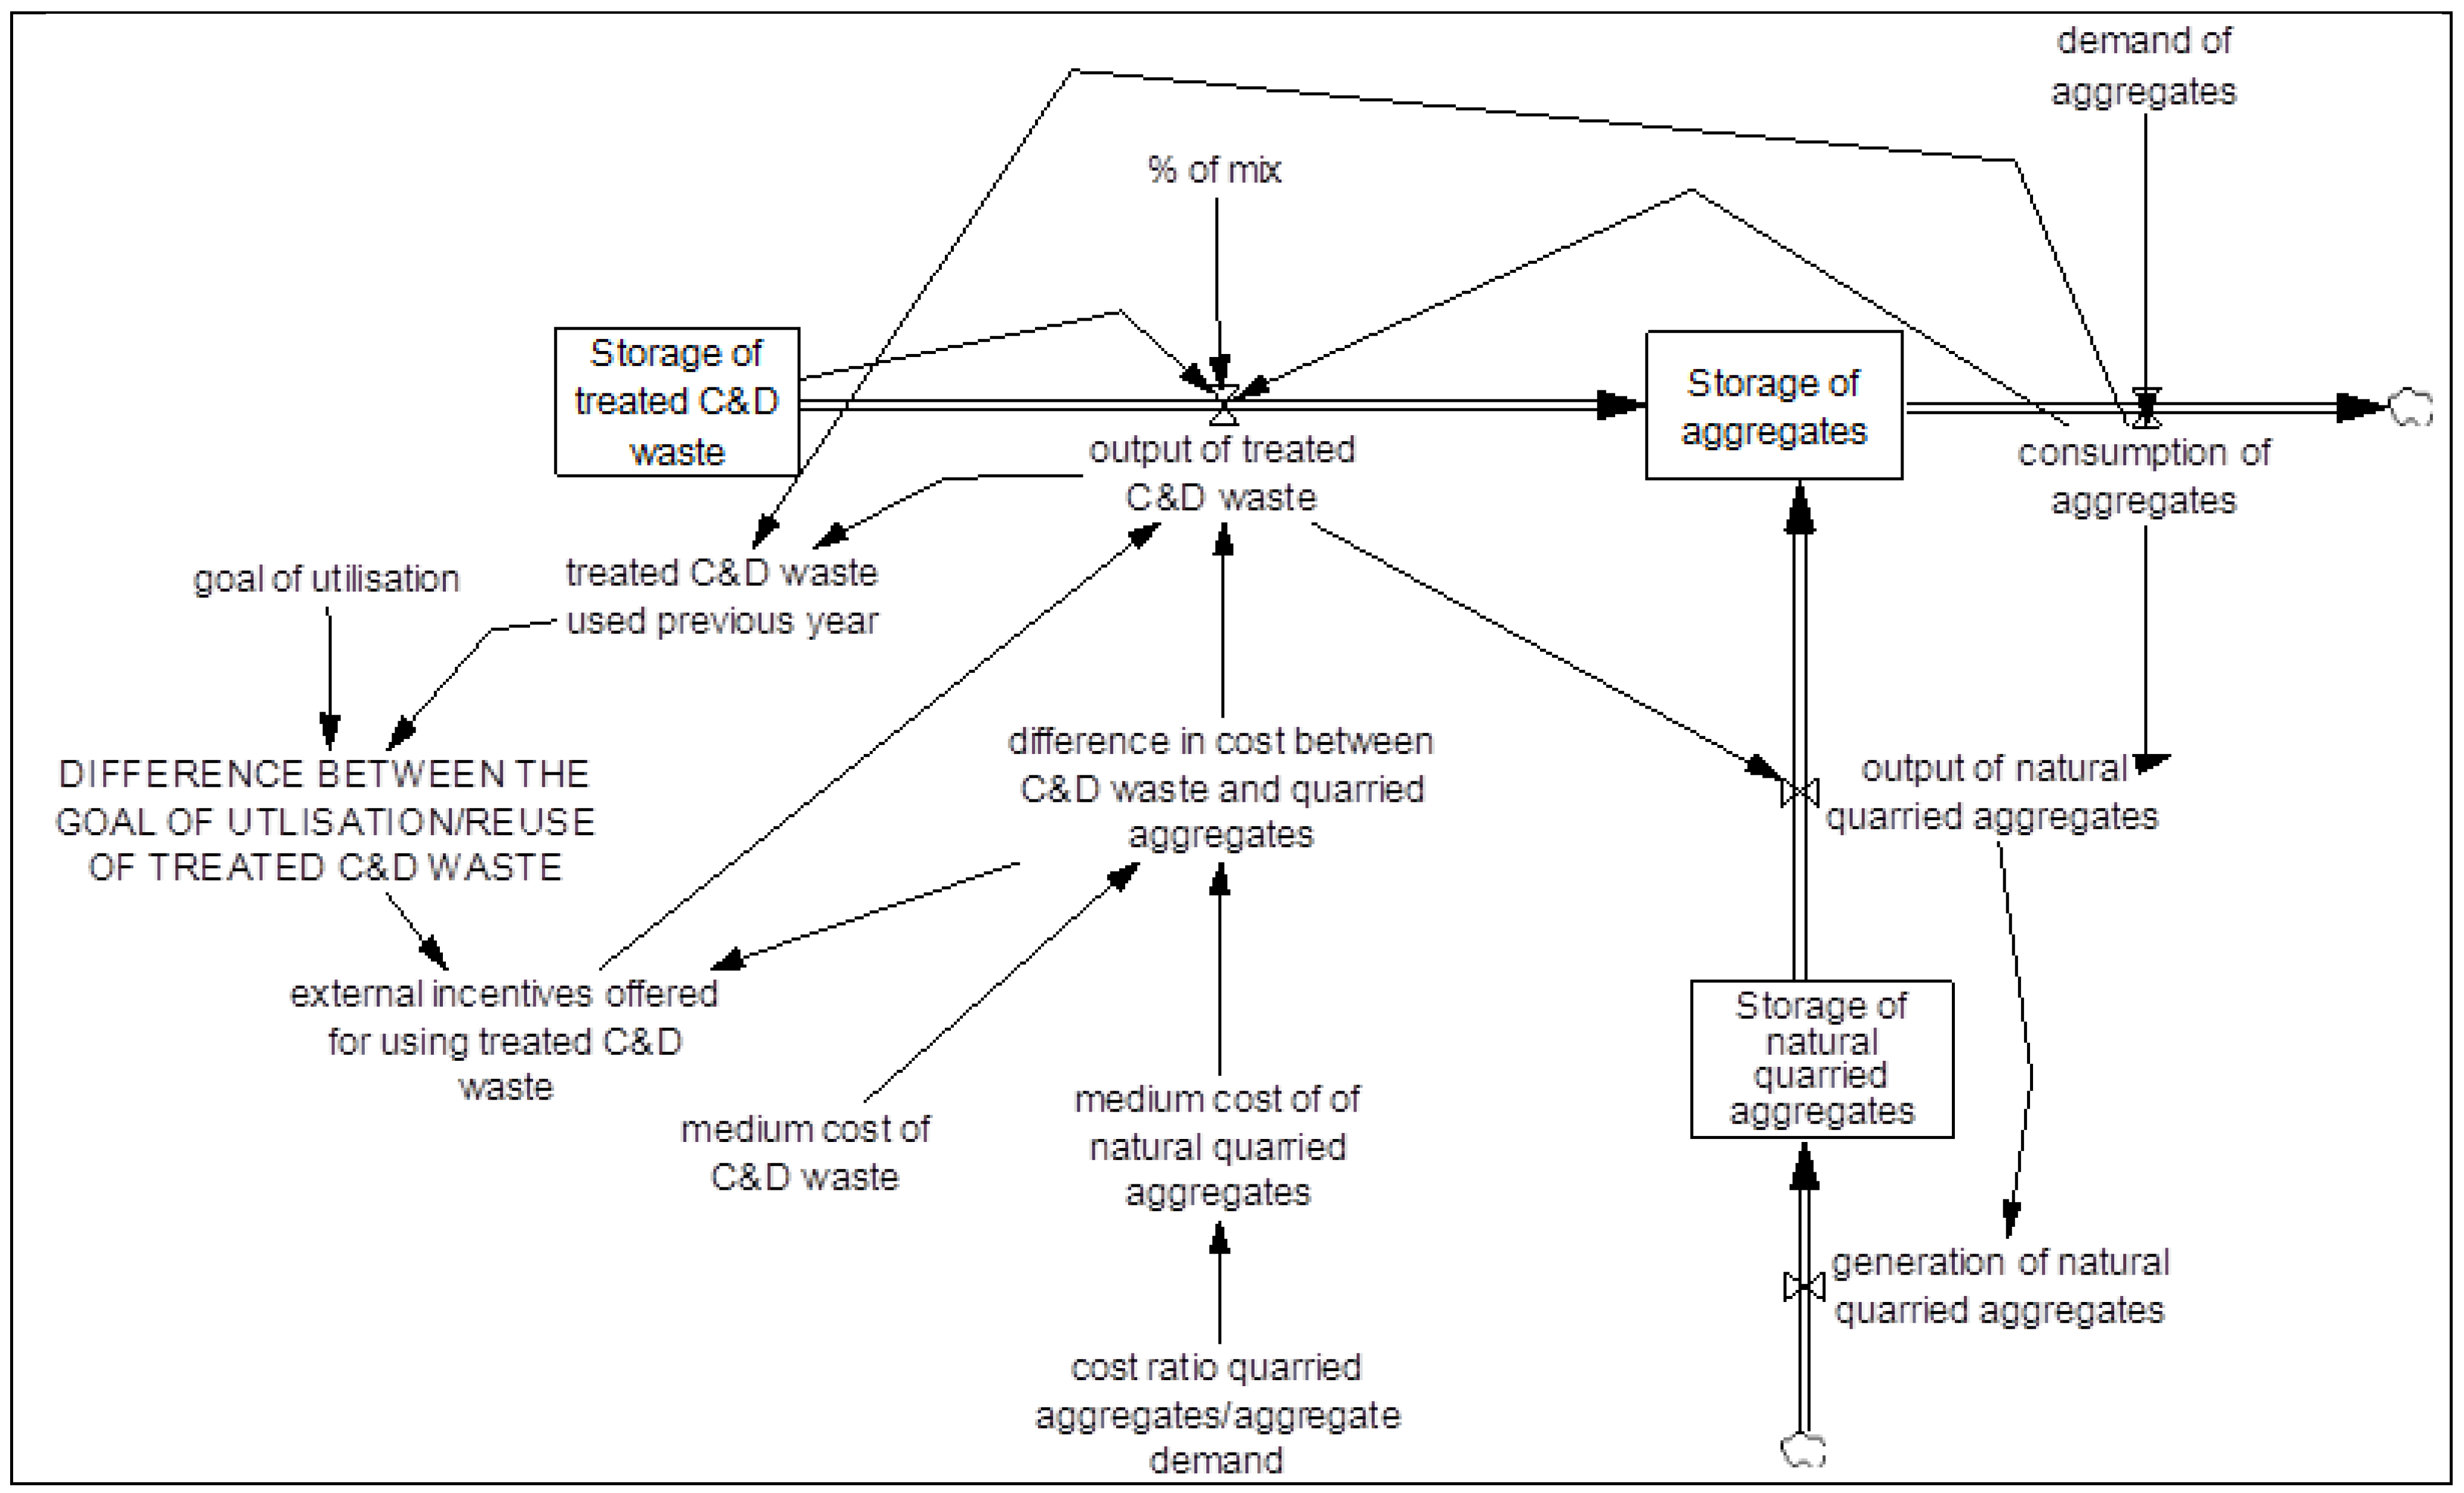
4.1. Dynamic Modeling of the Problem
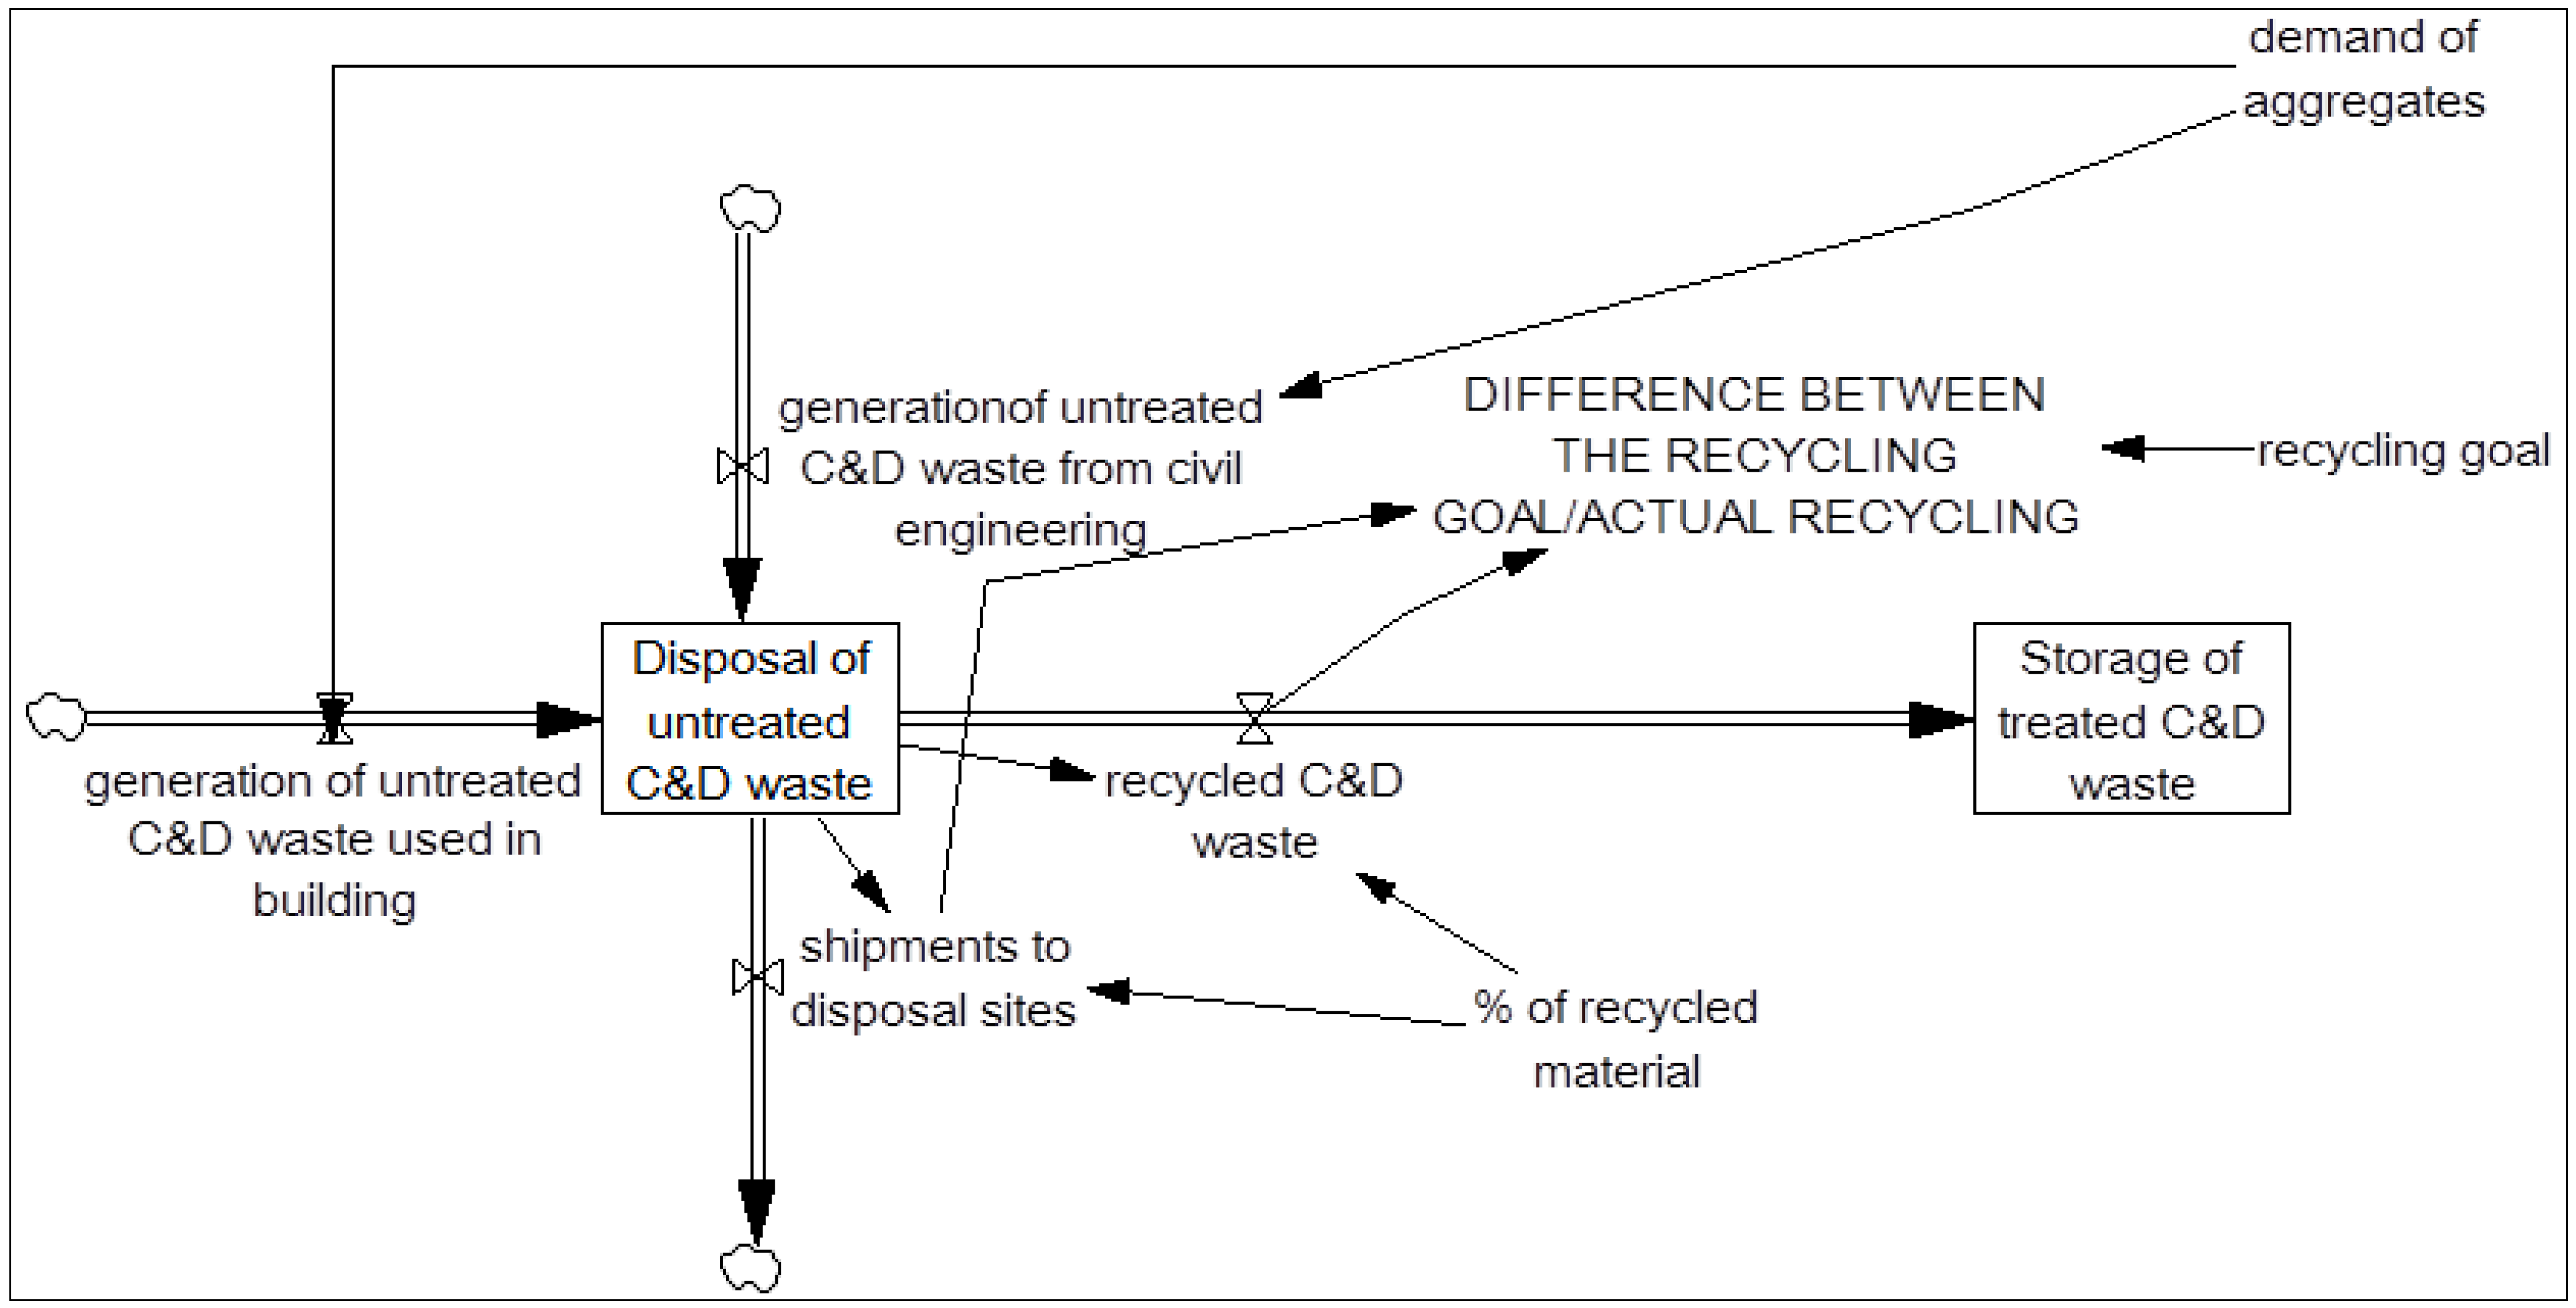

| Variable | Equation Description |
|---|---|
| Disposal of untreated C&D waste | ∫ (generation of untreated C&D waste used in building + generation of untreated C&D waste from civil engineering-shipments to disposal sites-recycled C&D waste) |
| Storage of treated C&D waste | ∫ (recycled C&D waste-output of treated C&D waste) |
| Storage of natural quarried aggregates | ∫ (generation of natural quarried aggregates-output of natural quarried aggregates) |
| Storage of aggregates | ∫ (output of natural quarried aggregates + output of treated C&D waste-consumption of aggregates) |
| Generation of untreated C&D waste used in building | (Total C&D waste consumption/ Total C&D waste generation)* (C&D waste consumption building/ Total C&D waste consumption) * demand of aggregates) |
| Recycled C&D waste | % of recycled material* Disposal of untreated C&D waste |
| Generation of untreated C&D waste from civil engineering | (Total C&D waste consumption/ Total C&D waste generation)* (C&D waste consumption civil engineering/ Total C&D waste consumption) *demand of aggregates) |
| Shipments to disposal sites | (1% of recycled material)* Disposal of untreated C&D waste |
| Difference between the recycling goal/Actual recycling | recycling goal-(recycled C&D waste/(recycled C&D waste + shipments to disposal sites)) |
| Output of natural quarried aggregates | consumption of aggregates-output of treated C&D waste |
| Difference in cost between C&D waste and quarried aggregates | medium cost of C&D waste/medium cost of natural quarried aggregates |
| Difference between the goal of utilization /Reuse of treated C&D waste | goal of utilization-treated C&D waste used previous year |
| Output of treated C&D waste | IF THEN ELSE (Storage of treated C&D waste > 0, IF THEN ELSE ((difference in cost between C&D waste and quarried aggregates\<1: OR: external incentives offered for using treated C&D waste>0),% of mix* consumption of aggregates, 0), 0) |
| Consumption of aggregates | IF THEN ELSE (demand of aggregates > 0, demand of aggregates, 0) |
| generation of natural quarried aggregates | output of natural quarried aggregates |
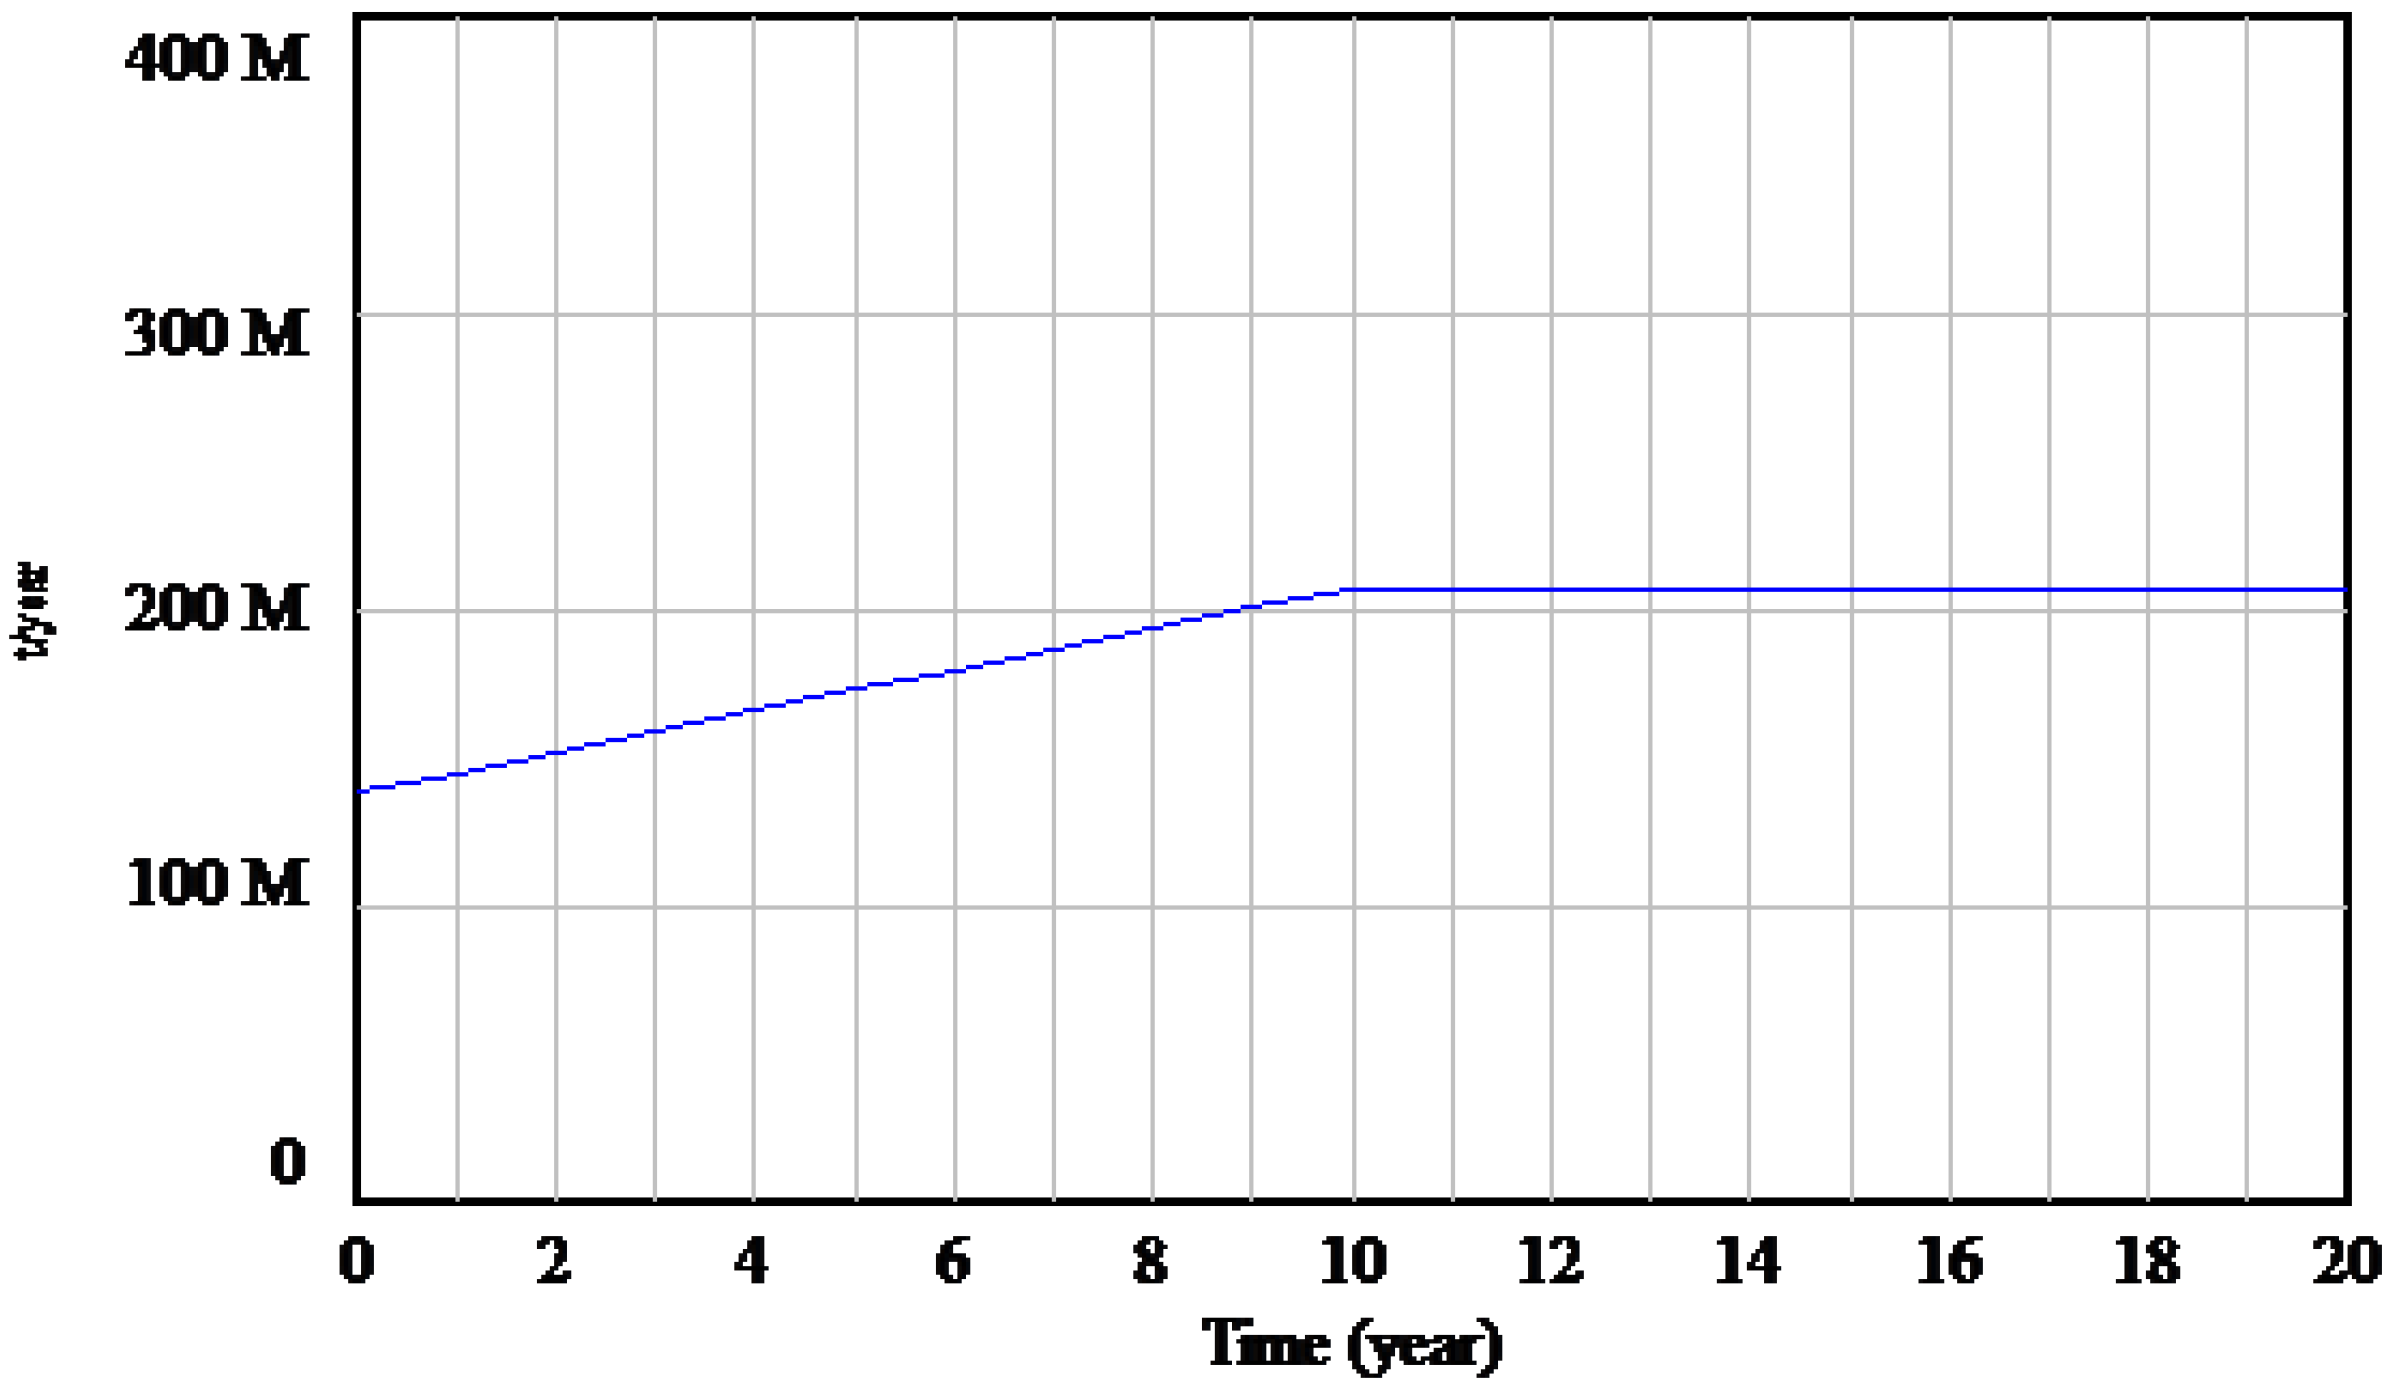
4.2. Modeling Results

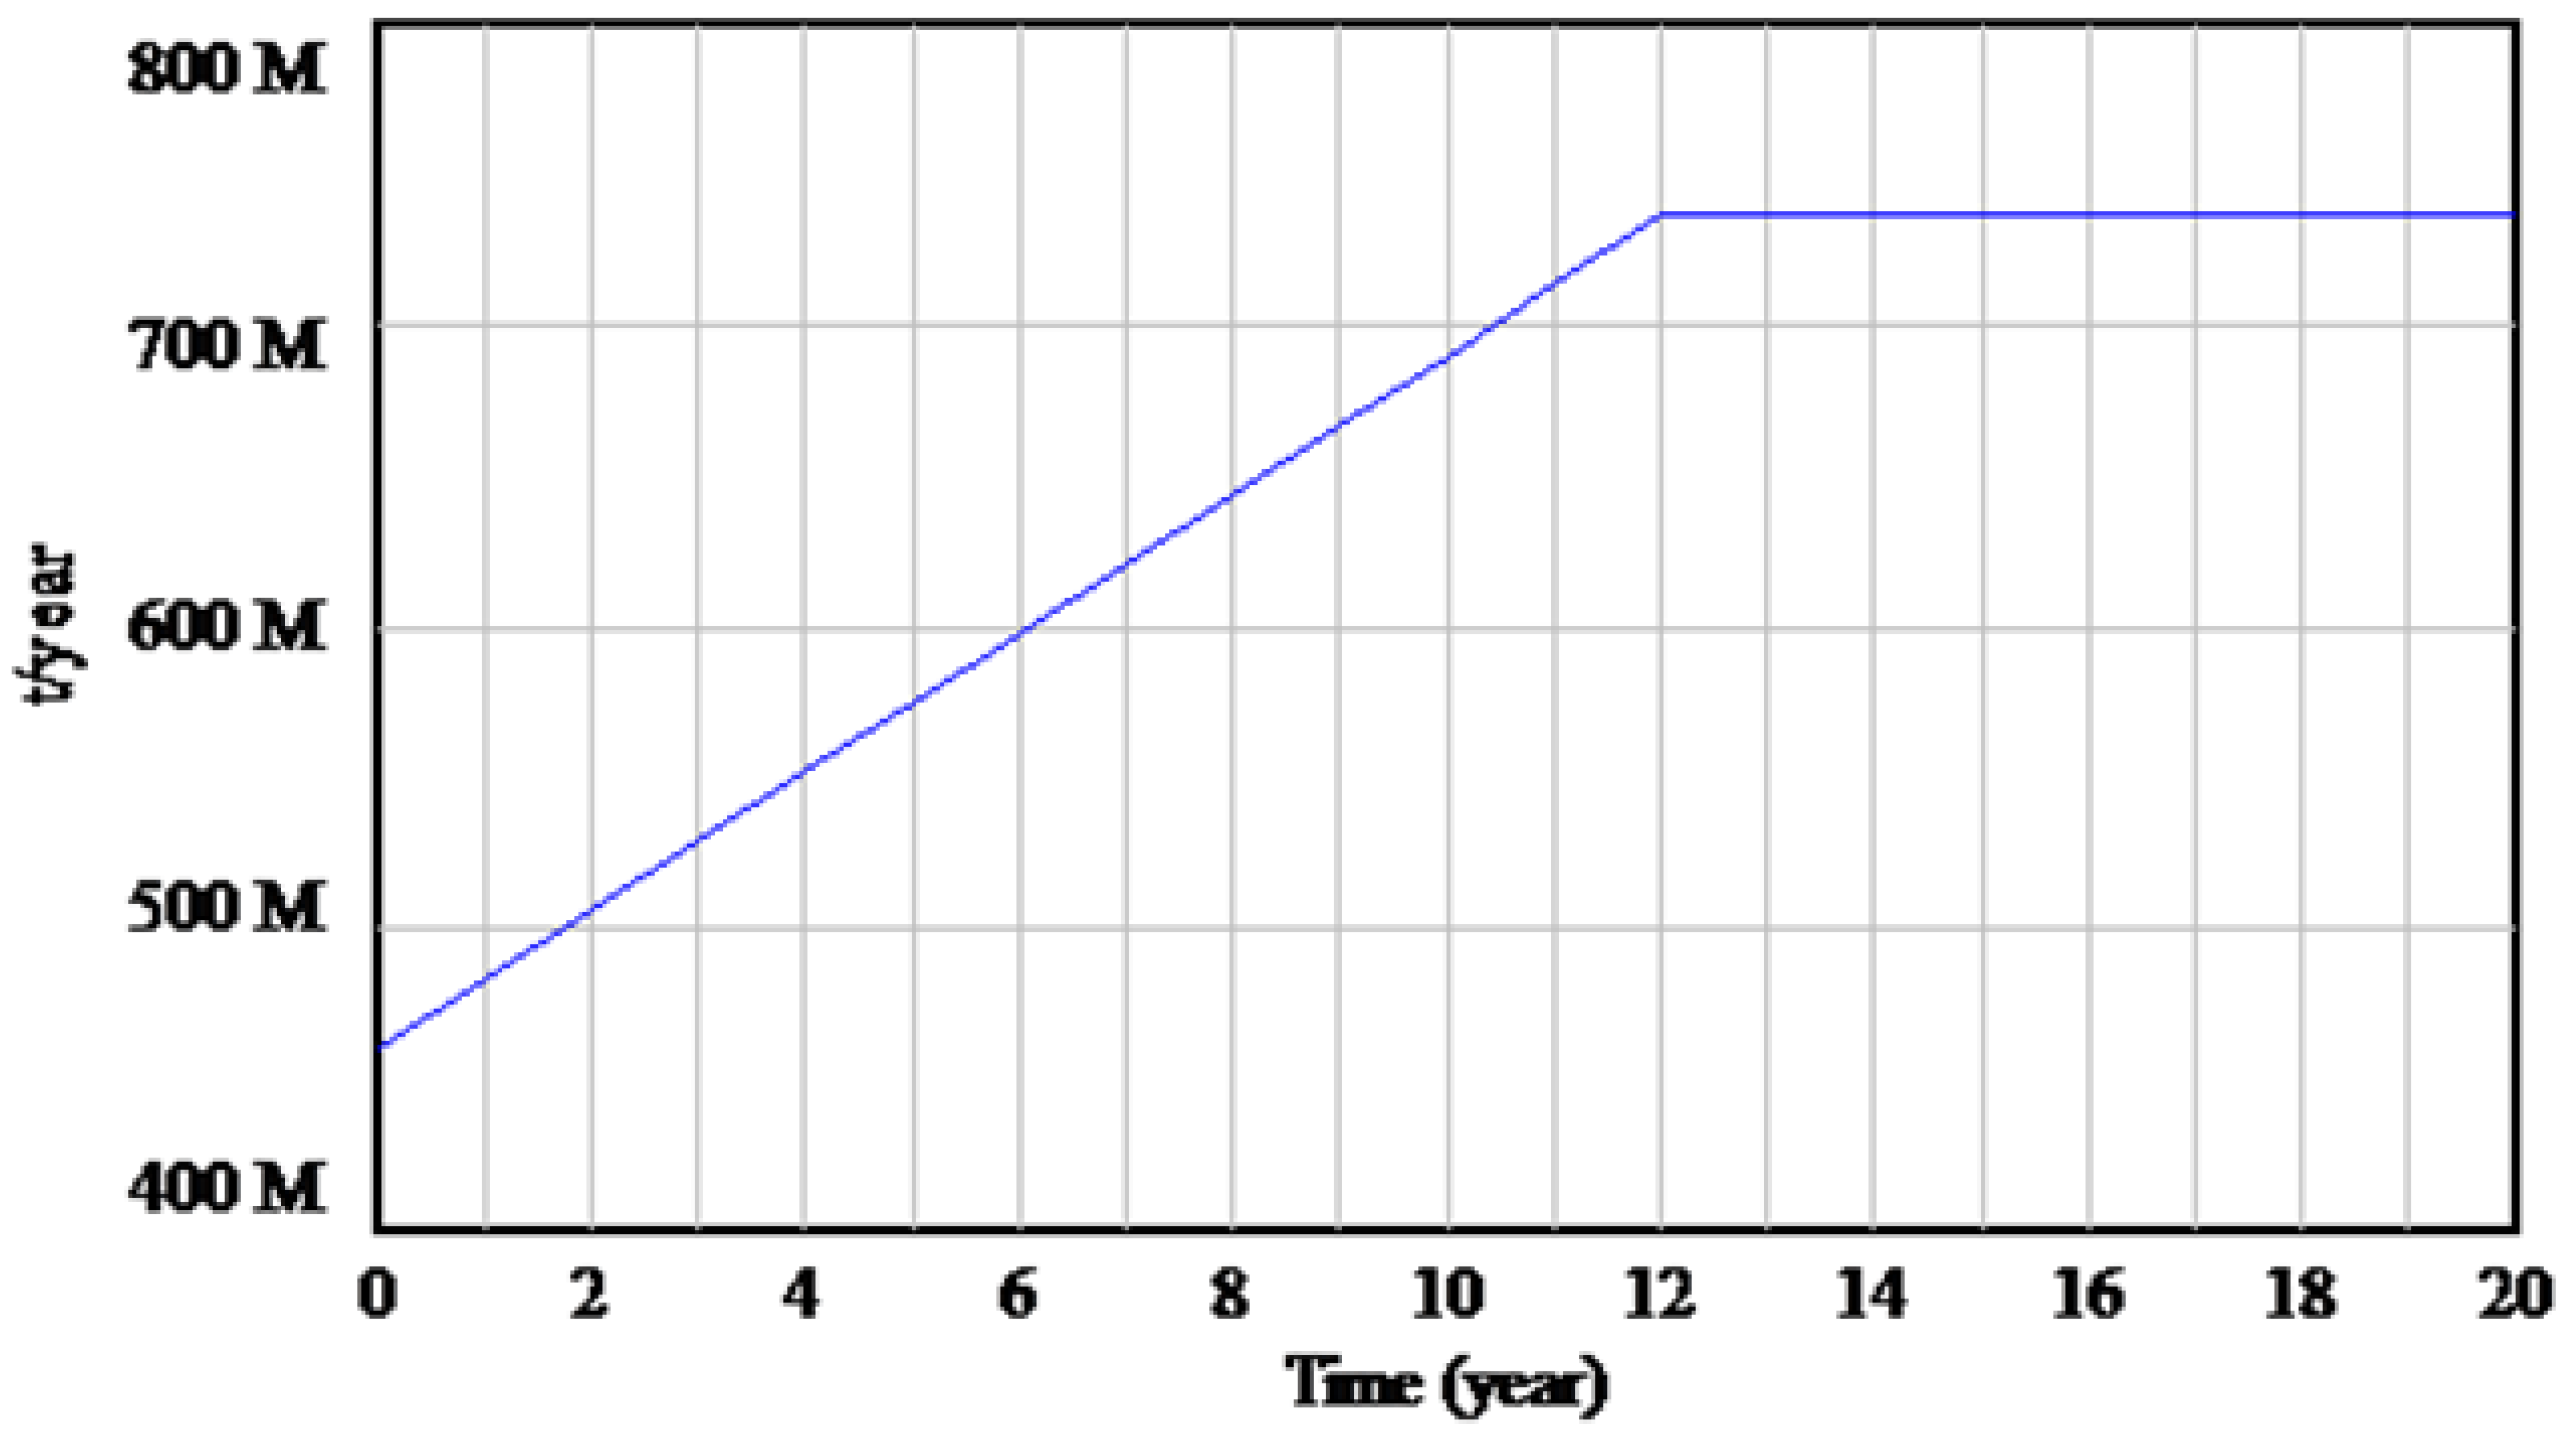
4.2.1. First Measure: Policy Based on External Incentives
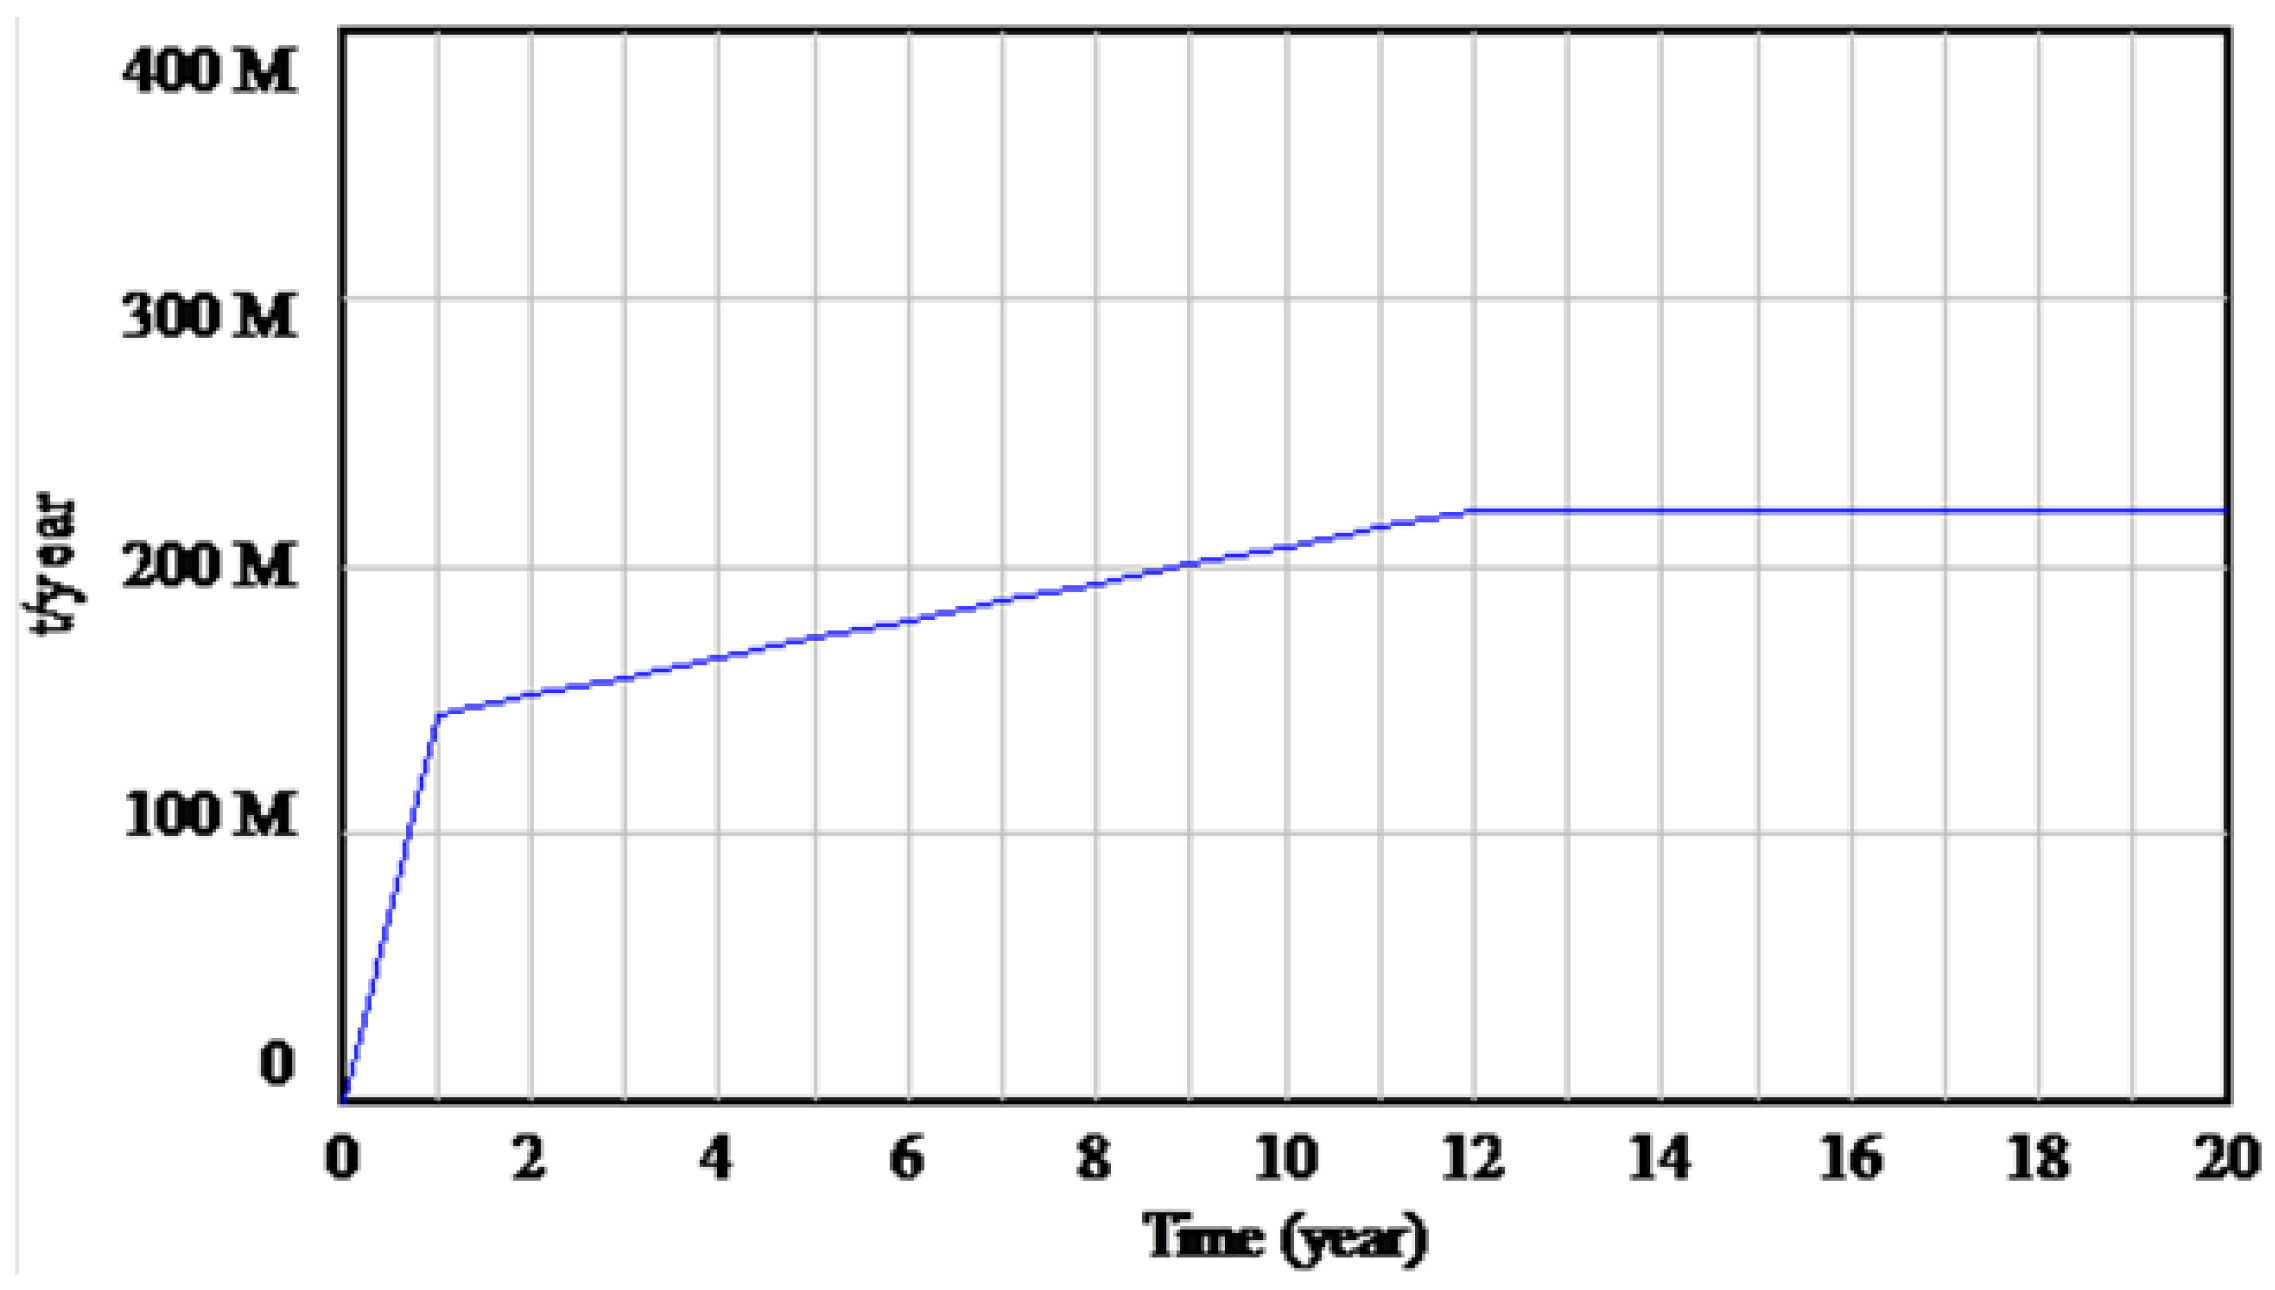
4.2.2. Second Measure: Use of a Fixed Non-Recycling Tax
5. Conclusions
Supplementary Materials
Conflicts of Interest
References
- II Plan Nacional de Residuos de Construcción y Demolición 2007–2015. (in Spanish). Available online: http://www.boe.es/boe/dias/2009/02/26/pdfs/BOE-A-2009-3243.pdf (accessed on 23 January 2013).
- Hao, J.L.; Hills, M.J.; Huang, T. A simulation model using system dynamic method for construction and demolition waste management in Hong Kong. Construct. Innov.: Inform. Process Manage. 2007, 7, 7–21. [Google Scholar] [CrossRef]
- Lu, W.; Yuan, H. Exploring critical success factors for waste management in construction projects of China. Resour. Conserv. Recy. 2010, 55, 201–208. [Google Scholar] [CrossRef]
- Sroufe, R. Effects of environmental management systems on environmental management practices and operations. Prod. Oper. Manag. 2003, 12, 416–431. [Google Scholar] [CrossRef]
- Ortiz, O.; Pasqualino, J.C.; Castells, F. Environmental performance of construction waste: Comparing three scenarios form a case study in Catalonia, Spain. Waste Manage. 2010, 30, 646–654. [Google Scholar] [CrossRef]
- Del Río Merino, M.; Salto-Weis Azevedo, I.; Izquierdo Gracia, P. Sustainable construction: Construction and demolition waste reconsidered. Waste Manage. Res. 2010, 28, 118–129. [Google Scholar] [CrossRef]
- Llatas, C.; Ramírez, L.C.; Huetes, R. Una aproximación metodológica a la verificación en obra de la cuantificación de residuos de construcción en Andalucía. In Proceedings of the Sustainable building conference, Madrid, Spain, 28–30 April 2010. C025.
- Yuan, H.; Chini, A.R.; Lu, Y.; Shen, L. A dynamic model for assessing the effects of management strategies on the reduction of construction and demolition waste. Waste Manage. 2012, 32, 521–531. [Google Scholar] [CrossRef]
- Manowong, E. Investigating factors influencing construction waste management efforts in developed countries: An experience from Thailand. Waste Manage. Res. 2012, 30, 56–71. [Google Scholar] [CrossRef]
- Plan Nacional de Residuos de la Construcción y Demolición (PNRCD) 2000–2006. (in Spanish). Available online: http://www.boe.es/boe/dias/2001/07/12/pdfs/A25305-25313.pdf (accessed on 14 March 2013).
- Kemp, R.; Pontoglio, S. The innovation effects of environmental policy instruments-A typical case of the bling men and the elephant? Ecol. Econ. 2011, 72, 28–36. [Google Scholar] [CrossRef]
- Vandecasteelo, C.; van der Sloot, H. Sustainable management of waste and recycled materials in construction. Waste Manage. 2011, 31, 199–200. [Google Scholar] [CrossRef]
- Saotome, T. Development of Construction and Demolition Waste Recycling in Ontario. Master’s Thesis; MC Master University Engineering: Hamilton, Canada, 2007. Available online: http://msep.eng.mcmaster.ca/epp/publications/student/Development_of_C&D_recycling_in_Ontario.pdf (accessed on 12 May 2013).
- Lu, W.; Yuan, H. A framework for understanding waste management studies in construction. Waste Manage. 2011, 31, 1252–1260. [Google Scholar] [CrossRef]
- Cooper, J.C. Controls and incentives: A framework for the utilization of bulk wastes. Waste Manage. 1996, 16, 209–213. [Google Scholar] [CrossRef]
- Lu, W.; Yuan, H.; Li, J.; Hao, J.J.L.; Hi, X.; Ding, Z. An empirical investigation of construction and demolition waste generation rates in Shenzhen city, South China. Waste Manage. 2011, 31, 680–687. [Google Scholar] [CrossRef]
- Hyder Consulting, Encycle Consulting & Sustainable Resource Solutions. Construction and Demolition Waste Status Report. Management of Construction and Demolition Waste in Australia; Department of Sustainability, Environment, Water, Population and Communities & Queensland Department of Environment and Resource Management: Melbourne, Australia, 2011. Available online: http://www.environment.gov.au/system/files/resources/323e8f22–1a8a-4245-a09c-006644d3bd51/files/construction-waste.pdf (accessed on 11 June 2013).
- Rodríguez, G.; Alegre, J.; Martínez, G. The contribution of environmental management systems to the management of construction and demolition waste: The case of autonomous community of Madrid (Spain). Resour. Conserv. Recy. 2007, 50, 334–349. [Google Scholar] [CrossRef]
- Solís-Guzmán, J.; Marrero, M.; Montes-Delgado, M.V.; Ramírez-de-Arellano, A. A Spanish model for quantification and management of construction waste. Waste Manage. 2009, 29, 2542–2548. [Google Scholar] [CrossRef]
- Martínez Lage, I.; Martínez Abella, F.; Vázquez Herrero, C.; Pérez Ordónez, J.L. Estimation of the anual production and composition of C&D debris in Galicia (Spain). Waste Manage. 2010, 30, 636–645. [Google Scholar] [CrossRef]
- Management of Construction and Demolition Waste; Working document no. 1; European Union: Brussels, Belgium, 2000. Available online: http://www.docstoc.com/docs/971611/Management-of-Construction-and-Demolition-Waste/ (accessed on 23 May 2013).
- Marrero Meléndez, M.; Solís Guzmán, J. A Blueprint for Sustainable Purchasing and Policy Development for Construction; The Environment Centre: Southampton, UK, 2007. [Google Scholar]
- De Guzmán Baez, A.; Villoria Sáez, P.; del Río Merino, M.; García Navarro, J. Methodology for quantification of waste generated in Spanish railway construction works. Waste Manage. 2012, 32, 920–924. [Google Scholar] [CrossRef]
- Stavins, R.N. Experience with market-based environmental policy instruments. In Handbook of Environmental Economics, 1st ed.; Karl-Göran, M., Vincent, J., Arrow, K., Intriligator, M., Eds.; Elsevier: Amsterdam, The Netherlands, 2003; Volume 1, pp. 355–435. [Google Scholar]
- Bohne, R.A.; Brattebø, H.; Bergsdal, H. Dynamic eco-efficiency projections for construction and demolition waste recycling strategies at the city level. J. Ind. Ecol. 2008, 12, 52–68. [Google Scholar]
- Guo, Y.; Baetz, B.W. Sizing of rainwater storage units for green building applications. J. Hydraul. Eng. 2007, 12, 197–205. [Google Scholar]
- Aerts, K.; Schmidt, T. Two for the price of one? Additionality effects of R&D subsidies: A comparison between Flanders and Germany. Res. Policy 2008, 37, 806–822. [Google Scholar] [CrossRef]
- Sánchez, M.F.; Castro, J.G. Gestión y minimización de residuos, 2nd ed.; TAXUS, Gestión Ambiental, Ecología y Calidad S.L.: Madrid, Spain, 2011. [Google Scholar]
- Forrester, J.W. Industrial Dynamics, 1st ed.; Pegasus Communications: Boston, MA, USA, 1961. [Google Scholar]
- Stearman, J. Business Dynamics: Systems Thinking and Modeling for a Complex World, 1st ed.; Irwin McGraw-Hill: Boston, MA, USA, 2000. [Google Scholar]
- Senge, P. The Fifth Discipline. The Art & Practice of the Learning Organizations, 1st ed.; Random House: Ann Arbor, MI, USA, 1990. [Google Scholar]
- Reimer, M. Planning cultures in transition: sustainability management and institutional change in spatial planning. Sustainability 2013, 5, 4653–4673. [Google Scholar] [CrossRef]
- Pérez, I.; Toledano, M.; Gallego, J.; Taibo, J. Mechanical properties of hot mix asphalt made with recycled aggregates from reclaimed construction and demolition debris. Materiales de Construcción 2007, 57, 17–29. [Google Scholar]
- Pérez, I.; Pasandín, A.R.; Gallego, J. Stripping in hot mix asphalt produced by aggregates from construction and demolition waste. Waste Manage. Res. 2012, 30, 3–11. [Google Scholar]
© 2014 by the authors; licensee MDPI, Basel, Switzerland. This article is an open access article distributed under the terms and conditions of the Creative Commons Attribution license (http://creativecommons.org/licenses/by/3.0/).
Share and Cite
Calvo, N.; Varela-Candamio, L.; Novo-Corti, I. A Dynamic Model for Construction and Demolition (C&D) Waste Management in Spain: Driving Policies Based on Economic Incentives and Tax Penalties. Sustainability 2014, 6, 416-435. https://doi.org/10.3390/su6010416
Calvo N, Varela-Candamio L, Novo-Corti I. A Dynamic Model for Construction and Demolition (C&D) Waste Management in Spain: Driving Policies Based on Economic Incentives and Tax Penalties. Sustainability. 2014; 6(1):416-435. https://doi.org/10.3390/su6010416
Chicago/Turabian StyleCalvo, Nuria, Laura Varela-Candamio, and Isabel Novo-Corti. 2014. "A Dynamic Model for Construction and Demolition (C&D) Waste Management in Spain: Driving Policies Based on Economic Incentives and Tax Penalties" Sustainability 6, no. 1: 416-435. https://doi.org/10.3390/su6010416
APA StyleCalvo, N., Varela-Candamio, L., & Novo-Corti, I. (2014). A Dynamic Model for Construction and Demolition (C&D) Waste Management in Spain: Driving Policies Based on Economic Incentives and Tax Penalties. Sustainability, 6(1), 416-435. https://doi.org/10.3390/su6010416