Ultra-Deepwater Gulf of Mexico Oil and Gas: Energy Return on Financial Investment and a Preliminary Assessment of Energy Return on Energy Investment


Abstract
: The purpose of this paper is to calculate the energy return on financial investment (EROFI) of oil and gas production in the ultra-deepwater Gulf of Mexico (GoM) in 2009 and for the estimated oil reserves of the Macondo Prospect (Mississippi Canyon Block 252). We also calculated a preliminary Energy Return on Investment (EROI) based on published energy intensity ratios including a sensitivity analysis using a range of energy intensity ratios (7 MJ/$, 12 MJ/$, and 18 MJ/$). The EROFI for ultra-deepwater oil and gas at the well-head, ranged from 0.019 to 0.022 barrels (BOE), or roughly 0.85 gallons, per dollar. Our estimates of EROI for 2009 ultra-deepwater oil and natural gas at the well-head ranged from 7–22:1. The independently-derived EROFI of the Macondo Prospect oil reserves ranged from 0.012 to 0.0071 barrels per dollar (i.e., $84 to $140 to produce a barrel) and EROI ranged from 4–16:1, related to the energy intensity ratio used to quantify costs. We believe that the lower end of these EROI ranges (i.e., 4 to 7:1) is more accurate since these values were derived using energy intensities averaged across the entire domestic oil and gas industry. Time series of the financial and preliminary EROI estimates found in this study suggest that the extraction costs of ultra-deepwater energy reserves in the GoM come at increasing energetic and economic cost to society.1. Introduction
Since the early 1970s, rates of domestic oil production in the U.S. have decreased, and domestic demand has been met increasingly by oil imports. Domestic oil is becoming scarcer and more difficult to produce due to reservoir depletion and a sharp decrease in the number of large, easily accessible discoveries onshore or in shallow coastal environments [1-3]. Consequently deepwater and ultra-deepwater Gulf of Mexico (GoM) oil has become increasingly important to U.S. domestic oil production over the last 20 years [4]. Not surprisingly energy extraction in the ultra-deepwater environment requires more financial and energy resources than from onshore or in shallow-water environments. Drilling costs increase exponentially with depth in the ultra-deepwater environment [5]. The increase in energy and financial costs results in decreased net energy available to society. The recent era of deepwater drilling is often associated with the notion of national energy independence and has been touted as a potential solution to decrease dependency on imports. However, proven oil reserves in the federal waters of the GoM (approximately 3.5 billion barrels at year-end 2008) are inadequate to support national domestic oil consumption for even one year [6,7].
Production of deep and ultra-deepwater reserves has become profitable in part due to the establishment of government subsidies and the increase in oil prices over the last decade [7-9]. Gately (2007) reported without explicit quantification that the energy return on investment (EROI) for deepwater and ultra-deepwater oil is low, decreases with an increase in water depth and is less than 10:1 [10]. Gately et al. [10] estimated EROI for deepwater (depths of 900 m +) GoM using production data from the Minerals Management Service (MMS, now Bureau of Ocean Energy Management, Regulation and Enforcement) combined with previously published operational dollar cost estimates [11] and energy intensity factors which allow for the conversion from dollars to energy units [12]. EROI including only direct costs at 900m+ water depths ranged from 10–27:1 for the years 2000–2004 and 3–9:1 for the same years when including indirect costs of production [10]. The energy intensity factors used in past studies may be inaccurate due to changes in technology, advances in energy efficiency, and the scale of offshore operations since they were first proposed [12,13]. Unfortunately it is impossible to verify the accuracy of Gately's study [10] or to recreate either analysis since no data were given.
The purpose of this paper is to calculate explicitly the Energy Return on Financial Investment (EROFI) [14] of oil and gas production in the ultra-deepwater Gulf of Mexico (GoM) for 2009 and the EROFI of oil in the Macondo Prospect. We also derived preliminary EROI estimates based on a range of energy intensity ratios [14,15].
The EROFI is an estimate of the financial cost for the production of a barrel of oil or natural gas expressed as barrel of oil equivalent (BOE). EROFI is the amount of money expended by an energy producing entity divided by the amount of energy produced. An energy producing entity must produce energy at sufficient economic profit while paying off the costs of the full supply chain of labor, materials, and transport in order to maintain a profitable business [14]. Profitability is, however, related directly to the supply chain costs. The entity fails to be financially profitable when the incurred costs are greater than the price of the product being sold. EROFI analysis provides insight into the base price for which a barrel of oil must be sold in order to maintain economic profitability. EROI analysis is a tool used to measure the net energy of an energy supply process [16]. The net energy of an energy source is the amount of energy returned to society divided by the energy required to get that energy [17]. An energy source becomes an energy sink when the amount of energy used in extraction is greater than the extracted amount of energy (EROI < 1:1). In 1930, the average domestic oil discovery yielded at least 100 units of energy equivalent output production for every unit of input, and that oil could be produced at a return of about 30 for one. [15,18]. Today, the average net energy measured by EROI of domestic oil production has declined to about 10:1, or 10 units of output for every unit of input [15,18].
The importance of EROI to a society is that the analysis provides a measure of the surplus energy gained from an energy source that can be diverted to other sectors of the economy to produce goods and services other than those required for energy extraction. Decreasing EROI increases the proportion of economic output that goes into the energy extraction sector of the economy leaving fewer economic and energy resources available for non-energy extraction sectors. Net energy, and the associated surplus energy to society, declines with declining EROI. The trend towards low EROI fuels affects the quantity and affordability of the fuel supply [3].
This paper presents a detailed although non-comprehensive analysis of the EROFI for ultra-deepwater oil and gas in the GoM in 2009 and potential Macondo Prospect reserves using updated financial data. In particular data that have become available in the wake of the Deepwater Horizon oil rig disaster are used to increase understanding of the EROFI for energy production in the federally regulated ultra-deepwater outer continental shelf of the GoM. Because of a lack of access to accurate, comprehensive ultra-deepwater energy input production data and a degradation of federal energy use statistics, it is necessary to use financial data and convert this to energy inputs using energy intensity ratios in order to estimate the energy return on energy investment in the ultra-deepwater GoM in 2009.
1.1. GoM Oil Production
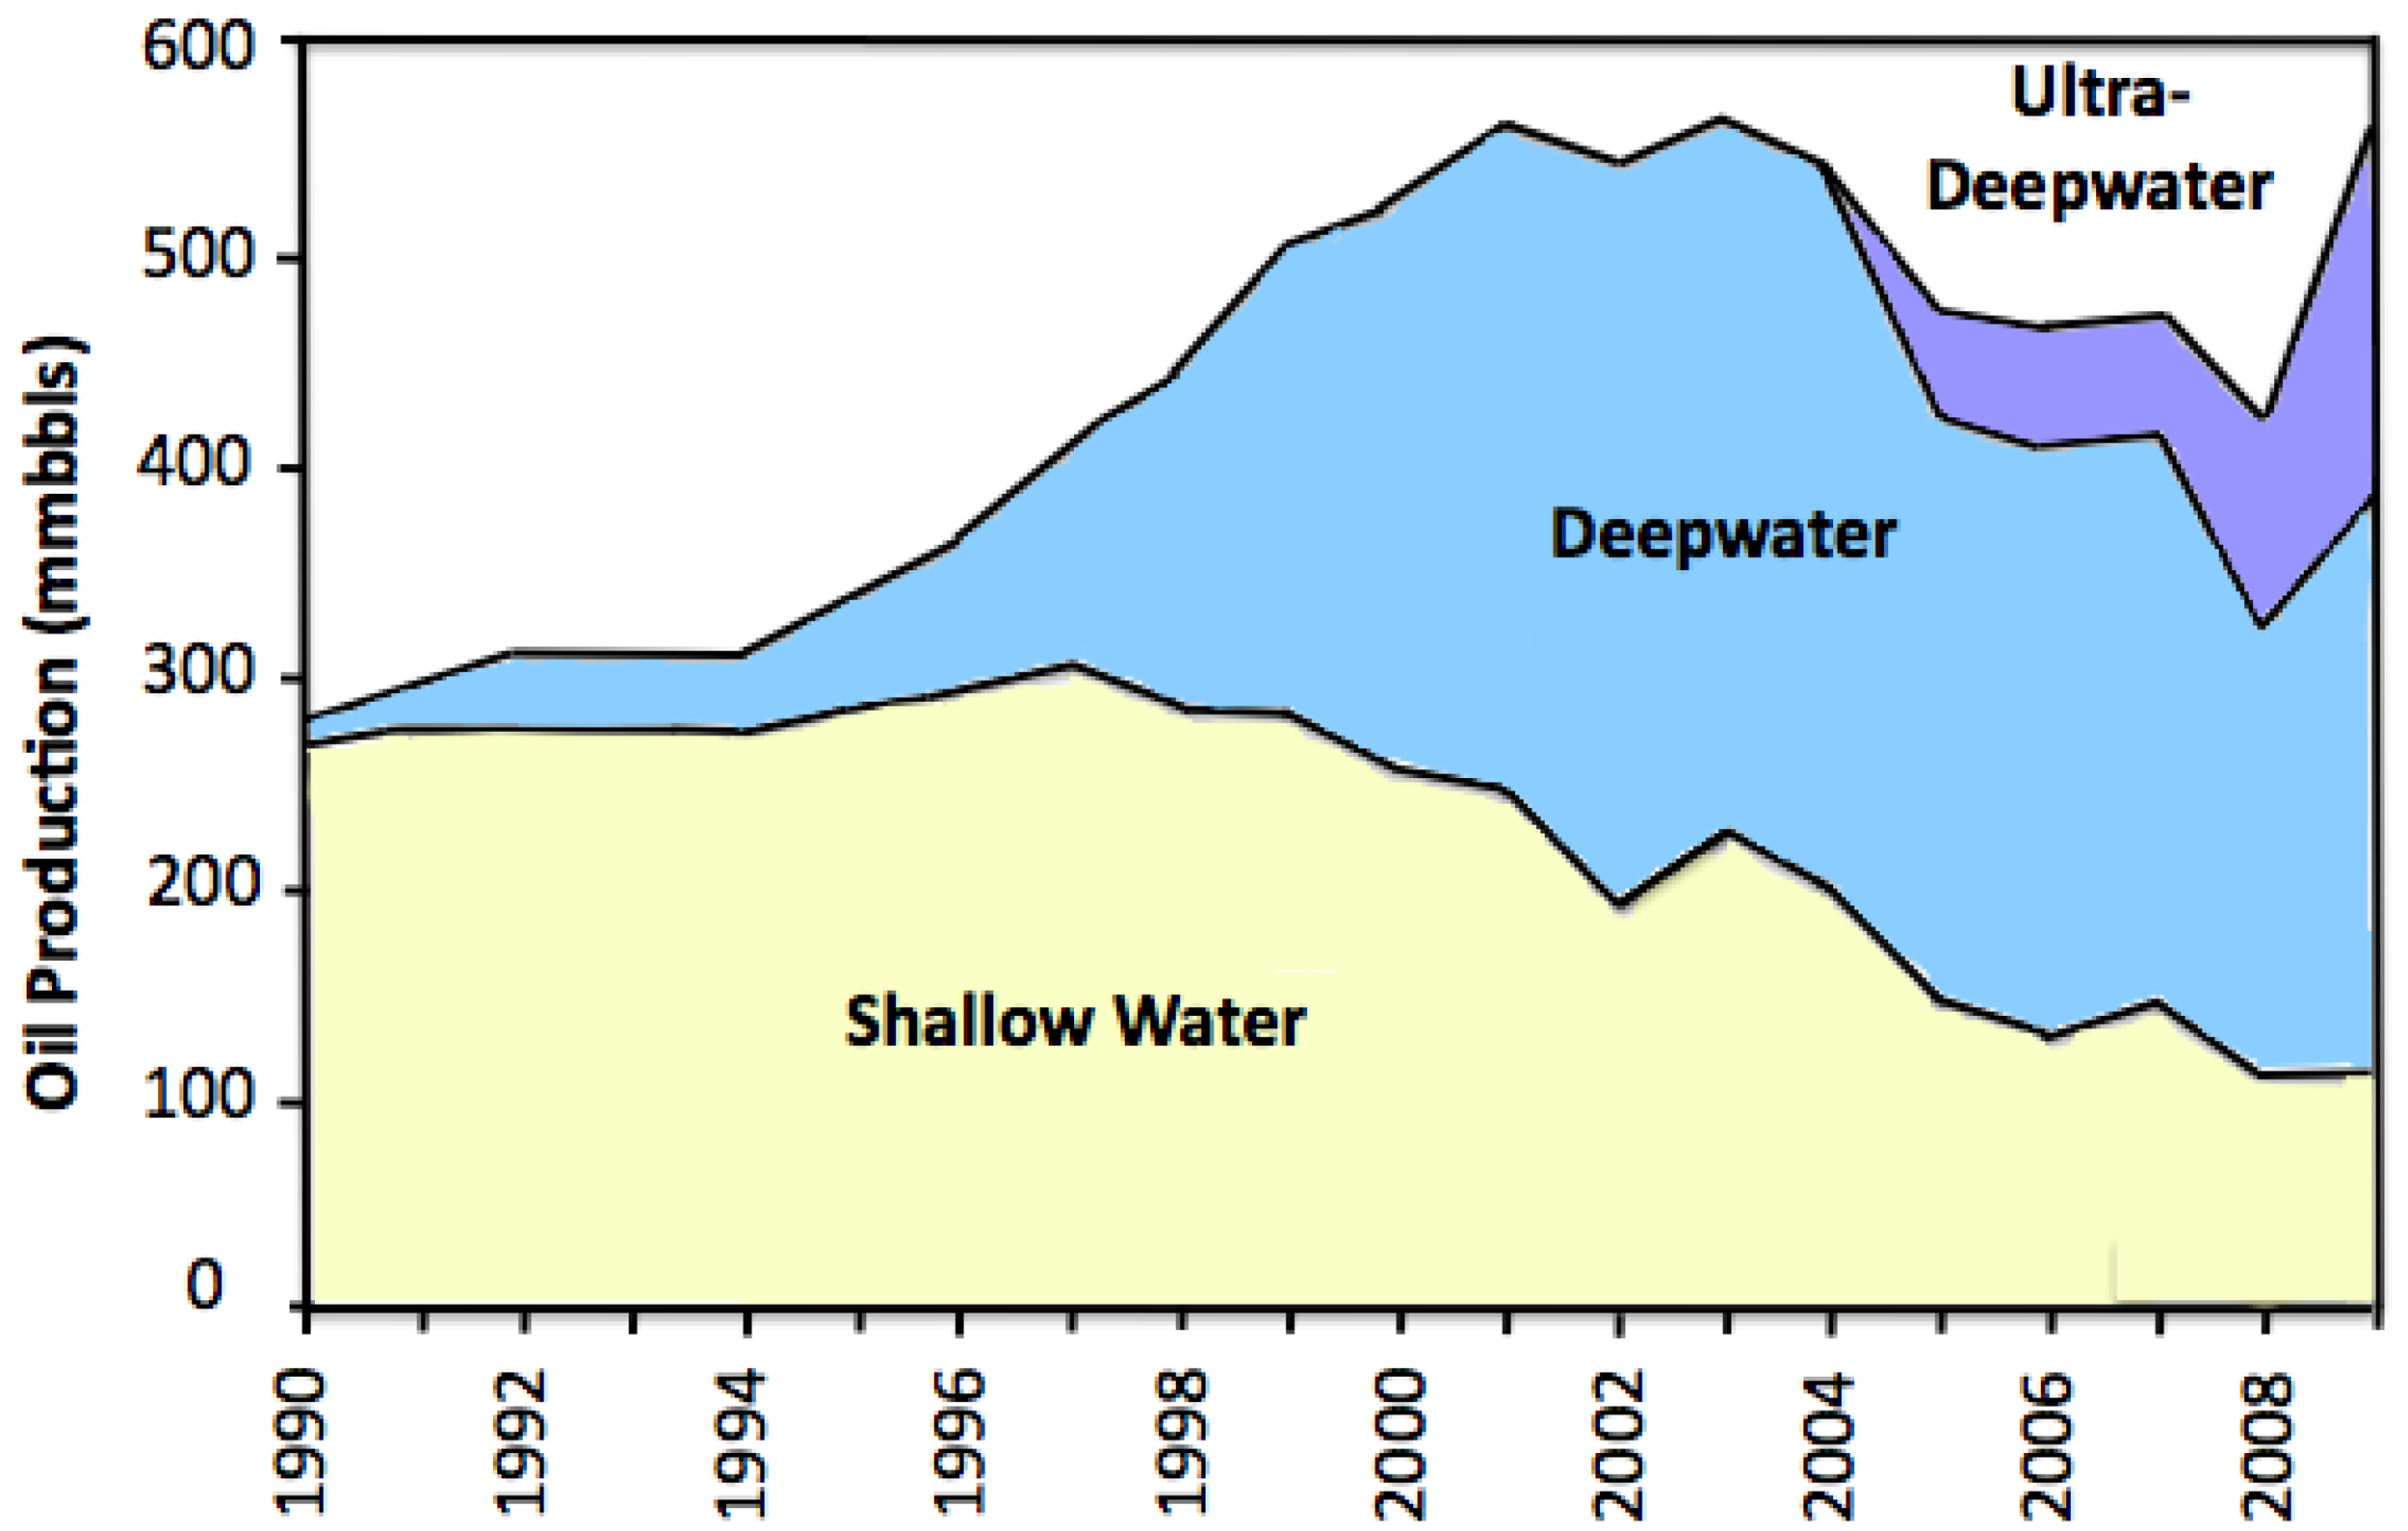
GoM federal offshore oil production accounted for approximately 29% of total U.S. oil production in 2009. Deepwater and ultra-deepwater GoM areas contributed to 80% of total federal offshore GoM oil in 2009 [19]. Deepwater (1,000–5,000 ft.) oil production in the GoM became a major part of U.S. domestic energy production in 1998 when shallow water production began to decline. Deepwater production peaked in 2004 and has been in decline ever since. Ultra-deepwater (>5,000 ft.) production has helped to offset the deepwater production decline in a similar manner as deepwater production had previously offset shallow-water production in the late 1990s (Figure 1).
Federal offshore production, formerly declining, increased by 33% (over 147 million barrels) between 2008 and 2009 [7,20]. The increase in production for 2009, however, reflects not only production from the new projects that came online, but also the addition of volumes that were shut-in during 2008 as a result of hurricane activity [9]. For oil, 75-percent of the increase in production in 2009 is a reflection of shut-in volumes coming back online [9]. Approximately one third of federal Outer Continental Shelf (OCS) oil production and one quarter of natural gas production in 2009 came from ultra-deepwater (depths >5000 ft).
The production from shallow waters is projected to continue to decline into the future [4]. Shallow water discoveries have declined from approximately 44 discoveries in 2005 to four discoveries in 2009 [21]. Deepwater and ultra-deepwater production is important for offsetting the loss of production from onshore and shallow water in order to maintain the domestic oil industry in the Gulf Coast region. Operating offshore in ultra-deepwater is more complex and more capital-intensive than operating in onshore environments where fixed costs are smaller and production profiles tend to decline at more predictable rates [4], which suggests that EROI there should be lower than for onshore oil. In addition, the largest remaining oil reserves in the GoM exist in the deepwater and ultra-deepwater environments [9] and thus we would expect that EROI would be lower than for onshore production.
The economic profitability of deep and ultra-deepwater production is dependent upon the price of oil and costs associated with exploration, production, transportation, processing, and delivery to end use as well as government subsidies. Past studies [22] concluded that a discovery containing at least about 1 billion barrels recoverable is required to support an ensuing development project for ultra-deepwater oil, which may cost upwards of $1 to $2 billion dollars in up-front Capital Expenditures (CAPEX, 22). Larger reservoirs generally yield higher production rates per well, thereby increasing net energy and financial profitability because less energy and money is required to extract oil from a larger reservoir (i.e., [14]).
1.2. GoM Rig Counts
The number of oil drilling rigs in Federal OCS waters affects the energy return on financial and energy investment. Increasing drilling effort does not always lead to an increase in production [17]. An increase in the number of rigs increases the financial costs of energy extraction, as more energy, labor, and raw materials are required per unit of energy produced. So long as rigs are adding proportional supply to the total energy produced, they are able to offset the increased financial and energy costs of ultra-deepwater projects. The technological advancement in rig design over the last 20 years has allowed for floating rigs including spars, semi-submersibles, and tension leg platforms to tap into multiple wells often miles apart in order to exploit reserves more efficiently, thereby decreasing financial and energy costs [23]. A few dozen rigs were responsible for 72% of the ultra-deepwater oil production in the GoM in 2007 compared to the five thousand or so rigs in shallow water [4]. The percentage of production attributed to smaller rigs is expected to continue to decline into the future [9].
The lifespan of a rig affects the amortized cost of the rig. Rigs have a lifespan of about ten years before a major work over is required [24,25]. Most ultra-deepwater drilling rigs were constructed within the last twenty years, as was the nine year-old Deepwater Horizon. The long-term leasing contract process allows rig construction costs to be recouped over a period of years and insures rig utilization. Rigs are mobile and often produce oil from several different fields over the course of their operational lifetime.
Daily operating costs for deepwater rigs have doubled over the course of the last decade partly as a result of increasing energy costs required by production operations for larger floating rigs often located 100+ miles from shore. At the same time, deepwater and ultra-deepwater drilling operations have become profitable in the age of oil at $50+/barrel and government subsidies [21,26]. Global investment trends provide evidence for continued deepwater production and decreased shallow and mid-water production [27].
1.3. Macondo Prospect Reserves and Cost Estimates
The Macondo Prospect is an oil and gas reservoir located in Mississippi Canyon Block 252 in the northern GoM just southeast of the mouth of the Mississippi River. The reservoir is in water depths greater than 4,900 ft. (1,700 m) and located more than 17,700 ft. beneath the ocean floor. BP officials estimated that there were approximately 50–100 million barrels of oil associated with the Macondo Prospect [28,29]. Oil companies do not usually extract 100% of the oil in a field [29]. We estimated that the reservoir would yield about 30% of the total reserves or between 15 million and 50 million barrels prior to the blow out.
The Deepwater Horizon rig was valued at $560 million when delivered to Transocean Ltd. in February 2001 and collapsed into the GoM in April 2010 during deployment at the Macondo Prospect [30]. Deepwater Horizon was a fifth generation semi-submersible offshore drilling rig that required approximately three years to construct. The average construction cost of floater rigs in operation in 2009 was $565 million dollars per rig [31]. At the time of its demise, the Deepwater Horizon was leased for three years at a total cost of $544 million which equates to a bare rig daily lease rate of $496,800/day. The average daily operations cost for U.S. GoM semi-submersible rigs, including crew, gear, and vessel support operations for 2009 was approximately the same as the daily lease rate [32]. Thus, total daily operational cost was $993,600. This estimate is consistent with industry-wide costs for similar deepwater oil rigs [33,34].
1.4. Energy Intensity Ratios
The energy intensity ratio is the amount of energy required to produce $1 of GDP (or of some component of GDP) in a given year. The energy intensity ratio allows for the conversion from financial costs to energy costs in this and other studies. The energy intensity of production is correlated to effort, one variable of which is the number of rigs employed in production [35]. Other variables affecting energy intensity include the size and energy requirements of rigs and support vessels as well as the depth of resource deposits and distance offshore. Energy intensity ratios can be used to estimate approximate costs for many fuels where economic but not energy data are available [14,17,36], which was the case for our study. Usually it is applied only to indirect investments for situations where direct energy is known, such as for other studies in this volume. Energy intensity ratios, for the economy as a whole and for individual industrial sectors, change due to inflation, as a result of material availability, and through efficiency gains. The mean energy intensity ratio for the U.S. economy in 2005 was approximately 8.3 Megajoules (MJ) per $1 USD. The oil and gas industry is an energy intensive sector with an estimated energy intensity ratio of 20 MJ per $1 USD in 2005, while heavy construction during the same period was estimated to be 14 MJ per $1 USD [17]. Advances in energy efficiency and the steady decline in energy intensity ratios over time provide the rationale for estimates used in this study [37]. Previous research has shown that energy intensity ratios serve as an effective proxy in determining the EROI of various energy sources [38]. Energy intensity ratios, however, are not the singular, or best, method for determining EROI. Ideally, energy inputs would be measured directly for each step in the production process. This is often proprietary data not made available to the public or unaccounted for and therefore unavailable. Because of data limitations on energy inputs for ultra-deepwater production, the use of financial investment data used in conjunction with energy intensity ratios allows for a first approximation of EROI in analyzing an extremely important issue given the limited data availability and accessibility and the failure of earlier EROI studies to provide explicit data [14].
The objectives of this study were threefold: (1) To derive estimates of the energy return on financial investment for oil and oil + natural gas in the ultra-deepwater GoM in 2009 based on production and financial cost data; (2) To derive estimates of the energy return on financial investment for oil and oil+natural gas in the ultra-deepwater GoM in 2009 based on the same data plus estimates of energy intensities; and (3) To derive an estimate of the energy return on both financial and energy investment for the estimated total oil reserves of the Macondo Prospect based on industry stated estimates of reserves and financial cost data.
2. Methods
The methodology employed in this paper is based on the second order comprehensive EROI (EROIstnd) protocol described by Murphy and Hall [36] and previously by Mulder and Hagens [39]. We calculated energy return on financial investment based on King and Hall [14]. The EROFI for potential reserves in the Macondo Prospect was estimated based on annual costs multiplied by the number of years it would take to extract the reserves and divided. The EROFI for total energy produced in the ultra-deepwater GoM in 2009 was determined by dividing the by the reserve volume divided by the total financial costs per operational year. EROI estimates were then estimated using energy intensity ratios established for 2005 combined with production cost data adjusted for inflation. Financial input data includes rig construction and operation costs along with exploration costs. Energy output is based on Macondo oil reserve estimates and 2009 GoM ultra-deepwater oil and natural gas production.
The Macondo Prospect is an average ultra-deepwater well with respect to depth and location [40]. Since all GoM well reserves differ in size and productive capacity, we use the Macondo Prospect field as a proxy for similar sized ultra-deepwater GoM reserves. The period of time required to extract the Macondo reserves is important to the analysis. Increased extraction efficiency decreases operating and production costs that positively impact EROFI. A constant flow rate production profile would result in a higher energy return because of a shorter time for total production. However, virtually all producing wells follow a bell-shaped production profile based on the three phases of ramp-up, plateau, and decline [4]. We calculated EROFI and EROI values for constant and bell-shaped production profiles to demonstrate this difference. The bell-shaped profiles were generated using the MMS full potential scenario forecast methods based on past deepwater GoM production wells [41-42] as follows.
For total recoverable reserves of 50 million barrels in the Macondo Prospect and 30% extraction efficiency, 15 million barrels of oil would be pumped in 600 days if a constant flow rate of 25,000 bpd is assumed. If all of the 50 million barrels were recoverable at the same constant flow rate, it would take 2000 days. Peak production is based on the estimated ultimately recoverable reserves using the MMS full potential scenario forecast equation:
The parameters in this equation were derived by plotting maximum production rates of known fields against the ultimate recoverable reserves of those fields, and performing a linear regression between reserves and production [41,42]. These reserve estimates are on a field-by-field basis, so MMS assumed that this relation, based on historic field trends, could be applied on a project basis [41,42]. This equation is generally applied to reserves of 200 million barrels of oil equivalents and more and assuming peak production lasts for four years. For our analysis, we assumed peak flow rates lasted two years since Macondo reserve estimates were one half to one quarter of 200 million barrels and then declined at 12%/year [9]. During the first year of operation, production was set at half its peak rate [9,41,42].
Energy output for the entire GOM study was (BOE) produced in the ultra-deepwater GoM in 2009 [19]. One BOE is equal to 5,800 cubic feet of natural gas. Ultra-deepwater GoM production in 2009, was 182 million barrels of oil and 572 billion cubic feet of natural gas [9]; equivalent to a oil+natural gas total of 291 million BOE. Production costs were based on published rig counts and rig construction costs (Table 1) [31,43]. At any given time there were 25–30 rigs producing in ultra-deepwater [43]. Amortized rig construction costs are based on the number of years it takes to drill a well and extract the resource.
Exploratory costs are operational costs associated with finding and accessing a well prior to production. Technological advancement has led to a decrease in the amount of time required to drill a well. The first wells drilled in the GOM and Brazil took 180–240 days on average [43]. Now these wells are being drilled in 90–120 days [43] so we used 100 days at $1 million dollars per day based on average production costs.
We used published energy intensity ratios to derive the EROI values from the EROFI. The energy intensities are rough estimates of the energy used to undertake any economic activity derived from the national mean ratio of GDP to energy [17]. These ratios can be used to estimate rough costs for many fuels where economic but not energy data are available [44] and are based on non-quality corrected thermal equivalents [18]. The EROI calculation is limited by available data and is an estimate at the wellhead and not at the point of end use. Estimates of the energy intensity ratio of U.S. oil and gas extraction averaged across all domestic fields and well depths was 9.87 MJ/$ in 1997, 14.5 MJ/$ in 2002, and 20 MJ/$ in 2005 [17,45]. This increase was not due to the energy intensity per dollar increasing, but because more of the downstream energy requirements were included in the higher energy intensity values. Based on these reports, we used energy intensity ratios of 7, 12, and 18 MJ to carry out a sensitivity analysis of the impact of different energy intensity ratios on EROI.
Energy output was based on 1 barrel of oil = 6.11 Gigajoules. EROFI costs are in 2009 USD$. EROI is based on 2009 USD$ costs, corrected for inflation using a factor of 1.10 [46], and presented in 2005 USD$ in order to maintain consistency with the energy intensity ratios used in the analysis. Total energy inputs are the summation of 10-year amortized rig construction costs, 100-day exploration costs per rig, and operational costs converted to energy units using the three different energy intensity ratios. Construction, operational, and exploration costs were summed and were then converted to energy units using the three energy intensity ratios described above. A number of costs were not included because data were not available. These included rig and operator insurance costs, costs associated with enhanced recovery techniques and costs associated with dry holes. However, these costs are substantial [47].
3. Results
The financial cost per barrel of ultra-deepwater oil in the GoM at the well-head ranged from $71/barrel to $86/barrel based on the number of rigs deployed in production. The EROFI for oil + natural gas at the well-head in the GoM in 2009 ranged from 0.019 to 0.022 barrels (BOE), or roughly 0.85 gallons, per dollar, based on the number of rigs deployed in production.
The financial cost at the well-head per barrel of oil available in the Macondo Prospect based on the constant flow rate production profile, was $62/barrel assuming 15 million barrels produced per day, or $45/barrel if producing 50 million barrels over 2000 days. The EROFI at the well-head was $141/barrel of oil in the Macondo Prospect if 15 million barrels were produced over 4 years, or $84/barrel if producing 50 million barrels over 8 years is.
The preliminary EROI based on financial costs and subsequent sensitivity analysis using three different energy intensity ratios. ranged from 4:1 to 14:1 for 2009 total GoM ultra deepwater oil production while the EROI for total oil plus natural gas production in the ultra-deepwater GoM in 2009 was slightly higher at 7:1–22:1. The EROI for the Macondo Prospect using the MMS full potential scenario forecast varied from 4:1 to 16:1. The EROI of the constant flow rate scenarios for producing 15 and 50 million barrels in the Macondo Prospect at 25,000 bpd are given in Table 2.
Applying the MMS full potential scenario forecast equation to Macondo field reserves yielded a peak rate of 13,118 barrels/day for 15 million barrels and 22,728 barrels/day for 50 million barrels. If 15 million barrels is recovered, the well would be completely depleted within four years and if 50 million barrels is recovered, the well would be depleted within eight years. The financial costs associated with Macondo reserves on a four-year time scale total $1.8 billion while the costs on an 8-year time scale total $3.5 billion dollars. The EROI using the MMS production equation for one well producing total reserves of 15 and 50 million barrels, respectively, from the Macondo field for four years and eight years, respectively, are presented in Table 3.
EROI estimates of 2009 ultra-deepwater oil production are based on operating costs of $1 million per day and 10 year annualized rig costs of $56.5 million/year plus $100 million dollars in exploratory drilling per rig. EROI estimates based on low (25 rigs), average (27 rigs), and high (30 rigs) rig counts are given in Table 4.
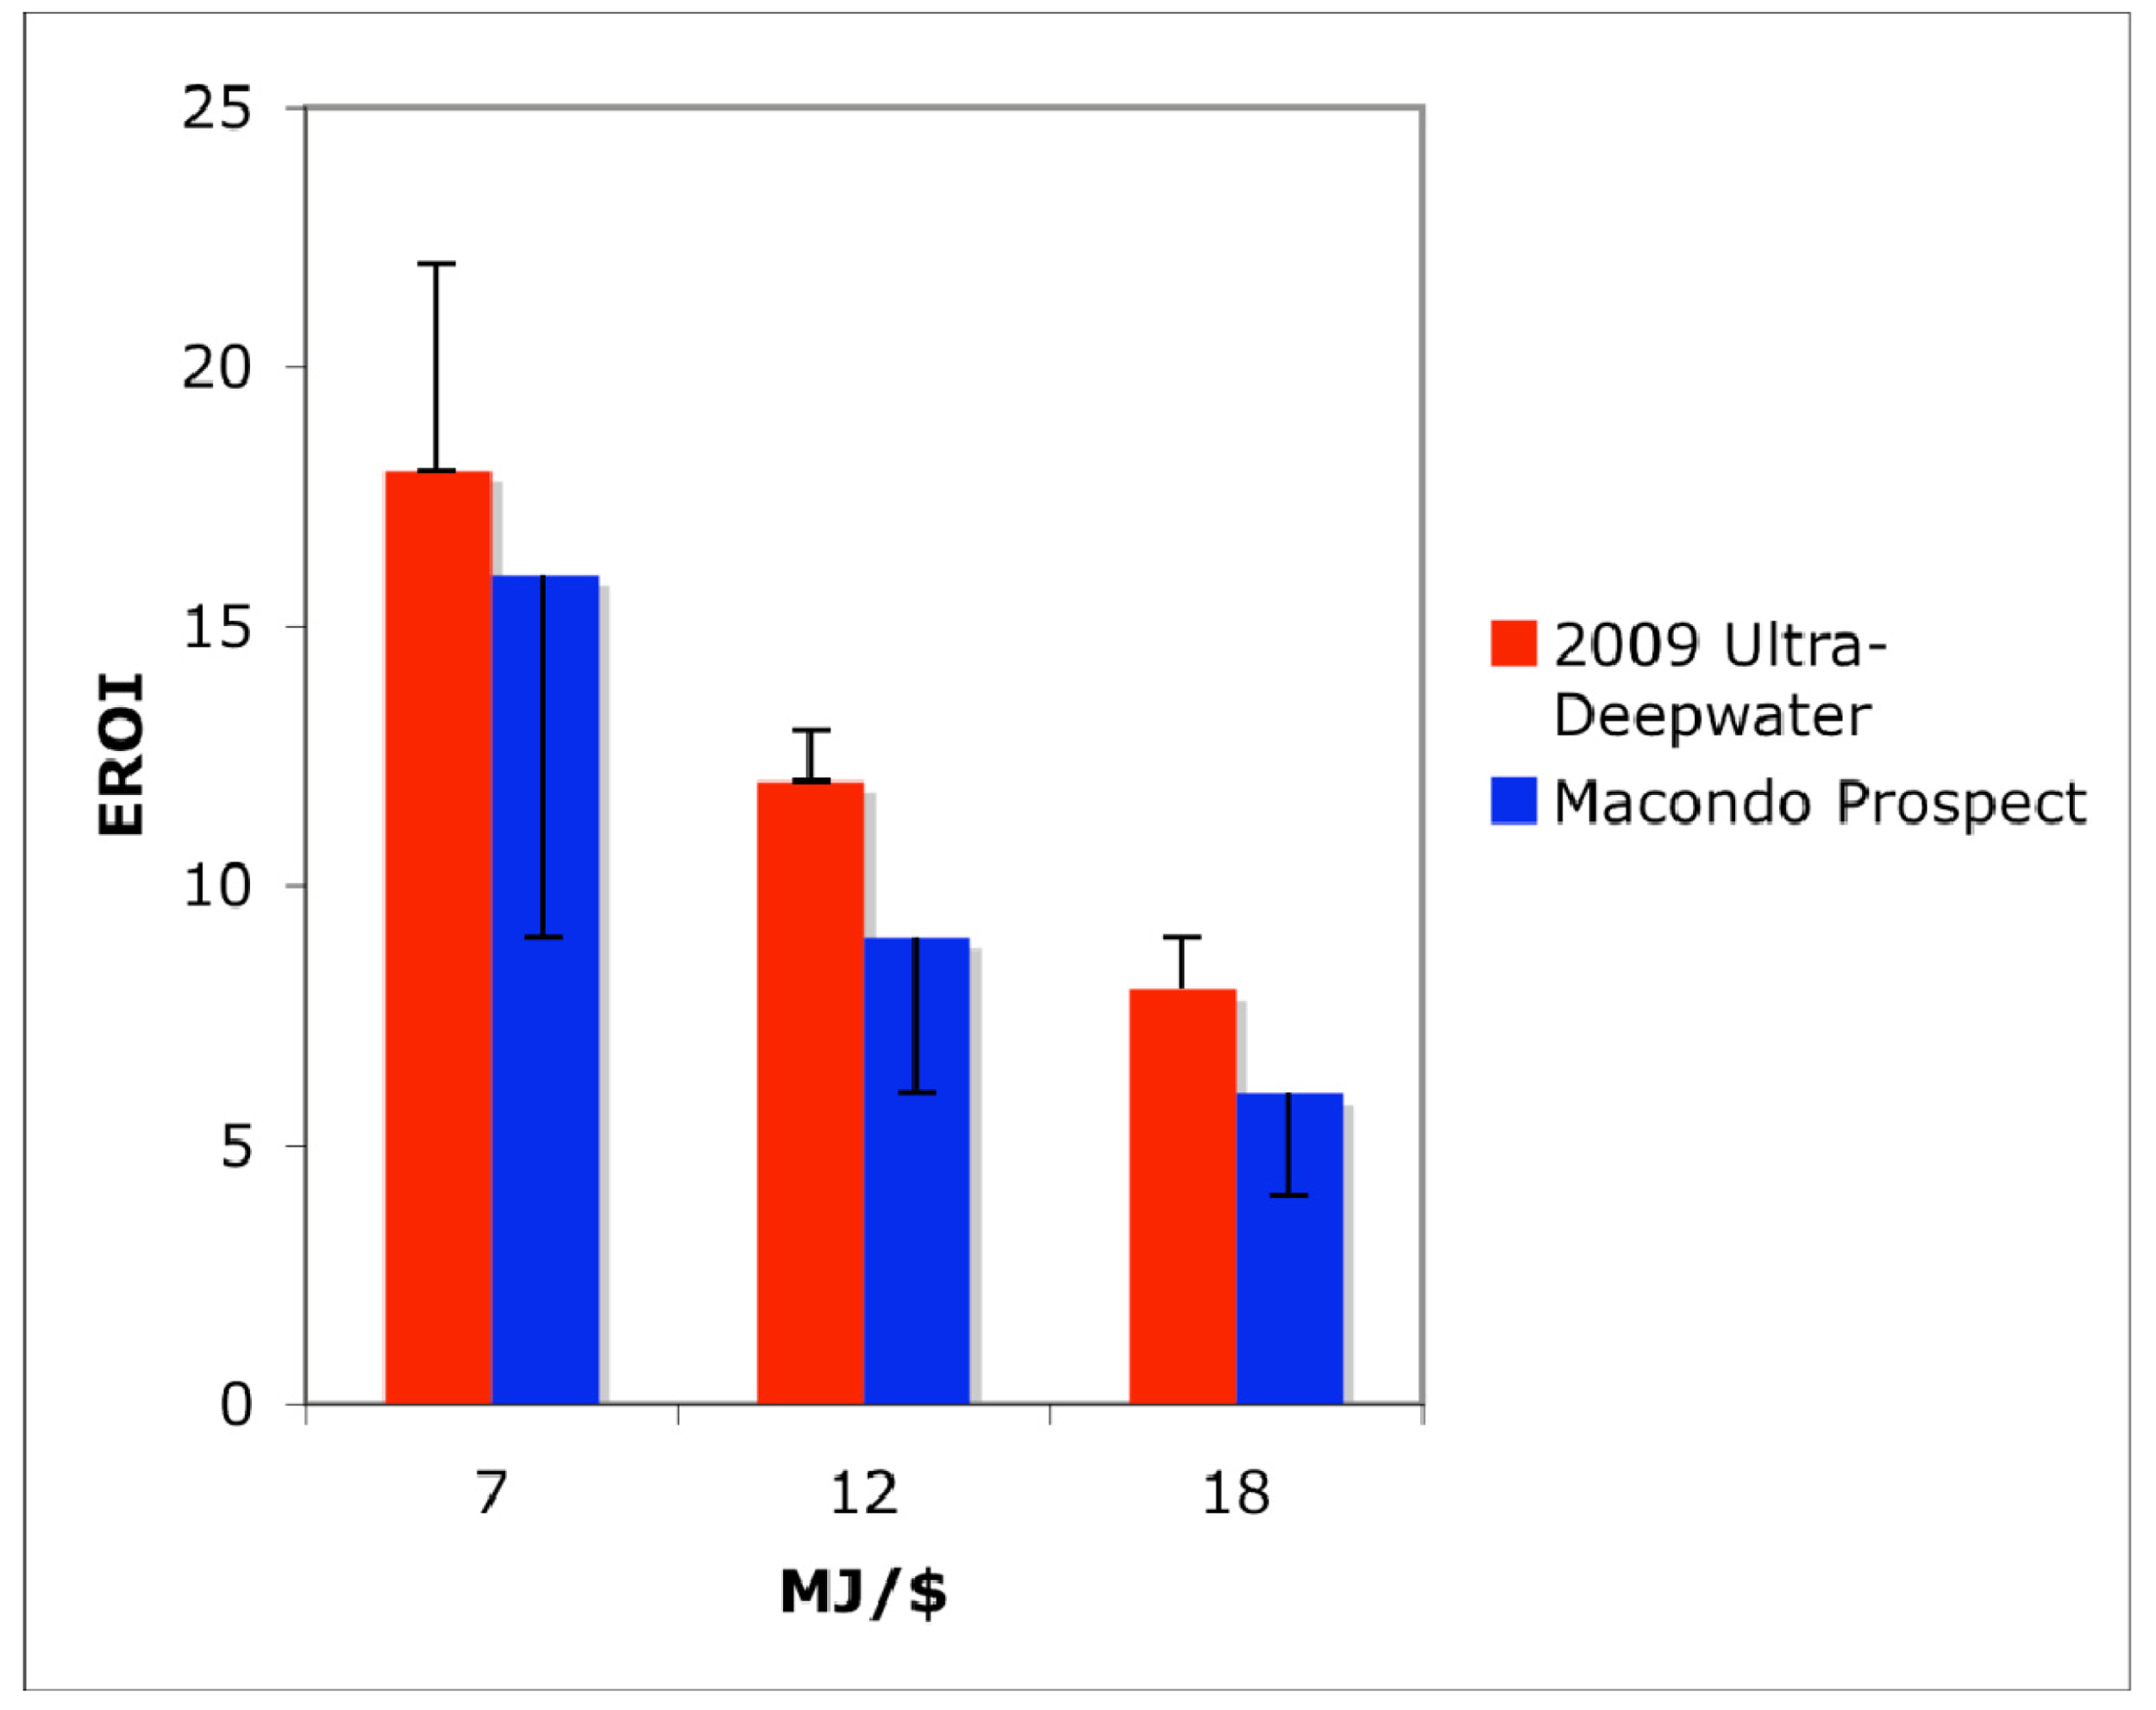
The EROI of oil and natural gas (BOE) produced in the ultra-deepwater of the GoM in 2009 is shown in Table 5. Again, EROI is based on low (25 rigs), average (27 rigs), and high (30 rigs) rig counts as given in Table 4. The range of EROI estimates for the Macondo Prospect and 2009 GoM ultra-deepwater energy production are presented in Figure 2.
4. Discussion
Our values for EROFI at the well-head ranged from $45/barrel to $141/barrel. By comparison, production costs for Mideast and North Africa oil ranges from $6/barrel to $28/barrel [48] and for the United States overall roughly twice that. These values for the GOM indicate that if these resources are used as the basis of US oil use the price of oil would have to be in the range of current prices, which maybe too high to sustain economic growth [14,17].
Energy intensity ratios from the literature were then used to convert these results to energy-based EROI. The sensitivity analysis yielded EROI values ranging from 4–22:1. The lower end of this range of EROI may be more accurate since these values were derived using energy intensity ratios for the oil and gas industry. Increasing rig counts and time required for extraction negatively influenced EROI for the United States as a whole. EROI for domestic oil and gas has declined from 100:1 for discoveries in 1930 and about 30:1 for production in the 1950s–1970s to about 10:1 in 2005–7 [16,18]. EROI values presented in this study are in the lower range of previously published estimates for domestic oil production, especially if our preferred high energy intensities are used. The EROI for oil and gas at the well-head in ultra-deepwater in 2009 ranged from 7–22:1, while the EROI for oil alone in ultra-deepwater was 4–14:1. Most of the variability was our choice of energy intensities used per dollar, The Macondo Prospect EROI for oil alone using the MMS production profile curve yielded a similar EROI of 4–16:1 based on estimates of varying reserve sizes and costs associated with extraction. The constant flow rate scenario for the Macondo Prospect yielded similar results in the range of 7–20:1. These values fit the trend of decreasing EROI over time as oil was produced from increasingly expensive fields.
Our EROI values can be compared to other reports of EROI for energy production processes including 80:1 for coal, 12–18:1 for imported oil, 5:1 or less for shale oil, 1.6 to 6.8:1 for solar, 18:1 for wind, 1.3:1 for biodiesel, 0.8 to 10:1 for sugarcane ethanol, and 0.8 to 1.6:1 for corn-based ethanol [3,44].
The EROI values of this study were based on financially-derived energy costs of production at the well-head only, and did not include all of the indirect costs of delivery to end use. Thus, these estimates are conservative. If all indirect costs were included in the EROI calculations, EROI would decrease. This underscores the need to make accessible better energy accounting information so that more refined analyses of the EROI of ultra-deepwater energy extraction can be carried out. Unfortunately, funding is being cut for the U.S. Energy Information Agency, the agency charged with providing such information to the public [49]. The lack of data availability regarding energy extraction costs in the GoM makes it difficult for the individuals, interest groups, and political representatives to make wise decisions regarding offshore energy policy. Informed decision-making on energy policy is essential to the long-term sustainability of society.
One of the energy cost factors only partially included in this study is the number of exploratory vs. development wells drilled in the ultra-deepwater in 2009. Exploratory wells are necessary for new discovery and in the period from 2004–2008, 226 wells were drilled in the ultra-deepwater GoM, 31% of which were successful [9]. The number of exploratory vs. development wells drilled in 2009 was not factored into the EROI calculations of this study due to data availability constraints. The impact on EROI would depend on how many of the exploratory wells ultimately produce oil and in what quantity. In addition, the insurance costs associated with rigs operating in ultra-deepwater were not included but are estimated by market analysts to range between 10–35% of the present value of the rig [50]. For a $500 million dollar rig, that would add between $50–$175 million in insurance costs per year of operation. If all of these costs were included it might decrease the EROI by perhaps 25 percent.
More expensive, higher capacity rigs produce higher EROI oil when producing from large reservoirs with high daily flow rates. As daily production declines from the plateau phase, the EROI of the well decreases since the same operational and infrastructural costs are being utilized to produce less oil and gas. The tendency to ramp up production early in the production process to get the maximum possible production rates, leads to more rapid decline rates of deep and ultra-deepwater wells [4,21]. High capital costs of production require fast turnaround times to bring energy to market and recoup capital expenditures. Long-term production potential is bypassed for short-term market decision-making. As profit margins decline with decreasing production, marginal wells must be abandoned so that the drilling resources can be utilized at more productive wells. The constant need to keep rigs in profitable production requires a consistent amount of exploratory drilling and new discoveries. Regardless of oil price, the energy required to extract the resource is relatively constant and increases with depth [10]. Thus, the rate of extraction and timing affects economic profitability but the net energy remains generally the same. Technological advancement may increase efficiency of extraction over time, thereby increasing energy return on investment but technology comes at the cost of research and development funding. A difficult situation arises when drilling contractors are prevented from accessing the resource either through federal regulation, as happened in 2010, or as a result of declining oil prices and decreasing production profitability. The latter is minimized through long-term contractual obligations. At the same time, the limited number of rigs in the deepwater drilling industry helps to maintain high usage rates for rigs in existence. Whenever a contract goes un-renewed, that rig is often moved to another basin or resource pool where the rig can be put into operation for another contractor. This optimal use of rigs tends to increase EROI. The actual price of oil at any given time is essentially the same worldwide, regardless of energy costs of producing the oil. Thus, the price for deep and ultra-deepwater oil is sub-optimal when world oil prices are low.
A factor contributing to the increased drilling in the deep and ultra-deepwater of the GoM are federal government subsidies to drilling companies. This increases financial profitability for oil companies but does not affect EROI. According to the Federal Land Policy and Management Act [51], the Department of Interior is required by law to ensure that “the United States receive fair market value of the use of public lands and their resources unless otherwise provided for by statute”.
Subsidy statutes applying to deepwater energy production, that circumvent the fair market value provision, are mainly the result of the Deepwater Royalty Relief Act (DWRRA) and the Energy Policy Act of 2005. The Deepwater Royalty Relief Act granted exploration leases issued between 1996 and 2000 an exemption from paying the government royalties on oil produced by wells that would not otherwise be economically viable. The program has been extended since its original expiration date in 2000. In addition, the Energy Policy Act put an oil-price threshold below which producers would not have to pay the government royalties thereby providing further incentive for companies to drill in the offshore GoM.
Numerous studies have shown royalties paid to the government for GoM offshore production are among the lowest rates paid to any fiscal system in the world [52,53]. The government is effectively subsidizing the most profitable corporations in the world at the expense of public taxpayers. These subsidies provide false market signals to continue energy supply processes that otherwise would not be competitive, thereby reducing economic efficiency [54]. This encourages oil companies to go after low EROI oil reserves that would likely not be produced without subsidies. Such subsidies further obscure reality by causing alternative energy markets to be less cost competitive [55].
Another indirect cost not accounted for in this study includes the cost of the loss of the value of ecosystem services as a result of federal offshore energy production. Air and water pollution attributed to the oil and gas industry are market externalities that in reality have costs borne by society. Ecosystem degradation in the form of wetland loss, partly as a result of oil and gas industry infrastructure, has increased the risk of natural disasters to coastal communities [56]. Batker et al. [57] carried out a partial assessment of the value of ecosystem services of the Mississippi River delta. They reported an annual value of ecosystem services of $12 to $47 billion and a minimum natural capital asset value of the delta of $330 billion to $1.3 trillion.
The damage to marine and coastal environments associated with the Macondo Prospect blowout is substantial. Commercial fisheries production and economic losses to the coastal tourism sector are expected to cost tens of billions of dollars. Including such costs in the analysis would likely cause the Macondo Prospect EROI to be negative. Ecosystem service values are largely outside the scope of the market economy, thereby discounting their importance to society.


| Study | # of Rigs | Amortized Construction Cost | Operating Cost | Exploration Cost | Total Cost per Year |
|---|---|---|---|---|---|
| Macondo Prospect | 1 | $62.2 million per year for nine years | $1 million per day | $1 million per day for 100 days | $527.2 million |
| Ultra-Deepwater GoM | 25–30 | $56.5 million per year for 10 years | $1 million per day | $1 million per day for 100 days | $13–15.7 billion |
| Time (days) | Total Reserves (millions of barrels) | EROFI (2009 USD$/bbl) | Energy Intensity Ratio (MJ/$) | EROI |
|---|---|---|---|---|
| 600 | 15 | $62 | 7 | 18:1 |
| 12 | 10:1 | |||
| 18 | 7:1 | |||
| 2000 | 50 | $59 | 7 | 20:1 |
| 12 | 12:1 | |||
| 18 | 8:1 | |||
| Time (years) | Total Reserves (millions of barrels) | EROFI (2009 USD $/bbl) | Energy Intensity Ratio (MJ/$) | EROI |
|---|---|---|---|---|
| 4 | 15 | $141 | 7 | 9:1 |
| 12 | 6:1 | |||
| 18 | 4:1 | |||
| 8 | 50 | $84 | 7 | 16:1 |
| 12 | 9:1 | |||
| 18 | 6:1 | |||
| # of rigs | EROFI (2009 USD $/bbl) | Energy Intensity Ratio (MJ/$) | EROI |
|---|---|---|---|
| 25 (low) | $71 | 7 | 14:1 |
| 12 | 8:1 | ||
| 18 | 5:1 | ||
| 27 (avg.) | $77 | 7 | 13:1 |
| 12 | 7:1 | ||
| 18 | 5:1 | ||
| 30 (high) | $86 | 7 | 11:1 |
| 12 | 7:1 | ||
| 18 | 4:1 | ||
| # of rigs | EROFI (2009 USD $/bbl) | Energy Intensity Ratio (MJ/$) | EROI |
|---|---|---|---|
| 25 (low) | $45 | 7 | 22:1 |
| 12 | 12:1 | ||
| 18 | 9:1 | ||
| 27 (avg.) | $48 | 7 | 18:1 |
| 12 | 12:1 | ||
| 18 | 8:1 | ||
| 30 (high) | $54 | 7 | 18:1 |
| 12 | 11:1 | ||
| 18 | 7:1 | ||
Acknowledgments
We would like to thank Charles Hall for assisting with the development of the methodology employed in this paper and for his comments on the paper and Mark Gately at the Rocky Mountain Institute in Boulder, Co. for the information he offered in improving upon previous EROI estimates in the GoM. The comments of an anonymous reviewer were also extremely helpful.
References and Notes
- Hofmeister, J.; Shell Oil Company. Statement before the House Select Committee on Energy Independence and Global Warming; Washington, DC, USA; 1; April; 2008. [Google Scholar]
- Robertson, P.J.; Chevron Corporation. Statement before the House Select Committee on Energy Independence and Global Warming; Washington, DC, USA; 1; April; 2008. [Google Scholar]
- Hall, C.A.S.; Day, J.W. Revisiting the limits to growth After Peak Oil. Am. Sci. 2009, 97, 230–237. [Google Scholar]
- Kaiser, M.J.; Yu, Y.; Pulsipher, A.G. Assessment of marginal production in the Gulf of Mexico and lost production from early decommissioning; Prepared for the U.S. Department of the Interior, Minerals Management Service: Gulf of Mexico OCS Region; April; 2010; MMS 2010-007. [Google Scholar]
- Ultra-Deepwater Advisory Committee (UDAC). A Federal Advisory Committee to the U.S. Secretary of Energy Meeting Minutes, San Antonio, TX, USA, 16–17, September 2009; Available online: www.fossil.energy.gov/programs/oilgas/ultra_and_unconventional/2010_Annual_Plan/11th_UDAC_Meeting_Minutes.pdf (accessed on 23 June 2011).
- USA Central Intelligence Agency World Factbook 2010. Available online: https://www.cia.gov/library/publications/the-world-factbook/fields/2174.html (accessed on 26 January 2011).
- USA Energy Information Agency Crude Oil Proved Reserves, Reserve Changes, and Production. Federal Offshore Louisiana and Texas 2010. Available online: http://www.eia.gov/dnav/pet/pet_crd_pres_dcu_R1901F_a.htm (accessed on 1 February 2011).
- USA Department of Energy. Offshore Technology Roadmap for the Ultra- Deepwater Gulf of Mexico. November 2000. Available online: fossil.energy.gov/programs/oilgas/publications/oilgas_generalpubs/offshore_GOM.pdf (accessed on 26 January 2011). [Google Scholar]
- USA Minerals Management Service. 2009 Gulf of Mexico Oil and Gas Production Forecast 2009–2018; OCS Report MMS 2009–012. New Orleans, Louisian, May 2009. Available online: www.gomr.boemre.gov/PDFs/2009/2009-012.pdf (accessed on 26 January 2011).
- Gately, M. The EROI of US offshore energy extraction: A net energy analysis of the Gulf of Mexico. Ecol. Econ. 2007, 63, 355–364. [Google Scholar]
- Dismukes, D.E.; Olatubi, W.O.; Mesyanzhinov, D.V.; Pulsipher, A.G. Modeling the Economic Impacts of Offshore Oil and Gas Activities in the Gulf of Mexico: Methods and Applications; Prepared by the Center for Energy Studies, Louisiana State University, Baton Rouge, La; U.S. Department of the Interior, Minerals Management Service, Gulf of Mexico OCS Region: New Orleans, Louisiana, 2003; MMS 2003-018. [Google Scholar]
- Costanza, R.; Herendeen, R.A. Embodied energy and economic value in the United States economy 1963, 1967, and 1972. Resour. Energy 1984, 6, 129–163. [Google Scholar]
- Gately, M. Rocky Mountain Institute: Boulder, CO, USA, Personal Communication; August; 2010.
- King, C.W.; Hall, C.A.S. Relating financial and energy return on investment. Sustainability 2011, 3, 1810–1832. [Google Scholar]
- Guilford, M.C.; Hall, C.A.S.; Cleveland, C.J. A new long term assessment of EROI for U.S. Oil and gas production. Sustainability 2011, 3, 1866–1887. [Google Scholar]
- Cleveland, C.J.; Costanza, R.; Hall, C.A.S.; Kaufmann, R. Energy and the United States economy- A biophysical perspective. Science 1984, 225, 890–897. [Google Scholar]
- Hall, C.A.S.; Balogh, S.; Murphy, D.J.R. What is the minimum EROI that a sustainable society must have? Energies 2009, 2, 25–47. [Google Scholar]
- Cleveland, C.J. Net energy from the extraction of oil and gas in the United States. Energy 2005, 30, 769–782. [Google Scholar]
- USA Minerals Management Service. Energy Information Agency Office of Oil and Gas, Gulf of Mexico Fact Sheet 2010. Available online: www.eia.doe.gov/special/gulf_of_mexico/index.cfm (accessed on 1 February 2011).
- IHS CERA. The Role of Deepwater Production in Global Oil Supply; Cambridge Energy Research Associates: Cambridge, MA, USA, 2010. Available online: http://press.ihs.com/press-release/energy-power/ihs-cera-role-deepwater-production-global-oil-supply (accessed on 1 February 2011).
- Gavin, S. ODS-Petrodata Consulting & Research; Presentation entitled “The outlook for offshore drilling” presented in Beijing and Singapore 19 and 22 March 2010. Available online: http://www.ods-petrodata.com/odsp/presentations.php (accessed on 1 February 2011).
- Anderson, R.N.; Boulanger, A. Prospectivity of the Ultra-Deepwater Gulf of Mexico; Lean Energy Initiative Lamont-Doherty Earth Observatory Columbia University: Palisades, NY, USA, 2002. Available online: leanenergy.ldeo.columbia.edu/docs/UltraDeep%20Prosp%2010-22-02.pdf (accessed on 1 February 2011).
- USA Bureau of Ocean Energy Management, Regulation and Enforcement. Technology Assessment & Research (TA&R) Project Categories: Offshore Structures, 2010. Available online: http://www.boemre.gov/tarprojectcategories/structur.htm (accessed on 1 February 2011).
- National Subsea Research Institute. Research aims to double the lifespan of oil rigs, Professional Engineering. 21 April 2010. Available online: http://www.highbeam.com/doc/1P3-2034033771.html (accessed on 1 June 2011).
- Sharma, R.; Kim, T.; Sha, O.P.; Misra, S.C. Issues in offshore platform research-Part1: Semi-submersibles. Int. J. Nav. Archit. Ocean Eng. 2010, 2, 155–170. [Google Scholar]
- USA Department of Energy. Offshore Roadmap 2000, Available online: fossil.energy.gov/programs/oilgas/publications/oilgas_generalpubs/offshore_GOM.pdf (accessed on 1 February 2011).
- Triepke, J. Analysis: 2009 Jackup Market Review; Rigzone: Houston, TX, USA, 11 December 2009. Available online: http://www.rigzone.com/news/article.asp?a_id=83956 (accessed on 1 February 2011).
- Klump, E. Anadarko May Take Biggest Hit from Gulf Oil Spill; Bloomberg News Service: New York City, NY, USA, 13 May 2010. Available online: http://www.bloomberg.com/news/2010-05-13/anadarko-may-take-biggest-hit-from-gulf-oil-spill-as-bp-s-silent-partner.html (accessed on 1 February 2011).
- Scherer, R. What if BP taps leaking Macondo well again?. Christian Science Monitor: Boston, MA, USA, 19 May 2010. Available online: http://www.csmonitor.com/USA/2010/0519/Gulf-oil-spill-What-if-BP-taps-leaking-Macondo-well-again (accessed on 1 February 2011).
- Offshore-technology.com. Deepwater Horizon: A Timeline of Events. Available online: http://www.offshore-technology.com/features/feature84446/ (accessed on 1 February 2011).
- Offshore Drilling Monthly; Jefferies & Company, Inc.: New York, NY; p. 10022. January-December; 2009.
- Rigzone Inc. Offshore Rig Day Rates. http://www.rigzone.com/data/dayrates/ (accessed on 31 May 2011).
- Leimkuhler, J. Shell Oil: How Do We Drill For Oil? Presented at the 2nd Annual Louisiana Oil & Gas Symposium, Baton Rouge, Louisiana, USA, August 2010.
- Rigzone Inc. Today's Trends: Offshore Rig Construction Costs, http://www.rigzone.com/news/article.asp?a_id=87487 (accessed on 1 February 2011).
- Hall, C.A.S.; Cleveland, C.J. Petroleum drilling and production in the United States, yield per effort and net energy analysis. Science 1981, 211, 576–579. [Google Scholar]
- Murphy, D.J.; Hall, C.A.; Dale, M.; Cleveland, C. Order from chaos: A preliminary protocol for determining the EROI of fuels. Sustainability 2011, 3, 1888–1907. [Google Scholar]
- USA Energy Information Agency. Annual Energy Outlook 2011, Report #:DOE/EIA-0383 ER. 2011. Available online: http://www.eia.doe.gov/forecasts/aeo/early_intensity.cfm (accessed on 1 February 2011).
- King, C.W. Energy intensity ratios as net energy measures of United States energy production and expenditures. Environ. Res. Lett. 2010, 5, 044006. [Google Scholar]
- Mulder, K.; Hagens, N.J. Energy return on investment: Toward a consistent framework. Ambio 2008, 37, 74–79. [Google Scholar]
- Berman, A. Causes and Implications of the BP Gulf of Mexico Oil Spill Presented at ASPO-USA World Oil Conference, Washington, DC, USA, 9 October 2010.
- USA Minerals Managements Service. 2007 Gulf of Mexico Oil and Gas Production Forecast 2007–2016. OCS Report MMS 2007–020; New Orleans, LA, USA; May; 2007. [Google Scholar]
- USA Minerals Managements Service. 2009 Gulf of Mexico Oil and Gas Production Forecast 2009–2018; OCS Report MMS 2009–012; New Orleans, LA, USA; May; 2009. [Google Scholar]
- Triepke, J. Analysis: 2009 Floater Rig Market Review, Available online: http://www.rigzone.com/news/article.asp?a_id=84343 (accessed on 1 February 2011).
- Murphy, D.J.; Hall, C.A.S. Year in review-EROI or energy return on (energy) invested. In Ecological Economics Reviews; Wiley-Blackwell: Ames, IA, USA, 2010; Volume 1185, pp. 102–118. [Google Scholar]
- Carnegie Mellon University Green Design Institute. Economic Input-Output Life Cycle Assessment (EIO-LCA), US 1997 and 2002 Industry Benchmark model, Available online: http://www.eiolca.net (accessed on 28 February 2011).
- United States Department of Labor, Bureau of Labor Statistics. CPI Inflation Calculator, Available online: http://www.bls.gov/data/inflation_calculator.htm (accessed on 8 July 2011).
- Weglein, A.B. Statement before the Subcommittee on Energy and Air Quality of the Committee on Energy and Commerce. The Ultra Deepwater Research and Development: What are the Benefits? Serial No. 108-77. 108th Congress U.S. House of Representatives: Washington, DC, USA, 29 April 2004. Available online: http://www.access.gpo.gov/congress/house/house05ch108.html (accessed on 4 April 2011). [Google Scholar]
- International Energy Agency. World Energy Outlook 2008, Available online: http://www.iea.org/w/bookshop/add.aspx?id=353 (accessed on 23 June 2011).
- USA Energy Information Agency. Immediate Reductions in EIA's Energy Data and Analysis Programs Necessitated by FY 2011 Funding Cut; U.S. Energy Information Administration: Washington, D.C., USA, 28 April 2011. Available online: http://www.eia.gov/pressroom/releases/press362.cfm (accessed on 20 May 2011).
- Slanis, B. Willis Group Holdings: “Upstream insurance” Presented at the 2nd Annual Louisiana Oil & Gas Symposium, Baton Rouge, Louisiana, USA, August 2010.
- USA Congress. Federal Land Policy and Management Act. Declaration of Policy. U.S. Code 43, Section 1701(a)(9); U.S. Congress: Washington D.C. USA, 2007. Available online: http://codes.lp.findlaw.com/uscode/43/35/I/1701 (accessed on 1 February 2011).
- USA Government Accountability Office. Oil and Gas Royalties: A Comparison of the Share of Revenue Received from Oil and Gas Production by the Federal Government and Other Resource Owners; Report No. GAO-07-676R. U.S. GAO: Washington D.C., USA, 1 May 2007; p. 3. Available online: www.gao.gov/products/GAO-07-676R (accessed on 16 October 2011).
- USA Government Accountability Office (GAO). Oil and Gas Royalties: The Federal System for Collecting Oil and Gas Revenues Needs Comprehensive Reassessment; U.S. GAO: Washington, D.C., USA, September 2008; p. 6. Available online: www.gao.gov/new.items/d08691.pdf (accessed on 16 October 2011).
- Freudenburg, W.R.; Gramling, R.; Laska, S.; Erikson, K.T. Organizing hazards, engineering disasters? Improving the recognition of political-economic factors in the creation of disasters. Soc. Forces 2008, 87, 1015–1038. [Google Scholar]
- Environmental Law Institute. Estimating U.S. Government Subsidies to Energy Sources: 2002–2008; The Environmental Law Institute: Washington, D.C., USA, 2009. Available online: http://www.eli.org/Program_Areas/innovation_governance_energy.cfm (accessed on 16 October 2011).
- Costanza, R.; Perez-Maqueo, O.; Martinez, M.L.; Sutton, P.; Anderson, S.J.; Mulder, K. The value of coastal wetlands for hurricane protection. Ambio 2008, 37, 241–248. [Google Scholar]
- Batker, D.; de la Torre, I.; Costanza, R.; Swedeen, P.; Day, J.W.; Boumans, R.; Bagstd, K. Gaining Ground: Wetlands, Hurricanes and the Economy: The Value of Restoring the Mississippi River Delta; Earth Economics: Tacoma, WA, USA, 2010. Available online: www.eartheconomics.org/FileLibrary/file/Reports/Louisiana/Earth_Economics_Report_on_the_Mississippi_River_Delta_compressed.pdf (accessed on 1 February 2011).
© 2011 by the authors; licensee MDPI, Basel, Switzerland. This article is an open access article distributed under the terms and conditions of the Creative Commons Attribution license (http://creativecommons.org/licenses/by/3.0/).
Share and Cite
Moerschbaecher, M.; Day Jr., J.W. Ultra-Deepwater Gulf of Mexico Oil and Gas: Energy Return on Financial Investment and a Preliminary Assessment of Energy Return on Energy Investment. Sustainability 2011, 3, 2009-2026. https://doi.org/10.3390/su3102009
Moerschbaecher M, Day Jr. JW. Ultra-Deepwater Gulf of Mexico Oil and Gas: Energy Return on Financial Investment and a Preliminary Assessment of Energy Return on Energy Investment. Sustainability. 2011; 3(10):2009-2026. https://doi.org/10.3390/su3102009
Chicago/Turabian StyleMoerschbaecher, Matthew, and John W. Day Jr. 2011. "Ultra-Deepwater Gulf of Mexico Oil and Gas: Energy Return on Financial Investment and a Preliminary Assessment of Energy Return on Energy Investment" Sustainability 3, no. 10: 2009-2026. https://doi.org/10.3390/su3102009
APA StyleMoerschbaecher, M., & Day Jr., J. W. (2011). Ultra-Deepwater Gulf of Mexico Oil and Gas: Energy Return on Financial Investment and a Preliminary Assessment of Energy Return on Energy Investment. Sustainability, 3(10), 2009-2026. https://doi.org/10.3390/su3102009