Application of an Expanded Sequestration Estimate to the Domestic Energy Footprint of the Republic of Ireland


Abstract
:1. Introduction
2. Methodological Option for Including Additional Carbon Sinks into Ecological Footprint Methodology
2.1. Tree Increment Pool
2.2. The Litter, Dead and Soil Pools
2.3. Grassland Sequestration
3. Calculation Methods
3.1. Calculating a Carbon Sequestration Estimate Based on Forest Increment
3.2. Carbon Accumulation in the Litter, Dead and Soil Pools
3.3. Carbon Sequestration in Irish Grasslands
4. Results
4.1. Forest Sequestration

| Age (years) | 1,000 ha | Increment | Litter | Dead | Soil |
|---|---|---|---|---|---|
| t C/ha/yr | |||||
| Sitka spruce | |||||
| 1–10 | 112.14 | 2.25 | 0.16 | 0.00 | –0.59 |
| 11–20 | 120.90 | 7.13 | 0.26 | 0.18 | 0.20 |
| 21–30 | 38.68 | 6.14 | 0.25 | 0.43 | 0.20 |
| 31–40 | 40.93 | 6.09 | 0.44 | 0.53 | 0.20 |
| 41–50 | 14.15 | 4.40 | 0.40 | 0.53 | 0.20 |
| 51+ | 1.02 | 2.85 | 0.44 | 0.47 | 0.20 |
| Norway spruce | |||||
| 1–10 | 11.55 | 0.41 | 0.04 | 0.00 | –0.59 |
| 11–20 | 6.19 | 3.02 | 0.12 | 0.04 | 0.20 |
| 21–30 | 1.24 | 8.60 | 0.30 | 0.15 | 0.20 |
| 31–40 | 2.95 | 9.25 | 0.52 | 0.23 | 0.20 |
| 41–50 | 3.25 | 7.79 | 0.58 | 0.25 | 0.20 |
| 51+ | 0.77 | 5.52 | 0.60 | 0.23 | 0.20 |
| Scots pine | |||||
| 1–10 | 2.22 | 0.41 | 0.04 | 0.00 | –0.59 |
| 11–20 | 1.11 | 1.39 | 0.07 | 0.02 | 0.20 |
| 21–30 | 0.19 | 2.47 | 0.13 | 0.11 | 0.20 |
| 31–40 | 0.64 | 4.62 | 0.26 | 0.13 | 0.20 |
| 41–50 | 0.61 | 4.56 | 0.31 | 0.14 | 0.20 |
| 51+ | 2.57 | 2.82 | 0.33 | 0.13 | 0.20 |
| Other Pine | |||||
| 1–10 | 10.59 | 0.78 | 0.06 | 0.06 | –0.59 |
| 11–20 | 15.25 | 3.12 | 0.15 | 0.15 | 0.20 |
| 21–30 | 23.81 | 5.40 | 0.23 | 0.23 | 0.20 |
| 31–40 | 9.78 | 4.68 | 0.35 | 0.35 | 0.20 |
| 41–50 | 3.11 | 3.96 | 0.35 | 0.35 | 0.20 |
| 51+ | 1.07 | 2.88 | 0.35 | 0.35 | 0.20 |
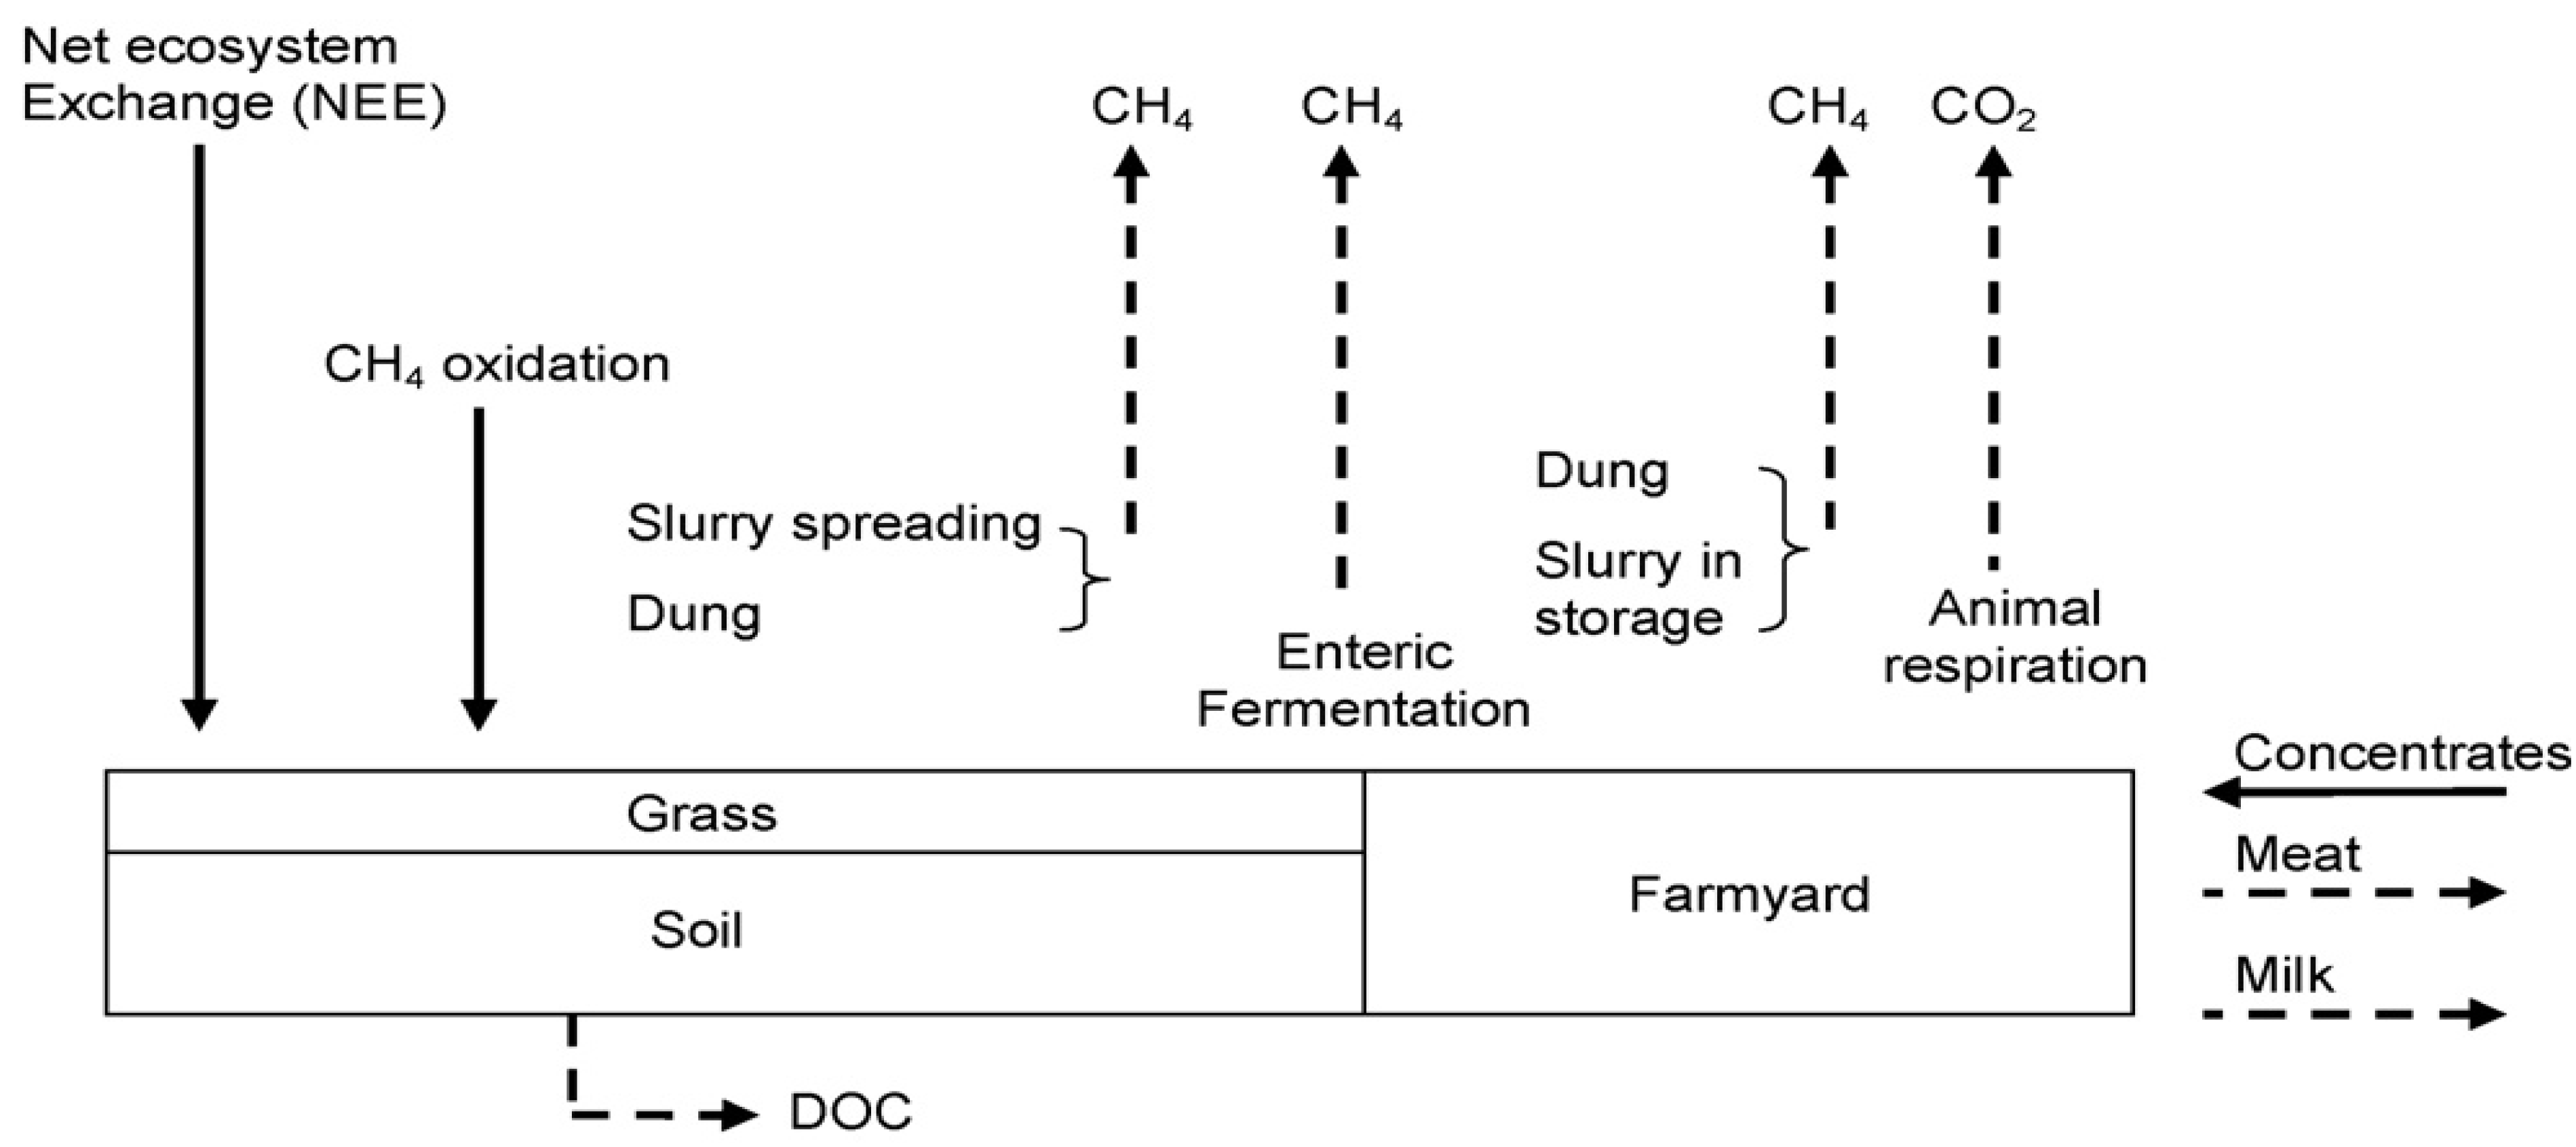
4.2. Estimating Grassland Sequestration
| Farm A | Farm B | Organic (estimated) | |
|---|---|---|---|
| Carbon inputs | t C/ha/yr | ||
| Net ecosystem (NEE) | 2.9 | 2.9 | −0.25 |
| Concentrates | 0.4 | 0.68 | 0.54 |
| CH4 oxidation | 0.0015 | 0.0015 | 0.0028 |
| Inputs sub Total | 3.3015 | 3.5815 | 0.29282 |
| Carbon outputs | |||
| Milk | –0.21 | –0.31 | −0.26 |
| Meat | –0.02 | –0.02 | –0.02 |
| Enteric fermentation | –0.11 | –0.12 | –0.115 |
| CH4—Dung in farmyard | –0.001 | –0.001 | –0.001 |
| CH4—Dung in field | –0.0005 | –0.0005 | –0.0005 |
| CH4—Slurry spreading | –0.08 | –0.06 | –0.07 |
| DOC (in stream) | –0.1 | –0.1 | –0.1 |
| CH4—Slurry in storage | –0.0001 | –0.0001 | –0.0001 |
| Animal respiration | –0.73 | –0.82 | –1.3281 |
| Outputs Sub Total | –1.2516 | –1.4316 | –1.3416 |
| Net balance | 2.0499 | 2.1499 | –1.6018 |
| Area | T C/ha/yr | ||
|---|---|---|---|
| 1,000 ha. | Farm | NEE | |
| Mineral soil | 3,553 | 2.1 | 3.45 |
| Organic soil | 289 | –1.6 | –0.25 |
| Average | 1.82 | 3.17 | |
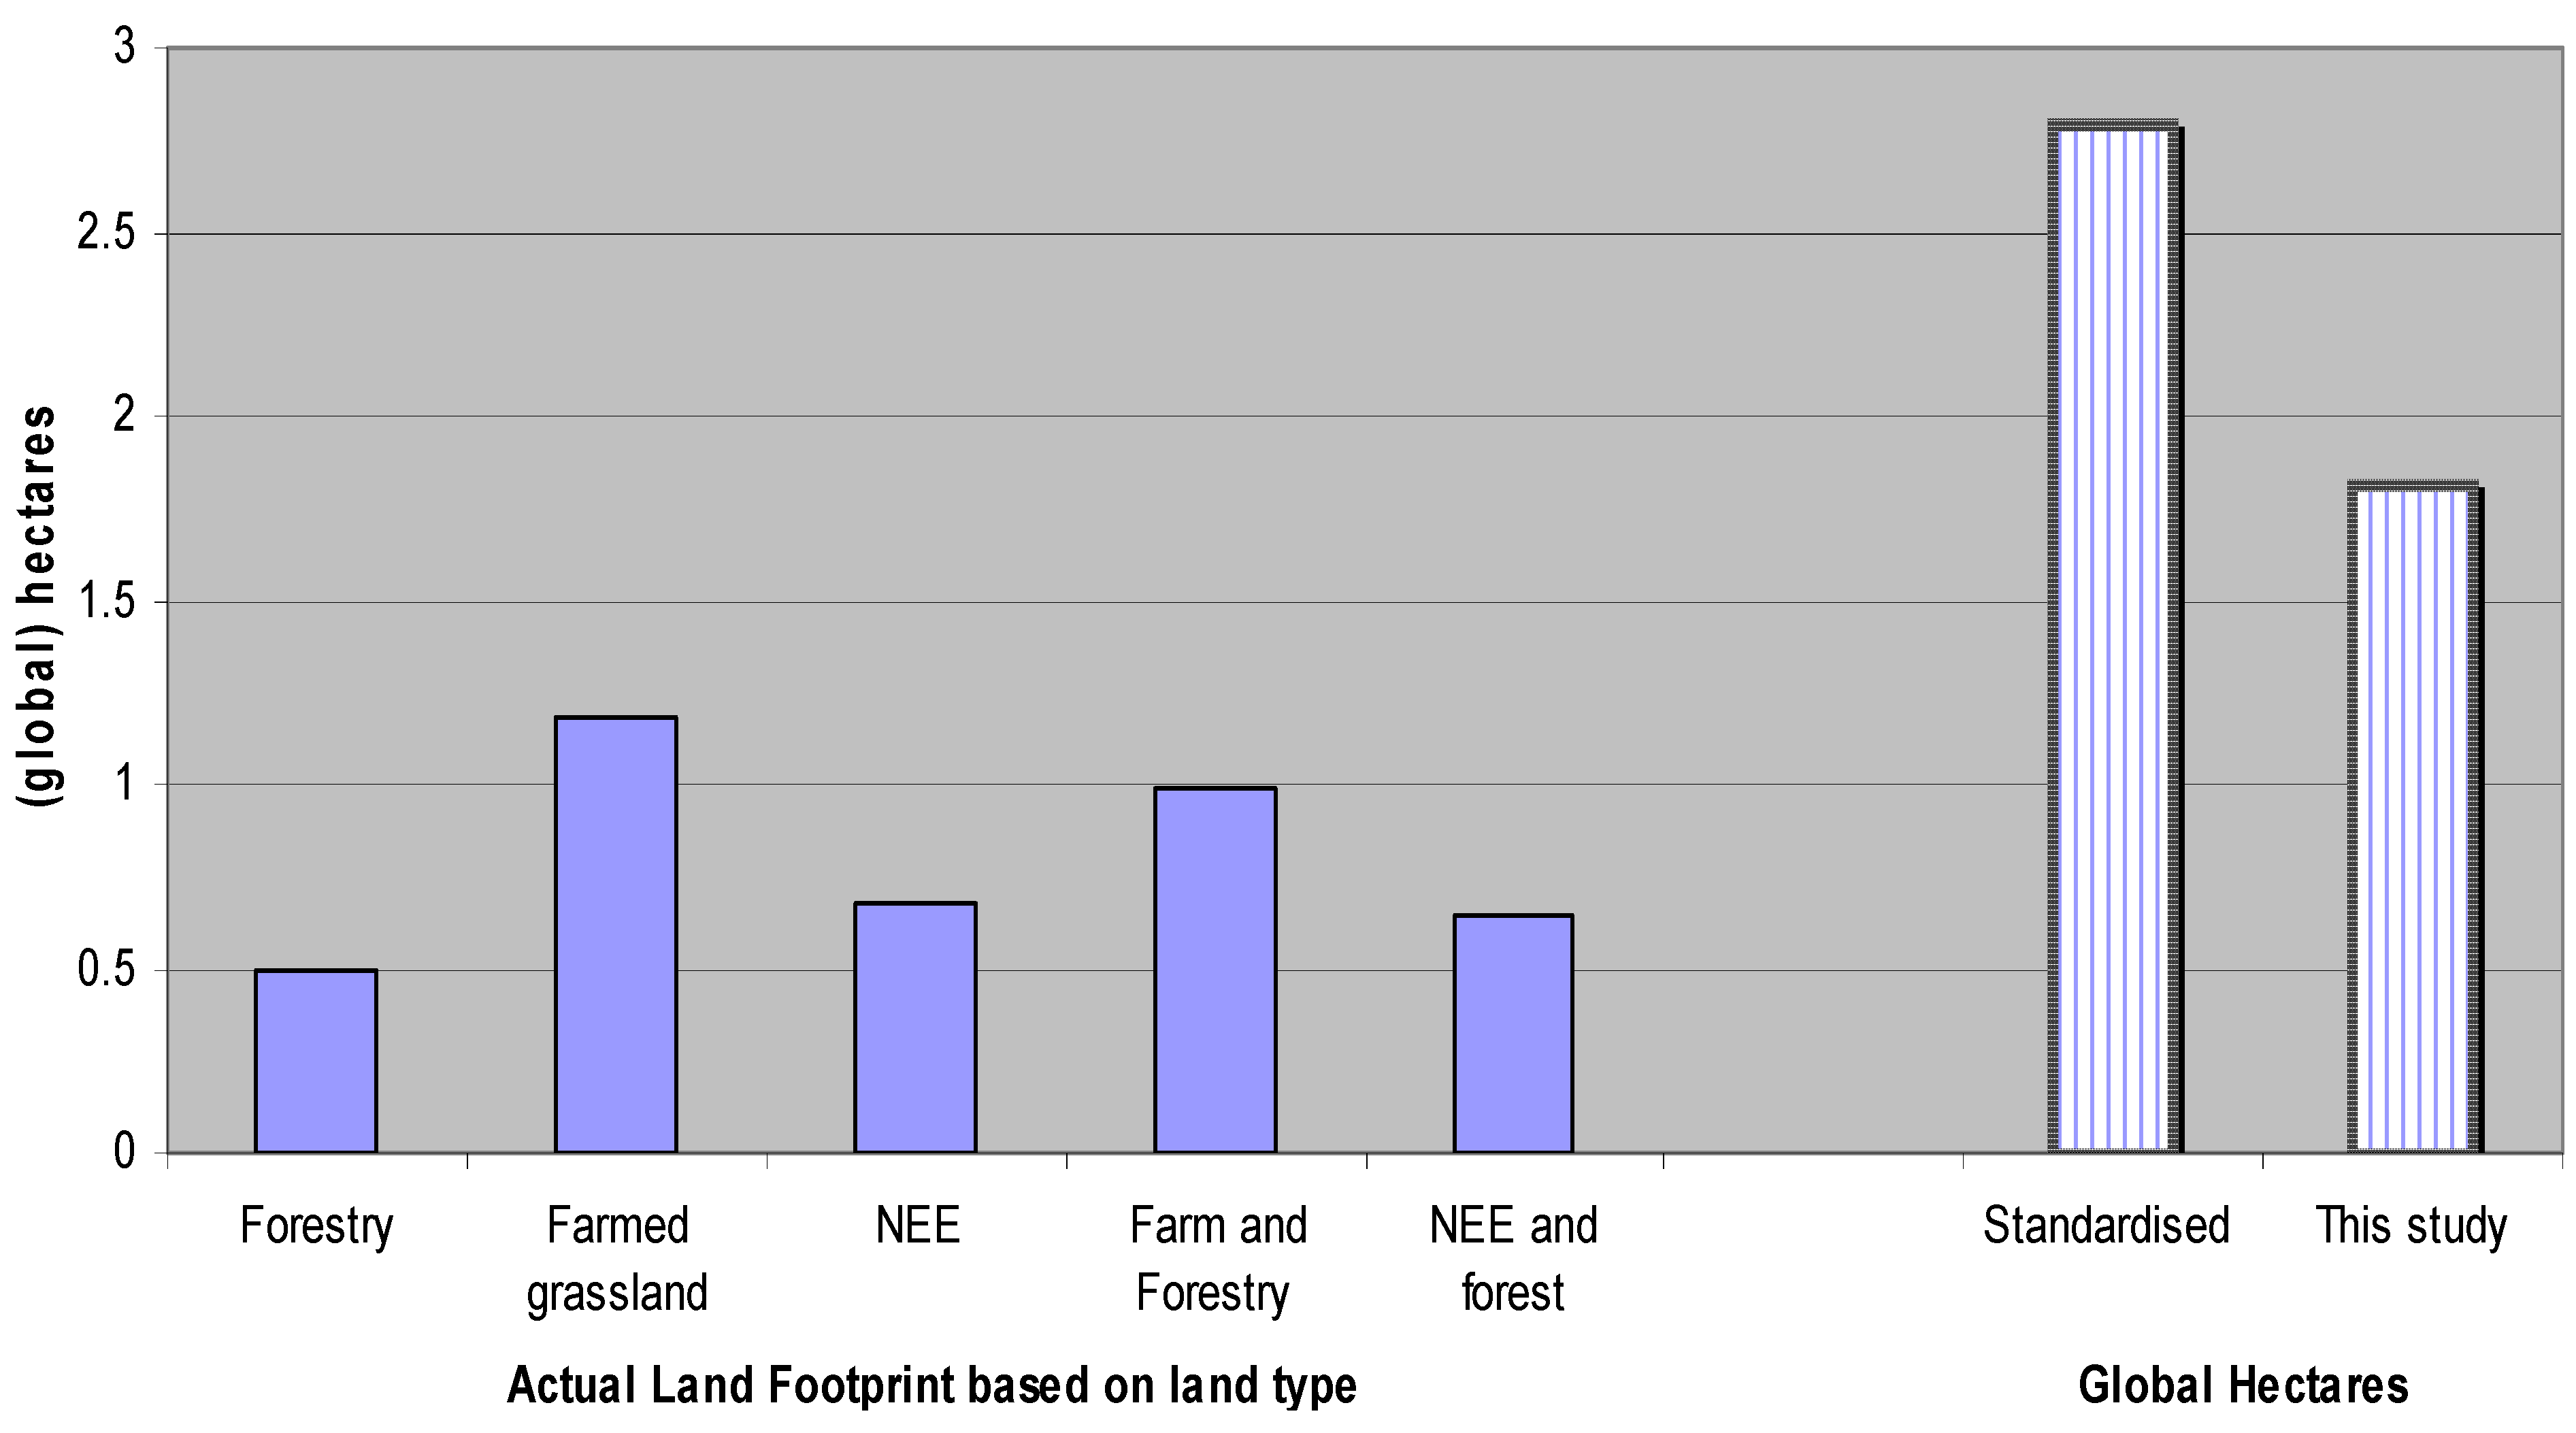
| Forest and Farmed Grassland | Forest and Grassland Net Ecosystem (NEE) | |
|---|---|---|
| t C/ha/yr | 2.17 | 3.34 |
| Footprint (ha) | 3,862,996 | 2,515,141 |
| ha/cap | 0.91 | 0.59 |
5. Discussion
5.1. Factors Affecting Forest Sequestration Estimates
5.2. Methodological and Conceptual Options for Estimating Grassland Sequestration
5.3. Uncertainties
| Parameter | Level of uncertainty | Impact |
|---|---|---|
| Decomposition rate | High | Significant for litter and deadpool estimate. However unlikely to greatly impact overall forest sequestration estimation. |
| Tree mortality | Medium if applied nationally; high if applied to a specific area. | Significant for deadwood estimate. |
| Forest soil sequestration | High | Unlikely to be significant in comparison to tree biomass estimate. |
| Animal respiration | Medium, as based on published results, but may not fully reflect outdoor conditions. | Potentially significant for modified NEE and hence overall estimate. |
| NEE | Medium to high. | Depends on the variance between grassland areas mentioned in [15] and national areas. Potentially significant. |
5.4. Estimating Results in Terms of Global Hectares
6. Conclusions
Acknowledgements
References
- Living Planet Report 2008; WWF (World Wide Fund), Global Footprint Network, UNEP World Conservation Monitoring Centre: Gland, Switzerland. Available online: www.panda.org/livingplanet (accessed on 25 February 2009).
- Kitzes, J.; Galli, A.; Bagliani, M.; Barrett, J.; Dige, G.; Ede, S.; Erb, K.; Giljum, S.; Haberl, H.; Hails, C.; Jolia-Ferrier, L.; Jungwirth, S.; Lenzen, M.; Lewis, K.; Loh, J.; Marchettini, N.; Messinger, H.; Milne, K.; Moles, R.; Monfreda, C.; Moran, D.; Nakano, K.; Pyhälä, A.; Rees, W.; Simmons, C.; Wackernagel, M.; Wada, Y.; Walsh, C.; Wiedmann, T. A research agenda for improving national ecological footprint accounts. Ecol. Econ. 2009, 68, 1991–2007. [Google Scholar]
- Brack, C.; Wood, G. Forest Mensuration Resources; Department of Forestry, School of Resource and Environmental Management, Australian National University: Canberra, Australia, 1998. Available online: http://sres.anu.edu.au/associated/mensuration/BrackandWood1998/INDEX.HTM (accessed on 16 October 2009).
- Long, J.N.; Smith, F.W. Relationship between size and density in developing stands: A description and possible mechanisms. Forest Ecol. Manage. 1984, 7, 191–206. [Google Scholar] [CrossRef]
- Hozumi, K. Interactions among Higher Plants; Kyoritsu-Shuppan: Tokyo, Japan, 1973; p. 124. [Google Scholar]
- Prescott, C.E.; Blevins, L.L.; Staley, C.L. Litter decomposition in B.C. forests: Controlling factors and influences of forestry activities. BC. J. Ecosyst. Manage. 2004, 5, 44–57. [Google Scholar]
- Yin, X.; Perry, J.A.; Dixon, R.K. Influence of canopy removal on oak forest floor decomposition. Can. J. Forest Res. 1989, 19, 204–214. [Google Scholar] [CrossRef]
- Valentini, R.; Matteucci, G.; Dolman, A.J.; Schulze, E.D.; Rebmann, C.; Moors, E.J.; Granier, A.; Gross, P.; Jensen, N.O.; Pilegaard, K.; Lindroth, A.; Grelle, A.; Bernhofer, C.; Grunwald, T.; Aublnet, M.; Ceulemans, R.; Kowalski, A.S.; Vesala, T.; Rannik, U.; Berbigier, P.; Loustau, D.; Guomundsson, J.; Thorgeirsson, H.; Ibrom, A.; Morgenstern, K.; Clement, R.; Moncrieff, J.; Montagnani, L.; Minerbi, S.; Jarvis, P.G. Respiration as the main determinant of carbon balance in European forests. Nature 2000, 404, 861–865. [Google Scholar] [CrossRef] [PubMed]
- Lai, R. Forest soils and carbon sequestration. Forest Ecol. Manage. 2005, 220, 242–258. [Google Scholar] [CrossRef]
- Waring, R.H.; McDowell, N. Use of a physiological process model with forestry yield tables to set limits on annual carbon balances. Tree Physiol. 2002, 22, 179–188. [Google Scholar] [CrossRef] [PubMed]
- Jones, M.B.; Donnelly, A. Carbon sequestration in temperate grassland ecosystems and the influence of management, climate and elevated CO2. New Phytol. 2004, 164, 423–439. [Google Scholar] [CrossRef]
- Six, J.; Conant, R.T.; Paul, E.A.; Paustian, K. Stabilization mechanisms of soil organic matter: Implications for C-saturation of soils. Plant Soil 2002, 241, 155–176. [Google Scholar] [CrossRef]
- Marinissen, J.C.Y.; Hillenaar, S.I. Earthworm-induced distribution of organic matter in macro-aggregates from differently managed arable fields. Soil Biol. Biochem. 1997, 29, 391–395. [Google Scholar] [CrossRef]
- Schulze, E.D.; Valentini, R; Sanz, M.J. The long way from Kyoto to Marrakesh: Implications of the Kyoto Protocol negotiations for global ecology. Glob. Change Biol. 2002, 8, 505–518. [Google Scholar] [CrossRef]
- Byrne, K.A.; Kiely, G.; Leahy, K. Carbon sequestration determined using farm scale carbon balance and eddy covariance. Agr. Ecosyst. Environ. 2007, 121, 357–364. [Google Scholar] [CrossRef]
- Ireland’s National Forest Inventory; Department of Agriculture and Food: Dublin, Ireland, 2007. Available online: http://www.agriculture.gov.ie/nfi/ (accessed on 20 November 2009).
- Lynch, J. Coillte, Wicklow, Ireland. Personnel communication by telephone. 2009. [Google Scholar]
- Magner, D. Tree Species Selection in Ireland: Forestry and Timber Yearbook 2008; Irish Timber Growers Association: Dublin, Ireland, 2008. [Google Scholar]
- Horgan, T.; Keane, M.; McCarthy, R.; Lally, M.; Thompson, D. A Guide to Forest Tree Species Selection and Silviculture in Ireland; National Council for Forest Research and Development: Dublin, Ireland, 2003. [Google Scholar]
- Joyce, P.M.; Huss, J.; McCarthy, R.; Pfeifer, A.; Hendrick, E. Growing Broadleaves; National Council for Forest Research and Development: Dublin, Ireland, 1998. [Google Scholar]
- Matthews, R.W.; Johnson, D.; Halsall, L. Forest Yield; British Forestry Commission: Edinburgh, UK, 2005. [Google Scholar]
- Tobin, B.; Black, K.G.; Nieuwenhuis, M.; Gardiner, J. Biomass expansion factors and forest biomass c stores. In Carbon Sequestration and Irish Forest Ecosystems; Black, K., Farrell, E.P., Eds.; National Council for Forest Research: Dublin, Ireland, 2006; pp. 29–41. [Google Scholar]
- Lehtonen, A.; Makipaa, R.; Heikkinen, J.; Sievanen, R.; Liski, J. Biomass Expansion Factors (BEFs) for Scots pine, Norway spruce and birch according to stand age for boreal forests. Forest Ecol. Manage. 2004, 188, 211–224. [Google Scholar] [CrossRef]
- Levy, P.E.; Hale, S.E.; Nicoll, B.C. Biomass expansion factors and root: Shoot ratios for coniferous tree species in Great Britain. Forestry 2004, 77, 421–430. [Google Scholar] [CrossRef]
- Kogel-Knabner, I. The macromolecular organic composition of plant and microbial residues as inputs to soil organic matter. Soil Biol. Biochem. 2002, 34, 139–162. [Google Scholar] [CrossRef]
- Saiz, G.; Byrne, K; Farrell, E.P. Soil carbon fluxes. In Carbon Sequestration and Irish Forest Ecosystems; Black, K., Farrell, E.P., Eds.; National Council for Forest Research: Dublin, Ireland, 2006; pp. 7–19. [Google Scholar]
- Mackensen, J.; Bauhus, J. The Decay of Coarse Woody Debris; National Carbon Accounting System, Technical Report No.6; Australian Greenhouse Office: Canberra, Australia, 1999. [Google Scholar]
- McGettigan, M.; Duffy, P.; Hyde, B; O’Brien, P. GHG emissions 1990–2006. In National Inventory Report; Environmental Protection Agency: Wexford, Ireland, 2008. [Google Scholar]
- Reidy, B.; Dyckmans, J.; Schmidt, O.; Bolger, T. Soil stocks and soil processes. In Carbon Sequestration and Irish Forest Ecosystems; Black, K., Farrell, E.P., Eds.; National Council for Forest Research: Dublin, Ireland, 2006; pp. 19–28. [Google Scholar]
- Black, K.G.; Tobin, B.; Osborne, B. Ecosystem processes. In Carbon Sequestration and Irish Forest Ecosystems; Black, K., Farrell, E.P., Eds.; National Council for Forest Research: Dublin, Ireland, 2006; pp. 41–54. [Google Scholar]
- Good Practice Guidance for Land Use, Land-Use Change and Forestry; Penman, J.; Gytarsky, M.; Hiraishi, T.; Krug, T.; Kruger, D.; Pipatti, R.; Buendia, L.; Miwa, K.; Ngara, T.; Tanabe, K.; Wagner, F. (Eds.) Intergovernmental Panel on Climate Change: Kanagawa, Japan, 2003.
- Smyth, K.A.; Dobbie, K.E.; Ball, B.C.; Bakken, L.R.; Sitaula, B.K.; Hansen, S.; Borken, W.; Christensen, S.; Priemé, A.; Fowler, D.; Macdonald, J.A.; Skiba, U.; Klemedtsson, L.; Kasimir-Klemedtsson, A.; Degórska, A.; Orlanski, P. Oxidation of atmospheric methane in Northern European soils, comparison with other ecosystems, and uncertainties in the global terrestrial sink. Glob. Change Biol. 2000, 6, 791–803. [Google Scholar] [CrossRef]
- McGettigan, M.; Duffy, P.; Hyde, B; Hanley, E.; O’Brien, P. GHG emissions 1990–2007. In National Inventory Report; Environmental Protection Agency: Wexford, Ireland, 2008. [Google Scholar]
- McGettigan, M.; Duffy, P.; Connolly, N.; O’Brien, P. GHG emissions 1990–2005. In National Inventory Report 2005; Environmental Protection Agency: Wexford, Ireland, 2007. [Google Scholar]
- McGettigan, M.; Duffy, P.; Connolly, N.; O’Brien, P. National Greenhouse Gas Inventory Report 2005; Environmental Protection Agency: Wexford, Ireland, 2007. [Google Scholar]
- Thomas, P.; Packham, J.R. Ecology of Woodlands and Forests: Description, Dynamics and Diversity; Cambridge University Press: New York, NY, USA, 2007. [Google Scholar]
- Olsen, J.S. Energy storage and the balance of producers and decomposers in ecological systems. Ecology 1963, 44, 322–331. [Google Scholar] [CrossRef]
- Prescott, C.E. Do rates of litter decomposition tell us anything we really need to know? Forest Ecol. Manage. 2005, 220, 66–74. [Google Scholar] [CrossRef]
- Prescott, C.E.; Chappell, H.N.; Vesterdal, L. Nitrogen turnover in forest floors of coastal Douglas-fir at sites differing in soil nitrogen capital. Ecology 2000, 81, 1878–1886. [Google Scholar] [CrossRef]
- Byrne, K.A.; Farrell, E.P. The effect of afforestation on soil carbon dioxide emissions in blanket peatland in Ireland. Forestry 2005, 78, 217–227. [Google Scholar] [CrossRef]
- Byrne, K.A.; Kiely, G.; Leahy, P. CO2 fluxes in adjacent new and permanent temperate grasslands. Agr. Forest Meteorol. 2005, 135, 82–92. [Google Scholar] [CrossRef]
- World Footprint Academic Account; Global Footprint Network: Oakland, CA, USA, 2004.
© 2010 by the authors; licensee MDPI, Basel, Switzerland. This article is an Open Access article distributed under the terms and conditions of the Creative Commons Attribution license (http://creativecommons.org/licenses/by/3.0/).
Share and Cite
Walsh, C.; Moles, R.; O’Regan, B. Application of an Expanded Sequestration Estimate to the Domestic Energy Footprint of the Republic of Ireland. Sustainability 2010, 2, 2555-2572. https://doi.org/10.3390/su2082555
Walsh C, Moles R, O’Regan B. Application of an Expanded Sequestration Estimate to the Domestic Energy Footprint of the Republic of Ireland. Sustainability. 2010; 2(8):2555-2572. https://doi.org/10.3390/su2082555
Chicago/Turabian StyleWalsh, Conor, Richard Moles, and Bernadette O’Regan. 2010. "Application of an Expanded Sequestration Estimate to the Domestic Energy Footprint of the Republic of Ireland" Sustainability 2, no. 8: 2555-2572. https://doi.org/10.3390/su2082555
APA StyleWalsh, C., Moles, R., & O’Regan, B. (2010). Application of an Expanded Sequestration Estimate to the Domestic Energy Footprint of the Republic of Ireland. Sustainability, 2(8), 2555-2572. https://doi.org/10.3390/su2082555