1. Introduction
Water resources management is one of the most pressing environmental issues, especially because of the competition between industry, agriculture, municipal and energy utilization of water resources. At the global level, 80%–90% of all the water is consumed in agriculture. Unfortunately, water use efficiency in agriculture is poor with more than 50% water losses, making possible to save enormous water quantities in the agricultural sector, when compared with other sectoral water uses [
1]. Moreover, in many regions of the world, plant growth and crop yields are limited by water deficits, as more frequent and intense droughts and the areas of land characterized as very dry, have increased in recent decades [
2]. Agriculture utilizes a large part of the total fresh water not only in dry but also in sub-humid environments. For instance, in the Po river basin (the largest river in Italy, supplying fresh water to millions of people), of the total water drawn from the river, 16% is used for municipal usage (drinking water), 20% is used for industrial activities (processes and cooling), 18% for energy (hydroelectric power) and 46% for agriculture (irrigation).
The most important strategies for improving water use efficiency in agriculture are: (a) improvement of the water distribution system with reduction of seepage losses in canals and pipelines, (b) optimization of irrigation techniques, (c) correct choice of cropping systems adapted to the climatic and pedological conditions of the site and (d) use of treated waste water and reutilization of irrigation waters.
For the optimization of irrigation techniques, improvement of irrigation planning and employment of specific cropping systems, it is often necessary to compute the water budget of a given farm, catchment, river basin or region. In many cases, when the soil water budget is computed, it shows that the most important term in irrigated agriculture is evapotranspiration, which can make up 50 or 60% of the total water budget of a farm [
3], stressing the importance of correct irrigation management and optimization of plant’s water use.
The soil water budget is affected primarily by soil water dynamics (infiltration, redistribution, percolation, evaporation, plant’s transpiration), which are, among other variables, regulated by the soil energy state of water,
i.e., the soil water potential (SWP). Knowledge of the SWP may also be used to reduce percolation of solutes from the vadose zone into the groundwater, as well as for planning alternative cropping systems based on the plants’ response to water stress [
4]. Clearly, knowledge of the SWP alone is not sufficient to provide all the necessary information needed to compute the soil water budget, however it is an important variable that can be utilized to improve water use in irrigated agriculture.
SWP has been employed in a variety of studies and applications to optimize irrigation schedule and to investigate ways in which water-saving irrigation can help to save water, increase water productivity and optimize production. Bouman
et al. (2001) [
5] utilized measurements of SWP to assess the intensity of drought in irrigated low land rice. In a field study on drip irrigation on tomato, Wang
et al. (2007) [
6] studied the effect of SWP and irrigation scheduling on tomato production. Thompson
et al. (2007) [
7] pointed out that, for greenhouse-grown vegetable crops, soil matric potential thresholds are much better indicators for irrigation scheduling than available water content thresholds. Viswanatha
et al. (2002) [
8] utilized, among other measurements, the water potential to study the relationship between irrigation water and sweet corn yield.
A successful, large scale example of application of water budget models and SWP measurements to save irrigation water in commercial farms is provided by the Irrinet (IT Irrigation Advisory Services for Farm Water Management) service [
9]. Irrinet is the irrigation planning system managed by the Irrigation Service of the Emilia Romagna Water Channel Agency (CER, Italy). The support system is based on a water balance model, and irrigation schedules and volumes are tuned for different crops and environments according to specific research and studies carried out locally for more than 20 years. The Irrinet service has been developed to optimize the use of water at the farm scale by transferring personalized technical indications to each farmer.
As today, the system is used on 23% of the total farmed areas of the Emilia-Romagna region. It is utilized by more than 13,000 farmers and it is allowing an yearly estimated reduction of 20% of the water utilized in irrigated agriculture. The service offers technical information provided by an internet-based system where the farmer can login and obtain personalized irrigation information. Direct measurements of soil properties such as the SWP, as well as other information (crop water requirements, crop growth, root system, crop evapotranspiration) are monitored in various farms, for calibration and optimization of the model used for the irrigation support system.
Overall, water management in agriculture plays a key role in determining effective water savings plans and optimization of natural resources for sustainable agricultural activities. It can take advantage of a variety of experimental and modelling techniques to improve its efficiency. In this review, the role and the importance of SWP for the soil water budget is first reviewed and the most important experimental techniques used to measure SWP are described. Finally, some examples of application of these techniques for water management in agriculture and their application for optimization of water resources, are presented.
2. The Soil Water Potential
The SWP potential is defined as the potential energy of water in soil. The SWP is quantified relative to a standard state where water has no solutes, free from external forces except gravity, at a reference pressure, at a reference temperature and at a reference elevation [
10,
11]. The SWP is then defined as the energy state of water in soil with respect to the energy of water at the reference state.
The total SWP (
) is determined by a variety of forces acting on the soil water, including gravitational (
), matric (capillary and adsorptive,
), osmotic (
) and hydrostatic (
).
The gravitational potential is determined by the elevation of the soil water in respect to the chosen reference elevation, which is usually the soil surface. The matric potential is determined by the forces exerted by the soil matrix (soil particles) on water, which are capillary and adsorptive forces. The osmotic potential is given by the presence of solutes in the soil solution, which decrease the potential energy of water. The hydrostatic potential (also called pressure potential) is determined by a pressure exerted by overlaying water over a point of interest in the soil. Other components of the water potential can also be defined.
Since the SWP represents an energy, it should be expressed as a unit of energy per unit mass (J kg) or per unit volume of water (J m). The former is preferable because it does not require to include in the computation the changes of water volume with temperature. However, SWP is often expressed in related units such as energy per unit weight, which is the equivalent of a head of water. The energy is equivalent to the pressure exerted by a liquid column of a given height. For instance, a column of water of ∼10 meters correspond to a pressure of 1 bar. This unit is more common because it is simpler and it allows for easy visualize of the gravitational potential and the pressure potential, which are often expressed in meters.
Another common unit is the pressure (Pa or bar), derived from the first methods developed to measure the soil water potential such as the tensiometers and the pressure plate apparatus [
12,
13]. This unit is based on the definition of energy per unit volume. Since pressure in a fluid can be seen to be a measure of energy per unit volume, energy is given by the product of pressure by volume (E = P × V). The water potential can then be expressed as a pressure and there is an equivalence with the definition of energy per unit volume. It is useful to remember that there is a direct numerical equivalence between the units of J kg
and kPa.
Usually the SWP is expressed as a negative number because it represents the energy required to transfer the soil water to the reference state described above. The term “suction” and “tension” are definitions developed to avoid using the negative sign and to represent the SWP as positive numbers. However, in this review, the negative sign will be retained and the property will be called water potential.
The SWP can range over several orders of magnitude, from a few Joules per kilogram when the soil is close to saturation to minus thousands of Joules per kilogram when the soil is very dry. For agricultural applications usually the range of interest is between 0 and approximately −1,500 J kg, the latter being defined as the soil water potential at the permanent wilting point of many cultivate crops. However, measurements at more negative water potentials may be needed for water studies in dry and very dry climate.
As at today there is not a single technique able to measure the SWP over the entire range of interest and this limitation is one of the most important challenges.
3. The Soil-Plant-Atmosphere Continuum
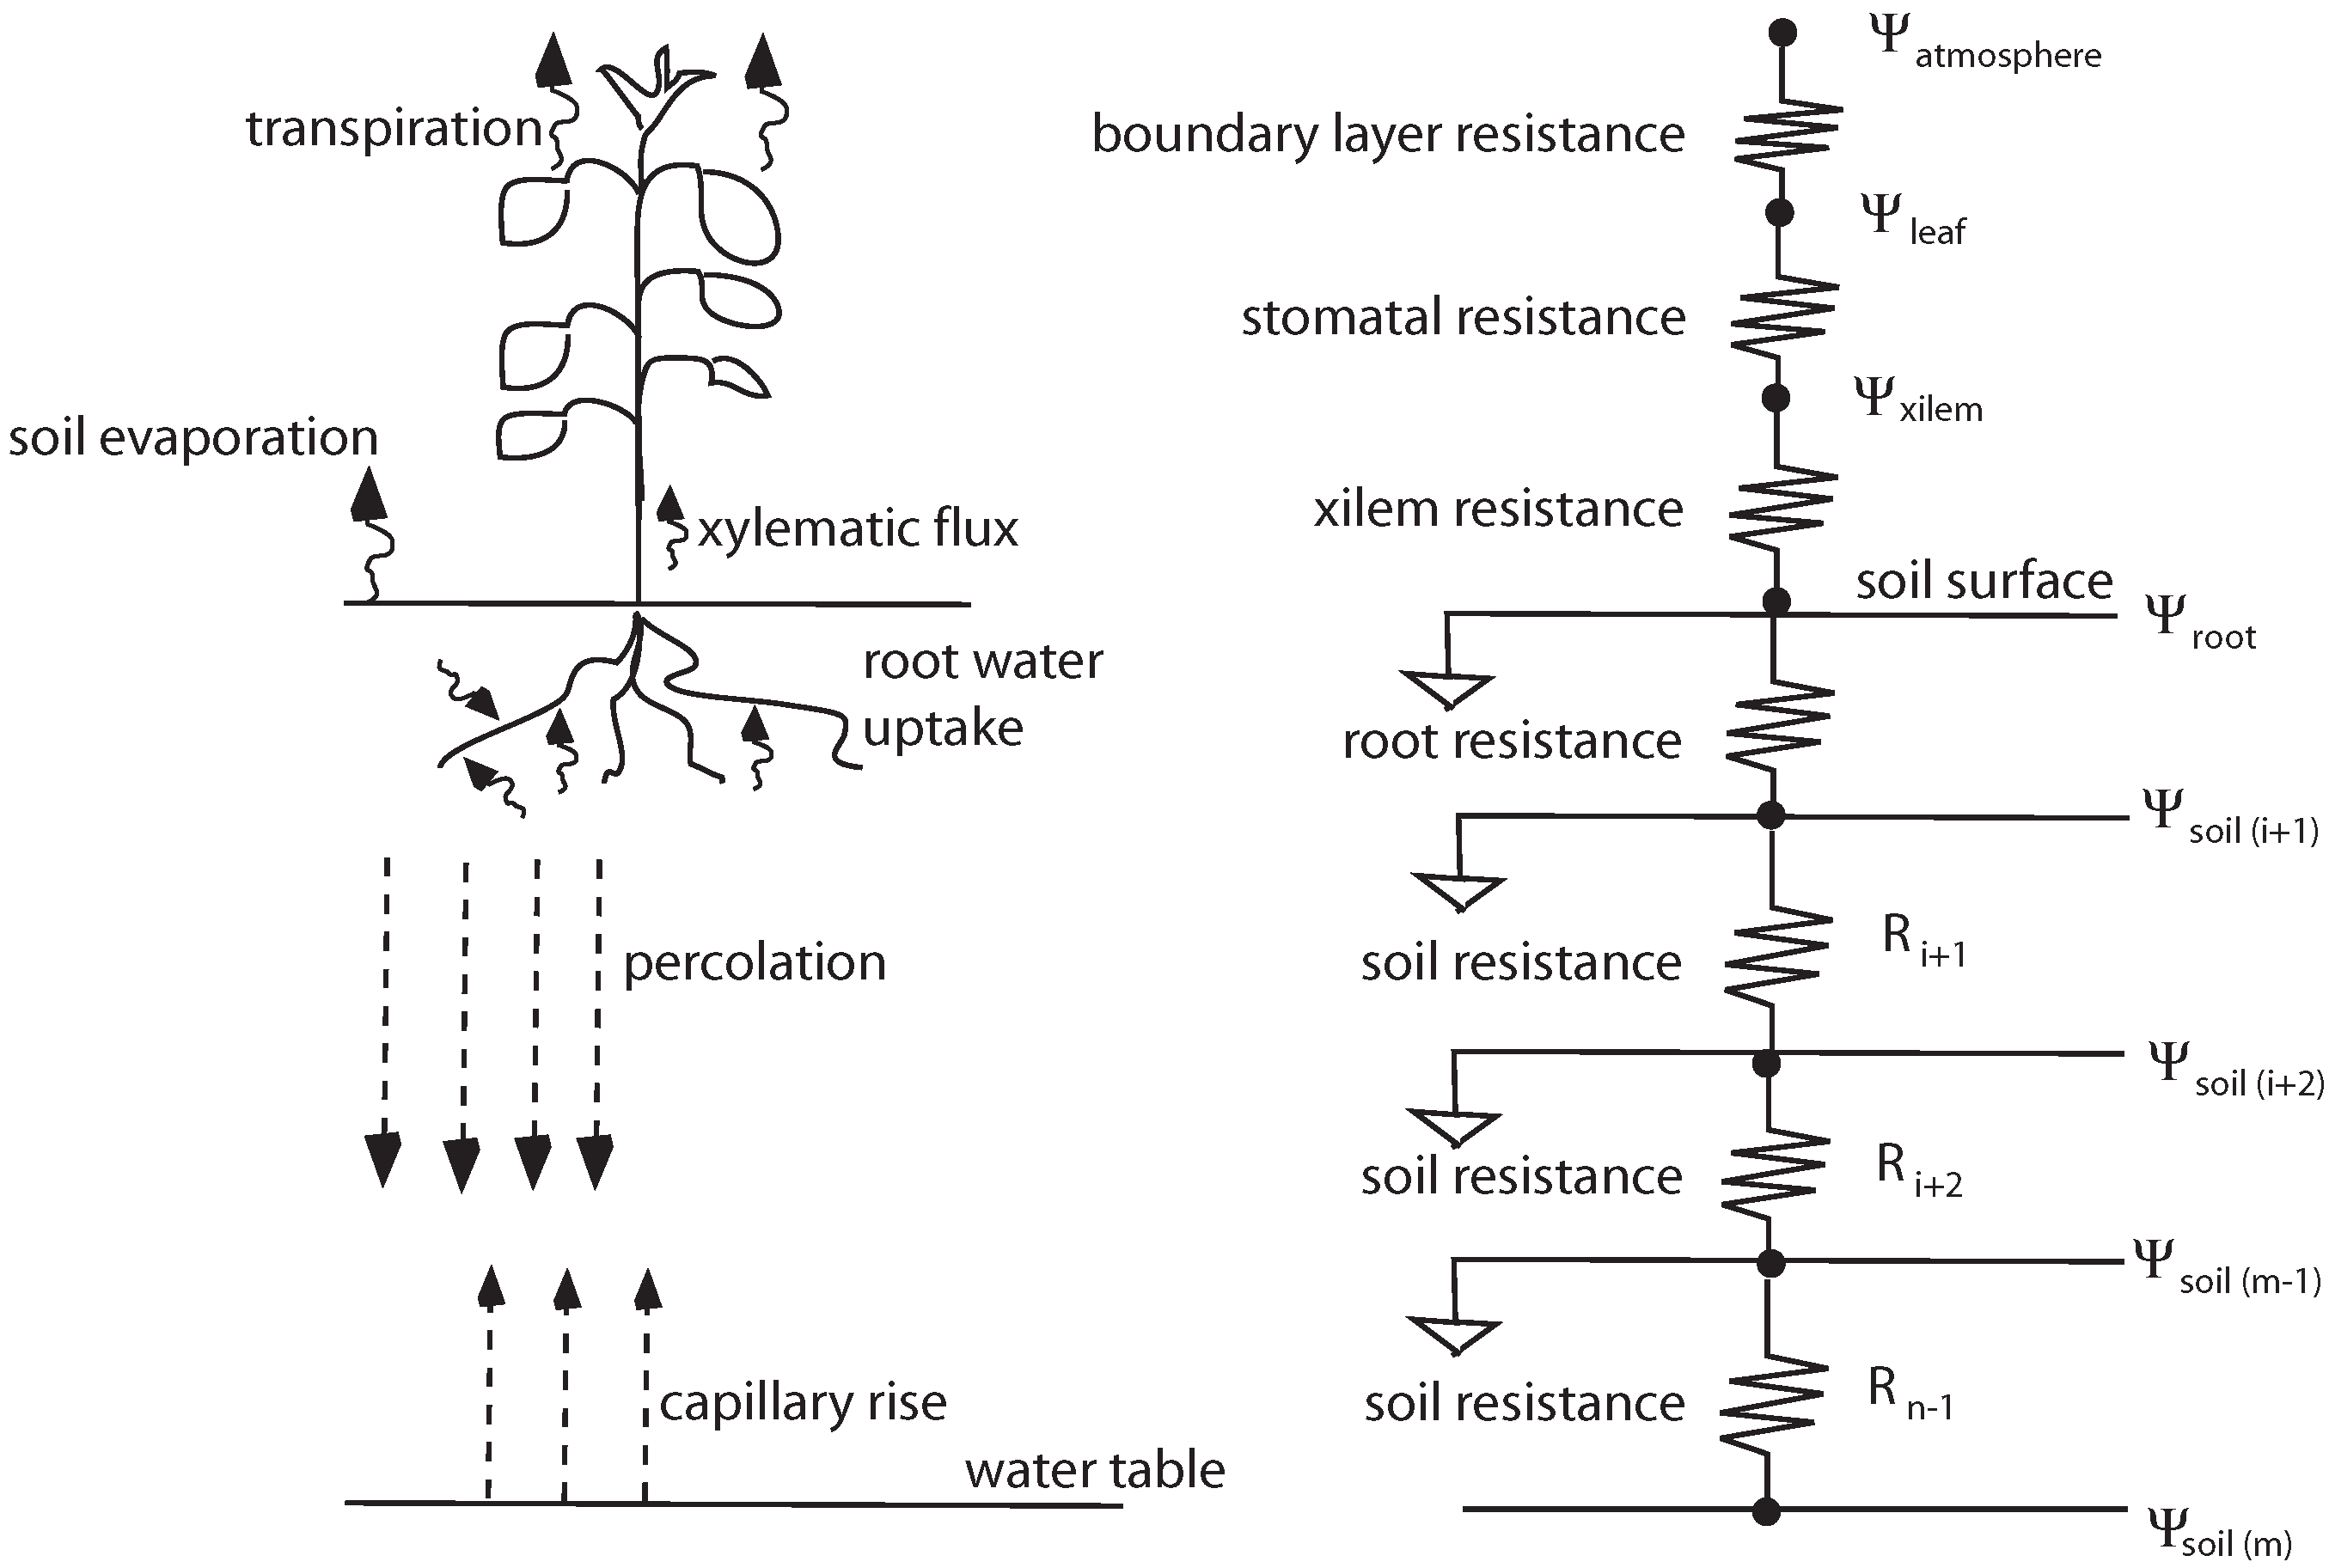
The movement of water from the soil, into the roots, through the xylem and from the leaf into the atmosphere, occurs because of a series of water potential gradients. The system that involves the soil, the plant’s roots, the xylem, the leaf and the atmosphere, is called the soil-plant-atmosphere continuum (SPAC), which is a pathway for the movement of water from the soil into the atmosphere.
Figure 1 shows a schematic of the soil-plant-atmosphere continuum. On the right side of the figure is indicated the water potential of the different elements of the continuum (Ψ) and the resistance terms (R), while on the left side a schematic of the different water movements is depicted.
Figure 1.
Schematic of the soil-plant-atmosphere continuum.
Figure 1.
Schematic of the soil-plant-atmosphere continuum.
Water flows from soil to roots, through xylem, mesophyll and wall cells, and it evaporates through the substomatal cavities. From the substomatal cavities it diffuses out of the stomata, through the leaf and the canopy into the atmosphere. The value of the water potential is higher (less negative) in the soil and decreases along the transpiration pathway. The water potential values in the different elements of the system (saturated and unsaturated soil, plant’s roots, plant’s xylem, plant’s leaves, atmosphere) are determining a series of water potential gradients that are the driving forces for water movement.
Under a given gradient, the magnitude of the flux depends on the value of the resistance terms along the pathway. According to Campbell (1985) [
14], within the plant the xylem resistance is negligible compared to other resistances. The major resistance are the endodermis, where water enters the root steele and in the leaf in the bundle sheath. Usually, in the plant the potential drops occur for 60% to 70% in the endodermis and 30% to 40% in the leaf.
To understand the driving forces that determine the movement of water through the SPAC, it is useful to describe the relationship between water potential and relative humidity at a liquid-air interface, the Kelvin equation:
where
ψ is the water potential (J kg
),
R is the gas constant (8.3143 J mol
K
),
T is temperature (K),
is the molecular weight of water (0.018 kg mol
), and
is the relative humidity (expressed as a fraction from 0 to 1). Equation 2 can be inverted:
to obtain the relative humidity from water potential.
For instance, according to Equation 2, the atmosphere at 0.6 of relative humidity, at 20 C, has a water potential of 69,133 (J kg). For a loamy soil, at 20 C and at field capacity (which is the soil water content after water in the largest pores has drained away and the rate of downward movement has become small), the water potential is about −33 (J kg), and according to Equation 3 the corresponding relative humidity () at the liquid-air interface is 0.9997. This large difference in water potential between the soil and the atmosphere is the driving force for water movement from the soil into the atmosphere.
When water is uptake from the soil into the roots, it moves into the xylem and into the leaves and it undergoes a series of changes that reduce the water potential, but the changes are not as dramatic as they are between the soil (or the plant) and the atmosphere. The SWP usually ranges from values close to zero (when the soil is at or close to saturation) to values of −1,000 to −2,000 (J kg
) when the soil is very dry. The leaf water potential usually ranges from −100 (J kg
) for a well watered plant to −2,000 (J kg
) for a water stressed plant [
15].
These values of water potential shows that, in the SPAC, the large water potential gradient occurs between the leaf and the atmosphere (when the atmosphere relative humidity decreases), and it is precisely this gradient that determines plant transpiration and it supports the water cycle as we know it. Moreover, the change of phase between liquid and vapor occurring between the leaf and the leaf boundary layer requires a relatively high amount of energy (the latent heat of vaporization), which determine a plant’s decrease of temperature and it is a key phenomena for the plant’s thermal regulation. The transpiration process (regulated by the plant through the stomata) has therefore also a key role in the plant’s thermal regulation.
Knowledge of soil and plant water potential is hence of utmost importance for soil water availability itself and to quantify plants’ water requirements. Indeed, the concept of soil water content (or soil wetness) is not sufficient and sometime misleading, to describe the availability of soil water for plants, because it is otherwise the energy state of water that determines the flow of water in the soil-plant-atmosphere continuum. However, the relationship between soil water content and water potential is an important property that is described in the following section.
4. The Soil Water Retention Curve
When a soil is completely saturated (i.e., the pore space is entirely filled with water), at equilibrium with free water, and at the same height, the potential is zero, because the gravitational, the matric and the hydrostatic pressure are zero. If the pressure is changed (for instance by increasing the elevation in respect to the free water, or applying an external pressure) a negative potential is determined in the soil sample and the pores start to desaturate (water leaves the soil sample).
The largest pores are the one that desaturates first and, at increasingly lower water potential values, progressively smaller pores desaturates. When the first largest pore desaturates, the value of the corresponding water potential is called air entry potential, since it is the value corresponding to the initial entering of air into the saturated soil.
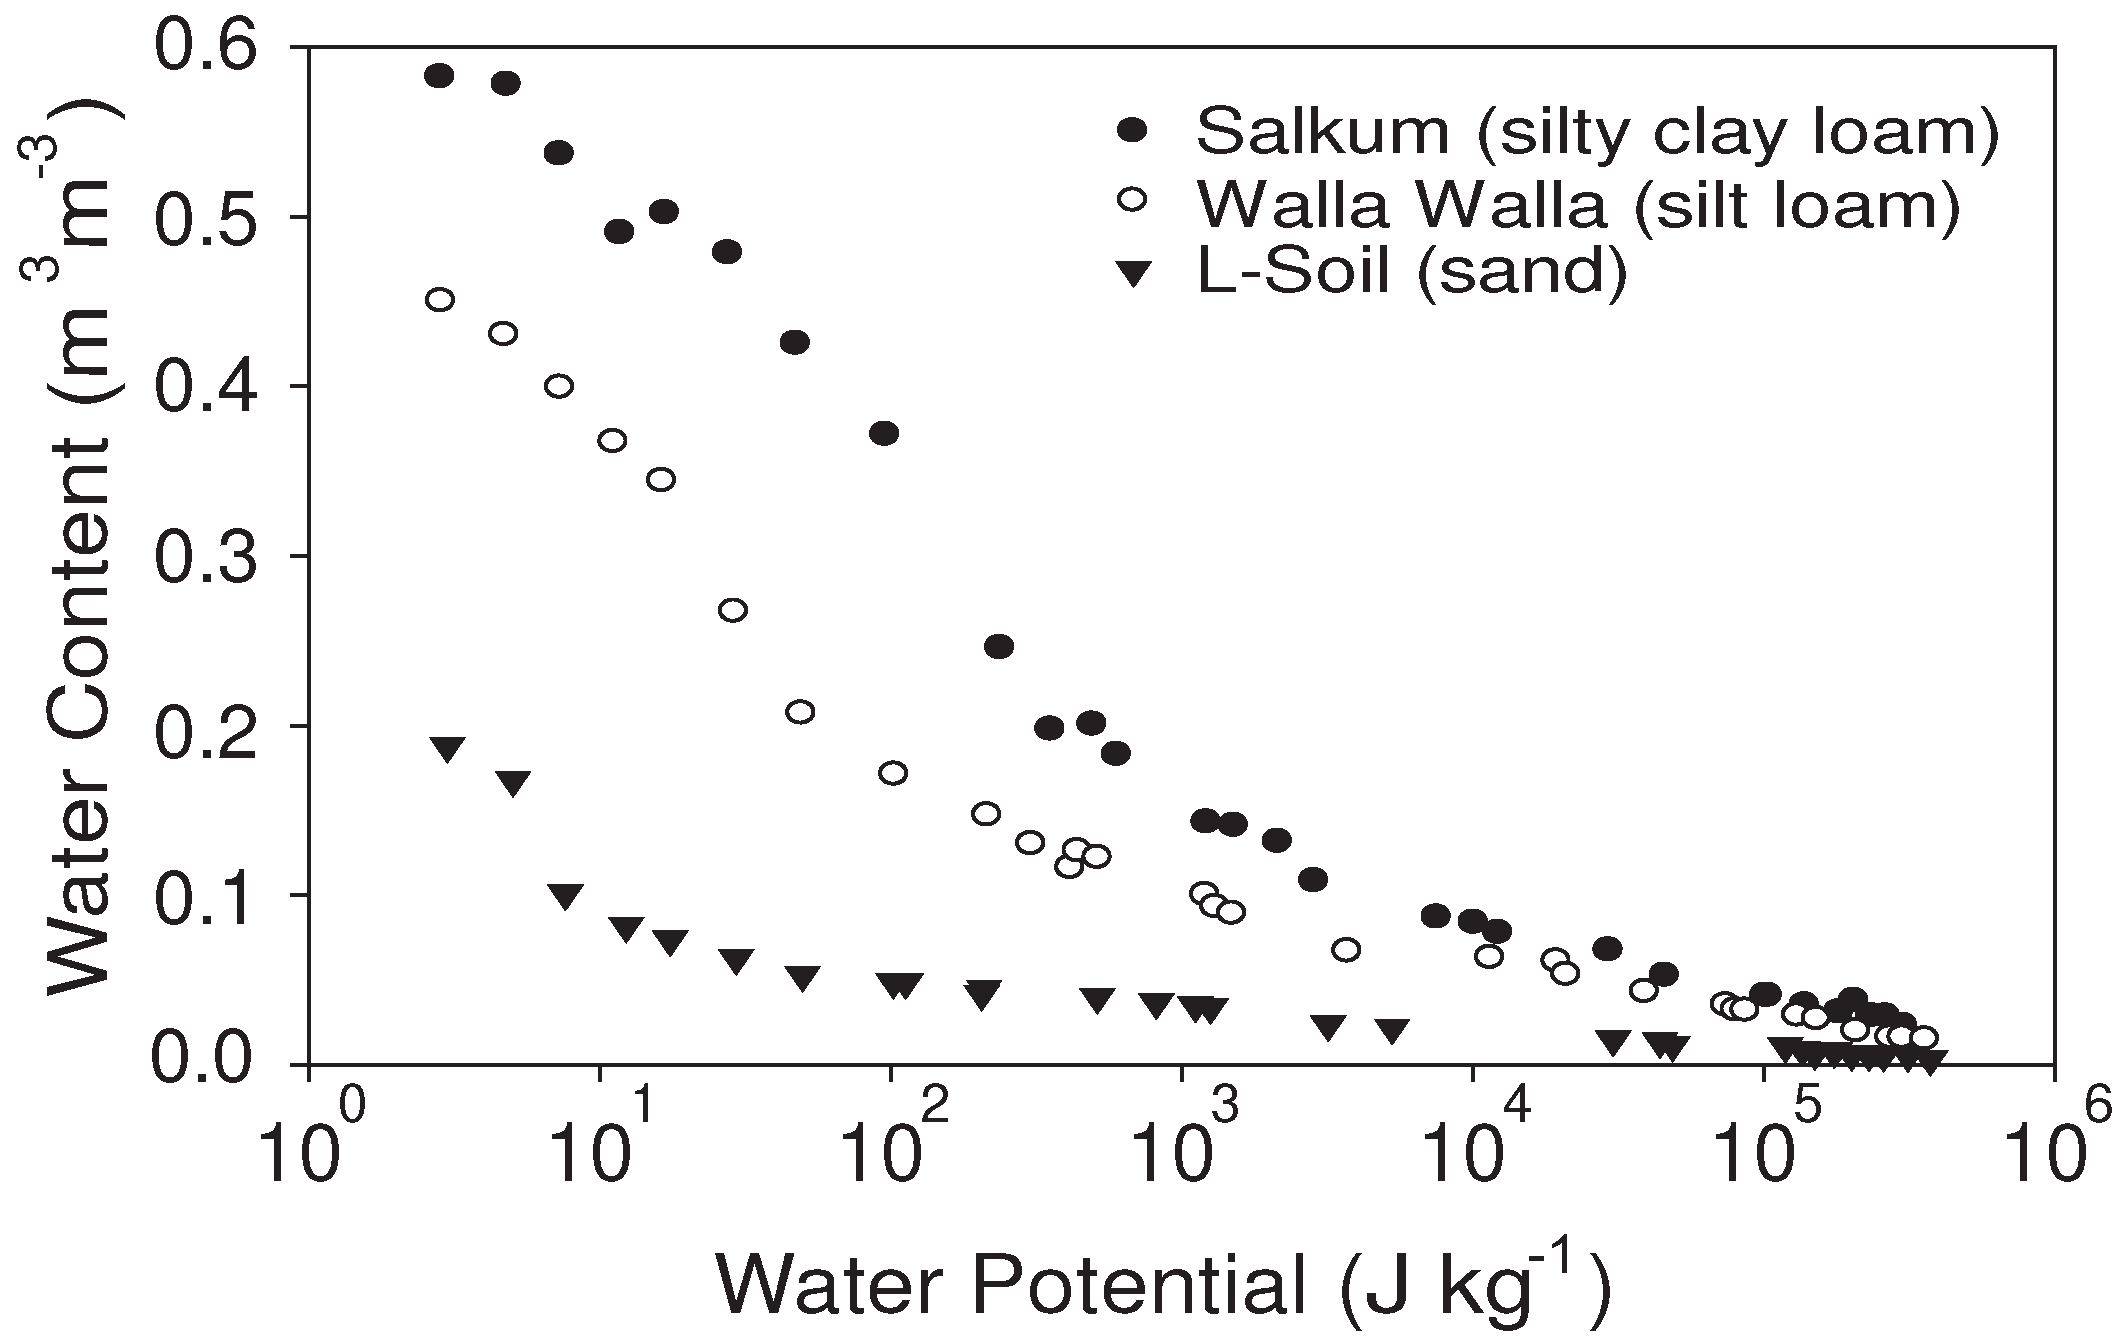
As the pores desaturate, the total soil water content of the soil sample decreases. The relationship between the water potential and the corresponding values of soil water content is called the soil water retention curve (WRC).
Figure 2 shows an example of three WRC for soils having different textural composition. The Salkum sample (silty clay loam) is the soil with the largest water holding capacity, followed by the Walla Walla (silt loam) and the L-Soil (sand) samples, showing that the shape of the WRC depends primarily on texture. Usually, the largest the clay content the greater the water holding capacity, while the largest the sand content the smaller the water holding capacity, because sandy soils are mostly characterized by large pores that quickly desaturate, leaving a small amount of water at lower water potentials. The depth of the soil profile has also an important role in determining the soil water holding capacity.
Figure 2.
Soil water retention curves for three soils having different texture (From Campbell and Shiozawa, 1992).
Figure 2.
Soil water retention curves for three soils having different texture (From Campbell and Shiozawa, 1992).
The soil WRC, together with the the hydraulic conductivity curve (relating the soil water potential and the unsaturated hydraulic conductivity) are the most important soil hydraulic properties. They affect the soil water budget, since it affects the ability of the plant’s roots to uptake water from the soil, the amount of water percolating into the groundwater, the microbial decomposition and therefore the amount of soil organic matter, as well as the solute concentration and therefore phenomena such as soil fertility, salinization and aridity. In the following sections, different experimental techniques used to measure the SWP (as well as the WRC) are described.
5. Soil Water Potential Measurement: General Principles
The general principle for SWP measurement is hydraulic equilibrium between the water held in the soil and the measuring device. Equilibrium can be reached for the liquid phase or for the vapor phase. Tensiometers (one of the most common devices) are based on the equilibrium between liquid water in soil and liquid water in a porous cup. The small pores of the porous cup allows the establishment of an hydraulic continuum between the tensiometer water reservoir and the soil. The pressure changes determined by the differences between pressure inside the tensiometers and the soil are then detected by a pressure sensor.
Other instruments, such as heat dissipation sensors or dielectric sensors are also based on the equilibration of a ceramic cup with the surrounding soil. In this case, however, a property of the ceramic (i.e., thermal conductivity, dielectric permittivity) that depends on the ceramic water content is measured. Since there is a relationship between the ceramic water content and the ceramic water potential (the ceramic’s water retention curve) it is possible, through calibration curves, to obtain the soil water potential of the ceramic’s pore water. Under the assumption of hydraulic equilibrium, the water potential of the ceramic cup should be equal to the one of the surrounding soil.
Other instruments, such as thermocouple psychrometry or dew point potential meters are based on the equilibrium of the vapor phase. According to Equation 2, the water potential in the air phase is related to relative humidity. Therefore, the measurement of relative humidity and temperature of air in equilibrium with soil allows for obtaining the water potential.
Thermocouple psychrometry is based on temperature difference between a dry bulb and wet-bulb temperature. When the relative humidity of the vapor phase is low, the vapor pressure deficit will be high, the evaporation rate will be high and therefore the temperature depression will be higher. In the dew point methods, the saturation vapor pressure is first measured by a thermometer, the temperature of a close-chamber is decreased until dew forms on a chilled mirror. The dew-point temperature can be then used to obtain the relative humidity.
Different classification schemes could be followed to classify these techniques, such as the physical principles behind the technique or the area of application. In this review the classification of SWP measurement is based on field methods and laboratory methods. This classification is useful for practical applications, however some sensors can be used both in the laboratory and in the field. In this case, the method is described only once in the section field methods and the “double use” is specified in each sensor’s description.
6. Soil Water Potential Measurement: Field Methods
Soil water potential in the field can be measured by employing different methods. The choice of the appropriate methods may depend on a variety of factors including:
Application (irrigation management, field monitoring, research)
Soil type (texture, bulk density, salinity, shrinking-swelling properties)
Meteorological conditions (high and low temperatures, freezing, humidity)
Location (remoteness, accessibility for sensor maintenance, remote transmission of data)
Cost
Range, accuracy, repeatability, spatial resolution
Technical knowledge required to operate the sensors (operator skills)
Required sample frequency (automatic sampling, datalogging)
The “weight” of each of these factors on the final choice must be evaluated case by case, however a short list of advantages and disadvantages have been provided for each sensor, to help the choice of the most appropriate one. Moreover, important factors such as range, accuracy, repeatability and spatial resolution have been described and discussed.
6.1. Piezometers
Piezometers are wells of small diameter, utilized to measure the hydraulic head (or elevation of the water table) in aquifers. They are usually pipes of plastic or metallic material, inserted by drilling boreholes into the ground. The piezometric measurement is based on the Bernoulli’s law, which allow to compute the piezometric pressure at a point, based on the law of conservation of energy. In saturated material, with sufficient hydrostatic pressure, water will enter the pipe and equilibrium will be reached between the pipe and the aquifer.
A detailed description of the different piezometers and their applications are provided by Young (2002) [
17]. The use of piezometers is widespread and there are many applications where piezometers provide very important information. For instance, measurements of the position of the water table (and its fluctuations with time) are needed in agricultural applications, for designing drainage systems and for the control of salinization. In hydrogeology and hydrology, piezometers are used for measuring hydraulic gradients in the saturated zone and to monitor groundwater contamination from point and diffuse pollution. Piezometers are also used for water sampling aimed at analyzing temperature, electrical conductivity and concentration of a variety of solutes.
6.2. Tensiometers
Tensiometers are porous ceramic cups, connected to a pressure sensor (manometer or pressure transducer) through a water-filled tube. The water-filled tube is placed into contact to the soil through a rigid porous membrane. The membrane allows water movement through the device, but not air movement. The cup is placed into the soil and the pores in the ceramic cup reach equilibrium with the soil water matric potential of the surrounding soil. When the matric potential of the soil is lower (more negative) than in the tensiometer, a water potential gradient is established and water from the tensiometer is attracted by the surrounding porous media, creating a suction that is detected by the pressure sensor. The pressure is read by the pressure sensor, which indicates the value of the soil matric potential.
There are a variety of tensiometers classified based on their design and on the measuring device used to sense the pressure changes. A common classification is between mechanical and electronic tensiometers. In the first ones the change in pressure is detected by a mechanical pressure gauges, while in the second ones the change in pressure is detected by en electronic pressure transducers. Usually, a membrane is deformed by a pressure change and a pressure transducer is connected to the membrane. The use of electric pressure transducers allow to obtain more precise reading and to collect the data through a datalogger, therefore allowing multiplexing and automation. Recently, advanced transducers are installed directly into the porous ceramic cup [
18]. Another advancement proposed by a manufacturer (UMS, Munich, Germany) is to use a self-refilling tensiometers.
The range of tensiometers is restricted by the air entry pressure of the porous membrane, which can be derived by the well-known Young-Laplace equation that relates the water potential to the pore radius. The pore size of the ceramic material may change, although common ceramics used for tensiometers have maximum pore radius in the range of a few microns (2–3
μm). According to the manufacturer [
19] the most recent tensiometers can measure water potential from 0 to 200 J kg
. Other tensiometers that could reach further water potential were described by Tamari
et al. (1993) [
20]. The increase in the tensiometer range can be achieved by employing a series of manufacturing techniques. For instance, the surfaces of the ceramic should be strongly hydrophilic, the air entry value should be low-enough, and not air bubbles or cavities should be present in the device. These features are dependent on the manufacturing techniques and the choice of the materials used to build the device.
A common limitation for the use of tensiometers is the formation of air bubbles (cavitation) in the water-reservoir (i.e., the water-filled tube). This phenomena occurs when the water potential decreases and the liquid water pressure inside the tube approaches its vapor pressure (at the temperature of the tensiometer), determining spontaneous evaporation and formation of air bubbles. Indeed, the lower limit described above (range) is determined by the issue of formation of air bubbles. This problem usually require refilling of the tensiometer. As mentioned above, a manufacturer (UMS, Munich, Germany) recently designed a self-refilling tensiometer.
Tensiometers may have a lag in SWP reading in respect the soil condition because of the hydraulic resistance of the cup or limited contact between the cup and the soil. This problem is particularly pronounced in swelling soils where swelling and shrinking may create air gaps between the cup and the surrounding soil, increasing the resistance to water flow and creating a lack of continuum between the liquid phase in soil and in the ceramic cup. In general, the reading depends on the sensitivity of the device and the resistance of the ceramic cup to water flow. Modern tensiometers, equipped with small water reservoirs and precise electronic pressure transducers have partially addressed this issue and in condition of good contact between the sensor and the soil, the response time can be in the range of a few seconds. However, since the resistance to flow changes both with the resistance of the ceramic cup and the resistance of the surrounding soil, in increasingly drier conditions the response time can become much longer due to increasing resistances to water flow.
Tensiometer reading may change depending on the size of the ceramic cup, providing different SWP measurements. According to Hendrickx
et al. (1994) [
21] an increase in tensiometer cup size reduced the variability of SWP measurements. Specifically, they suggested that the typical cup size of 42.3 cm
will determine a relatively large SWP measurement variability, therefore larger cup sizes should be used for field monitoring.
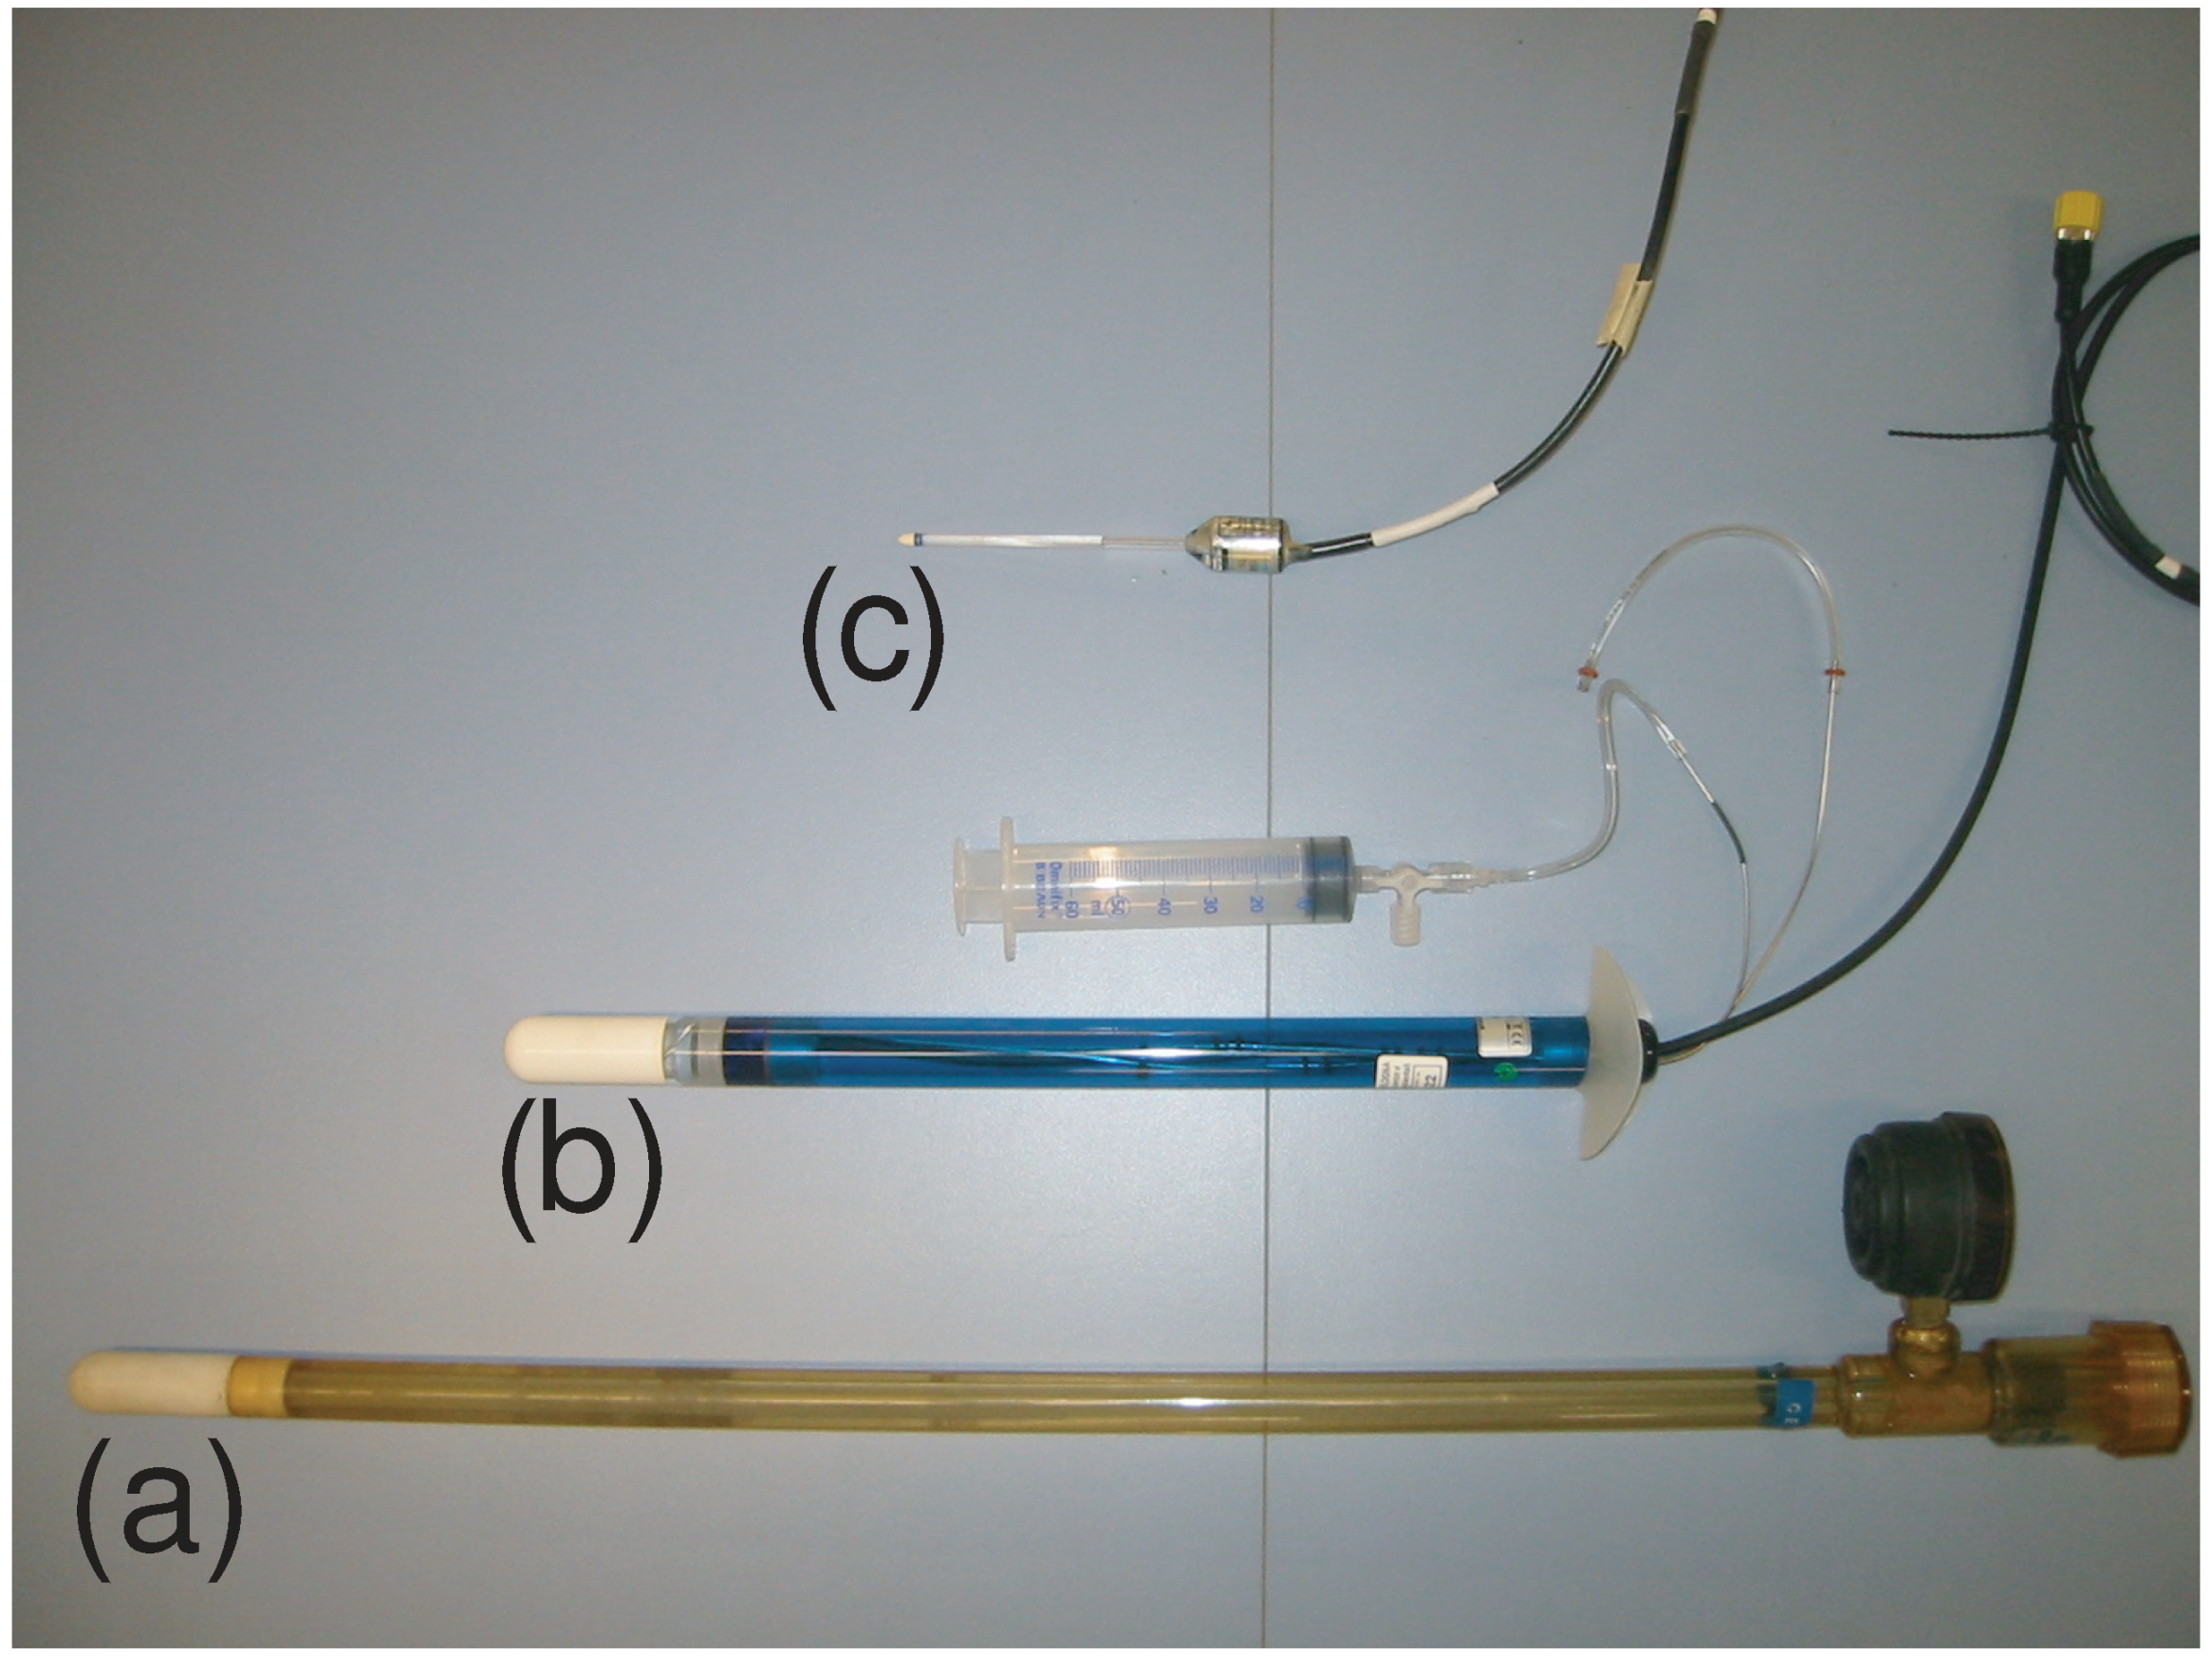
Figure 3 shows three tensiometers (from the bottom): (a) a traditional tensiometer with a manual manometer, (b) a tensiometer equipped with a pressure transducer and a syringe for refilling and (c) a smaller tensiometer also connected to a pressure transducer. The smaller one can be used also in the laboratory, in small vases and in greenhouses.
In general, tensiometers have the following advantages: (a) direct measurement, (b) easy to use, (c) generally inexpensive, (d) continuous reading using pressure transducers and dataloggers, (e) low skills requirement and (f) not affected by salinity. The disadvantages are: (a) limited range of SWP, (b) may take long equilibration time, (c) cavitation (air bubbles form in the water tube) preventing the reading at low water potentials.
6.3. Heat dissipation sensors
Heat dissipation sensors are porous ceramic cups, with an embedded heating element (usually a resistance) and a temperature sensor (usually a thermocouple). The ceramic cup is placed into the soil and the pores of the ceramic cup reach equilibrium with the surrounding soil. The heating element is heated by running a current through the element for a specified time interval (
i.e., 60 seconds) and the changes in temperature (due to heating and cooling) are measured by the temperature sensor (
Figure 4). The time dependence of the temperature changes in the ceramic cup is due to its thermal conductivity, which in turn depends on its water content. Since the water content is related to the water potential of the cup (through the ceramic’s water retention curve) it is possible, through calibration curves, to obtain SWP from temperature measurements [
22]. Since the thermal conductivity does not display significant changes with the solute concentration of the soil solution, the measurement is not affected by soil salinity.
Figure 3.
Tensiometers (from the bottom): (a) traditional tensiometer with manual manometer, (b) electronic large tensiometer (Model T8, UMS Inc.) and (c) electronic small tensiometer (Model T5, UMS Inc.) equipped with pressure transducers. The syringe is used to refill the T8 tensiometer.
Figure 3.
Tensiometers (from the bottom): (a) traditional tensiometer with manual manometer, (b) electronic large tensiometer (Model T8, UMS Inc.) and (c) electronic small tensiometer (Model T5, UMS Inc.) equipped with pressure transducers. The syringe is used to refill the T8 tensiometer.
Figure 4.
Heat dissipation sensor, showing the needle (the heating element and thermocouple are inserted in the needle).
Figure 4.
Heat dissipation sensor, showing the needle (the heating element and thermocouple are inserted in the needle).
Heat dissipation sensors measure soil water potential in the range of approximately −10
to −10
J kg
, providing a wide range of water potential measurements. The upper limit is given by the air entry value of the ceramic cup, which is approximately −10
J kg
. The accuracy is about ±1 J kg
at matric potentials smaller than −100 J kg
, however the repeatability is usually a limitation. Since the ceramic cups have often different pore size distributions, sensors need to be individually calibrated before installation, otherwise the sensor output would differ from one another and the repeatability of the measurement would be limited. However, according to Flint
et al. (2002)[
22], a calibration in air and pure water is sufficient without the need for a soil specific calibration, simplifying the calibration procedure. This type of sensor can be used both in the field and in the laboratory.
In general, heat dissipation sensors have the following advantages: (a) large range of SWP, (b) lack of cavitation, (c) continuous reading using dataloggers, (e) not affected by salinity, (f) sensors are inexpensive. The disadvantages are: (a) limited upper range of SWP close to saturation, (b) sensors require individual calibration, (c) require technical skills.
6.4. Dielectric sensors
Dielectric sensors are porous ceramic cups that are placed into the soil and the pores in the ceramic cups reach equilibrium with the surrounding soil (similarly to the heat dissipation sensor). However, for these sensors the dielectric properties (dielectric permittivity) of the ceramic cup are measured, instead of the thermal properties. The dielectric properties can be measured either in the time or frequency domain, or by measuring the dielectric capacity of the porous cup. The dielectric properties are employed to measure the ceramic water content, while the water potential is inferred from calibration curves based on the relationship between water content and water potential of the ceramic porous media.
The first application was proposed by Or and Wraith (1999) [
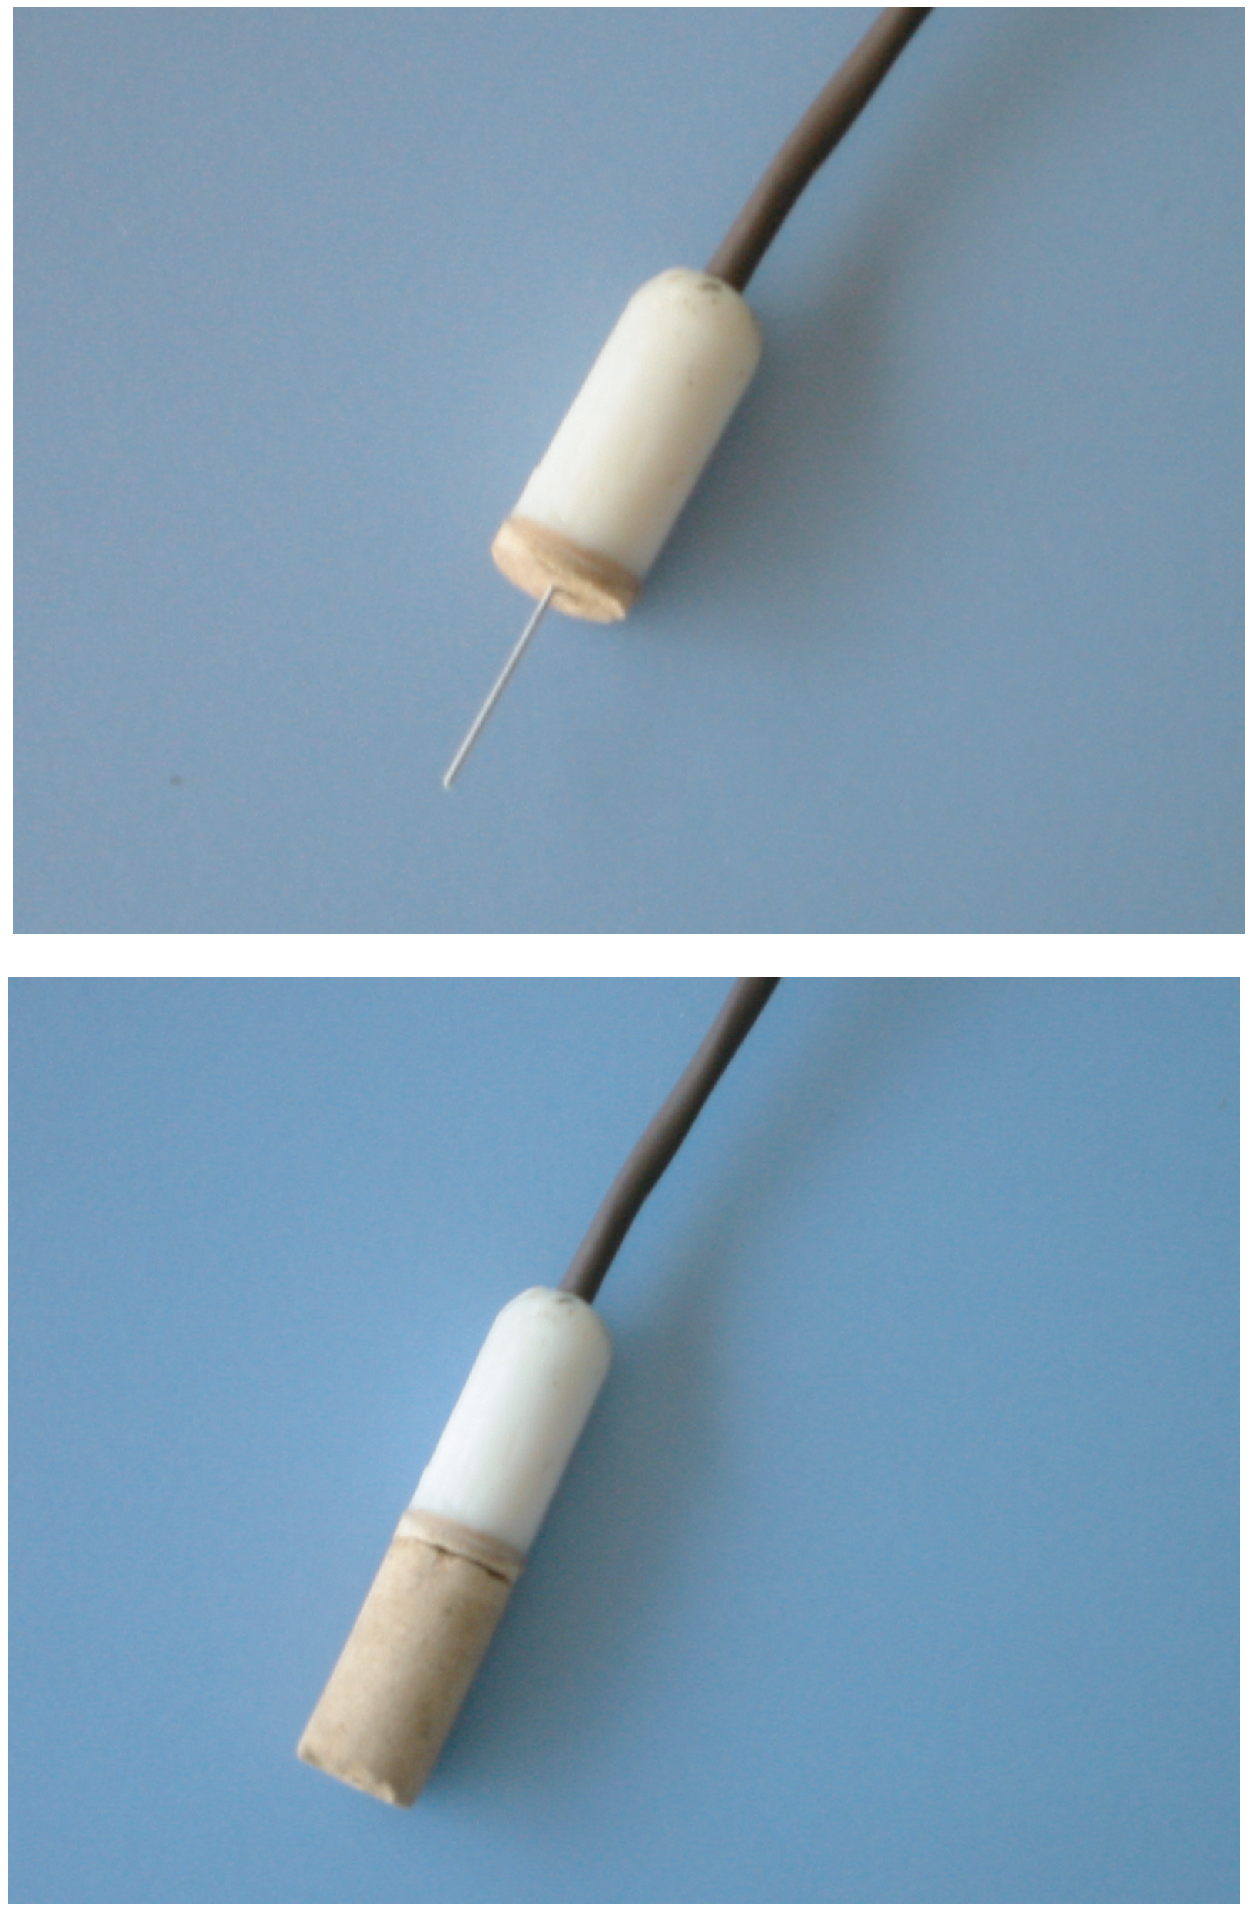
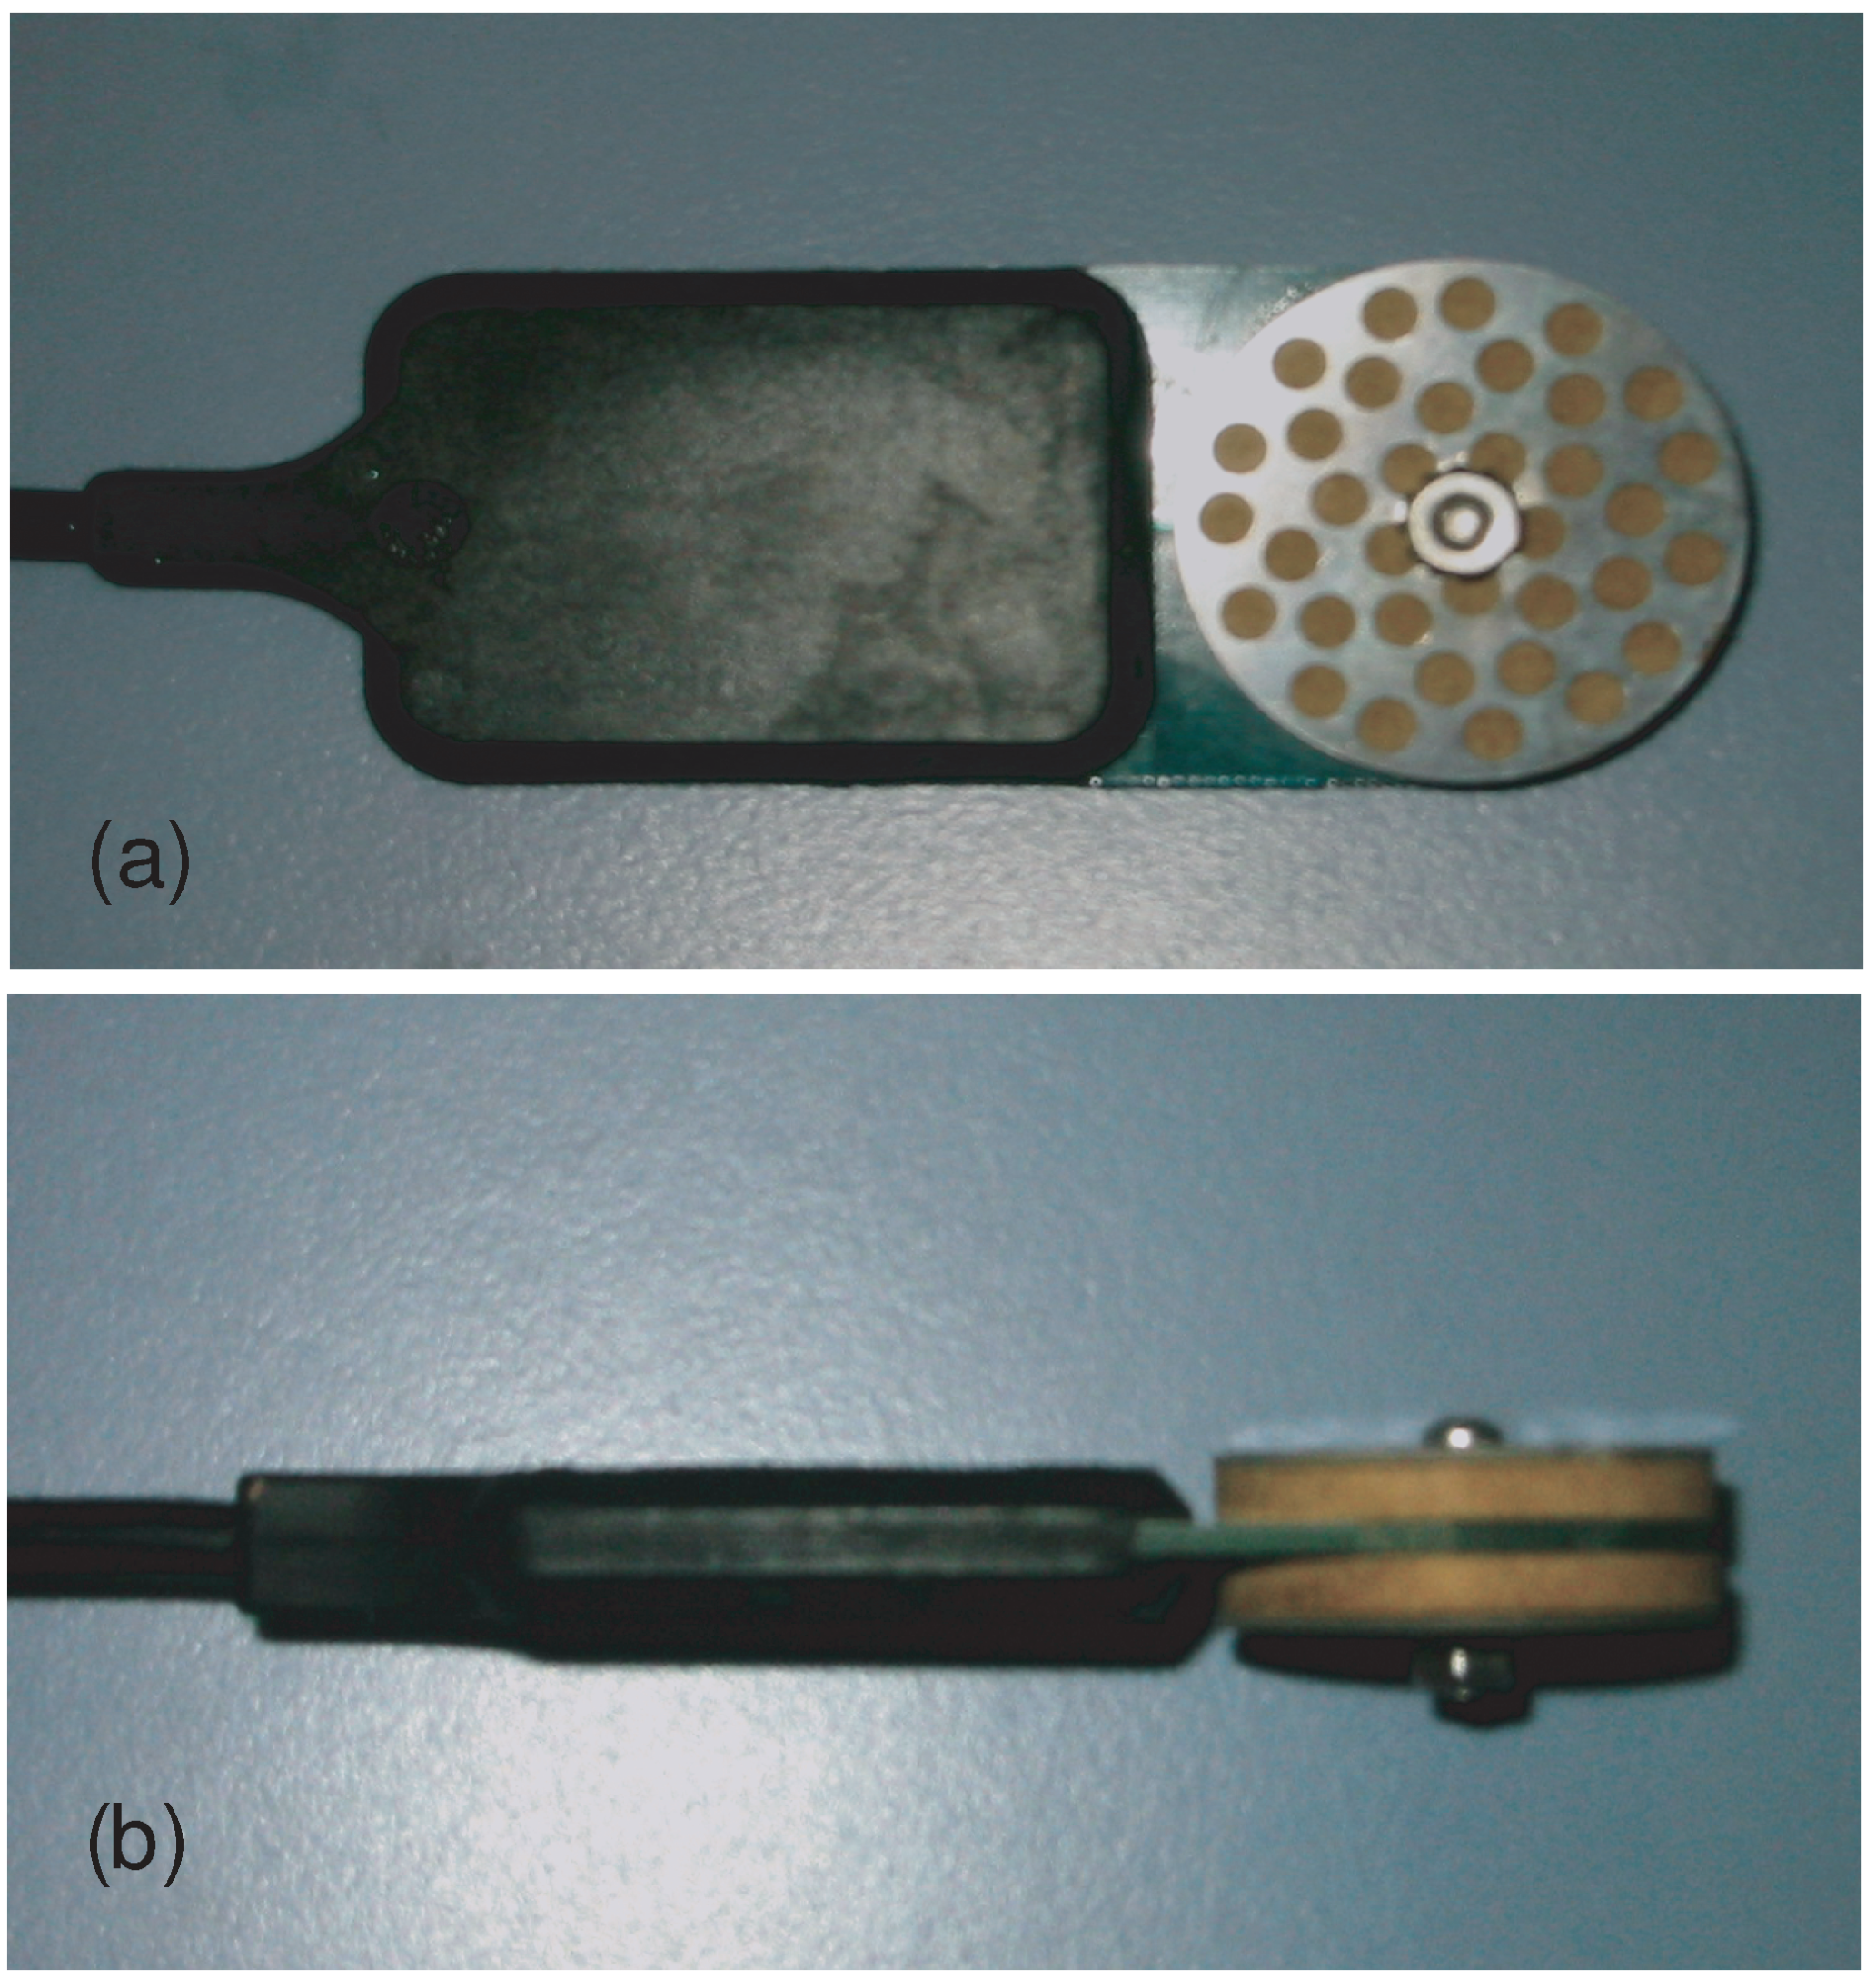
23], where soil water content was measured with TDR (Time Domain Reflectometry), and SWP was derived from calibrations. The instrument described by the authors was developed for research purposes and, to the author’s knowledge, it is not commercially available. A commercial version of this type of sensor is the Matrix Potential Sensor (Model MPS-1, Decagon Dev. Inc. Pullman, WA). The sensor is made by a porous ceramic cup, surrounded by two metallic plates (forming a dielectric sandwich) that transmit an electromagnetic field through the cup (
Figure 5). The metallic plates are connected to a circuit for measurement of the dielectric properties, which are highly dependent on its water content and the SWP potential is obtained from calibration curves.
According to the manufacturer, the MPS-1 range is −10 to −500 J kg
. The accuracy is within 40% of the SWP measurement, while the resolution is ±1 J kg
from 0 to −100 J kg
and ±4 J kg
from −100 to −500 J kg
[
24]. Also in this case, the upper range is determined by the air entry value of the ceramic.
The MPS-1 still displays problems of calibration when compared to other sensors such as tensiometers [
25], due to lack of homogeneity among different ceramic cups. Moreover, there is significant hysteresis effects on the sensors. In general, similarly to the tensiometers and the heat dissipation sensor, the sensor requires good contact between the ceramic and the surrounding soil. Sometime, it may be is advisable to pack the native soil around the sensor, before placing the sensor into the soil, to avoid problems of contact between the sensor and the soil.
Figure 5.
Matric potential sensor (MPS-1) based on the measurement of the dielectric capacity, picture from above (a) and from the side (b).
Figure 5.
Matric potential sensor (MPS-1) based on the measurement of the dielectric capacity, picture from above (a) and from the side (b).
Overall, the advantages are: (a) high accuracy, (b) provide reliable SWP readings over a very wide range, (c) allows for datalogging and remote acquisition, (d) does not require maintenance. The disadvantages are: (a) sensors needs individual calibration, (b) measurements in the wet range are limited by the air-entry value of the ceramic.
6.5. Thermocouple psychrometry
Another field (and laboratory) technique that have been widely used for measuring SWP, is thermocouple psychrometry. This technique has also been used for in situ measurement of leaf water potential [
26]. Thermocouple psychrometry is a technique that derives the SWP from measurement of the relative humidity of the air phase in equilibrium with the liquid phase [
27], as described in the Kelvin equation (Equation 2). The relative humidity measurement is obtained from measurements of the temperature difference between a dry bulb and wet-bulb. When the relative humidity of the vapor phase is low, the evaporation rate will be high and therefore the temperature depression will be higher. Measurements of a wet thermocouple in respect to a dry thermocouple is performed. The relative humidity is obtained from the change in temperature:
where
is the ratio of vapor pressure and saturation vapor pressure (the relative humidity),
s is the slope of the saturation vapor pressure,
is the apparent psychrometer constant and
is the wet-bulb temperature depression.
The first devices for thermocouple psychrometry were built by Spanner [
28] and Richards and Ogata [
29]. These sensors were laboratory devices (also called sample chamber) made of a sealed chamber where the soil sample is positioned. A metal thermocouple is placed against the sample holder and the chamber is sealed, to avoid any exchange of air with the surrounding. A variety of devices equipped with a sample chamber have been developed including the Model C-52 by Wescor (Wescor Inc., Logan, Utah, USA) and the Tru-Psi Sensor by Decagon (Decagon Devices Inc., Pullman, WA, USA). The measurement range of these devices may change depending on the material used to build the sample chamber. In general, the material used to build the chamber should allow a fast thermal equilibration and, at the same time, it should not absorb water.
In general, the range and accuracy of this technique depends on the accuracy of the temperature measurement and the ability of the measuring device to keep a thermodynamic equilibrium within the sample chamber. The main limitation of this type of techniques (the dew point methods present the same limitation) is intrinsically described by the Kelvin equation, which is a logarithmic equation, where a very small change in relative humidity corresponds to a large change in water potential. For instance, at 293 K a change in relative humidity from 0.999 to 0.995, corresponds to a change in water potential from −130.5 to −670.8 J kg, respectively. To measure changes in water potential to the accuracy of hundreds of Joules per kilogram, the measurement of relative humidity must be accurate to the third decimal. In recent years, modern microelectronics and engineering techniques allowed to improve the accuracy of this technique, through high accuracy temperature sensors and better sample-chamber designs.
The field application of
in situ thermocouple psychrometry consists of a chamber (usually formed by a screen-cage or by a shield made by a porous ceramic cup), with the thermocouple junctions inside. Usually the wet junction is remotely controlled by a Peltier system that cools off the junction. The chamber, that is placed into the soil, allows heat and water vapor exchange with the surrounding soil [
27]. As pointed out by Brown (1970) [
30], if the water potential changes are slow, the sample chamber equilibrates with the soil vapor phase even if the contact between the chamber and the soil is not optimal, therefore thermocouple psychrometry should suffer to a less extent to the problems of lack of contact typical of tensiometers, heat dissipation sensors and dielectric sensors. These results were expected since these sensors are based on the equilibrium of the vapor phase and not of the liquid phase.
The type of material and the electronics used to build the chamber may affect the measurement [
27,
31]. For instance, McAneney
et al. (1979) [
32] reported that water potential measurement using thermocouple psychrometers built with ceramic chambers may be affected by salt adsorption in saline soils.
Overall, the advantages are: (a) high accuracy, (b) provide reliable SWP readings in very dry soil, (c) they suffer less, in respect to other methods, of problems of sensor-soil contact. The disadvantages are: (a) low accuracy at WP close to saturation (wet range), (b) slow response time, (c) small sensing volumes, (d) may be affected by soil salinity, (e) sensors require individual calibration, (f) the sensors requires accurate cleaning before calibration and use.
7. Soil Water Potential Measurement: Laboratory Methods
7.1. Soil water retention
As described above, one obtains a SWR curve through the combination of soil water potential and soil water content measurements. Therefore, the SWP potential measurement is necessary to obtain a SWR curve. Many methods are available to determine the SWR curve, including pressure plates apparatus, thermocouple psychrometry, heat dissipation sensors, and dew point potential meters. Among these methods, the most commonly used are: (a) hanging water columns [
33], (b) pressure plate apparatus [
12,
13,
33], (c) suction tables [
34] and (d) vapor pressure methods [
35].
7.2. Hanging water columns
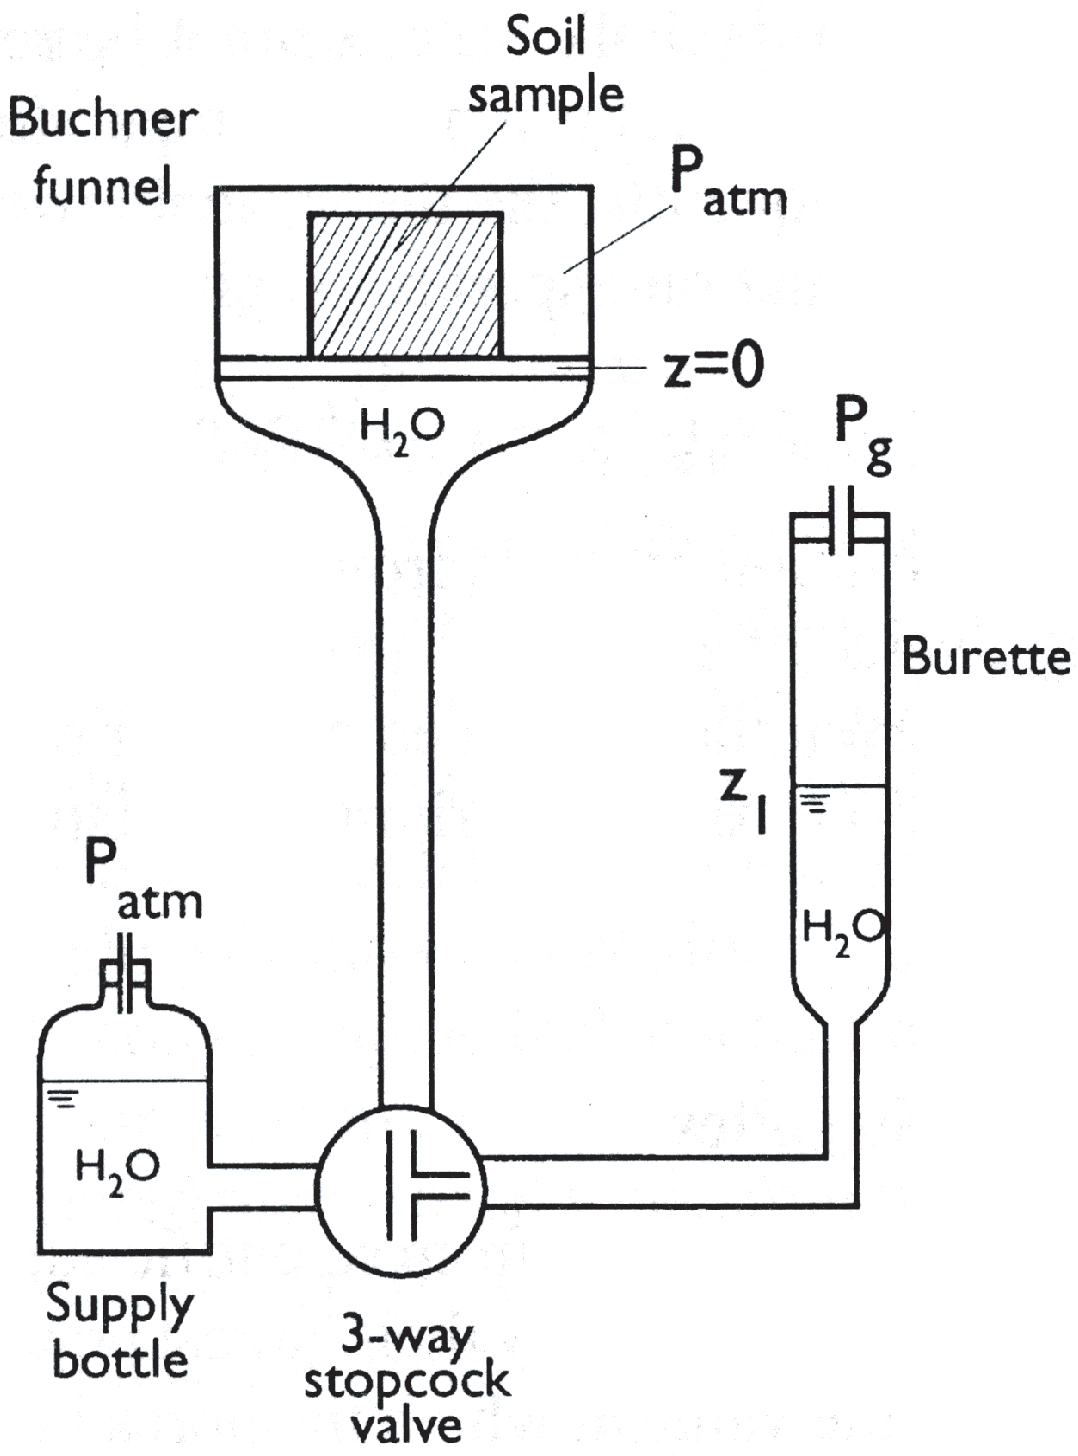
This technique is used to determine a SWR in the wet range. The sample is usually saturated and placed onto a porous cup that is in direct contact with water [
36]. At the beginning of the experiment the gas pressure in the soil sample is at atmospheric pressure. A reference bottle or burette (connected to the water under the porous plate) is lowered by lowering the level
, and the reduction in the water potential induces a drainage of water from the soil sample (
Figure 6). The soil sample is then removed from the sample holder, weighed and oven-dried for gravimetric determination of soil water content. The procedure is repeated at further values of water potential. The method is simple, however the limitations are given by the small differences in elevation that is achievable in a laboratory (usually smaller than −2 m).
Figure 6.
Schematic of the hanging water column. Scheme from Dane and Hopmans (2002).
Figure 6.
Schematic of the hanging water column. Scheme from Dane and Hopmans (2002).
7.3. Suction plates
The suction tables [
34,
37], employees the same theory of the hanging columns, but the soil samples are place onto a suction plate. The suction plate is usually formed by one or more layer of fine material. The particle size distribution of the draining material determines the air entry potential, which is the maximum potential that can be imposed. The most common materials are fine sand, that determined a maximum potential of −1 to −10 J kg
, and kaolinite that allows to impose smaller potential up to −50 J kg
. The advantages of the suction tables in respect to the hanging columns is that they allow to measure many soil samples at a time for the same water potential. A detailed description of the method is provided by Romano
et al. (2002) [
37].
7.4. Pressure plates apparatus
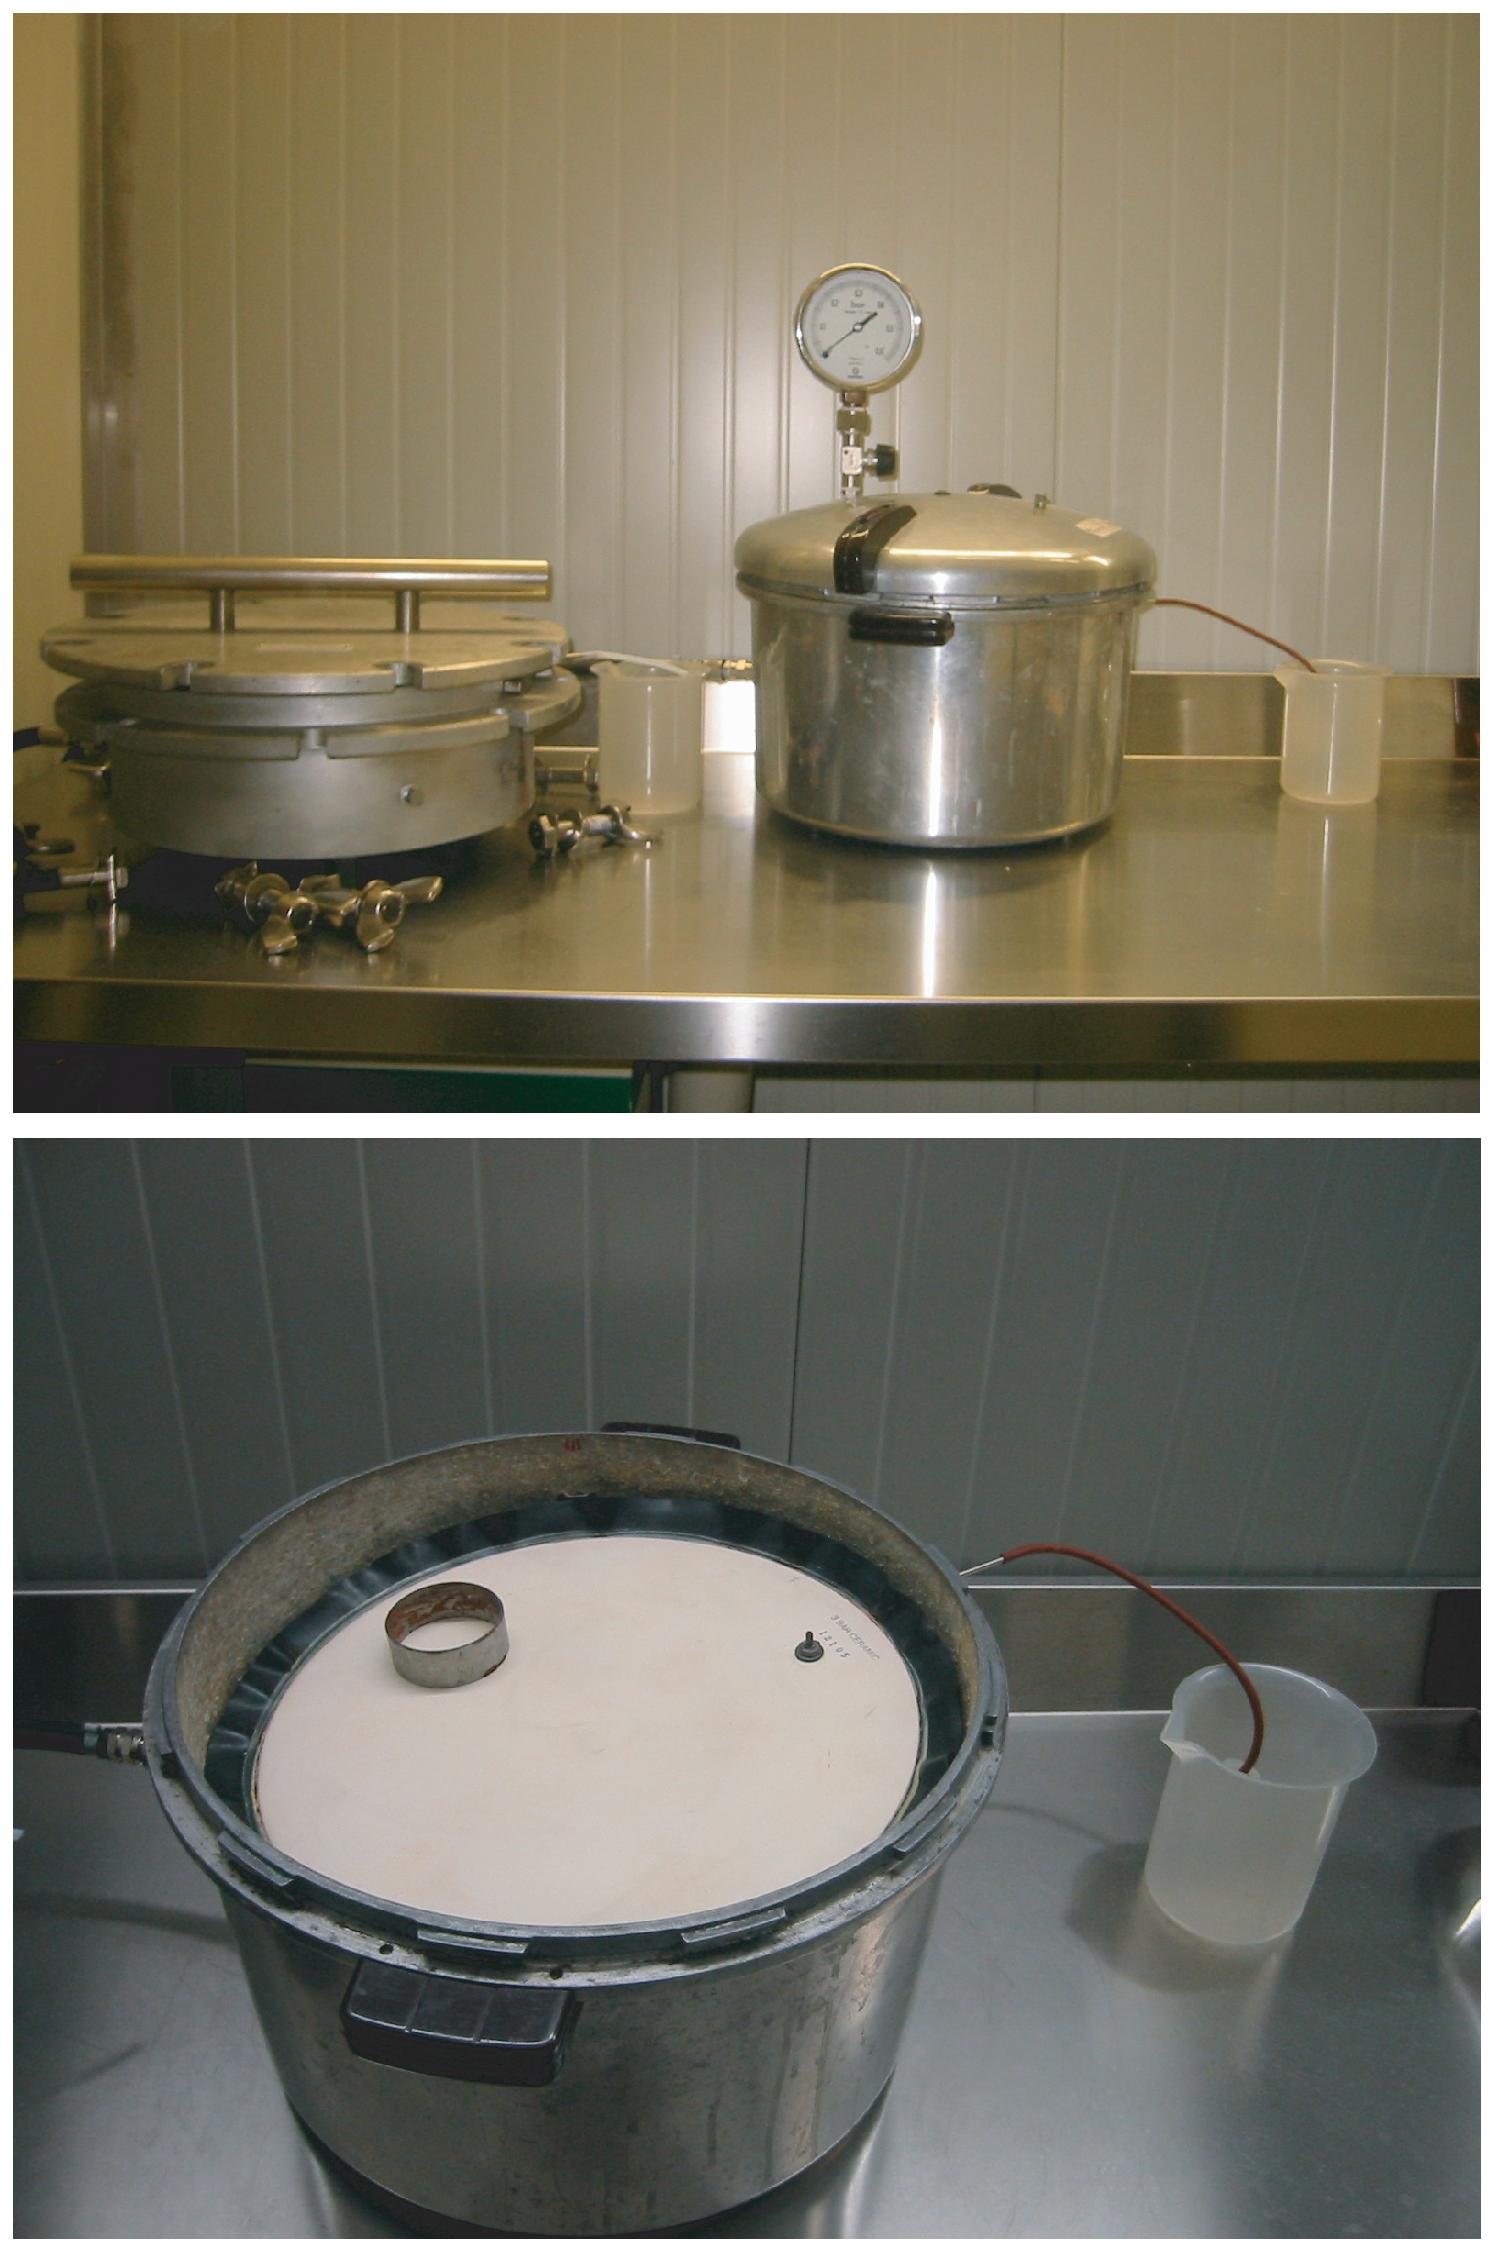
Pressure plate apparatus are closed, metal chamber where soil samples are placed onto a ceramic porous plate (
Figure 7). Samples are wet on the ceramic plates to achieve good contact between the soil and plate and sometime they are covered with a polythene or cloth sheet to reduce evaporation. Usually the plates are soaked in distilled water overnight before being loaded with soil samples. The pressure chambers are then closed and a specified pressure is applied by a gas tank or by an air compressor. The sample starts losing water that moves through the porous plate and is collected outside the pressure chamber. After the water ceases to drain, the samples are collected since the sample is considered in equilibrium at the specified pressure (the water potential). The soil sample is then removed from the plates, weighted and placed into an oven, for gravimetric determination of soil water content. Repeated measurements at increasing pressures are performed to obtain several measurements of water content as function of the applied pressure (water potential).
Figure 7.
Picture of the pressure plates (Soil Physics Laboratory, Department of Agro Environmental Science and Technology, University of Bologna, Italy).
Figure 7.
Picture of the pressure plates (Soil Physics Laboratory, Department of Agro Environmental Science and Technology, University of Bologna, Italy).
Several authors [
38,
39,
40] showed that measurements with pressure plates are in error at potentials below −100 to −500 J kg
. The authors suggested that alternative methods, such as thermocouple psychrometer or dew point other than pressure plates, are also be required to measure equilibrium water potentials at −1,500 J kg
. Indeed, to avoid these problems, Campbell and Shiozawa [
16] used a combination of three different techniques to determine the water retention curve: hanging water columns and pressure plates in the wet range (hanging columns from 0 to −1 m-H
O, and pressure plates from −10 to −500 J kg
) and psychrometry in the dry range (water potentials <−500 J kg
). Currently, it is advised to measure the SWR by using a combination of technique as described by Campbell and Shiozawa [
16] and by Bittelli and Flury [
40].
7.5. Dew point methods
The measurement of water potential can be achieved by equilibrating the soil sample in a closed chamber with the surrounding atmosphere and deriving the SWP by measuring the relative humidity of the chamber, as shown in Equation 2.
Figure 8.
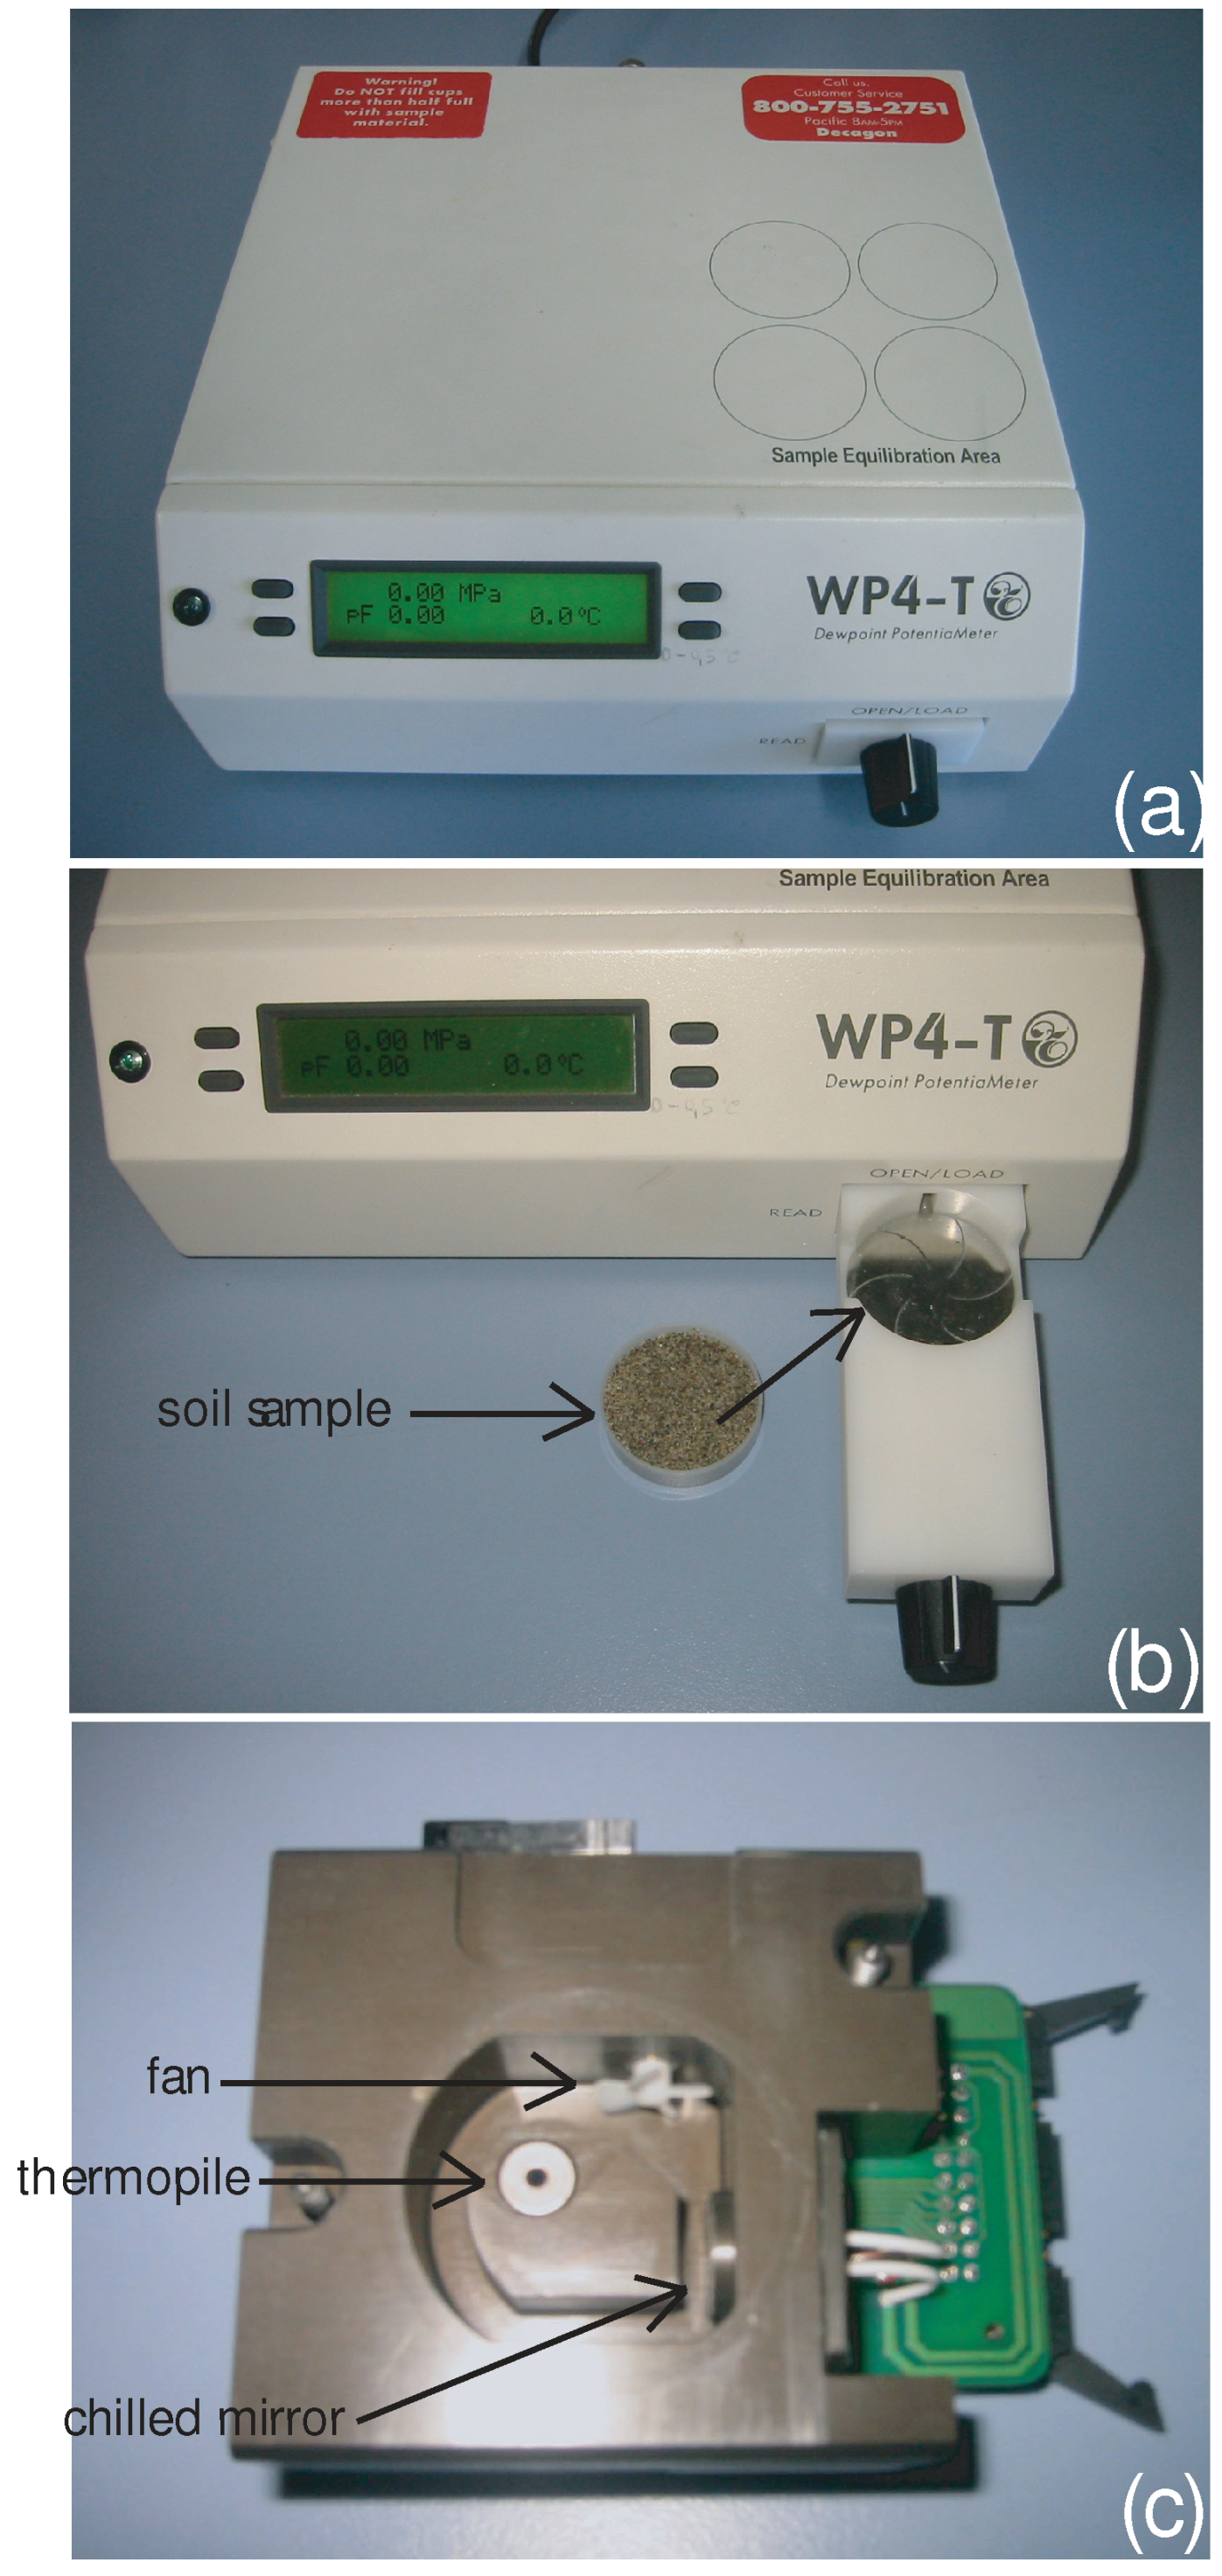
Water Potential Sensor (WP4-T). (a) Picture of the instrument, (b) details of the sample holder and (c) details of the chamber for relative the humidity measurement, indicating the chilled mirror, the temperature sensor and the fan.
Figure 8.
Water Potential Sensor (WP4-T). (a) Picture of the instrument, (b) details of the sample holder and (c) details of the chamber for relative the humidity measurement, indicating the chilled mirror, the temperature sensor and the fan.
The dew point method is based on the measurement of the dewpoint temperature (
Figure 8). A sample is placed into a sealed chamber. In the sealed chamber there are the following: a dewpoint sensor, an infrared thermometer and a fan. The fan is used to speed equilibrium by controlling the boundary layer conductance. The temperature of the sealed chamber is decreased until dew forms over the chilled mirror. When the dewpoint sensor detects the formation of dew, the temperature sensor measures the dew point temperature of the air, while the infrared measures the temperature of the sample. From these measurements it is possible to compute the relative humidity of the air in equilibrium with the sample.
This method has the following advantages: (a) is fast, and (b) is accurate and it covers a wide range of water potentials down to very negative values. The major disadvantages are: (a) the accuracy of the methodology decreases at water potential values close to zero and (b) the measurement is affected by soil salinity.
As described for the thermocouple psychrometers, the first limitation is simply due to the logarithmic form Equation 2 used to derive the water potential from relative humidity. The second issue is inherent of the Kelvin equation where the vapor pressure is affected by the water osmotic potential. This issue can be also an advantage since the instrument can be used to measure the osmotic potential of solutions.
Moreover, in recent years, modern microelectronics and engineering techniques allowed to improve the accuracy of chilled mirror techniques, through high accuracy temperature sensors, coupled with temperature-controlled sample chambers. Details on the measurement technique and directions to attain the best accuracy are provided by Scanlon
et al. (2002) [
35].
7.6. Freezing apparatus
A different approach to measure the WRC is based on the freezing point depression of soil water and its relationship with the SWP. It was experimentally demonstrated that the freezing point depression in porous media depends on the water potential [
41]. When soil temperature drops below the freezing point of free water, the water closest to the solid particles may remain in liquid form, because the energy status of water is lowered by the forces (adsorptive and capillary) exerted by the soil, resulting in freezing point depression.
A freezing characteristic curve is obtained when soil temperature and unfrozen soil water content are measured. The water potential can be obtained from the temperature measurements by employing the Clapeyron equation and, combined to a water content measurement, allows to obtain a soil moisture characteristic (soil water retention curve). Usually, a good agreement is found between moisture characteristics obtained from freezing characteristics and moisture characteristics obtained from independent measurements with other techniques (such as pressure plates and dew point methods). For instance, in a field study Spaans and Baker (1996) [
42] obtained good agreement between the freezing characteristics and the soil moisture characteristic.
This idea was used to develop a laboratory device by Bittelli
et al. (2003) [
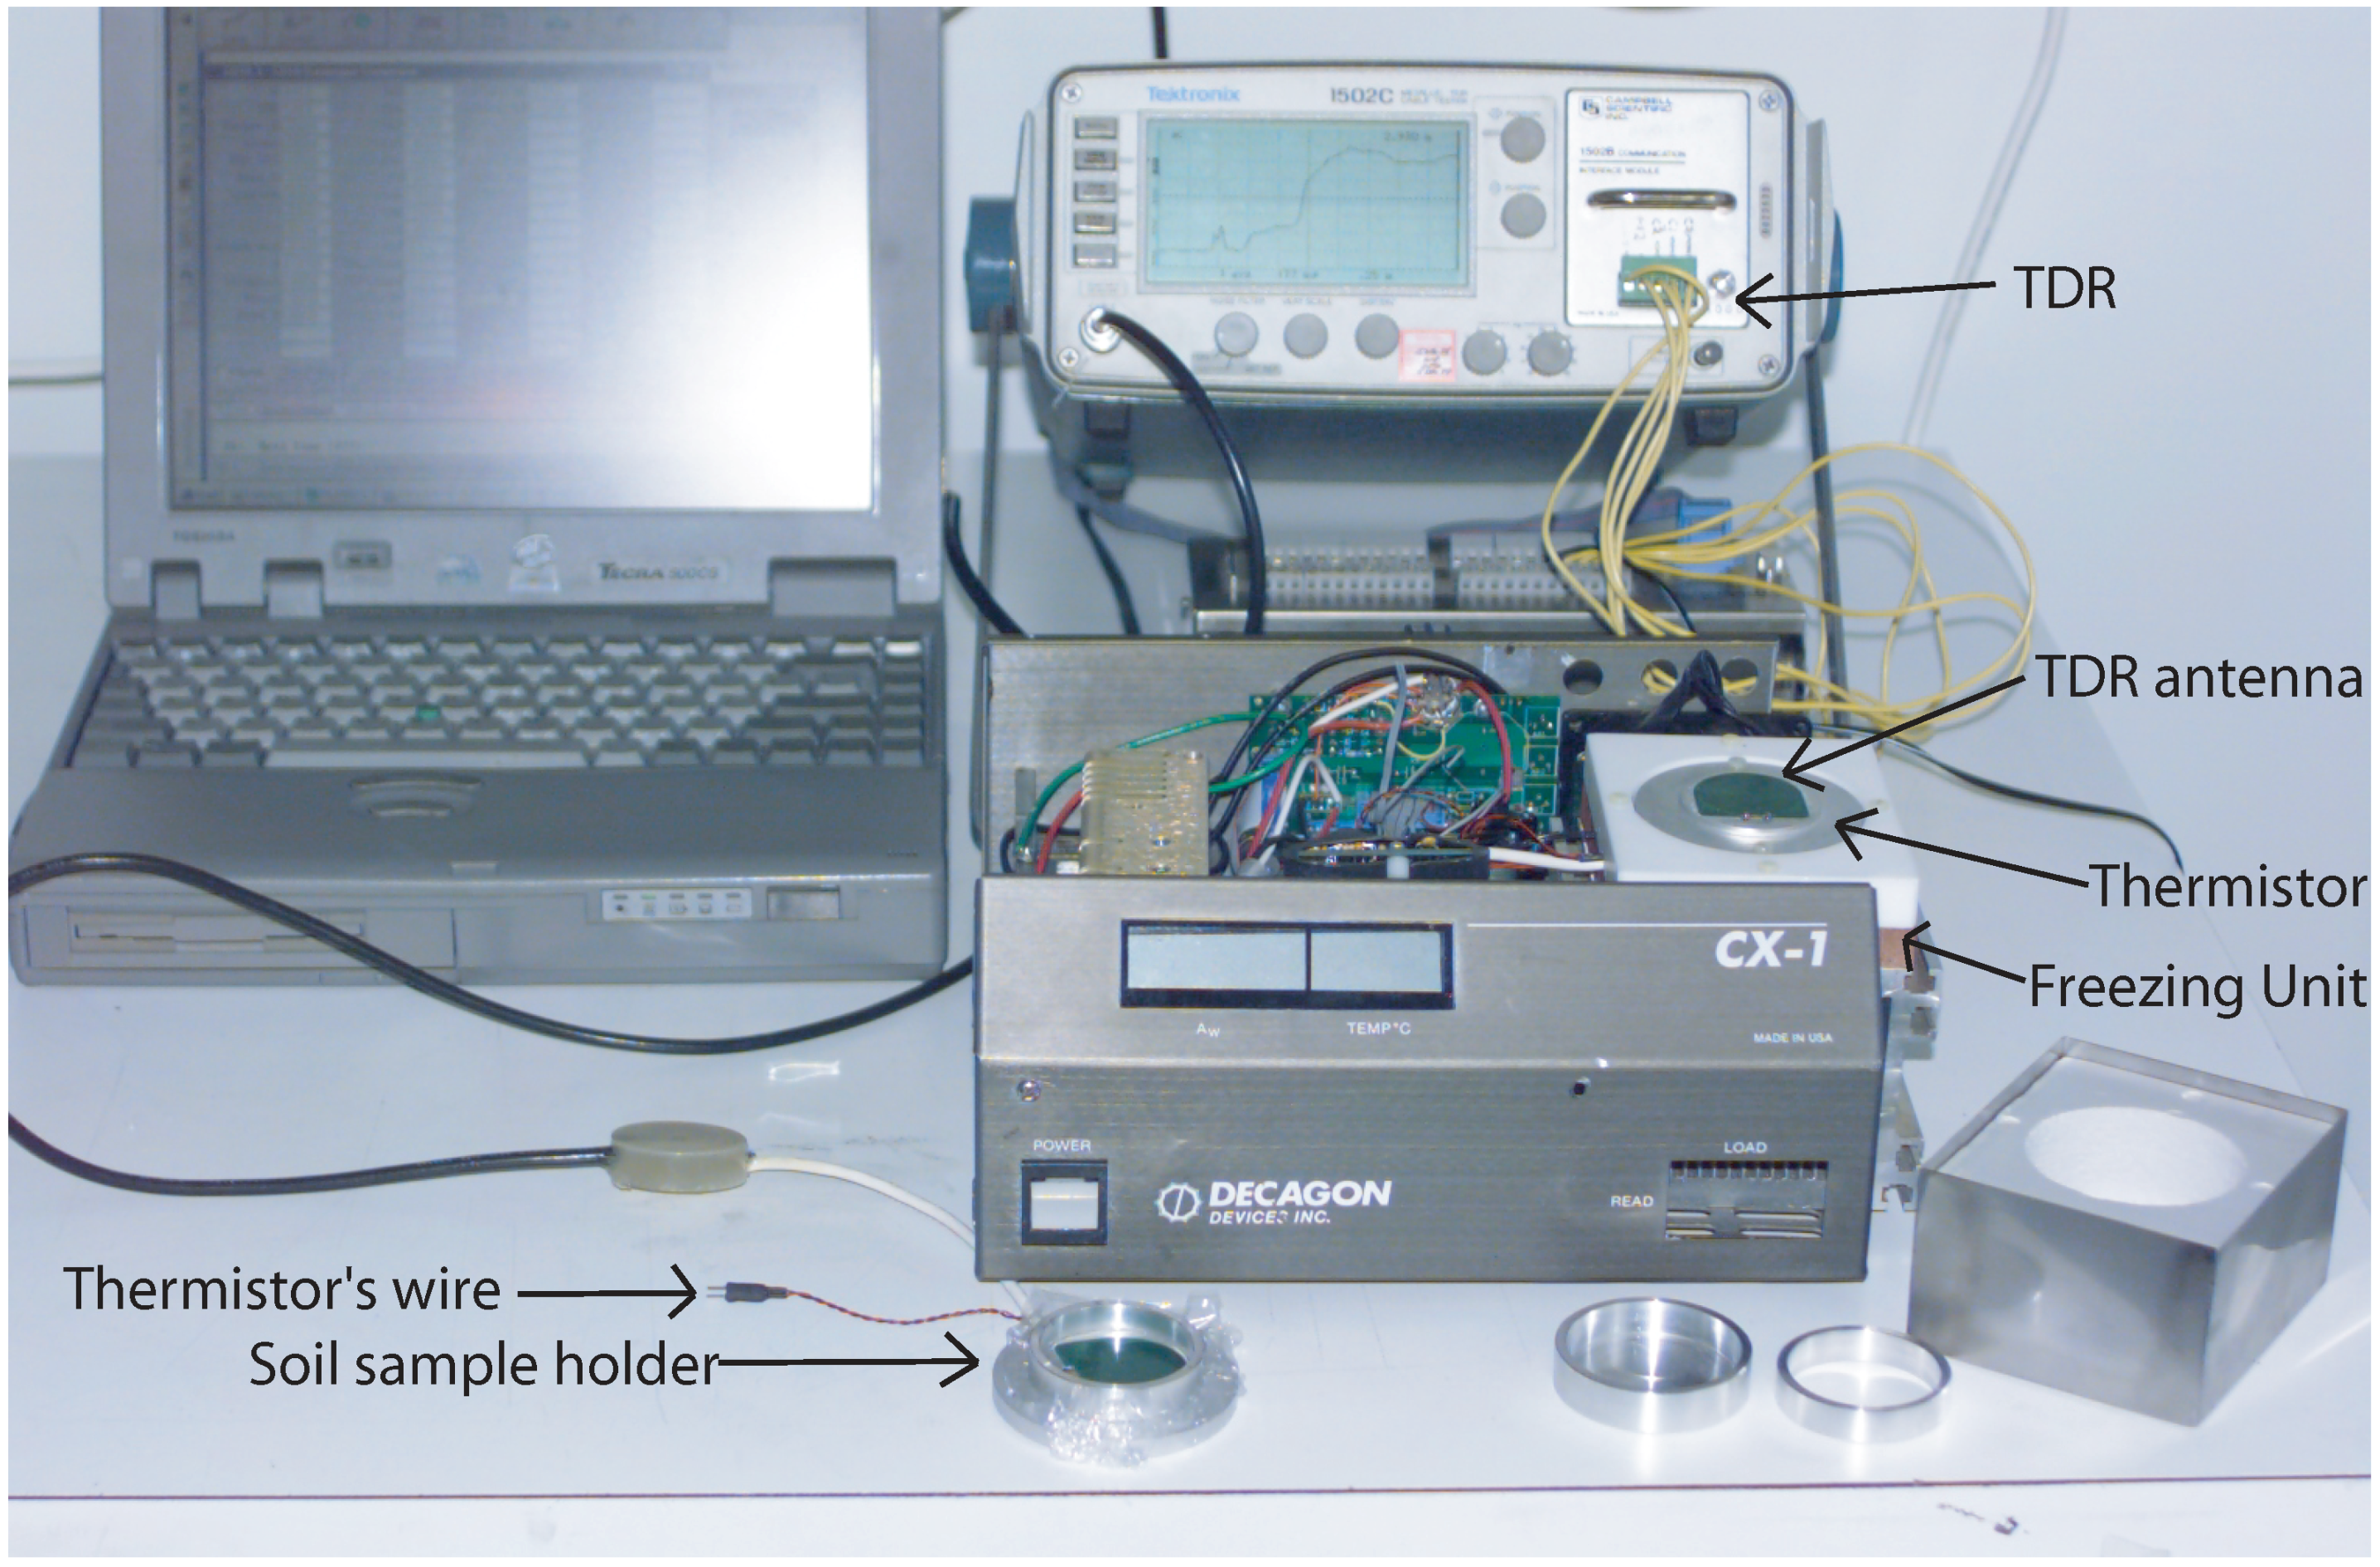
43], who named the device Thermo-Dielectric Analyzer (TDA), shown in
Figure 9. The measurement principle is based on accurate measurements of temperature (by means of high accuracy platinum thermistors) and soil water content by Time Domain Reflectometry (TDR). The soil sample is placed into a sample holder where a TDR antenna was specifically designed for measuring soil water content. The sample temperature is progressively decreased by a Peltier cooler and simultaneous measurement of soil temperature and water content are performed at various temperatures below zero degree Celsius.
Figure 9.
Thermo Dielectric Analyzer (TDA). Picture of the instrument with sample holder, TDR, TDR’s antenna and Peltier’s freezing unit. The Decagon CX-1 is only used as a case for holding the prototype developed by the author.
Figure 9.
Thermo Dielectric Analyzer (TDA). Picture of the instrument with sample holder, TDR, TDR’s antenna and Peltier’s freezing unit. The Decagon CX-1 is only used as a case for holding the prototype developed by the author.
The method described here offered an alternative technique to measure the soil moisture characteristic of a porous media. The methods provided a complete soil moisture characteristic from −10 to −10 J kg, covering a wide range of soil water potential. In fact, according to the Clapeyron equation, with a temperature measurement accuracy of 0.01 K, the water potential can be resolved to −11 J kg. The TDA is a fast (usually a complete cooling and melting cycle takes 12–15 hours) method to obtain a complete SWR curve. A disadvantage is that since water volumes changes with freezing the pore size distribution may be affected with changes in the soil water retention properties. However, according to the authors when compared to other methods, the effect was negligible.
Overall the advantages of: (a) provides a water retention curve spanning several orders of magnitude in water potential, (b) is fast. The disadvantages are: (a) it is not yet a commercial instrument, (b) usually only drying curves are obtained, (c) the measurement is affected by changes in soil water volume.
8. Applications for Soil Water Management in Agriculture
In this section, a few examples about how measurements of SWP can be used in practical applications are provided.
8.1. Field monitoring
The first area focuses on continuous monitoring of SWP in the field for irrigation management. A common approach for quantifying the irrigation amount and scheduling is through the calculation of the plant available water (PAW), which is defined as the difference between the soil water content at field capacity minus the soil water content at the permanent wilting point. Measurement of field SWP allows to replenish the soil and to compute the necessary irrigation volumes. Irrigation management is commonly defined as choices of irrigation techniques, schedule and volumes. However, successful irrigation depends upon understanding and utilizing irrigation scheduling principles to develop a plan that is tailored to crop water requirements and to meteorological and soil conditions.
Irrigation scheduling methods should be based on: (a) soil and/or crop monitoring, and (b) soil water budget calculations. Knowledge of SWP is needed in both cases, in the first case for soil monitoring aimed to replenish the soil profile of the correct amount of water, in the second case to compute infiltration, water redistribution, deep percolation and evapotranspiration. As we mentioned earlier, the SWP is the driving force for water movement in the entire soil-plant-atmosphere system.
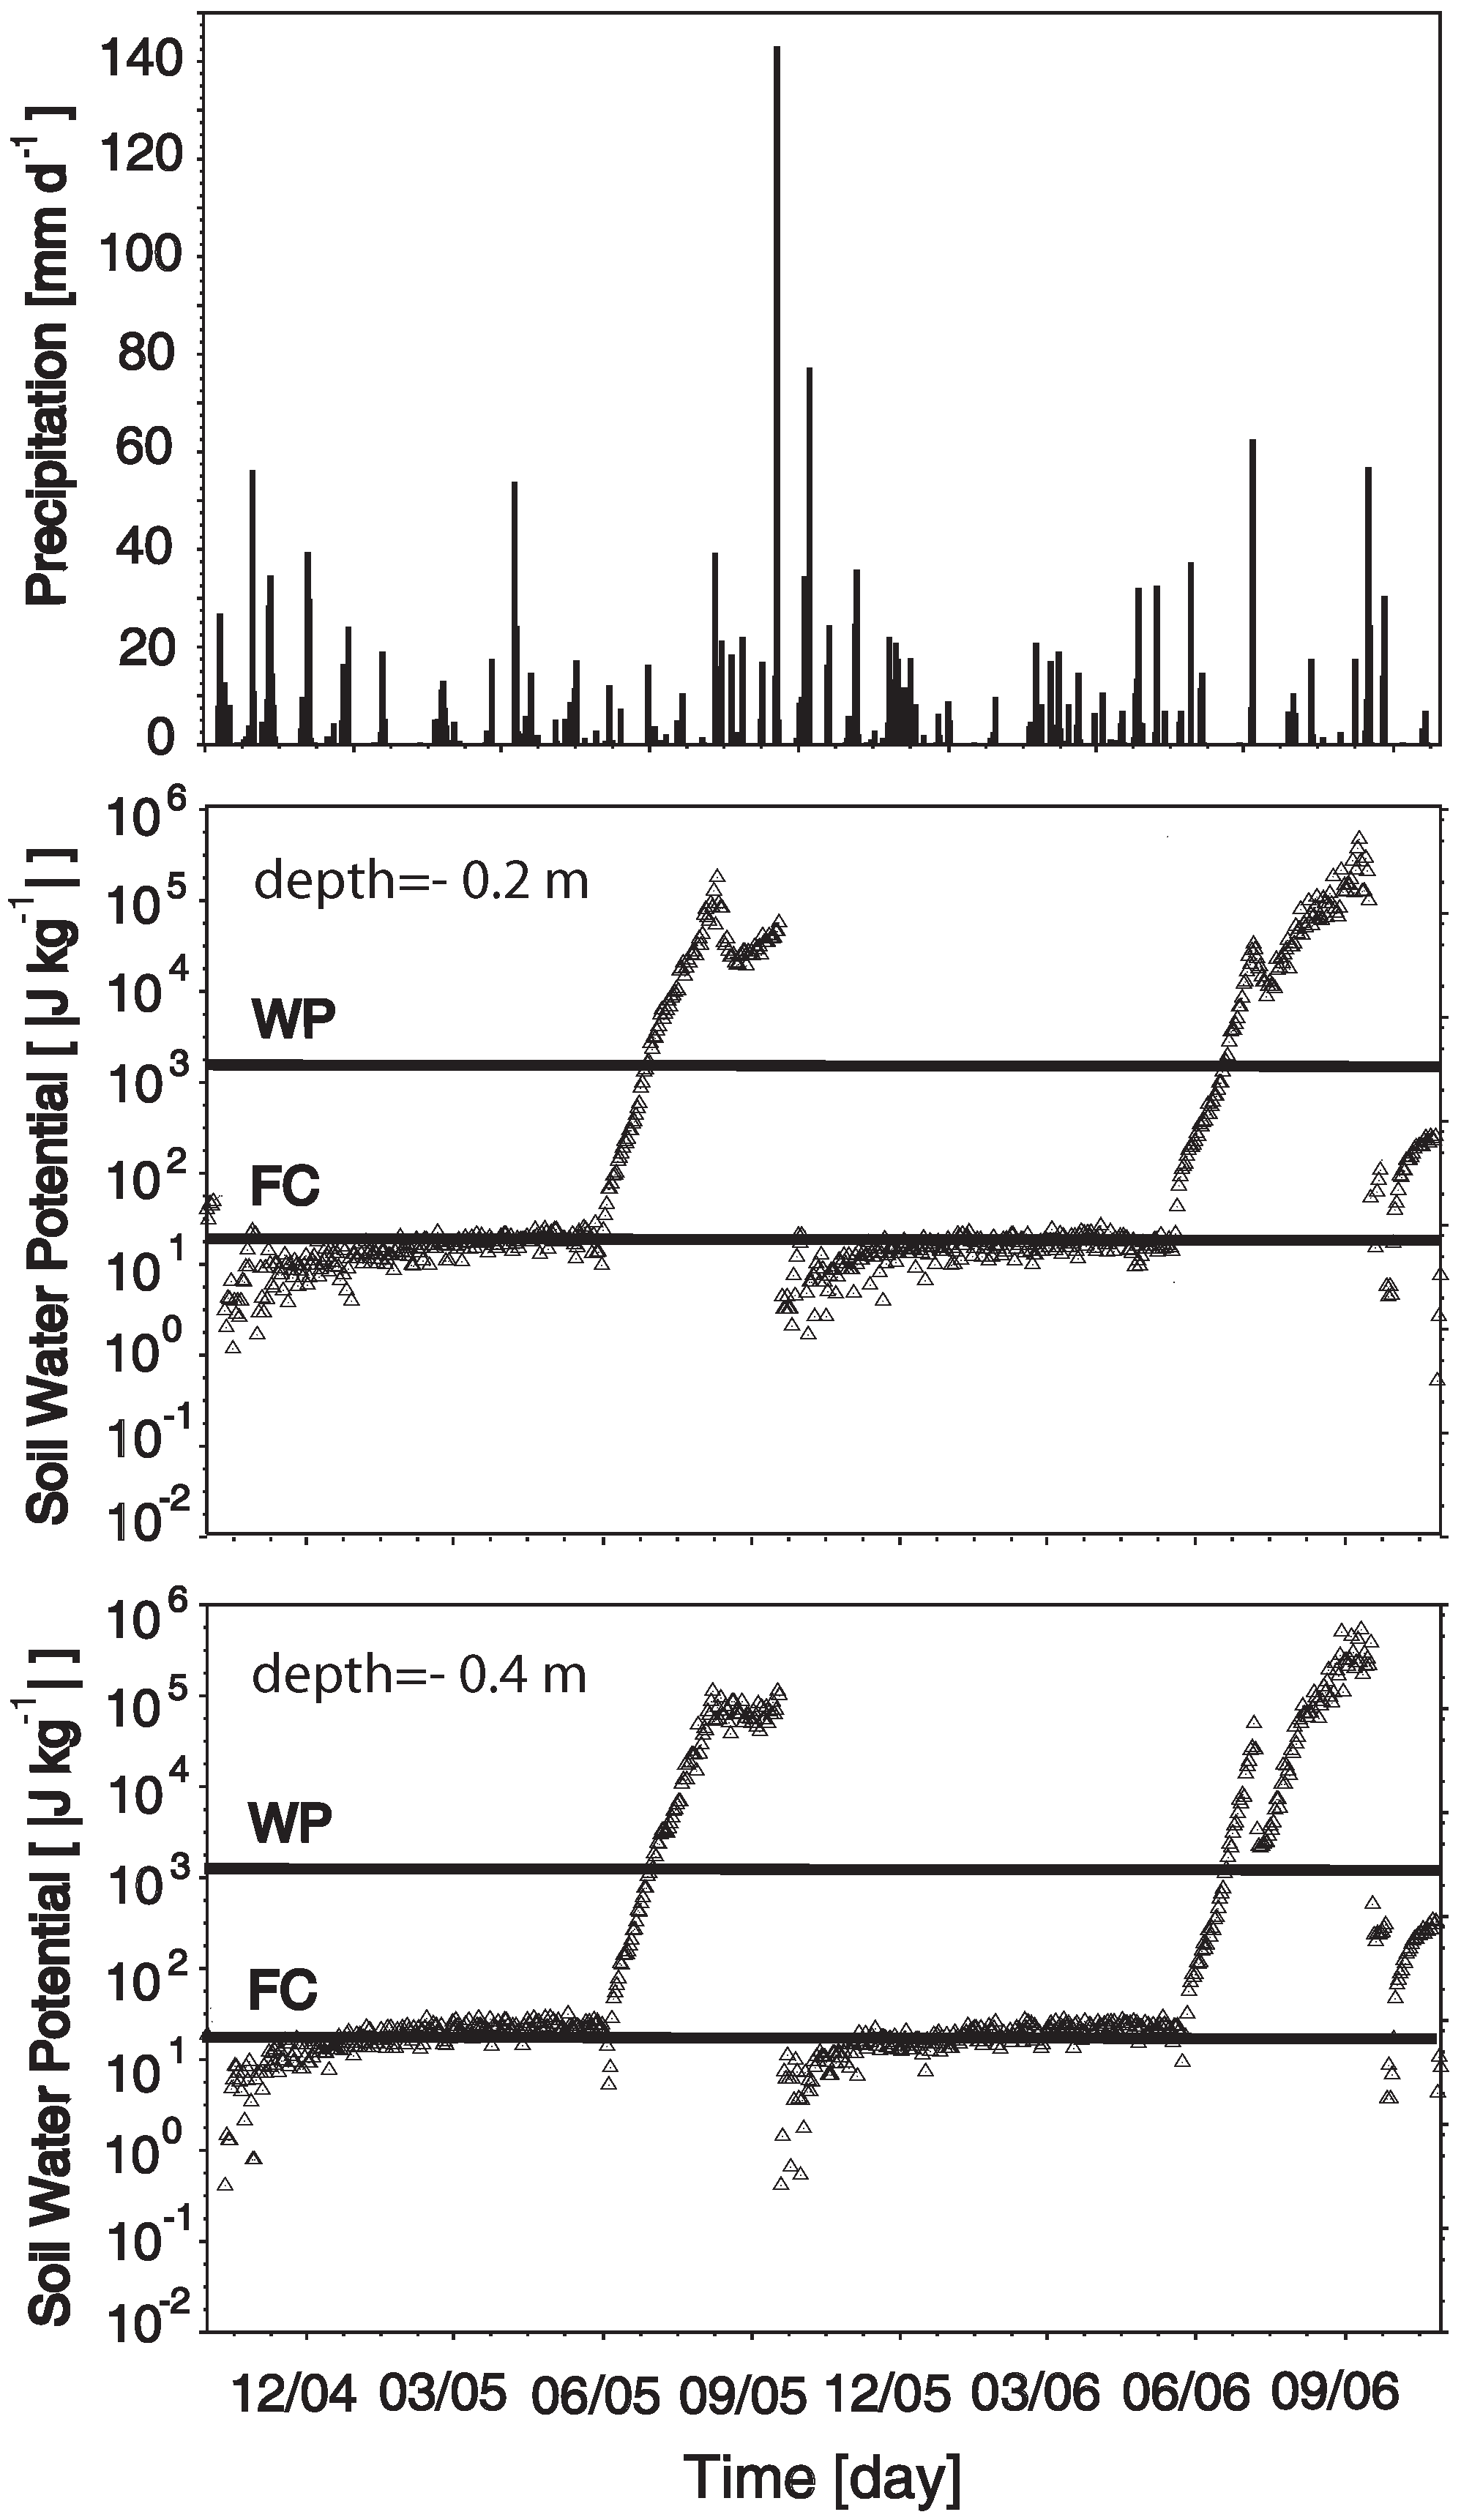
Figure 10 shows an example of SWP monitoring by using heat dissipation sensors. The data are unpublished data from the study presented by Bittelli
et al. (2006) [
44]. The area is covered by a dense natural vegetation (various species of shrubs and herbaceous plants), typical of the natural settings of the Apennine Mountains. The soil is at, or close to the field capacity (FC) value (−33 J kg
) for most of the winter at both depths. During the summer the SWP decreases to values lower than the wilting point (WP). Indeed, many of the spontaneous plants (since they were not irrigated) experienced water stress during the end of summer. At the end of summer, the SWP peaks are due to the intense rainfall events, also depicted by the precipitation graph.
While these data are representative of a natural area, under irrigated agriculture these measurements can be employed to schedule irrigation time and volumes, with the aim of replenishing the soil of water to bring the water potential values close or at field capacity. The irrigation system is controlled by a datalogger: when the SWP potential is recorded and the value is below a certain threshold, the datalogger switch on a port to start the irrigation pumps, when the SWP has reached a given value (for instance field capacity), the datalogger switch off the pumps. The system should be coupled with a meteorological station that records precipitation, temperature, relative humidity and wind velocity.
In many cases, techniques such as controlled water stress could also be employed to reduce irrigation water without reducing the crop yield to values that are not economically sustainable for the farm. Finally knowledge of soil and plants’ water potential can be used to develop, calibrate and test crop growth models and water budget models
The description above provided an overview of the most common methods to measure the SWP. A more detailed description of these methods can be found on books on soil analysis [
45]. However, how can these techniques be used to improve the water use efficiency in agriculture?
The answers can be grouped in two main areas: (a) measurement of soil hydraulic properties to be used for the quantification and modelling of the soil water budget and, (b) field installation of SWP sensor for irrigation management and scheduling.
Figure 10.
Daily soil water potential measured with heat dissipation sensors at two depths, under a natural spontaneous field of various species of shrubs and herbaceous plants, for a two years period. The graph on top is daily precipitation. The two horizontal lines indicate the value of field capacity (FC) and wilting point (WP).
8.2. Soil hydraulic properties, crop modelling and soil water budget
The second important application focuses on the necessity of obtaining a quantification of the soil hydraulic properties (
i.e., the soil water retention and the soil hydraulic conductivity), to be used to compute the soil water budget. There are two main approaches for obtaining the soil water retention parameters: the first is to experimentally determine the soil water retention and the soil hydraulic conductivity curve, and fit various functions to the experimental data [
46,
47,
48,
49]; the second is to derive the soil water retention parameters from knowledge of basic soil physical properties by using pedotransfer functions [
50,
51]. Pedotransfer functions (PTF) are functions obtained from different forms of regression analysis that allow to obtain the soil hydraulic properties from knowledge of basic soil physical properties such as texture, bulk density and soil organic matter content. While PTF’s are very useful tools, for a better quantification of the soil water budget and modelling it is advisable to obtain experimental data of hydraulic properties therefore measuring the SWP combined with the water content (soil water retention curve) and the hydraulic conductivity (soil hydraulic conductivity curve).
Another application where the measurement of the SWP is necessary is to determine the value of field capacity (FC) and wilting point (WP), needed to compute the plant available water (PAW), which is given by PAW = WC – WC, where WC is the soil water content at field capacity and WC is the soil water content at the wilting point.
The FC can be defined as soil water content held in soil after excess water has drained away and the rate of downward movement has decreased. This value is usually reached within 2–3 days after a rain or irrigation has ceased. A quantitative description of FC is the soil water content retained in the soil at a SWP of −33 J kg for clayey and loamy soils, and at a SWP of −10 J kg for sandy soils.
The wilting point (WP) is defined as the minimal amount of soil water retained before the plant starts to permanently wilt. If the soil water content is further decreased below this value, the plant is unable to regain the cell turgor. A quantitative description is the soil water content retained at a SWP of −1,500 J kg. This value is considered valid for the most common agricultural crops (wheat, corn, sunflower), however plants adapted to dry environments are able to survive at lower SWP values.
Clearly, the measurement of the soil water content at specified potentials requires equilibration of the soil sample at specified SWP or the measurement of the SWP potentials at different water contents.
While the definitions of FC and WP are empirical and their value may change depending on soil type, crop and crop variety, for practical applications they are useful and commonly used for irrigation management and crop modelling. Indeed, many crop and irrigation models [
52,
53] use the value of PAW to estimate crop water requirements and manage irrigation scheduling. In these models, the value of actual plant transpiration is determined by functions depending on the PAW in the soil “bucket”. Moreover, these models compute water flow based on the “tipping bucket” that utilizes the differences between FC and WP to determine the amount of water moving through soil layers in the vertical direction.
A correct measurement or estimation of the field capacity and wilting point volume fraction are therefore critical for obtaining reliable estimates of the above mentioned soil and crop related parameters, for land-use system analysis.
The computation of the soil hydraulic properties and related variables are then needed to compute the soil water budget. The soil water budget describes the changes in soil water content (within a given time interval), by computing the input of water (positive terms) and the output (negative terms) from a given volume of soil:
where
is the change in soil water storage,
P is precipitation,
I is irrigation,
E is soil evaporation,
T is plant’s transpiration,
is surface runoff,
is deep percolation and
is subsurface lateral flow. Often the evaporation and transpiration term are lumped into the term evapotranspiration. The SWP affects the magnitude of all the output terms
and
, therefore affecting the water budget as a whole. A correct quantification of the water budget, regardless whether or not it is computed through detailed crop modelling or through simplified formulations, should take into consideration this variable.
9. Conclusions
In this paper, the soil water potential has been first described to provide some definitions needed to understand its fundamental role in the soil water budget. The most important experimental techniques have been presented, with a detailed description of physical principles, most important technical features, advantages and disadvantages. Finally, some examples have been described with applications of SWP measurements in agriculture with the aim of saving irrigation water.
