


Abstract
To address the challenge of optimizing hydrological parameters for nitrogen pollution control in paddy polders, this study coupled the Stella eco-dynamics model with an external optimization algorithm and developed a nonlinear programming framework using the water surface ratio and inflow rate as decision variables and the maximum nitrogen removal rate as the objective function. The simulation and optimization conducted for the Hongze Lake polder area indicated that the model exhibited strong robustness, as verified through Monte Carlo uncertainty analysis, with coefficients of variation (CV) of nitrogen outlet concentrations all below 3%. Under the optimal regulation scheme, the maximum nitrogen removal rates (, , and ) during the soaking, tillering, and grain-filling periods reached 98.86%, 98.74%, and 96.26%, respectively. The corresponding optimal inflow rates () were aligned with the lower threshold limits of each growth period (1.20, 0.80, and 0.50 m3/s). The optimal channel water surface ratios () were 3.81%, 3.51%, and 3.34%, respectively, while the optimal pond water surface ratios () were 19.94%, 16.30%, and 17.54%, respectively. Owing to the agronomic conflict between “water retention without drainage” and concentrated fertilization during the heading period, the maximum nitrogen removal rate () during this stage was only 37.34%. The optimal channel water surface ratio () was 2.37%, the pond water surface ratio () was 19.04%, and the outlet total nitrogen load increased to 8.39 mg/L. Morphological analysis demonstrated that nitrate nitrogen and organic nitrogen dominated the outlet water body. The “simulation–optimization” coupled framework established in this study can provides quantifiable decision-making tools and methodological support for the precise control and sustainable management of agricultural non-point source pollution in the floodplain area.
1. Introduction
The polder area is generated by a large-scale overflow system formed between the lowlands and highlands of the lake plain. Because the nearby tidal water systems interact with the low- and high-lying regions, water cannot be discharged rapidly as in the lower reaches of major rivers but is instead retained between the high and low terrains. Dikes are often constructed around these areas to form enclosed regions for flood prevention and drainage protection. Paddy polders are riverine wetlands enclosed by embankments within the polder area. Owing to its ample water storage capacity, it has become a natural site for paddy cultivation [1]. As a secondary wetland formed through human activities, paddy polders support rich biodiversity, regulate eutrophic substances in the field, and mitigate excessive nitrogen pollution caused by inflow water and agricultural fertilization. Nitrogen in paddy polders exists in several forms. A related mathematical model can be implemented with system dynamics to analytically predict the compliance level of effluent quality after fertilization and irrigation. However, only limited developments exist regarding nitrogen cycle models for paddy polders, and most current studies focus on nitrogen cycle tracing in farmlands.
In this study, a constructed wetland model was applied to quantify the cyclic variation in nitrogen pollution in the polder following fertilization. Recently, constructed wetlands have been increasingly applied to remove excessive nutrients and pollutants from water [2,3,4]. However, because the denitrification mechanism in such systems is complex, no universal model for nitrogen removal is available. Existing constructed wetland models generally fall into two categories. One involves simplified mechanisms, such as first-order kinetic models and attenuation equations, whose parameter-solving processes are simple. These models are typically developed using abundant background monitoring data, lack explanations of internal mechanisms, and are unable to predict nitrogen cycle variations accurately and [5] reliably [6]. The other category aims to elucidate nitrogen removal mechanisms, such as the CW2D (Constructed Wetland 2D) model [7] and the FITOVERT model. These models have highly complex structures, require numerous input parameters, and are difficult to apply widely [8,9,10]. Consequently, two approaches to model construction have emerged, including graphical construction and programming construction. The former can enhance model visualization, whereas the latter can provide stronger capabilities for mechanistic analysis.
To better simulate and predict the nitrogen cycle variation in polders and improve the understanding of the interactions among the major elements of the system during operation, eco-dynamic models that facilitate pollutant removal have been gradually developed and refined. Based on the theory of the “box” model [11], various chemical, biological, and physical degradation and removal pathways of pollutants are divided into independent boxes and reaction processes. Reaction definitions are then assigned to each box [12], and the synergistic and antagonistic effects among them are identified, integrating these processes into a unified, eco-dynamic model. On this basis, software such as Stella [13,14], which adopts system dynamics modeling for environmental visualization, can be applied to implement the conceptual model and perform parameter analysis and calibration. In this study, the operating mechanism of surface-flow nitrogen pollution in the polder was analyzed using system dynamics principles, and the nitrogen dynamic model of the polder was developed in coordination with the visual modeling environment of Stella. Researchers have used STELLA to simulate the uptake and migration mechanisms of hexachlorocyclohexane in soil–plant ecosystems [5,15], while others have applied STELLA to estimate nitrogen dynamics in vertical flow constructed wetlands [16]. In contrast, the computational and simulation capabilities of Stella are limited, and its interface is relatively closed [17], preventing users from editing the model language automatically generated by the system. This restricts the application of the model under more complex conditions and limits its ability to solve complex objectives.
The water surface ratio and inflow rate are the core control parameters in water system planning. As a specially constructed wetland that supports human production activities, nitrogen in paddy polder primarily originates from agricultural fertilization, domestic sewage, and aquaculture wastewater. After these nitrogen sources enter the water body inside the polder with runoff, they are removed mainly through aquatic plant absorption, microbial action, adsorption and precipitation, and physical exchange. The water surface ratio functions as an “engine” for these removal mechanisms. It offers a larger reaction space, prolongs the hydraulic retention time, creates diverse habitats, and enhances the self-purification capacity of water bodies. However, a higher water surface ratio is not necessarily better. An excessively high ratio occupies agricultural land and counteracts nitrogen pollution purification. To meet drainage, ecological, and storage demands across different regions, scholars have studied reasonable water surface ratios defined by functional requirements. He et al. [18] developed a calculation model based on the coordinated regulation of drainage, drought resistance, and ecological water demand, suggesting that the suitable water surface ratio in the Lingcheng Irrigation Area of the Huaibei Plain was 10.52%. Kim et al. [19] further applied the water surface ratio to the critical evaluation and optimization of urban water management systems, providing a standard for quantitatively assessing the water-cycle robustness and linking the ratio with land-use patterns and surface conditions. Similarly, the inflow rate is crucial for water resource management and pollution control in polders. It affects the hydraulic retention time and generates dilution- and concentration-driven processes. In most cases, an increase in inflow rate can reduce nitrogen removal efficiency. Once the flow becomes too large, the removal rate drops sharply, and the purification efficiency becomes very low [20]. Therefore, the core of nitrogen removal management in paddy polders lies in coordinating the inflow rate and hydraulic retention time through engineering and ecological measures. Consequently, the paddy polder as a natural “purifier” operates in an efficient and stable state. Nevertheless, no studies have linked the nitrogen pollution removal process in paddy polders with the water surface ratio and inflow rate. This is of paramount importance for the ecological sustainability of paddy field agriculture and the sustainable application of management models. The objective of this study is to identify the optimal water surface ratio and inflow rate for paddy polders in order to maximize pollution reduction efficiency. By integrating an optimization algorithm model with STELLA-based simulations of nitrogen dynamics, this dual-model approach offers a technical foundation for supporting sustainable agricultural production and promoting healthy water cycles in paddy polders systems.
2. Materials and Methods
2.1. Study Area and Data Sources
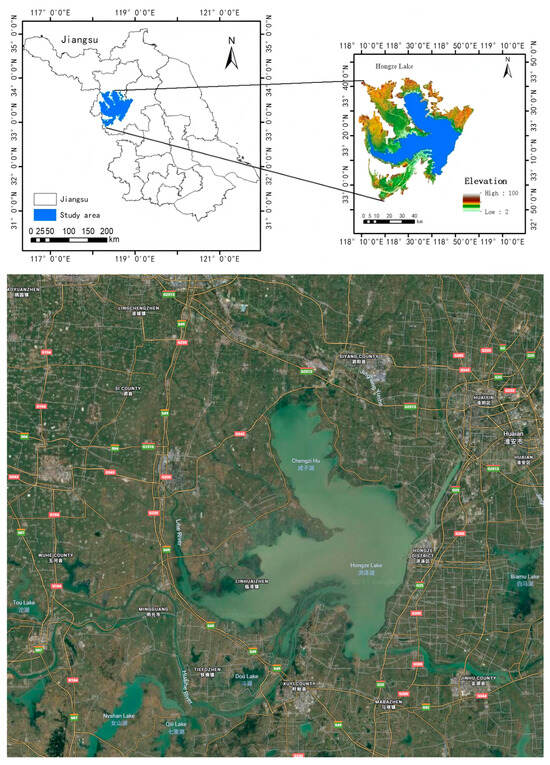
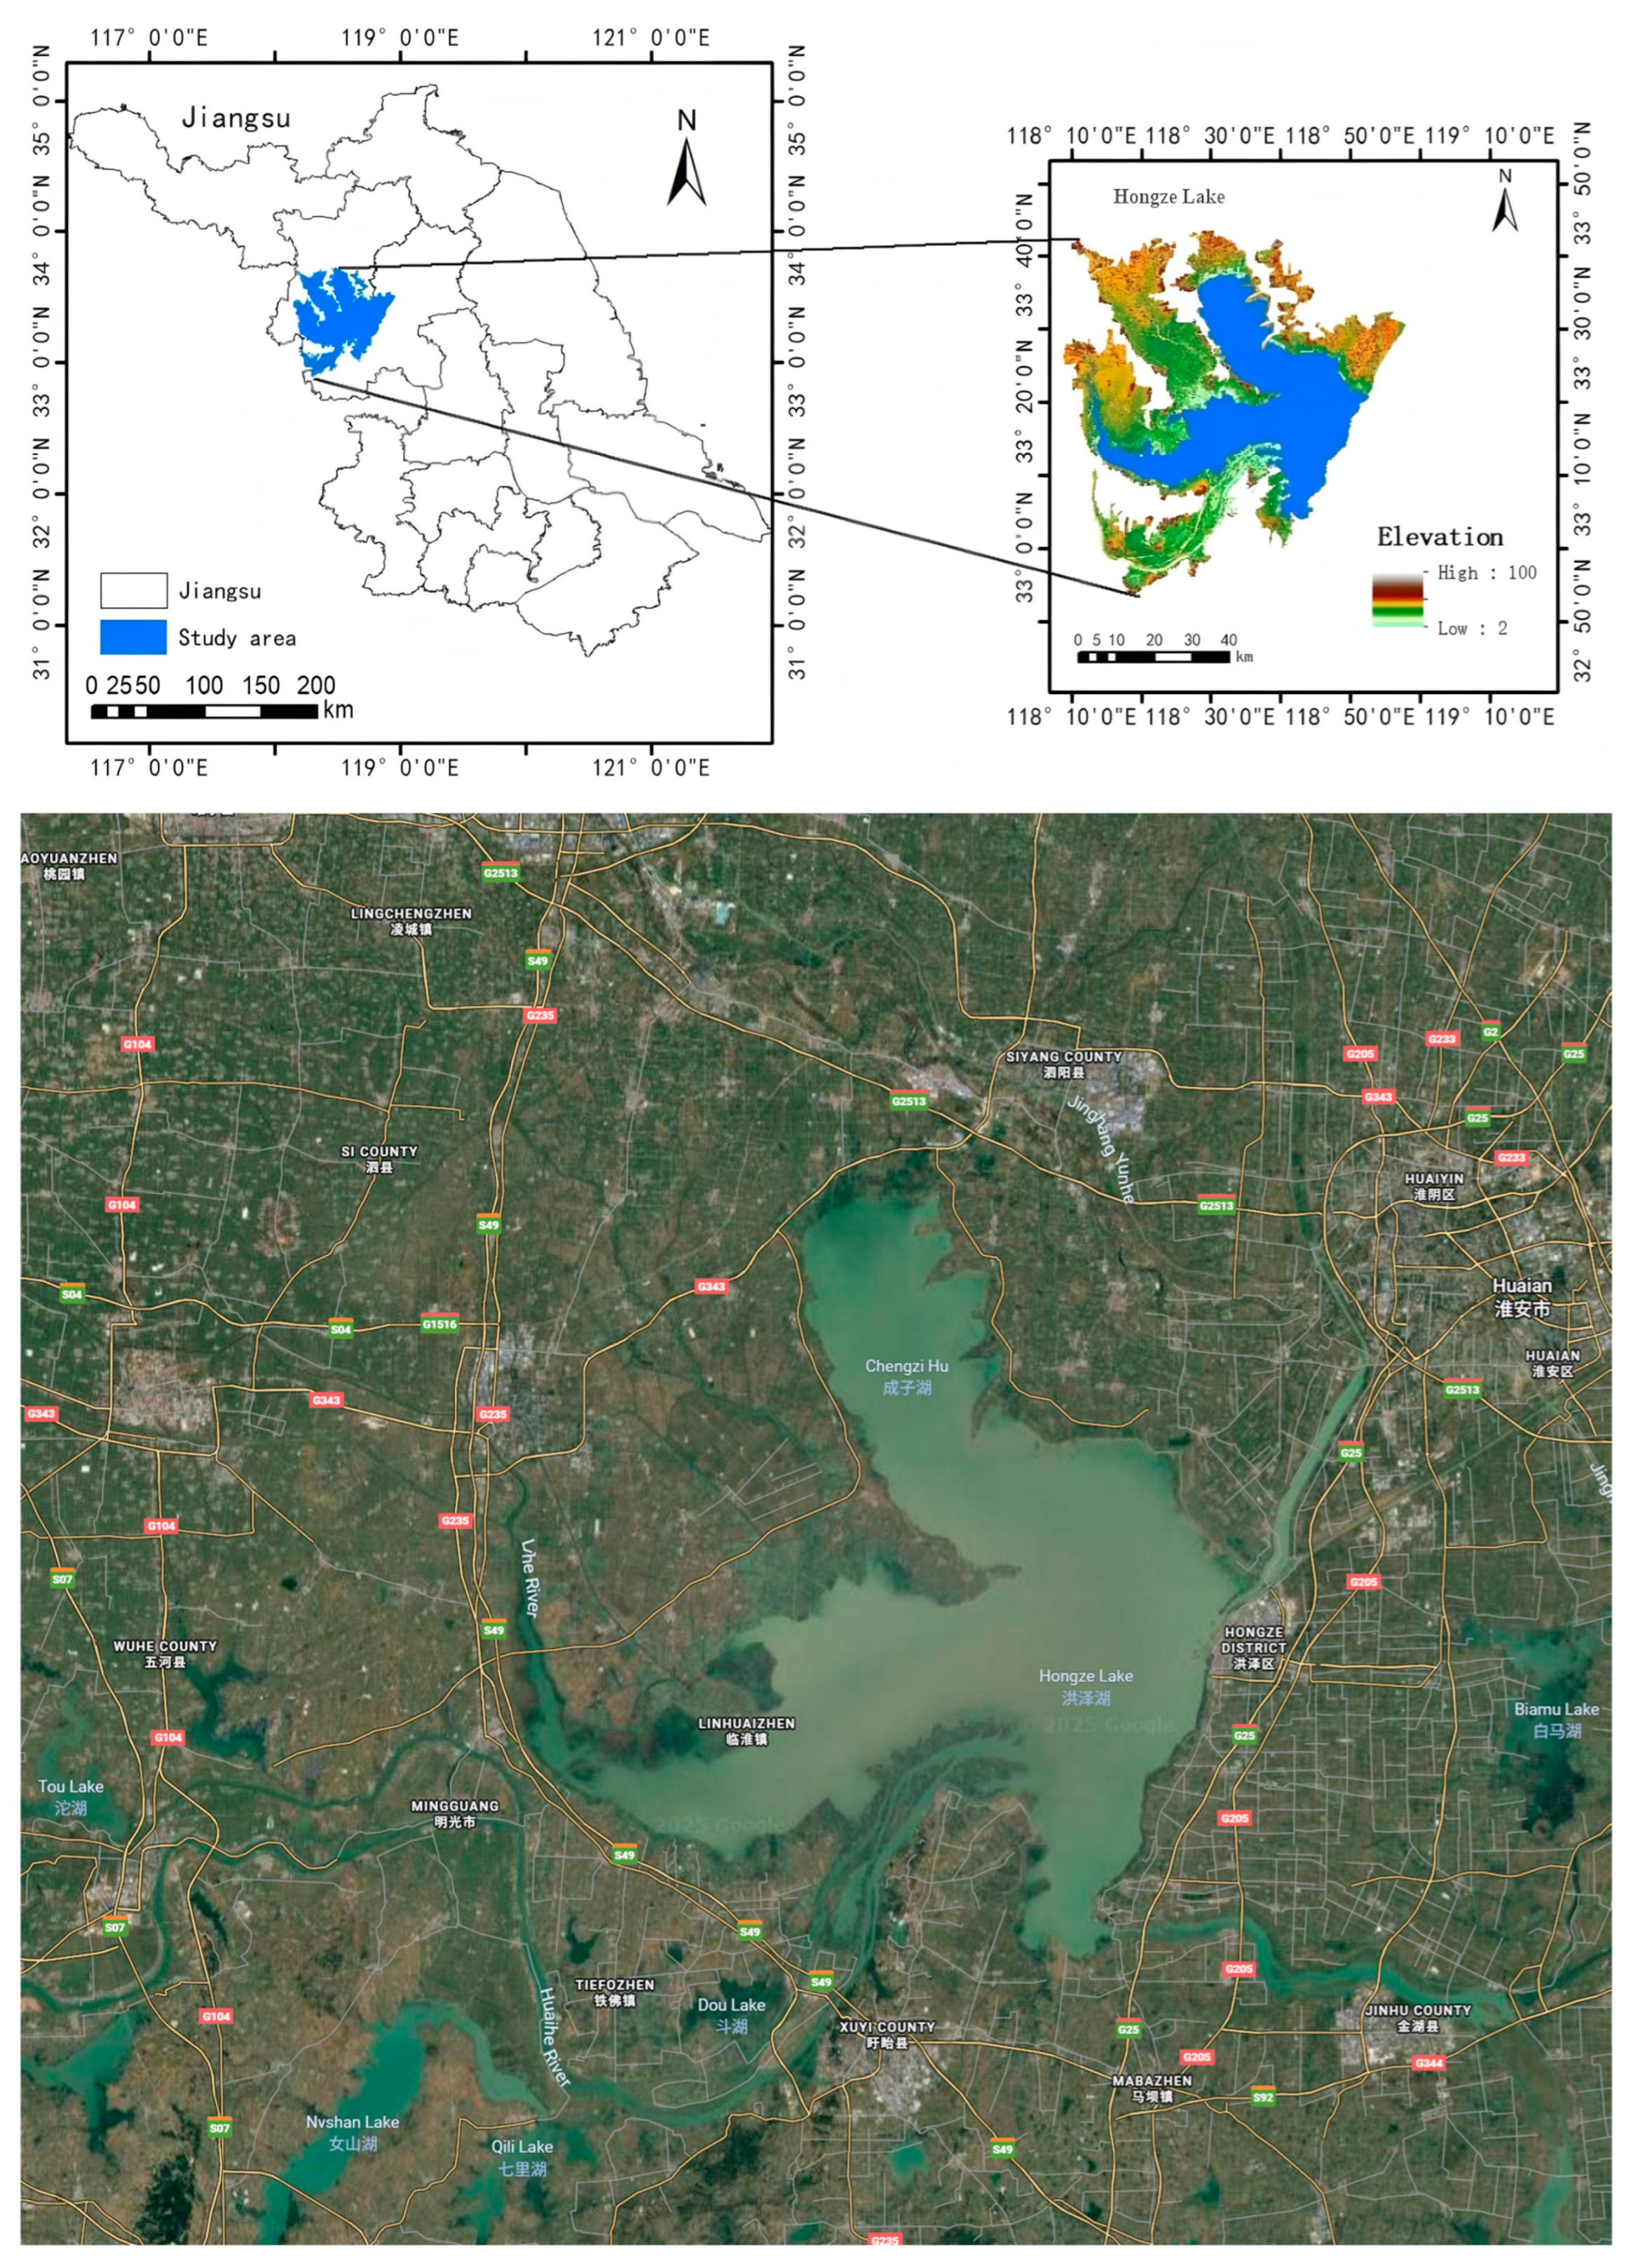
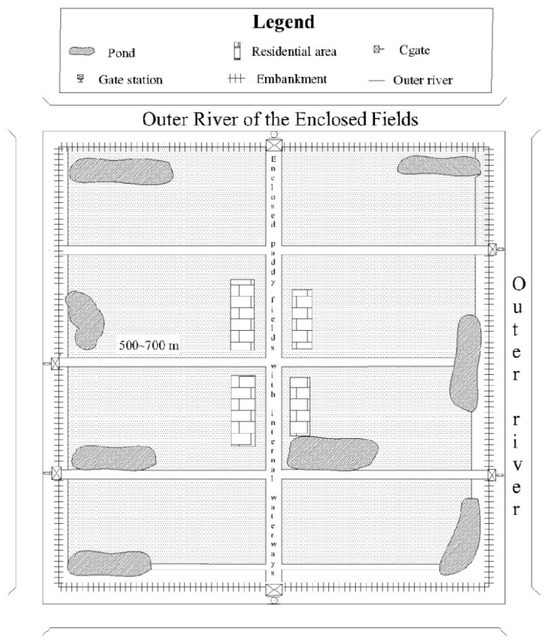
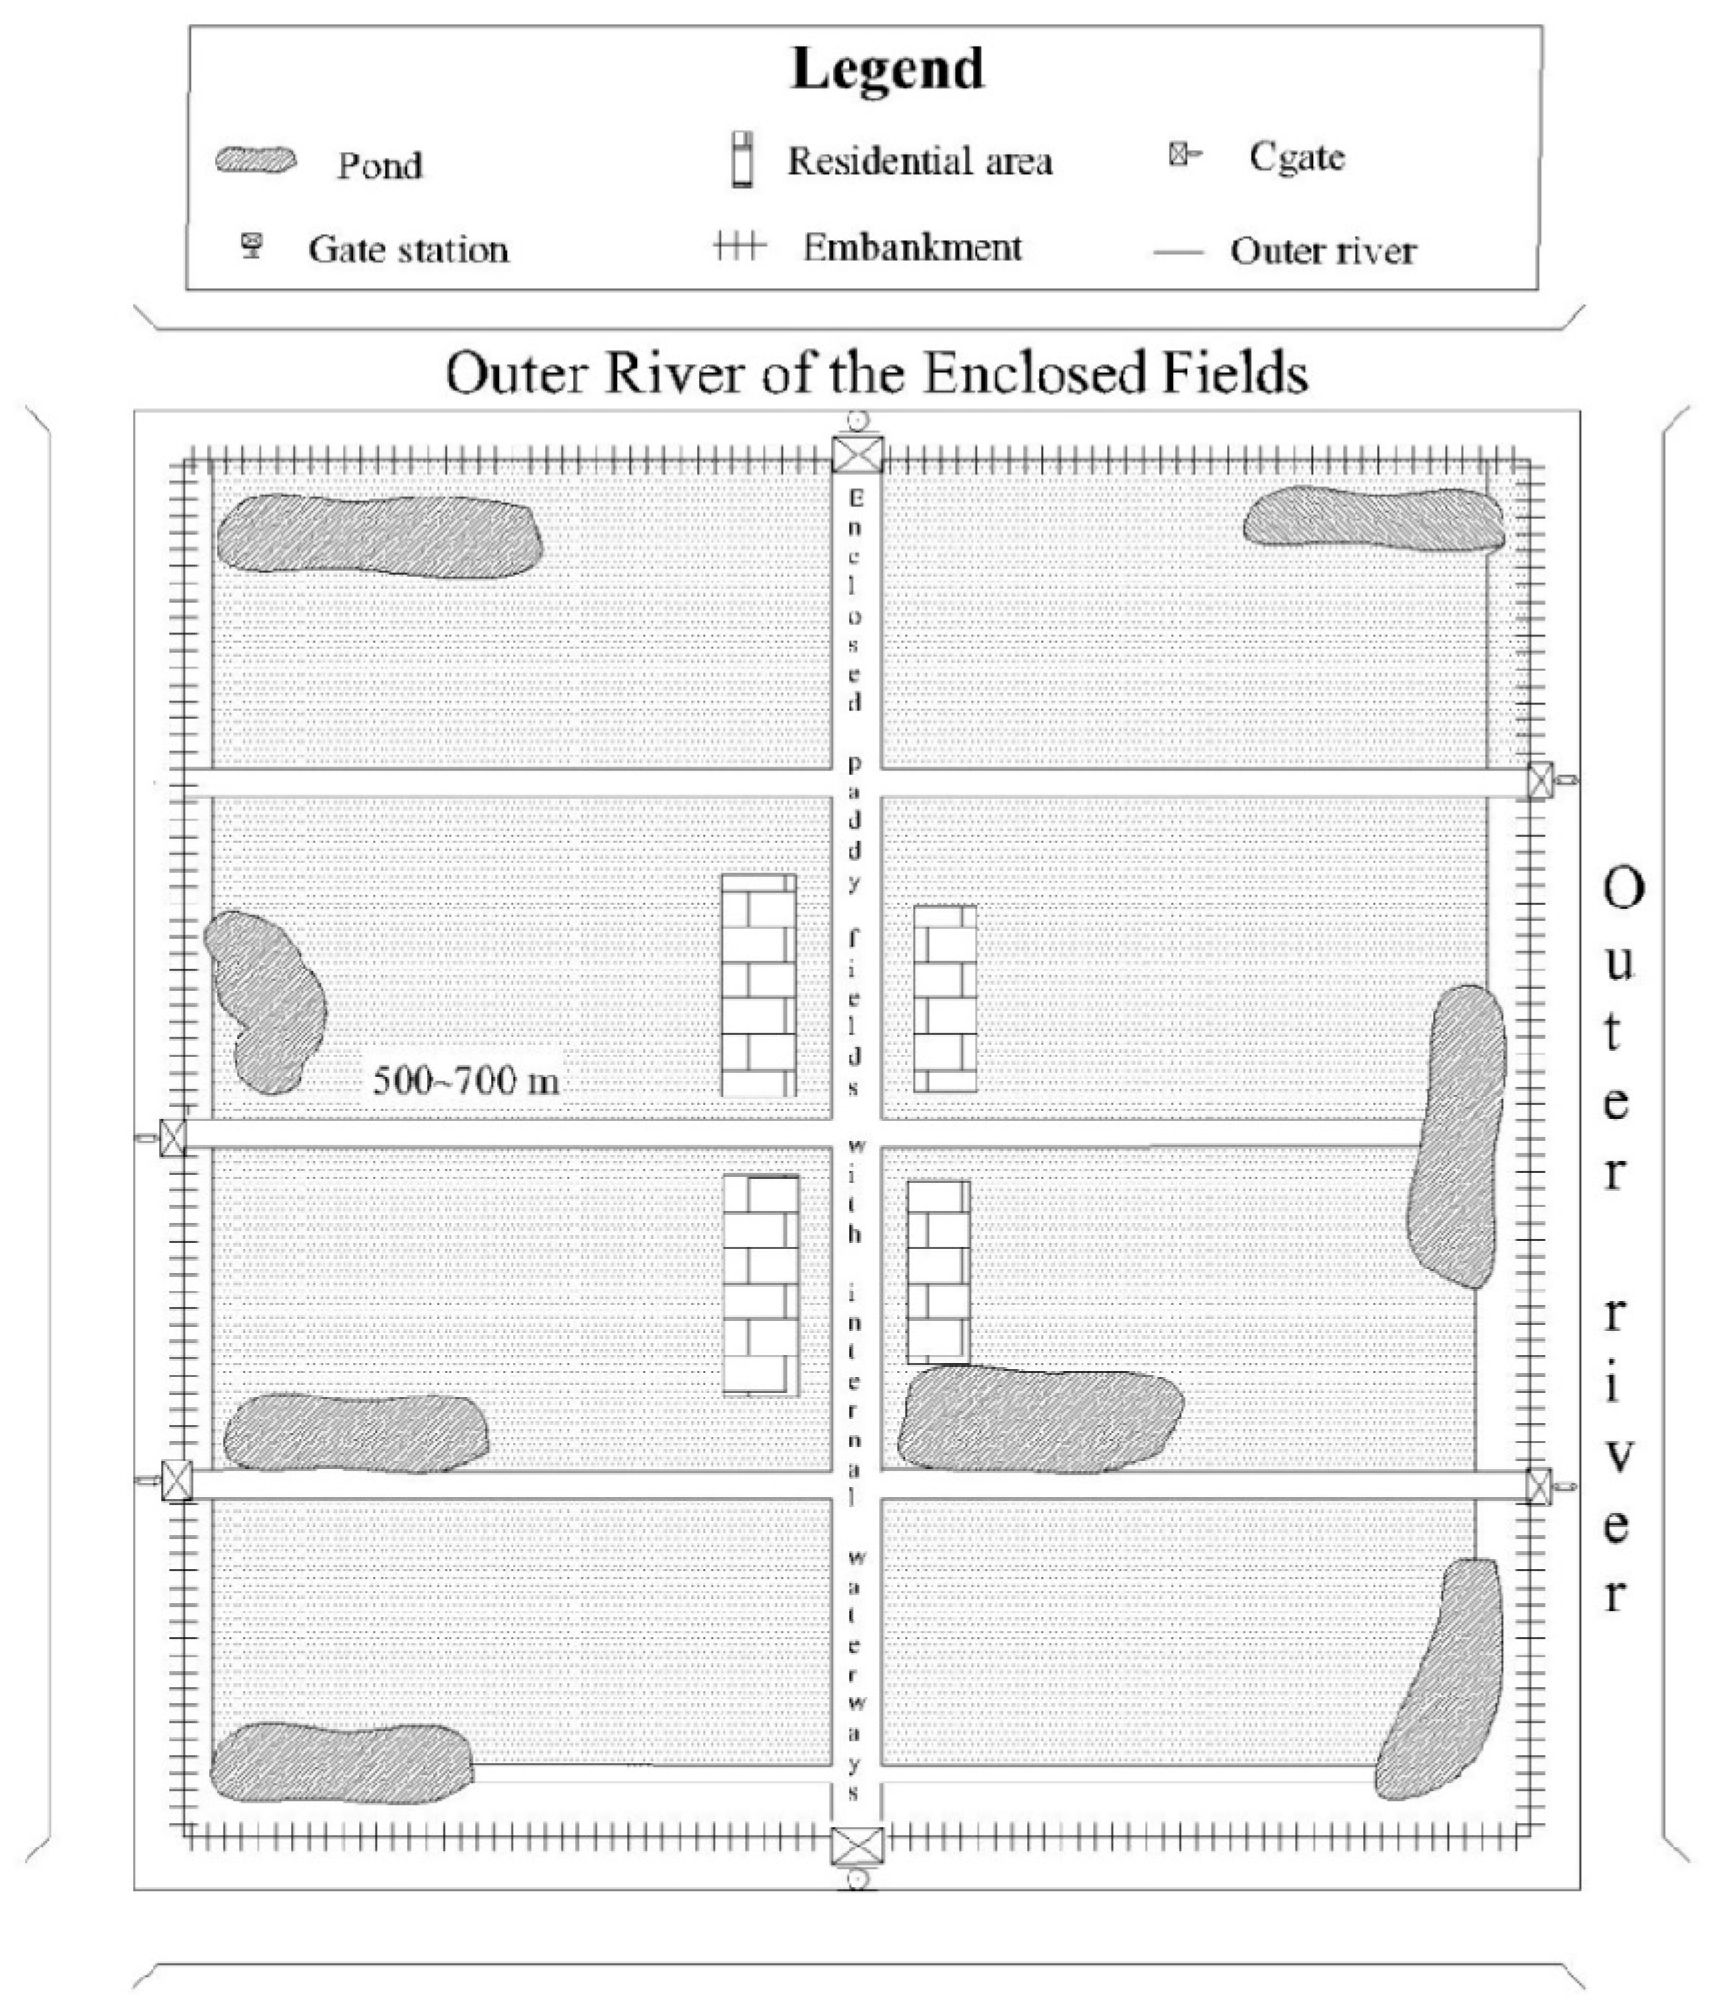
This study adopted the agricultural polder area of Hongze Lake in Jiangsu Province as the research object (Figure 1). The region belongs to the Lixiahe area, with a cultivated land area of 1032.4 km2 and a total of 389 polders. Multiple outer rivers pass through the flood detention and storage area, forming an irrigation and drainage water network for the polders. The normal water level is 12.5 m, the low water level is 11.5 m, and the highwater level is 13.5 m. The water surface ratio inside the polder area generally ranges between 10% and 20%. The river network within the polders consists mainly of two levels: medium ditches and small ditches. Polder gates or set gates are constructed at both ends of the central river and at the river mouths of the production rivers to facilitate water intake, drainage, and navigation. Although the shape of the polder area is generally irregular, most polders are approximately rectangular. A main river is located at or near the center of each polder, and several branch rivers are arranged perpendicularly on both sides of the main river to shorten the drainage time and lower the groundwater level [21]. Residential areas are typically located along both sides of the main river, providing convenience for agricultural activities. The ponds beside the ditches around the paddy polders are mostly formed by terrain, remain relatively independent, and are utilized for farmland irrigation, pond aquaculture, and small-scale ecological regulation. A polder was employed as the research object, and its system conceptualization is illustrated in Figure 2.
Figure 1.
Overview of the study area.
Figure 2.
Conceptual diagram of the system.
This study examined the nitrogen cycling model of paddy polder in the polder area. According to the local crop planting schedule, the rice varieties in the polders are mainly medium-maturity japonica rice. Rice is generally sown in early to mid-May and matures in mid- to late October. The yield is high, and fertilizer application is relatively intensive, averaging 20 kg per mu [21].
The inflow of the paddy polder originates from irrigation water diverted from the surrounding rivers. After fertilization of the rice field, the nitrogen pollution level inside the paddy polder exhibits an annual sharp increase. After passing through the paddy field and the internal artificial ecological ditches and ponds, when the drainage water quality meets Class III of the Environmental Quality Standards for Surface Water (GB3838-2002 [22]) (ammonia nitrogen ≤ 1.0 mg/L) [22], it can be discharged into local rivers to protect the water quality of the South-to-North Water Transfer clean-water corridor.
Monitoring sections were set at the inlets and outlets of the polders adjacent to the rivers in the study area. All monitoring sections were national control sections. Water quality indicators were obtained from the National Surface Water Quality Status website of the Ministry of Ecology and Environment of the People’s Republic of China (mee.gov.cn) and included dissolved oxygen, water temperature, pH, BOD, COD, total nitrogen, ammonia nitrogen, nitrate nitrogen, and other parameters. These indicators were monitored during drainage events after fertilization in each rice growth period. The spatial resolution of the data is 5 km. Relevant environmental data were collected continuously over two years for simulation purposes, with data acquisition occurring daily for 15 days following fertilization at each growth stage of rice. The monitoring method followed the protocols recommended by relevant standards. In addition, the polder operation management unit was installed with flow meters and automatic water quality monitoring instruments at the inlet and outlet pump stations of the paddy polder, enabling the acquisition of daily real-time data.
2.2. Construction of the Eco-Dynamic Model of the Paddy Polder
2.2.1. System Dynamics Equations of the Nitrogen Cycle
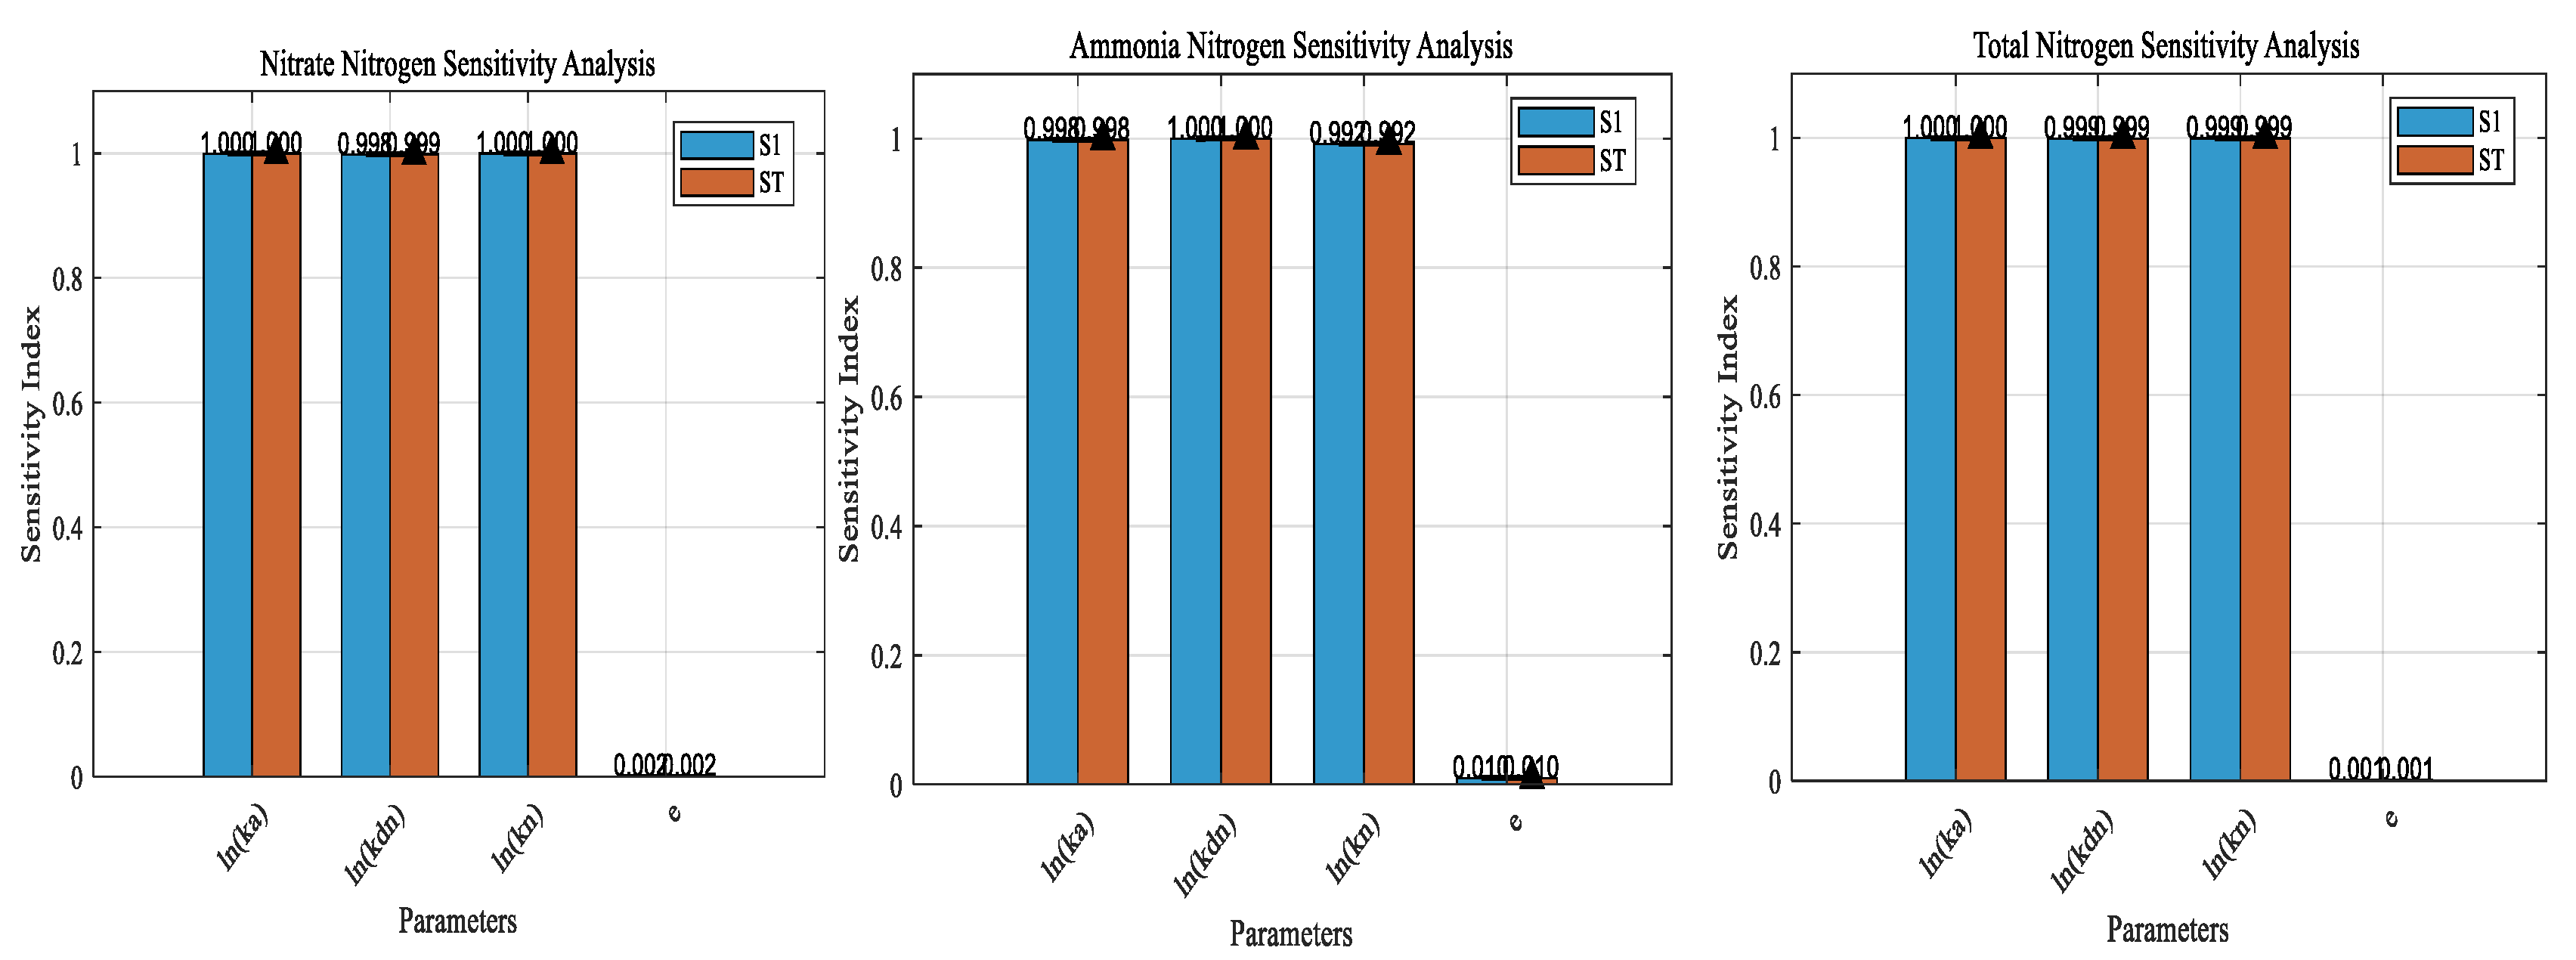
The main forms of nitrogen in the subsurface flow constructed wetland of the polder area include nitrate nitrogen, ammonium nitrogen, and organic nitrogen. The system denitrification model in eco-dynamics also analyzes the mutual transformation among these three nitrogen forms. Microorganisms can contribute to absorption, nitrification, and related processes, and their residues decompose rapidly after death, with the nitrogen absorbed during growth soon returning to the water body. Therefore, this process has little influence on the overall denitrification effect and can be ignored under subsurface flow conditions in the polder area [23]. However, given the extensive cultivation of rice and the potentially secondary role of plant-growth feedback in nitrogen cycling, a sensitivity analysis was conducted on plant uptake rates and key first-order kinetic parameters relative to various nitrogen export concentrations. The results (Figure 3) show that the plant uptake rate constant has a negligible influence on the system compared to the rate constants for organic ammonification , nitrification , and denitrification . Therefore, simplifying plant uptake as a static rate based on a semi-saturation constant is adequate for assessing nitrogen budgets at interannual or growth-stage scales. The drainage cycle of paddy systems aligns with the rice growth period, forming an intermittent drainage regime that differs from the continuous sediment-water exchange in deep lakes. During major drainage events, short-term mixing and water exchange can obscure long-term sediment effects. In such systems, the net outcome of sedimentation and resuspension can often be approximated by the net organic nitrogen sedimentation rate . [24].
Figure 3.
Parameter Sensitivity Analysis.
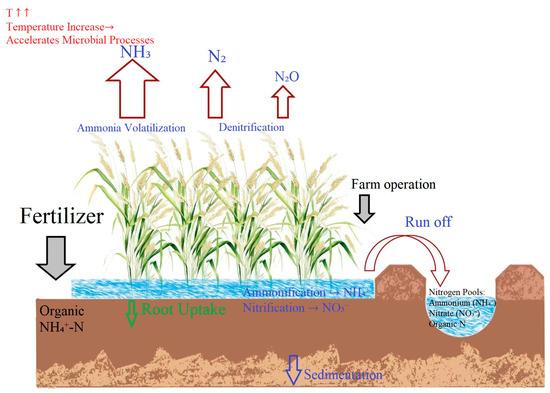
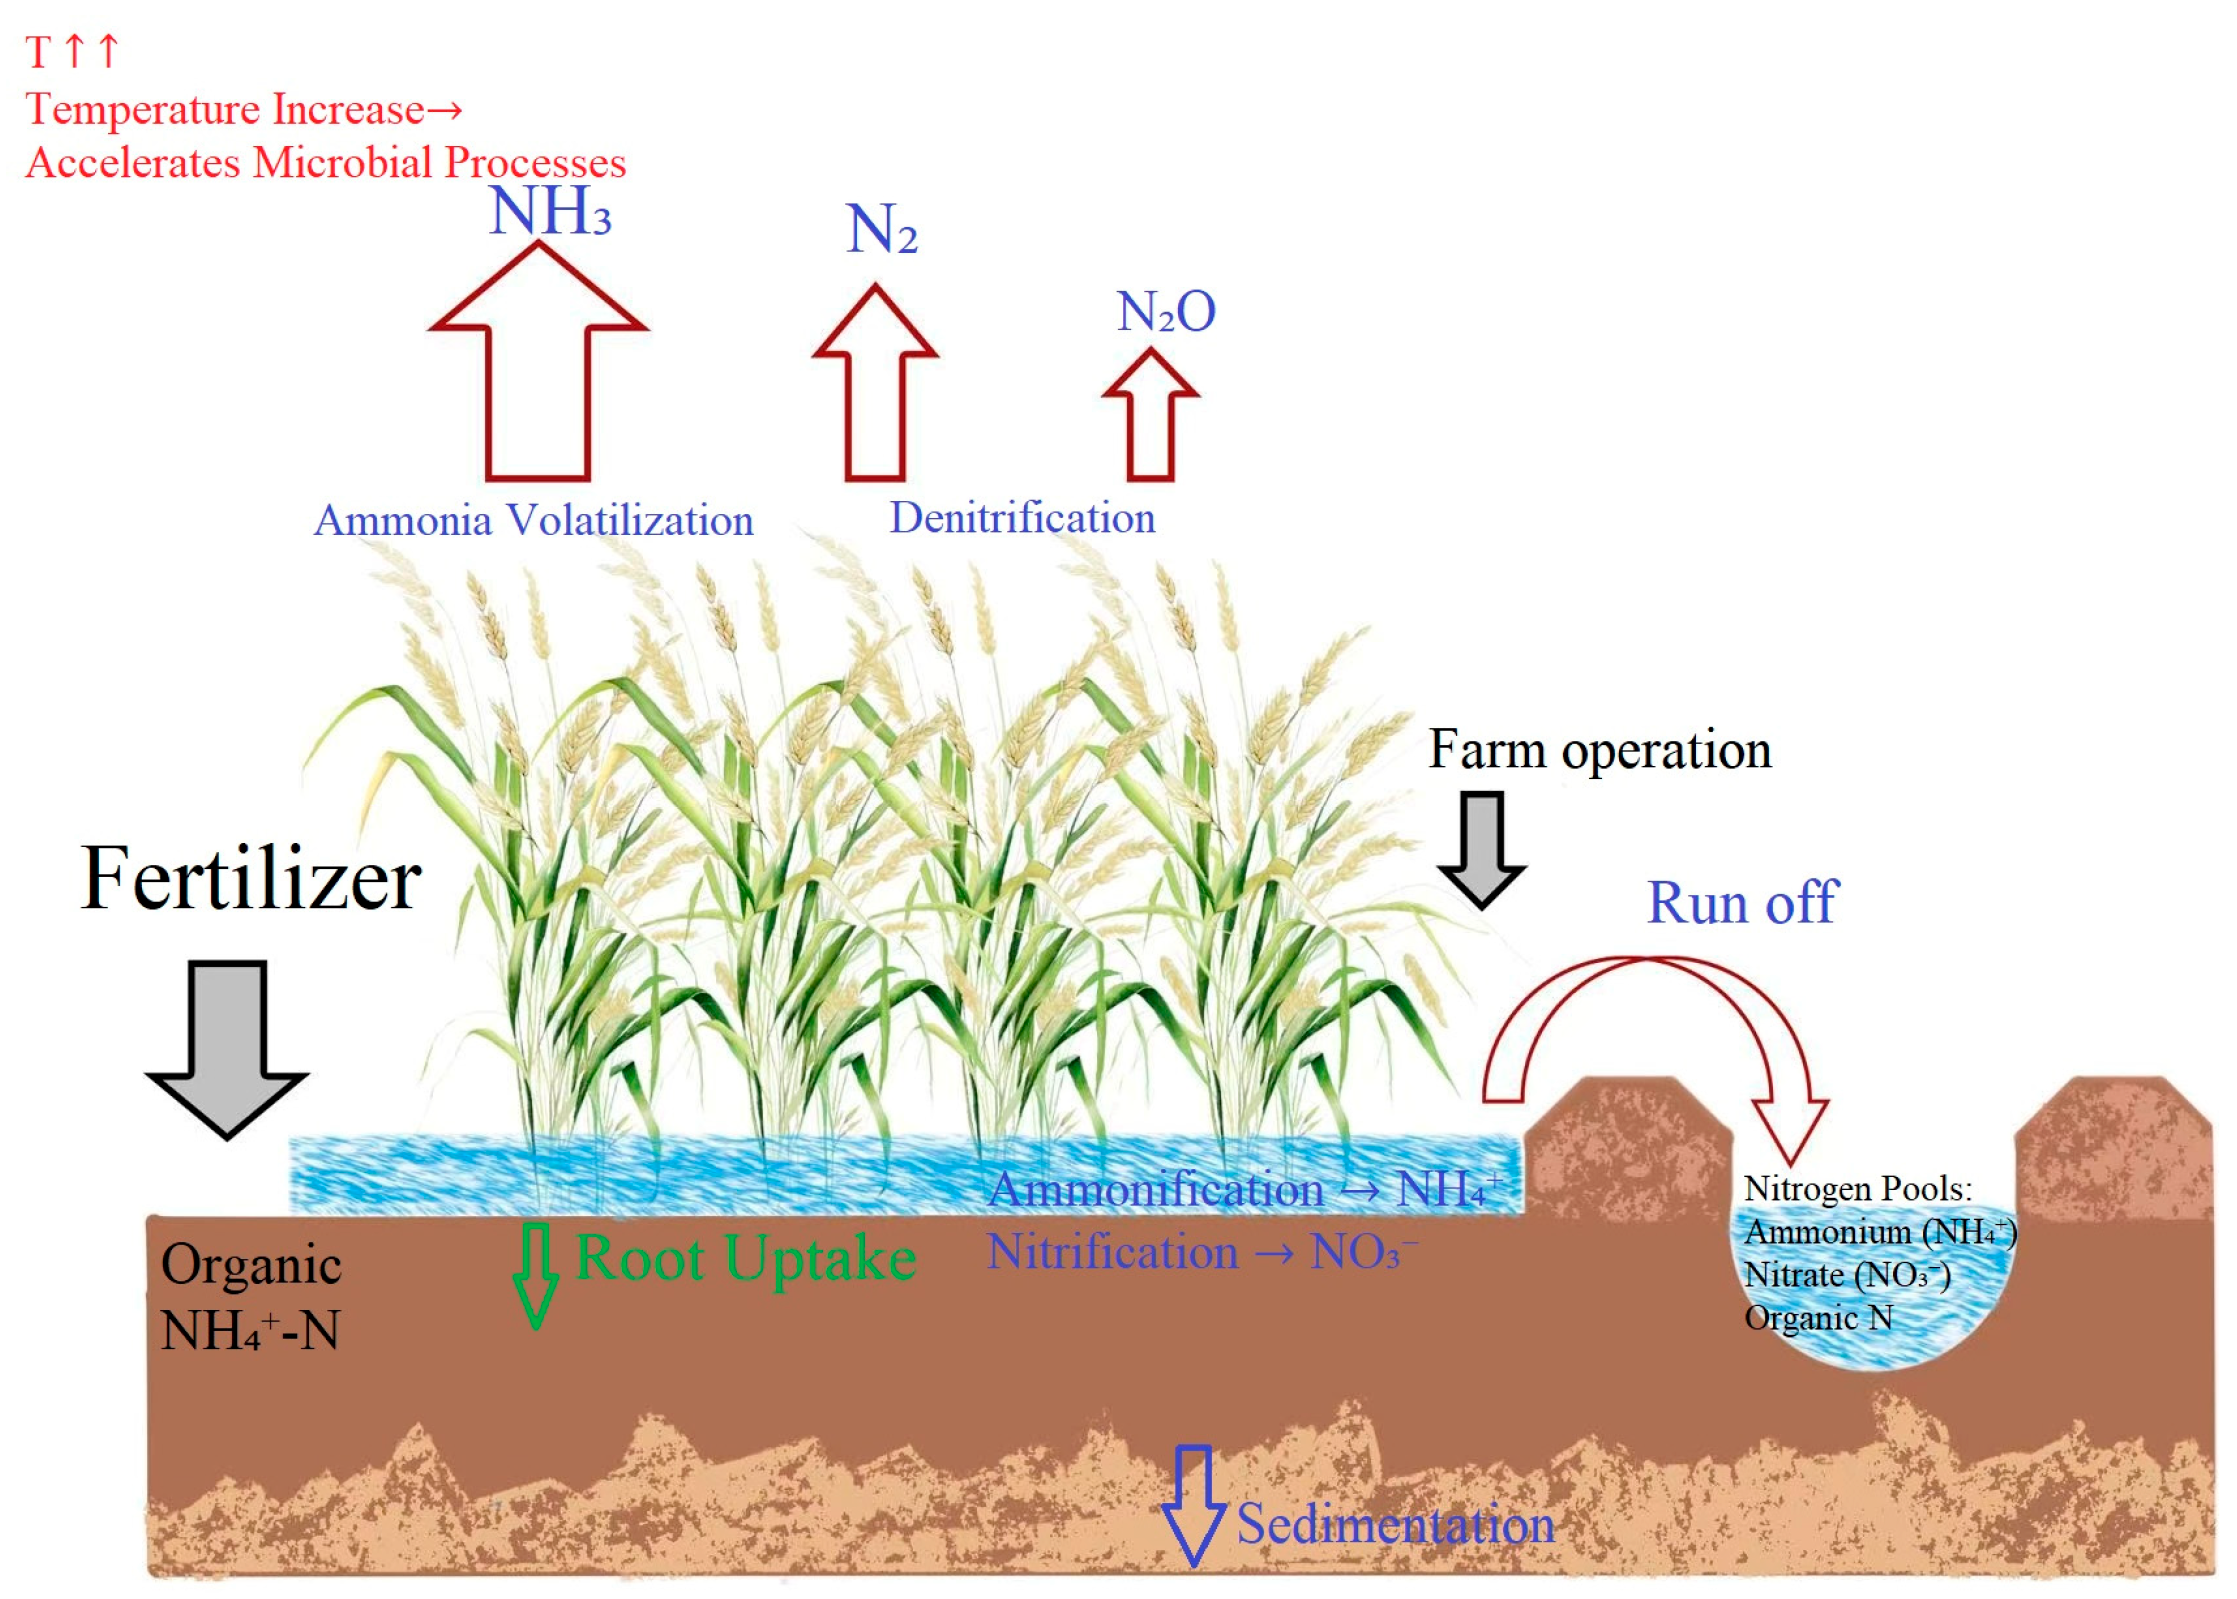
The nitrogen cycle of the polder mainly considers nitrogen volatilization, sedimentation, nitrification, mineralization, denitrification, and crop absorption. The nitrogen cycle diagram of the paddy polder is illustrated in Figure 4.
Figure 4.
Nitrogen cycle in the paddy polder.
The eco-dynamic model was developed based on the box-model theory and uses the mass balance equation as its foundation [25]. The specific equations of the model are as follows
where and represent the inflow and outflow rates, respectively, ; and represent the inflow and outflow ammonia nitrogen concentrations, respectively, ; and represent the inflow and outflow nitrate nitrogen concentrations, respectively, ; and represent the inflow and outflow organic nitrogen concentrations, respectively, ; denotes the sedimentation rate, ; denotes the denitrification rate, ; represents the plant uptake rate of nitrate nitrogen, ; represents the nitrification rate, ; represents the plant mineralization rate, ; denotes the volatilization rate, ; and denotes the ammonification rate, . These were simulated using first-order kinetic equations, as shown below [26]:
where denotes the organic nitrogen sedimentation rate, .
where denotes the organic ammonification rate constant, ; denotes the temperature correction coefficient for ammonification; and denotes the water temperature, °C.
where denotes the nitrification rate constant, ; denotes the temperature correction coefficient for nitrification; denotes the dissolved oxygen correction coefficient; and DO denotes the dissolved oxygen concentration [27], .
where denotes the denitrification rate constant, ; and denotes the temperature correction coefficient for denitrification.
where denotes the plant nitrogen demand, ; and denotes the half-saturation constant for plant uptake of ammonium nitrogen [28], .
where denotes the volatilization rate constant of NH4+, ; is the proportion of ammonium ions in ammonia nitrogen, described by an empirical formula [29], , = 2729.92.
where denotes the half-saturation constant for plant uptake of nitrate nitrogen, [30].
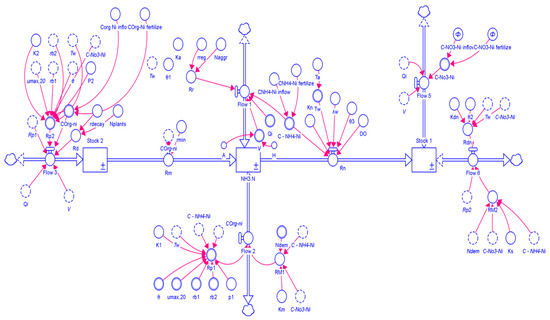
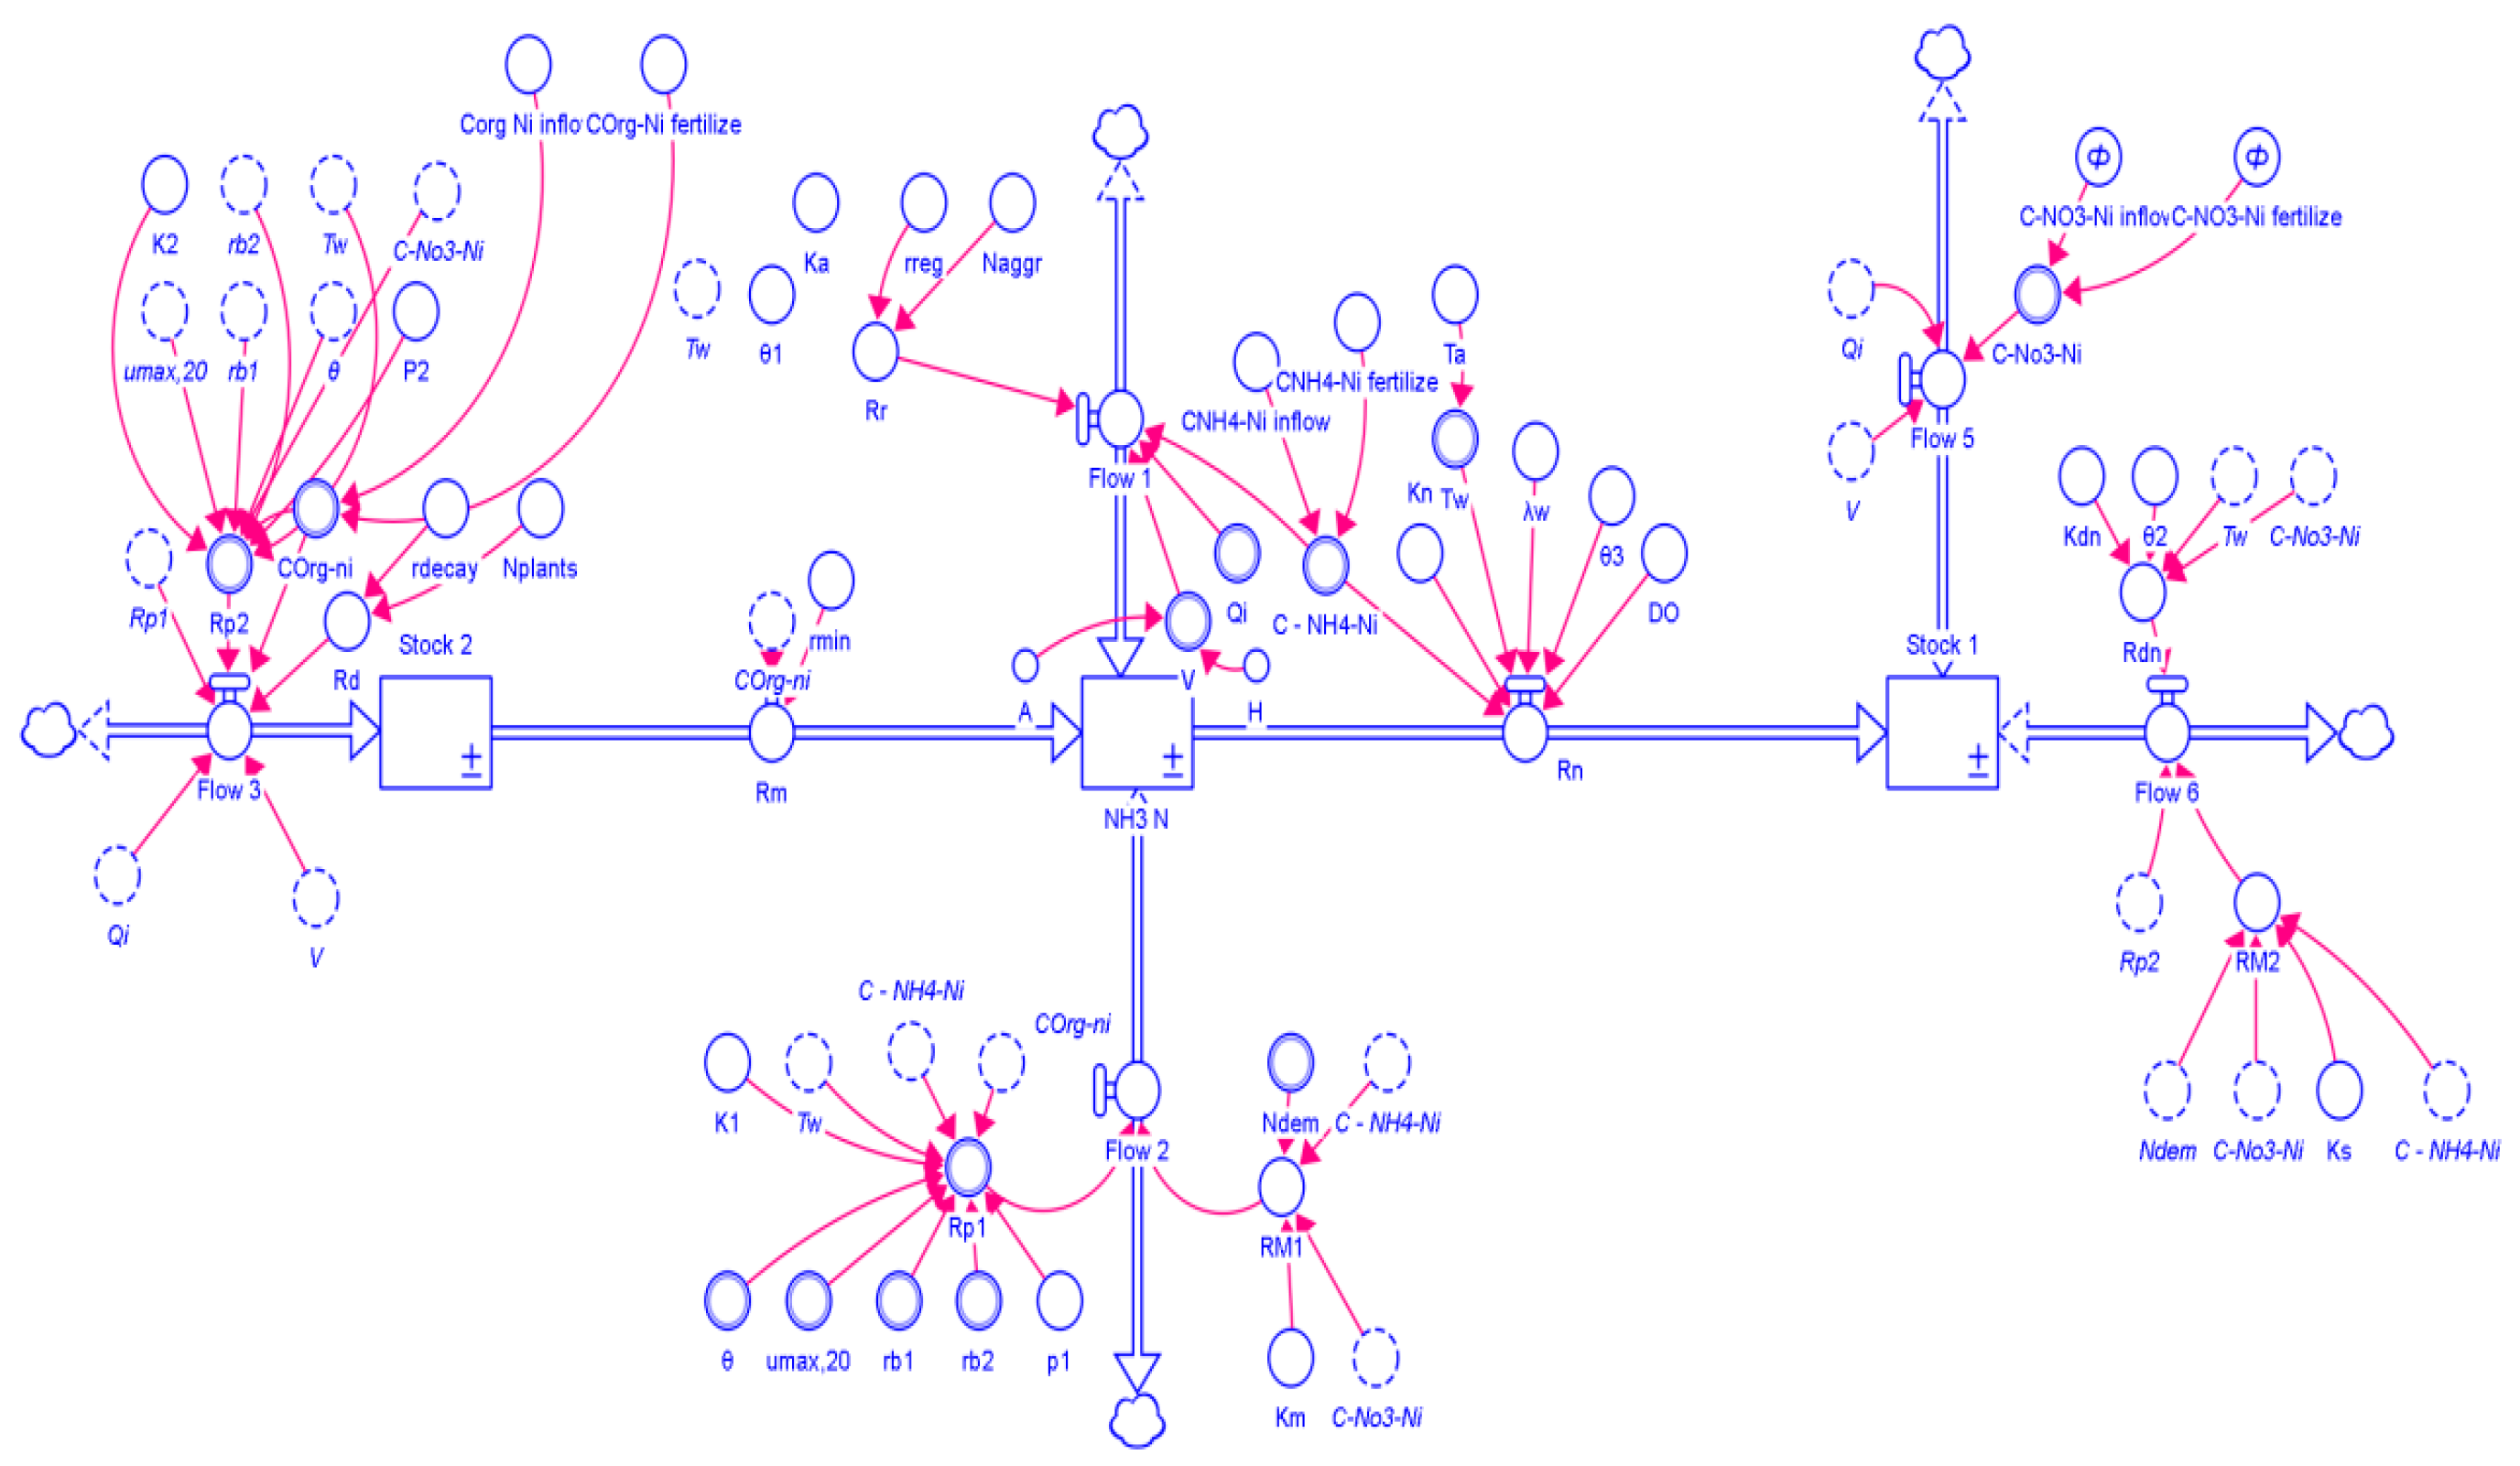
This study employed the Stella Architect dynamic modeling software to implement the conceptual model, execute calculations, adjust parameters, and conduct simulations. This ultimately produced a unified eco-dynamic model. The logical structure of this study is illustrated in Figure 5.
Figure 5.
Stella Architect structure of the model.
2.2.2. Model State Variables and Parameter Inputs
The model stimulated three major forms of nitrogen indicators: ammonia nitrogen, organic nitrogen, and nitrate nitrogen. The model input data and their sources are listed in Table 1.
Table 1.
Model input variables and their data sources.
During the simulation of nitrogen concentration cycling, the parameter value ranges of the organic nitrogen ammonification rate constant, nitrification rate constant, and denitrification rate constant were uncertain. Therefore, the theoretical outlet concentrations of each nitrogen form varied accordingly. To quantify the influence of parameter variation on nitrogen levels, this study performed an uncertainty analysis of the model parameters. On this basis, the parameter values were subsequently optimized and determined (Table 2).
Table 2.
Model parameter optimization.
2.2.3. Model Calibration and Validation
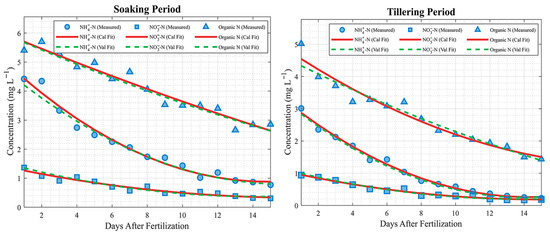
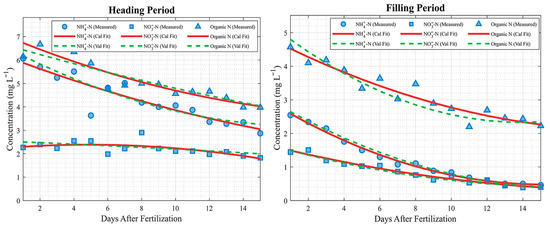
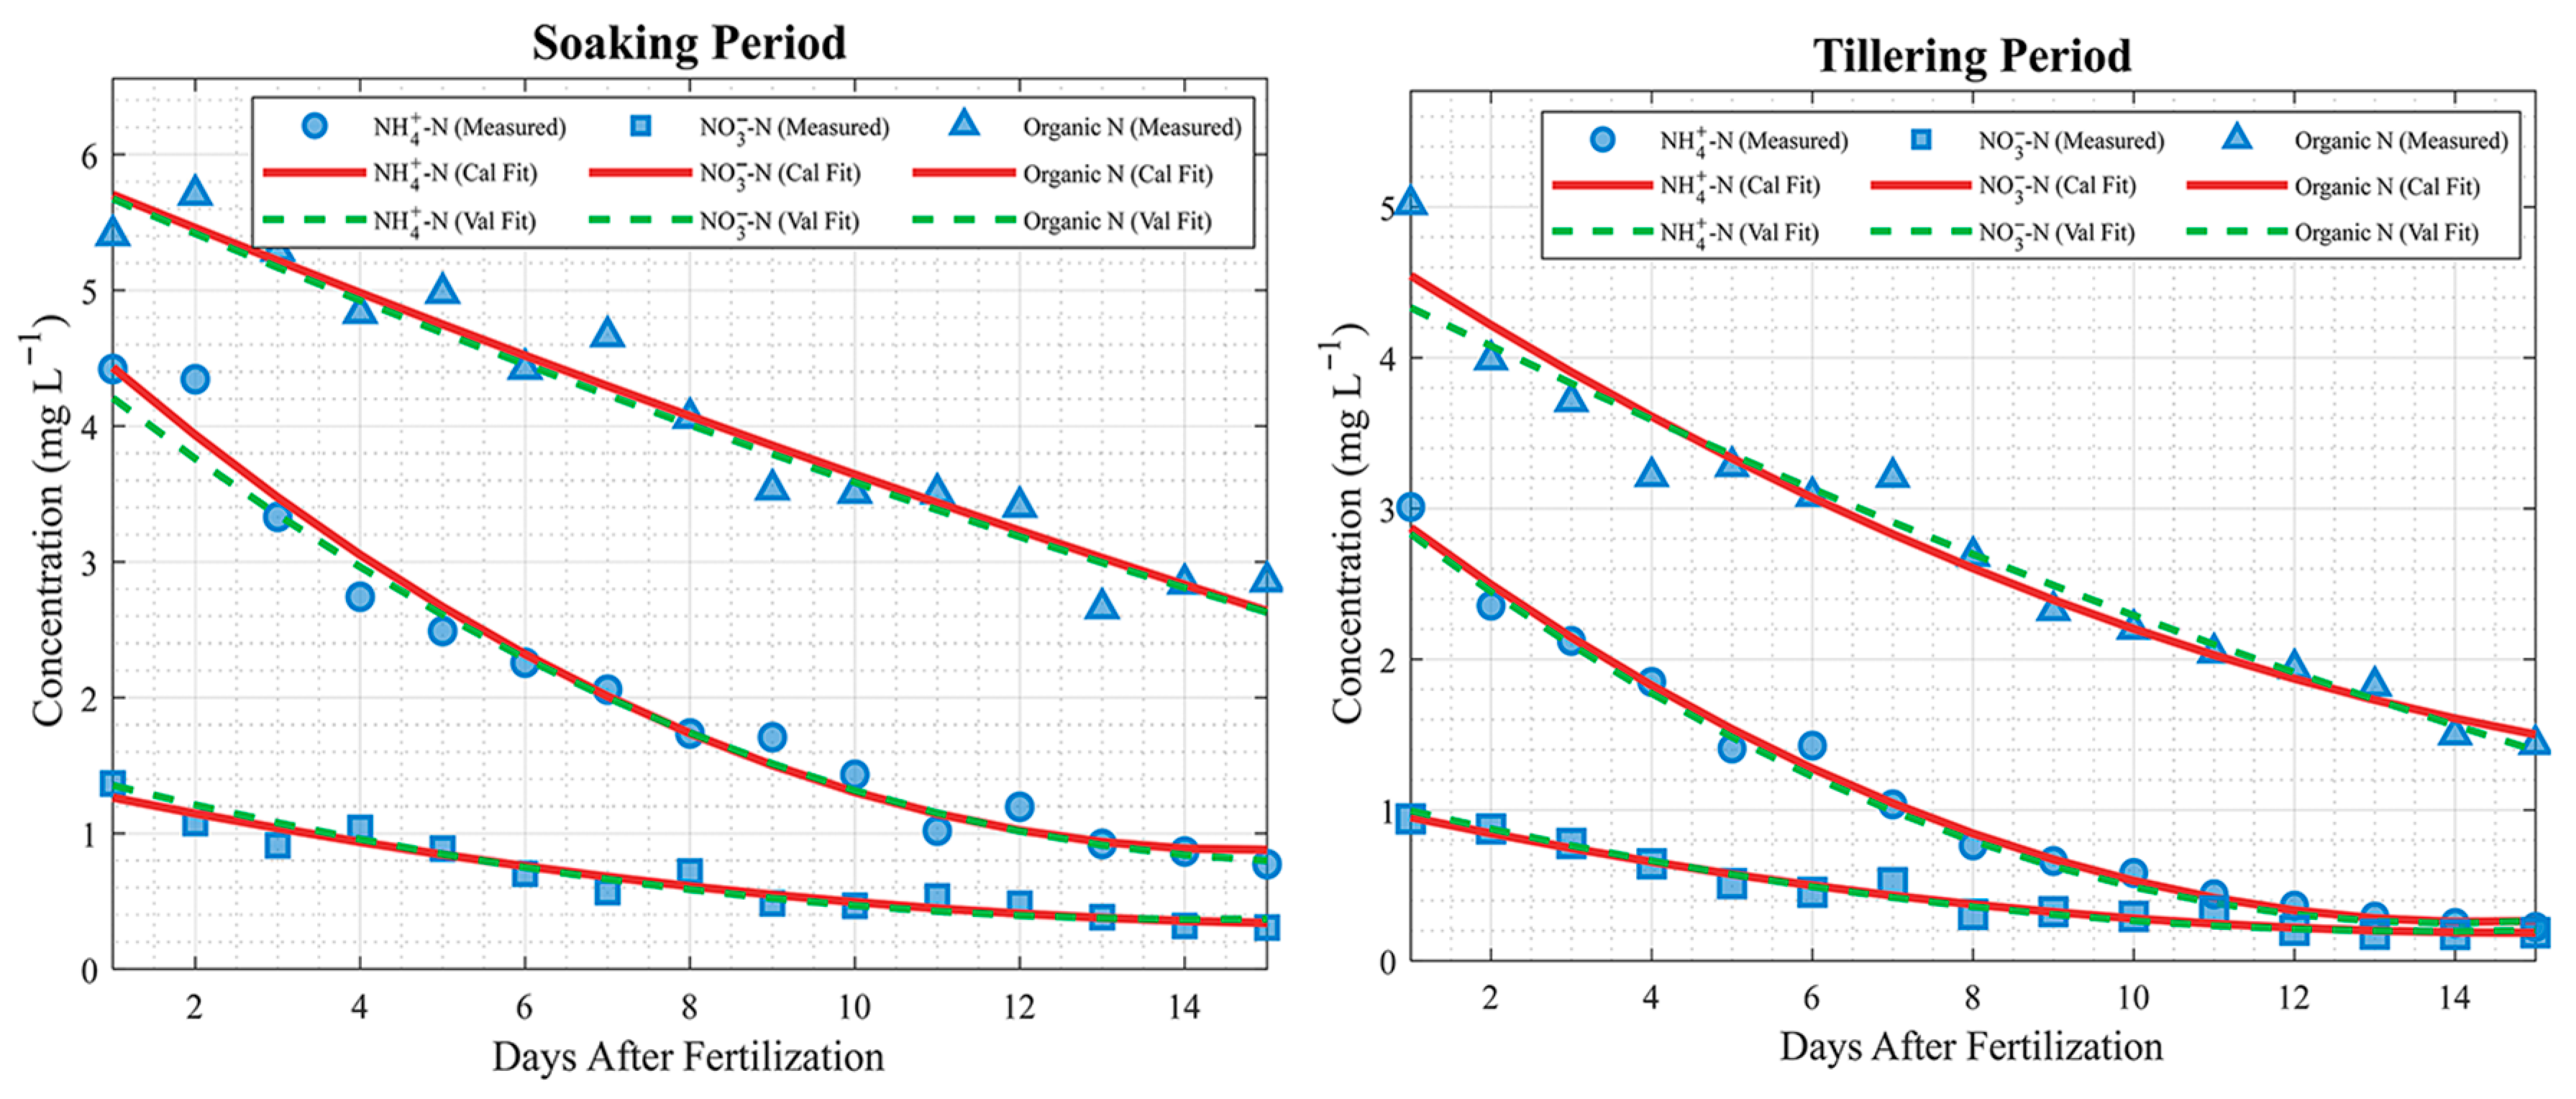
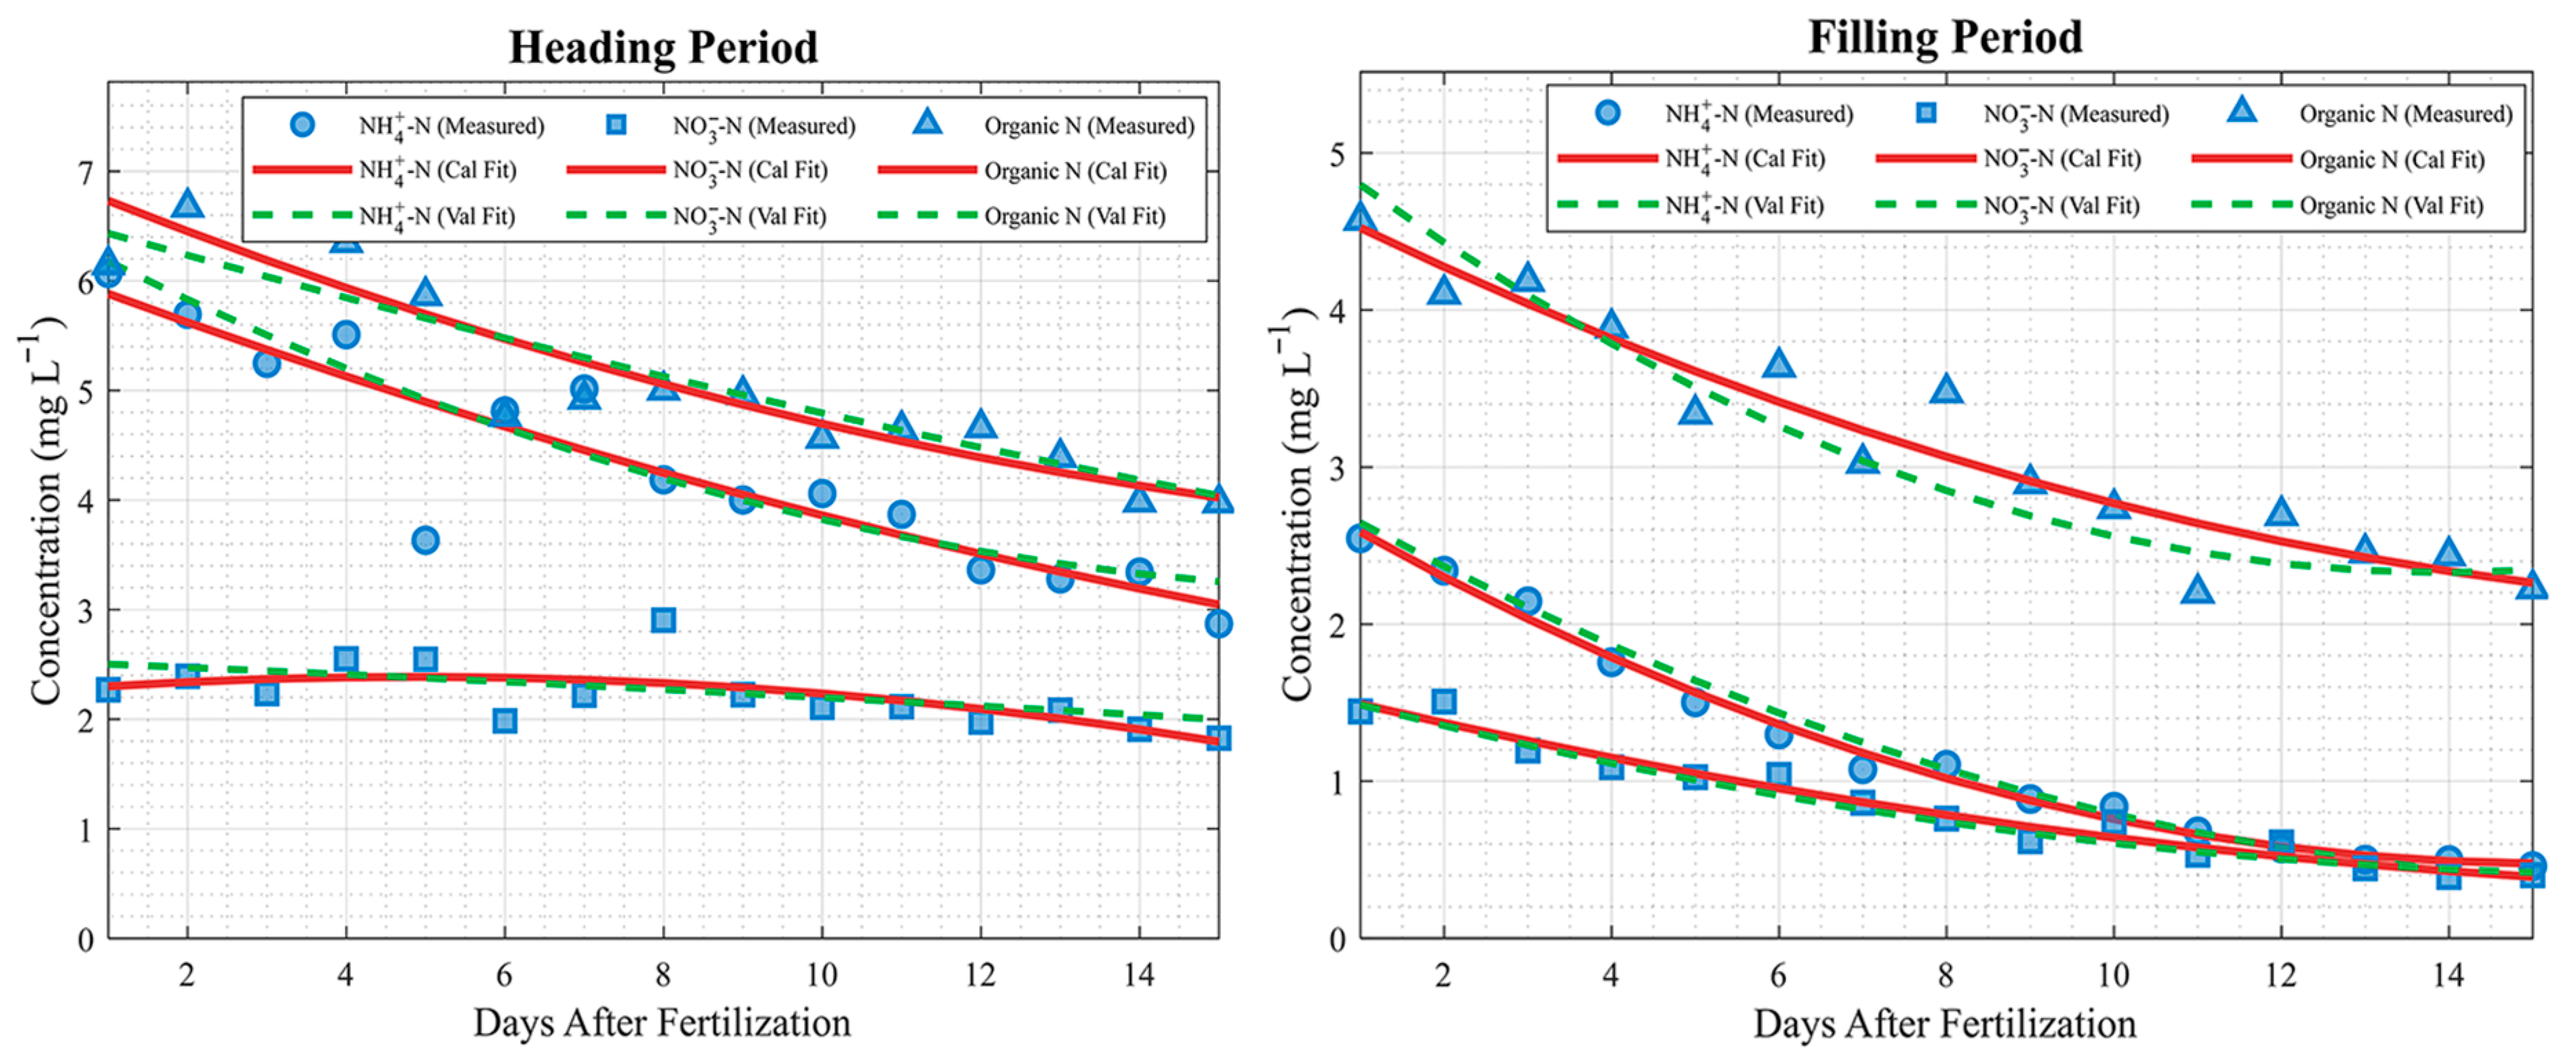
By adjusting model parameters to minimize the error between model predictions and field monitoring data, the model was calibrated using synchronous water quantity and water quality data collected during the rice growing season in the Hongze Lake polder area from May to October 2024. Model validation was performed using corresponding monitoring data from May to October 2023. The Nash-Sutcliffe efficiency coefficient (NSE), coefficient of determination (R2), and root mean square error (RMSE) were employed as metrics to evaluate the calibration and validation outcomes [32]. The results of model parameter calibration are presented in Table 2. Comparisons between simulated and measured values for different nitrogen forms are shown in Figure 6. The simulated trends of ammonium nitrogen, nitrate nitrogen, and organic nitrogen generally align with the observed data, indicating that the overall simulation captures the characteristic variations in each nitrogen species. As shown in Table 3, even when accounting for real measurement errors and process fluctuations—such as denitrification variability during the heading stage and rainfall-induced outliers—the model exhibits robust performance. NSE values exceeded 0.73 for all growth stages and nitrogen forms, with 10 out of 12 cases achieving NSE > 0.85. During the validation period, NSE values were only 0.02–0.04 lower than the period-average values, demonstrating the model’s strong generalization capability. Specifically, the best fits were observed for ammonium nitrogen (NSE = 0.915/0.896) and organic nitrogen (NSE = 0.967/0.949) during the flooded field stage. In contrast, the fitting accuracy was relatively lower during the heading stage (NSE = 0.78–0.83), due to system closure and conflicting fertilization practices, which objectively reflects the actual management optimization challenges encountered in this period.
Figure 6.
Simulated and measured values of ammonia nitrogen, nitrate nitrogen and organic nitrogen.
Table 3.
Model Error Analysis.
2.3. Optimization Simulation of Water Surface Ratio and Inflow Rate for the Maximum Pollution Removal Rate of the Paddy Polder
2.3.1. Model Establishment
The purification capacity of the paddy-polder-constructed secondary wetland system for nitrogen has an upper bound. Therefore, its pollution load removal should reach the maximum capability, ensuring the highest removal efficiency of the paddy polder under conditions where the outlet water quality remains optimal. Stella Architect V1.95 software does not possess the flexibility and computational capability of programming languages. Hence, based on the nitrogen cycle eco-dynamic model constructed with Stella, a nonlinear programming model was developed using the maximum pollution removal rate after fertilization of each growth period as the objective function, with the pond water surface ratio , the channel water surface ratio , and the inflow rate as the decision variables.
where represent the nitrogen pollution removal rates during the soaking period, tillering period, heading period, and grain-filling period, respectively, %; it represents maximum relative reduction from input. denotes the nitrogen input concentration after fertilization, and represent the minimum loads of organic nitrogen pollution, nitrate nitrogen pollution, and ammonium nitrogen pollution related to the pond water surface ratio , channel water surface ratio , and inflow rate ,. Their expressions are as follows:
where are the water volumes of the paddy polder and the pond, respectively, which are obtained by multiplying their water surface ratios by their water storage depths, ; and , , are the concentrations of each form of nitrogen after fertilization during the drainage period of the paddy polder, .
2.3.2. Constraint Conditions
- (1)
- Water surface ratio constraints
The water surface ratio of the polder area is influenced by the local natural environment, land use planning, and functional tasks assigned to the region. According to the Jiangsu Province Water Conservancy Development Plan, the current channel water surface ratio in polders is generally within 2% to 4%, whereas the pond water surface ratio typically falls between 16% and 20% [33]. Therefore, the feasible ranges are,
where and are the water surface ratios of the pond system and the channel system, respectively.
- (2)
- Inflow rate constraints
The inflow rate is more than a simple measure of water volume. It functions as a master switch that governs the interactions among water, fertilizer, and soil in the rice-field system. It can directly determine both the depth and renewal frequency of the field water layer and further regulate the driving forces that control pollutant migration, particularly the movement of dissolved nitrate nitrogen during surface drainage. A properly regulated inflow rate enhances denitrification, allowing nitrate nitrogen to be converted into inert nitrogen gas, and works synergistically with the pond and channel subsystems of the polder. This coordination ensures that the water body maintains sufficient hydraulic retention time for natural purification processes, such as sedimentation, adsorption, and biodegradation, to be fully effective. The inflow rate for each rice growth stage was calculated as follows: [34]
where , , , and represent the inflow rates during the soaking period, tillering period, heading period, and grain-filling period, respectively, ; is the saturated soil water amount; is the target water layer depth, ; is the number of soaking days, ; denotes the polder area, ; denotes the crop water demand, ; is the field seepage loss, is the effective precipitation, ; denotes the current water layer depth, ; and is the water consumption of the stage, .
In this study, the intake-flow records from the local agricultural management station were adopted to determine the threshold ranges of inflow rates for paddy polders during different rice growth periods. The specific constraint values are listed in Table 4.
Table 4.
Inflow rate constraints for each growth period.
3. Results
3.1. Uncertainty Analysis of the Nitrogen Eco-Dynamic Model of the Paddy Polder
To evaluate the impact of variations in the input parameters on model stability, an uncertainty analysis was performed on the paddy polder eco-dynamic model. The organic ammonification rate constant, nitrification rate constant, and denitrification rate constant were selected as the input parameters, each following a log-normal distribution. The concentrations or loads of the three nitrogen forms at the polder outlet were applied as output parameters. The value ranges were determined based on the relevant literature, and the corresponding parameter ranges are listed in Table 5. A Monte Carlo simulation was applied, with 10,000 samples generated within the assigned distribution ranges [35], yielding combinations of input parameters.
Table 5.
Value ranges of model uncertainty parameters.
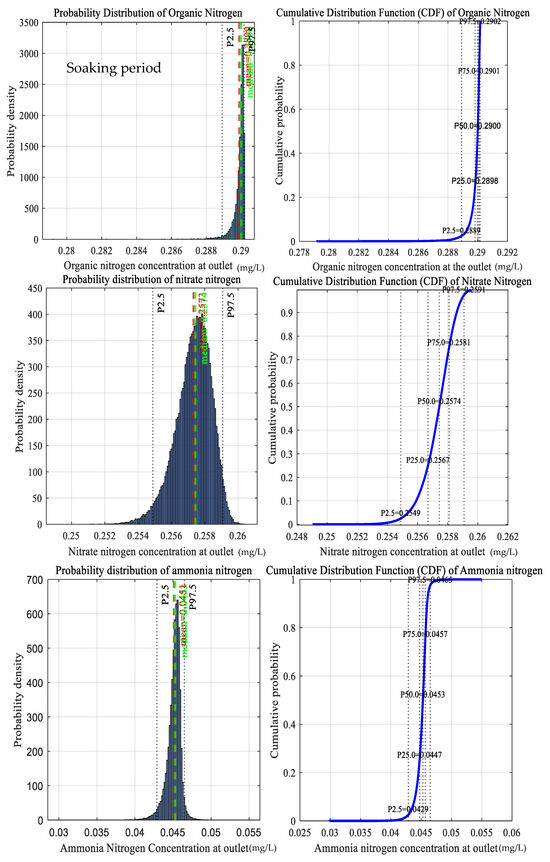
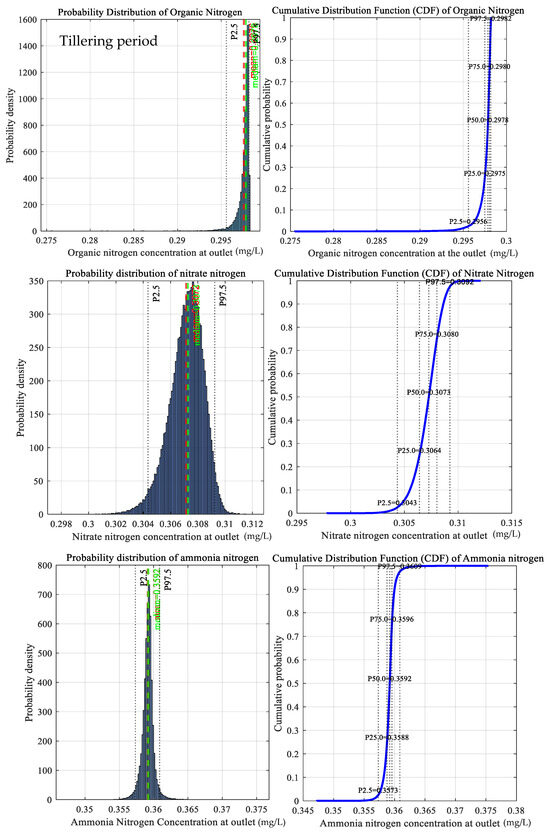
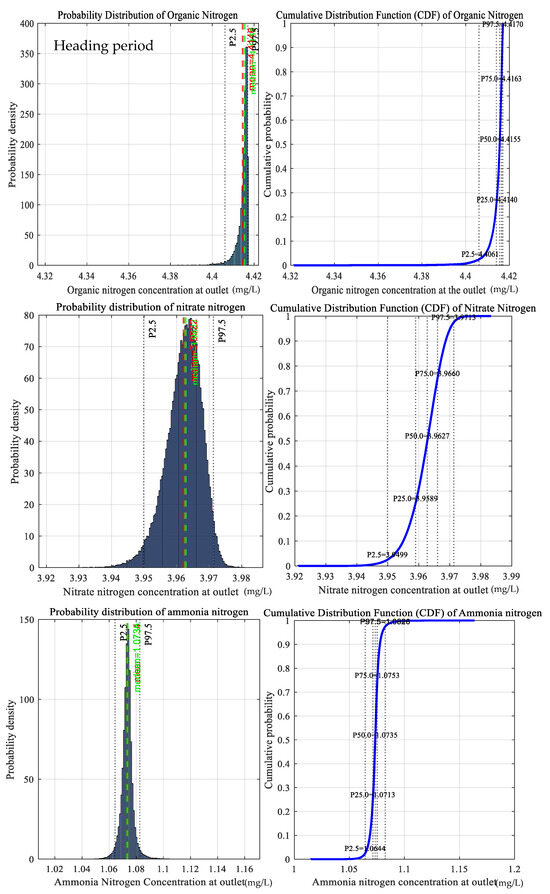
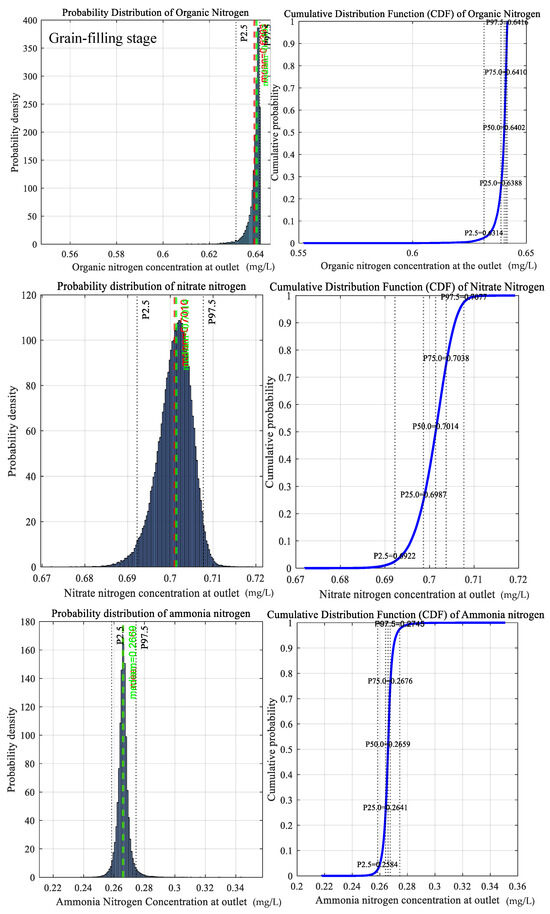
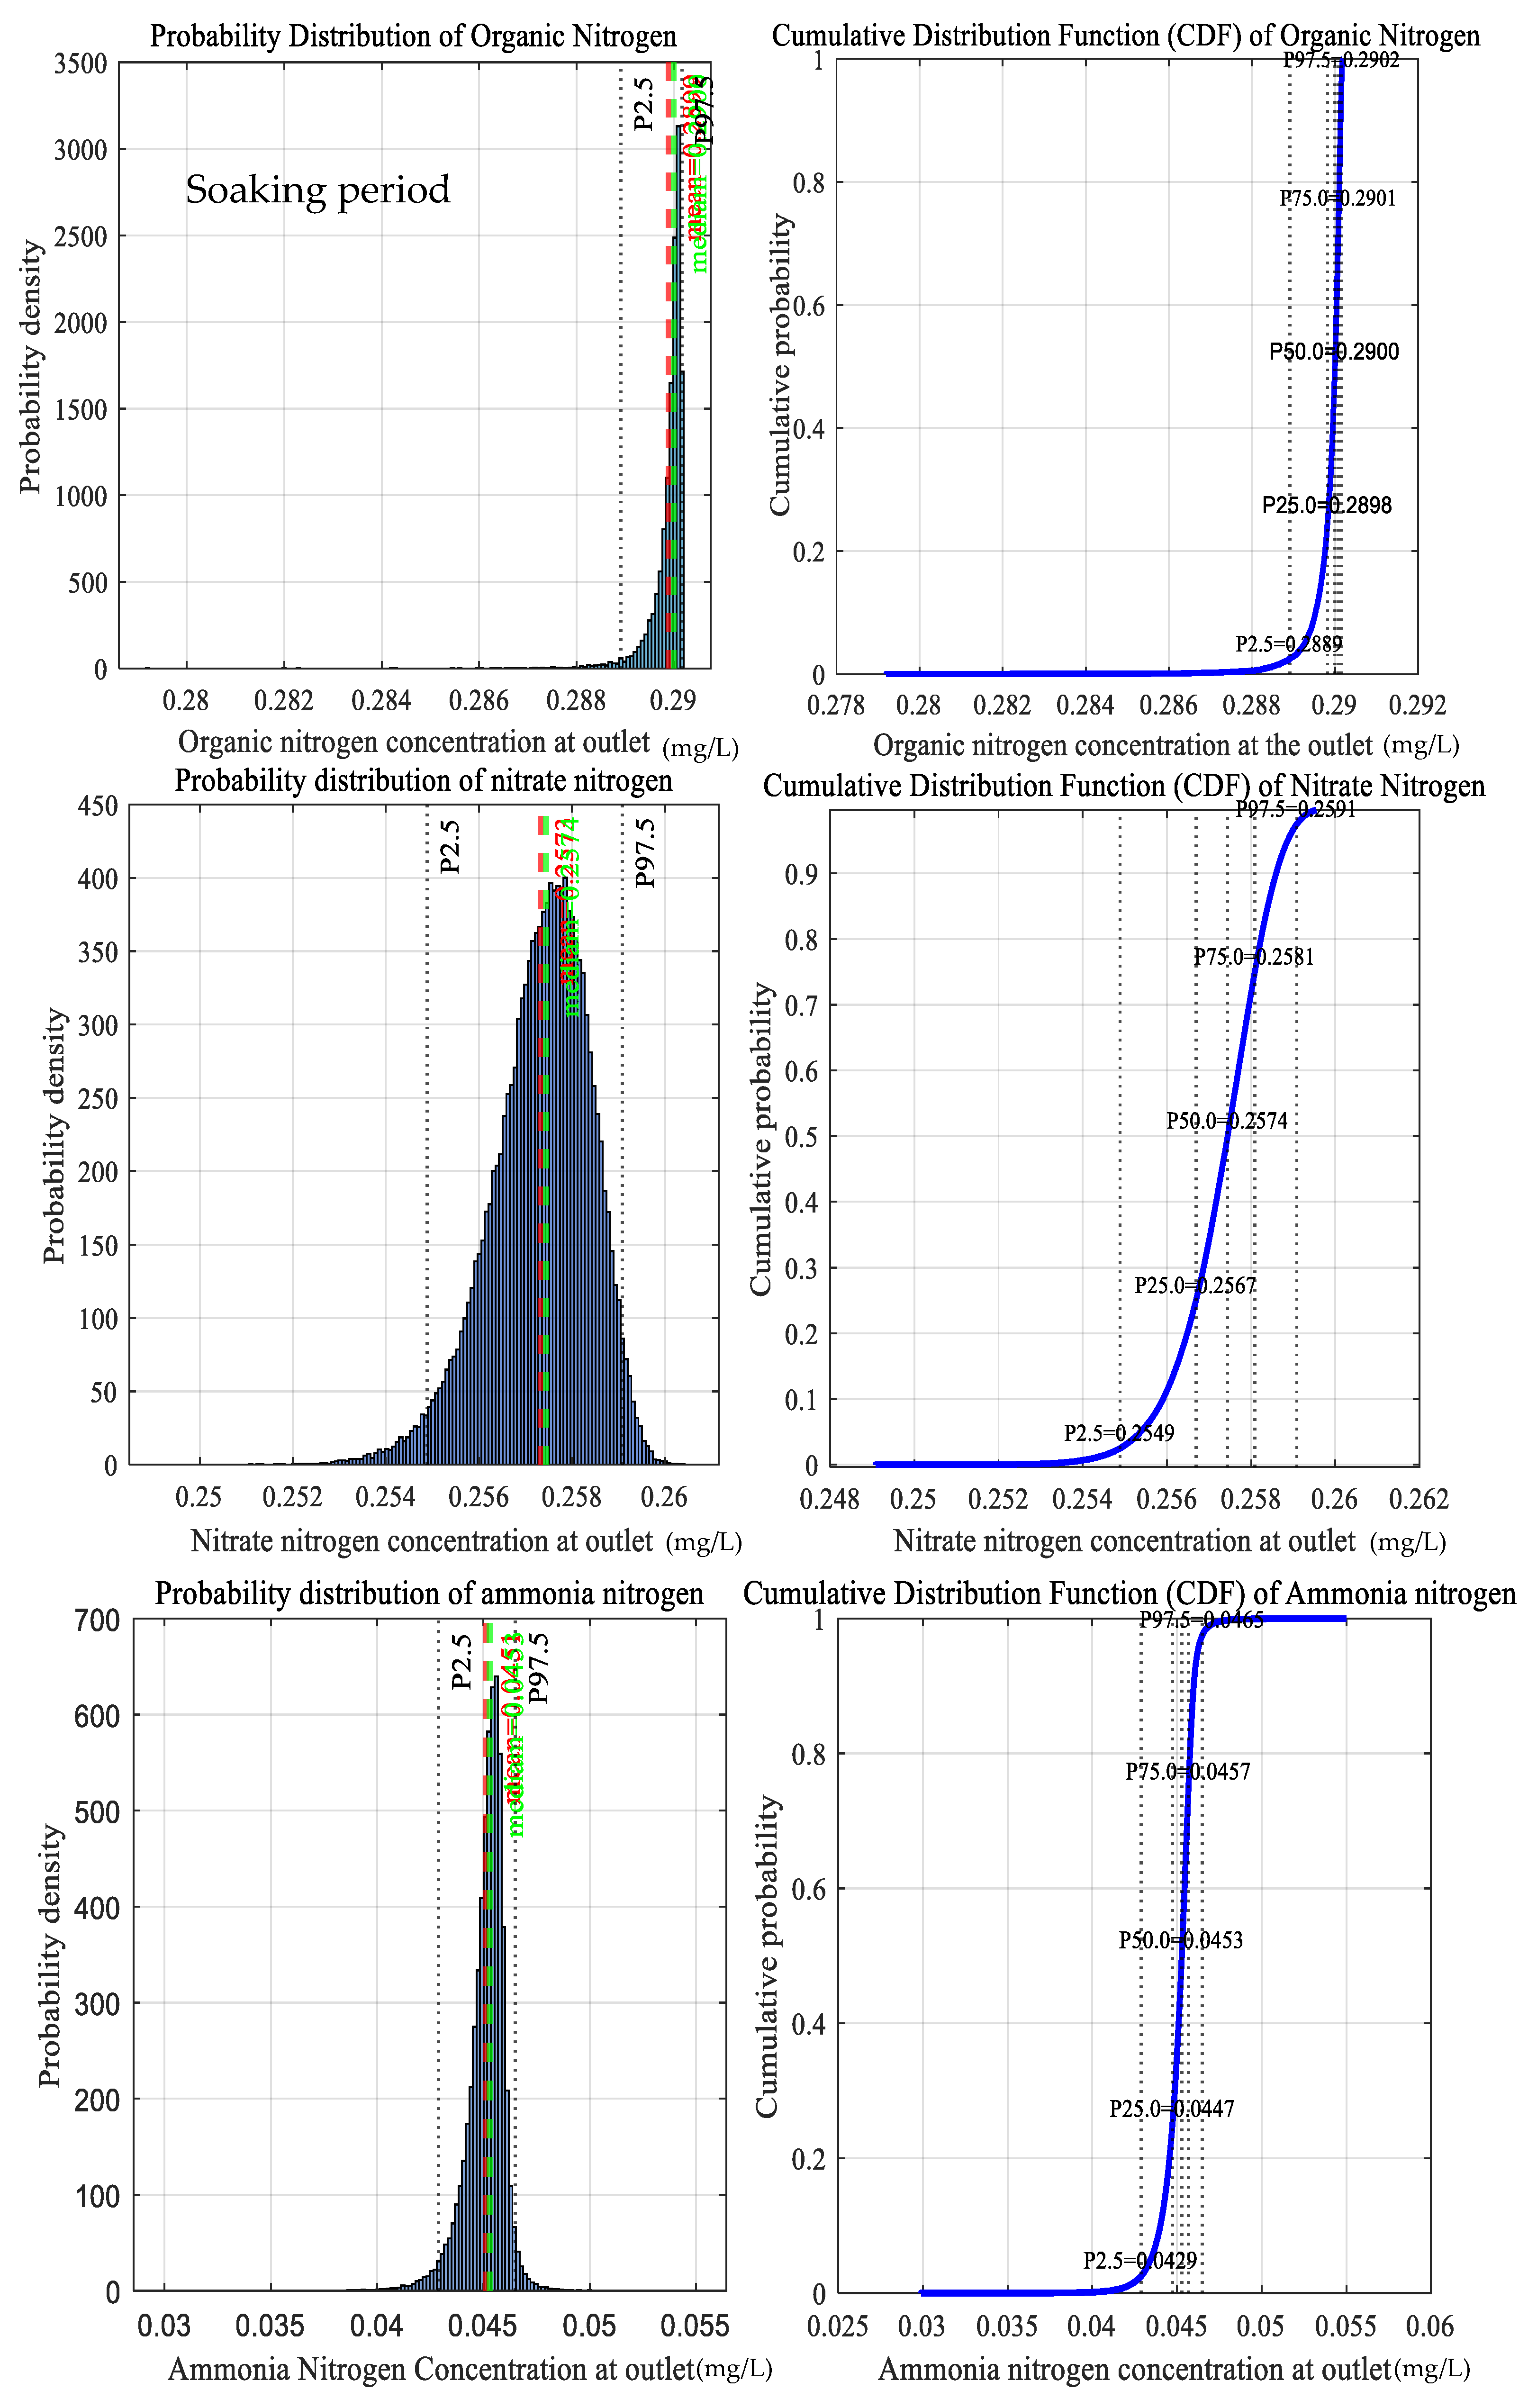
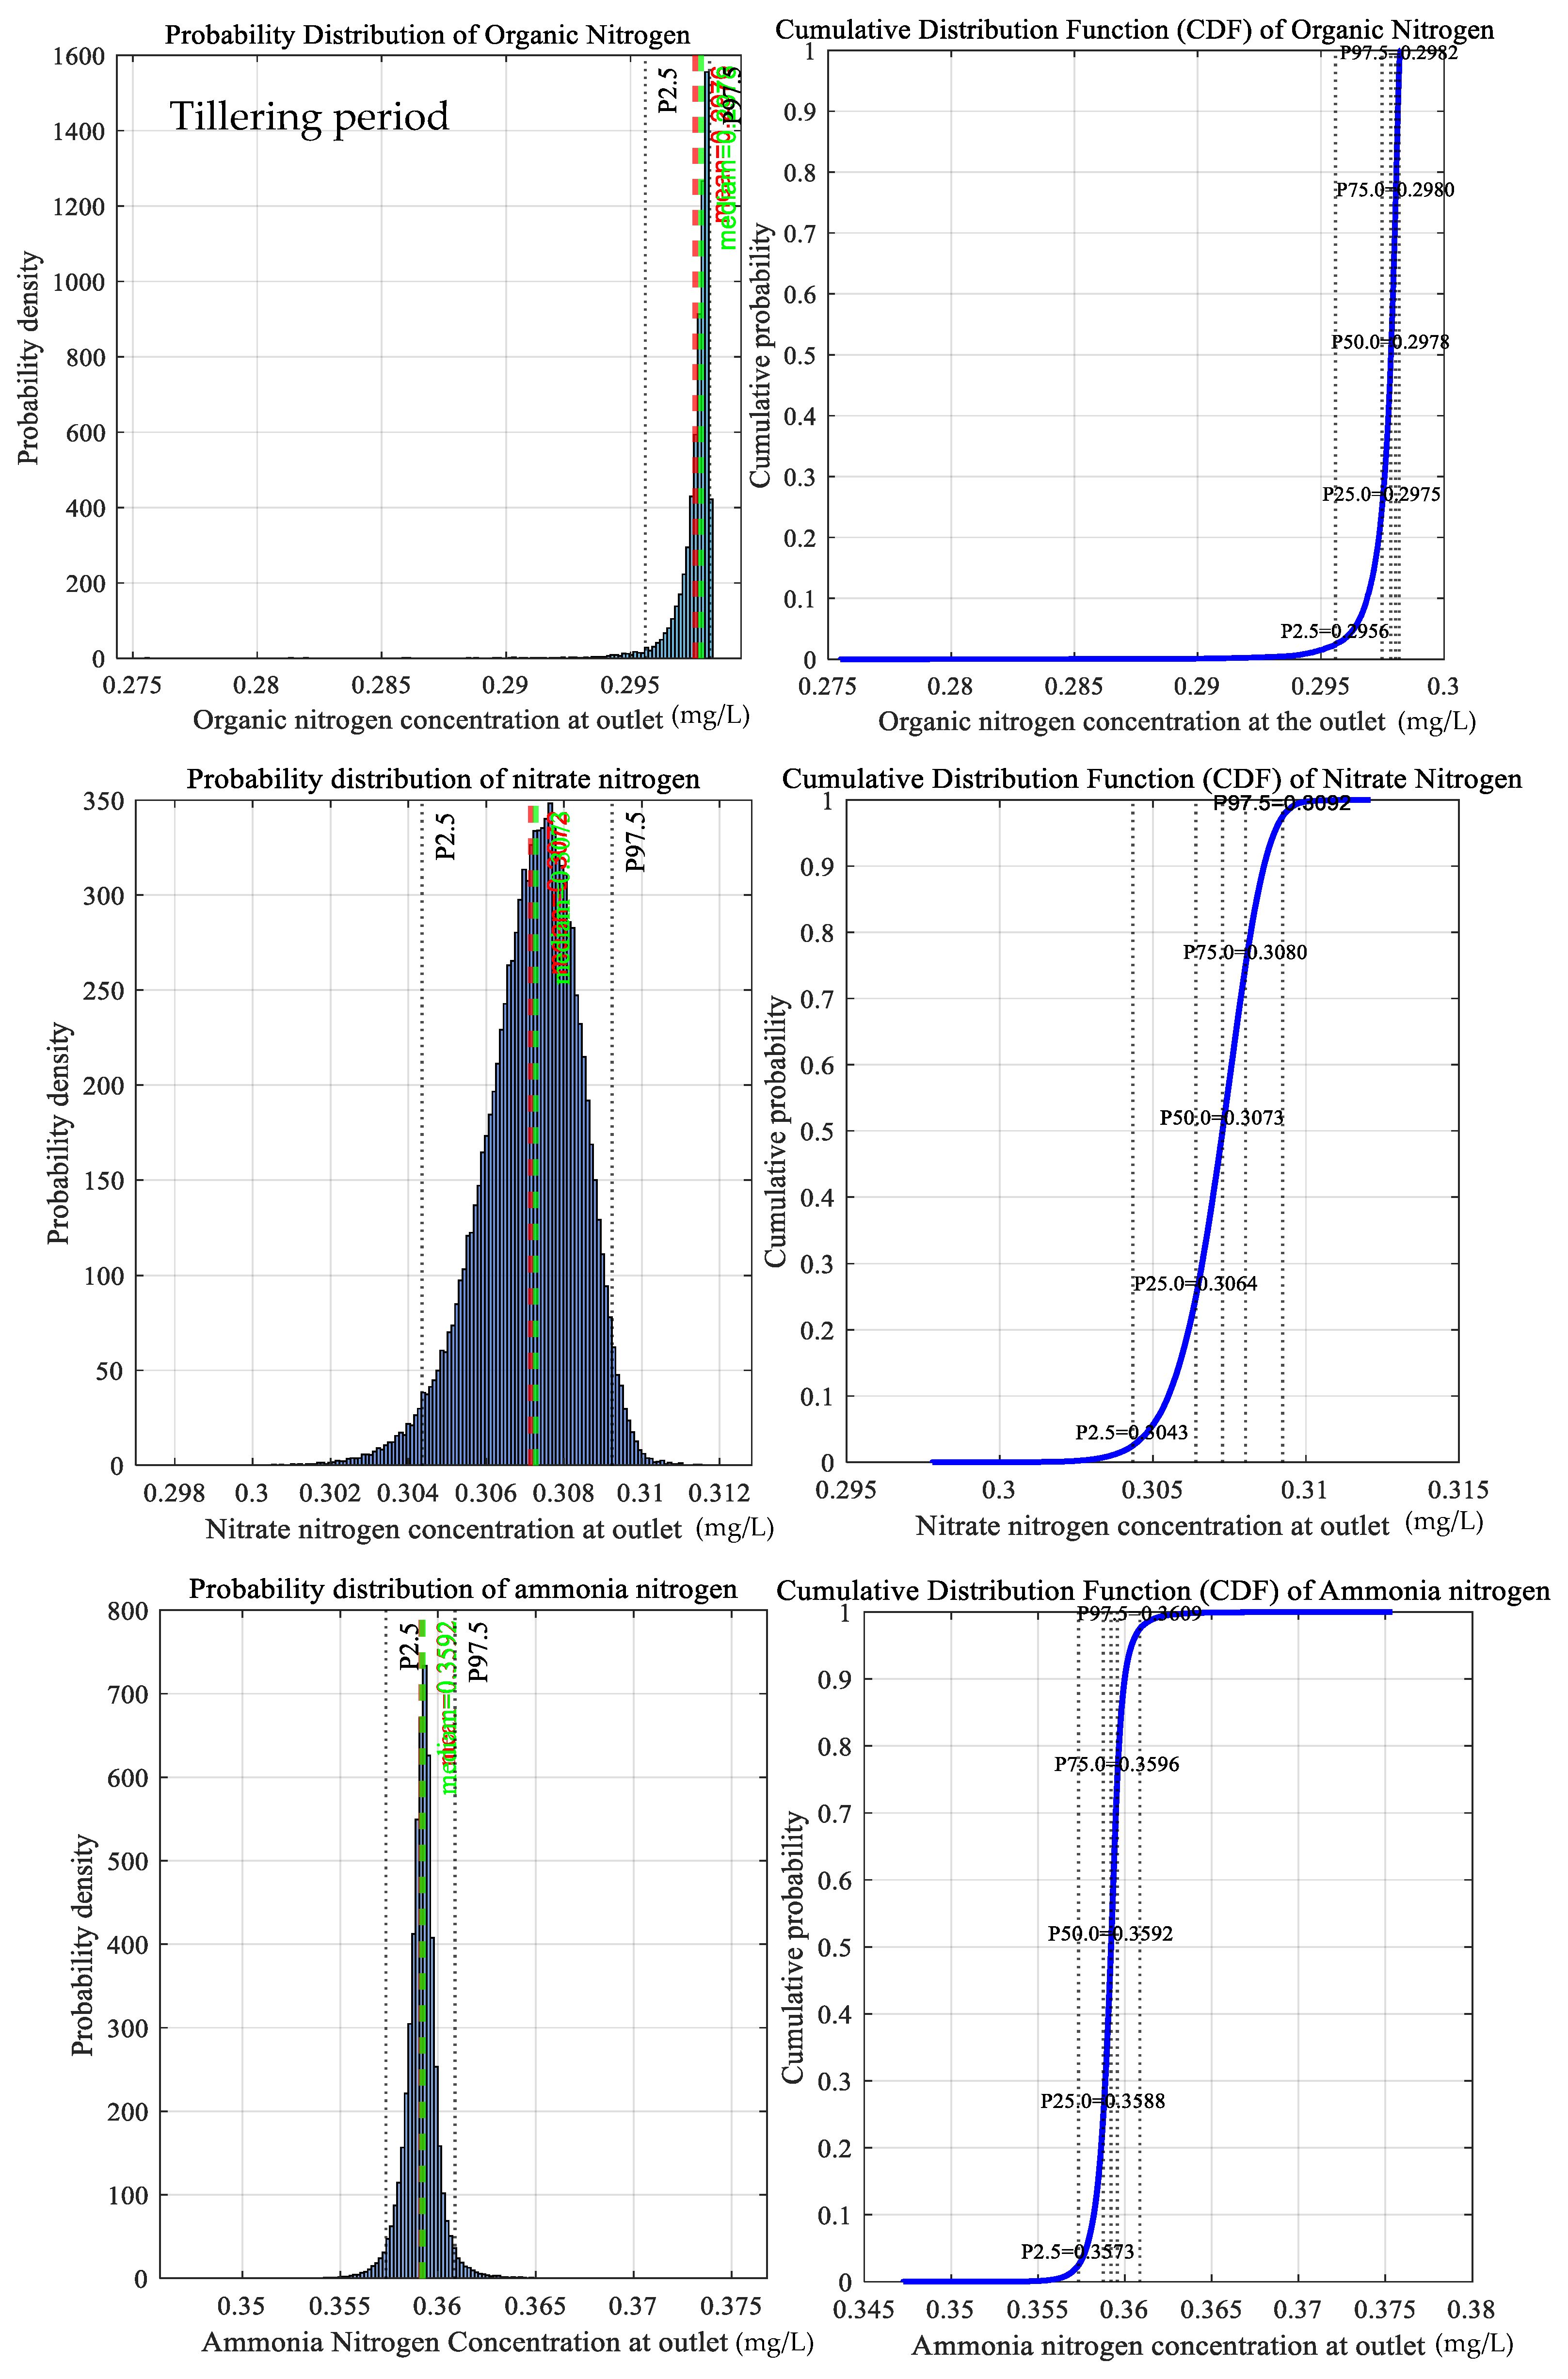
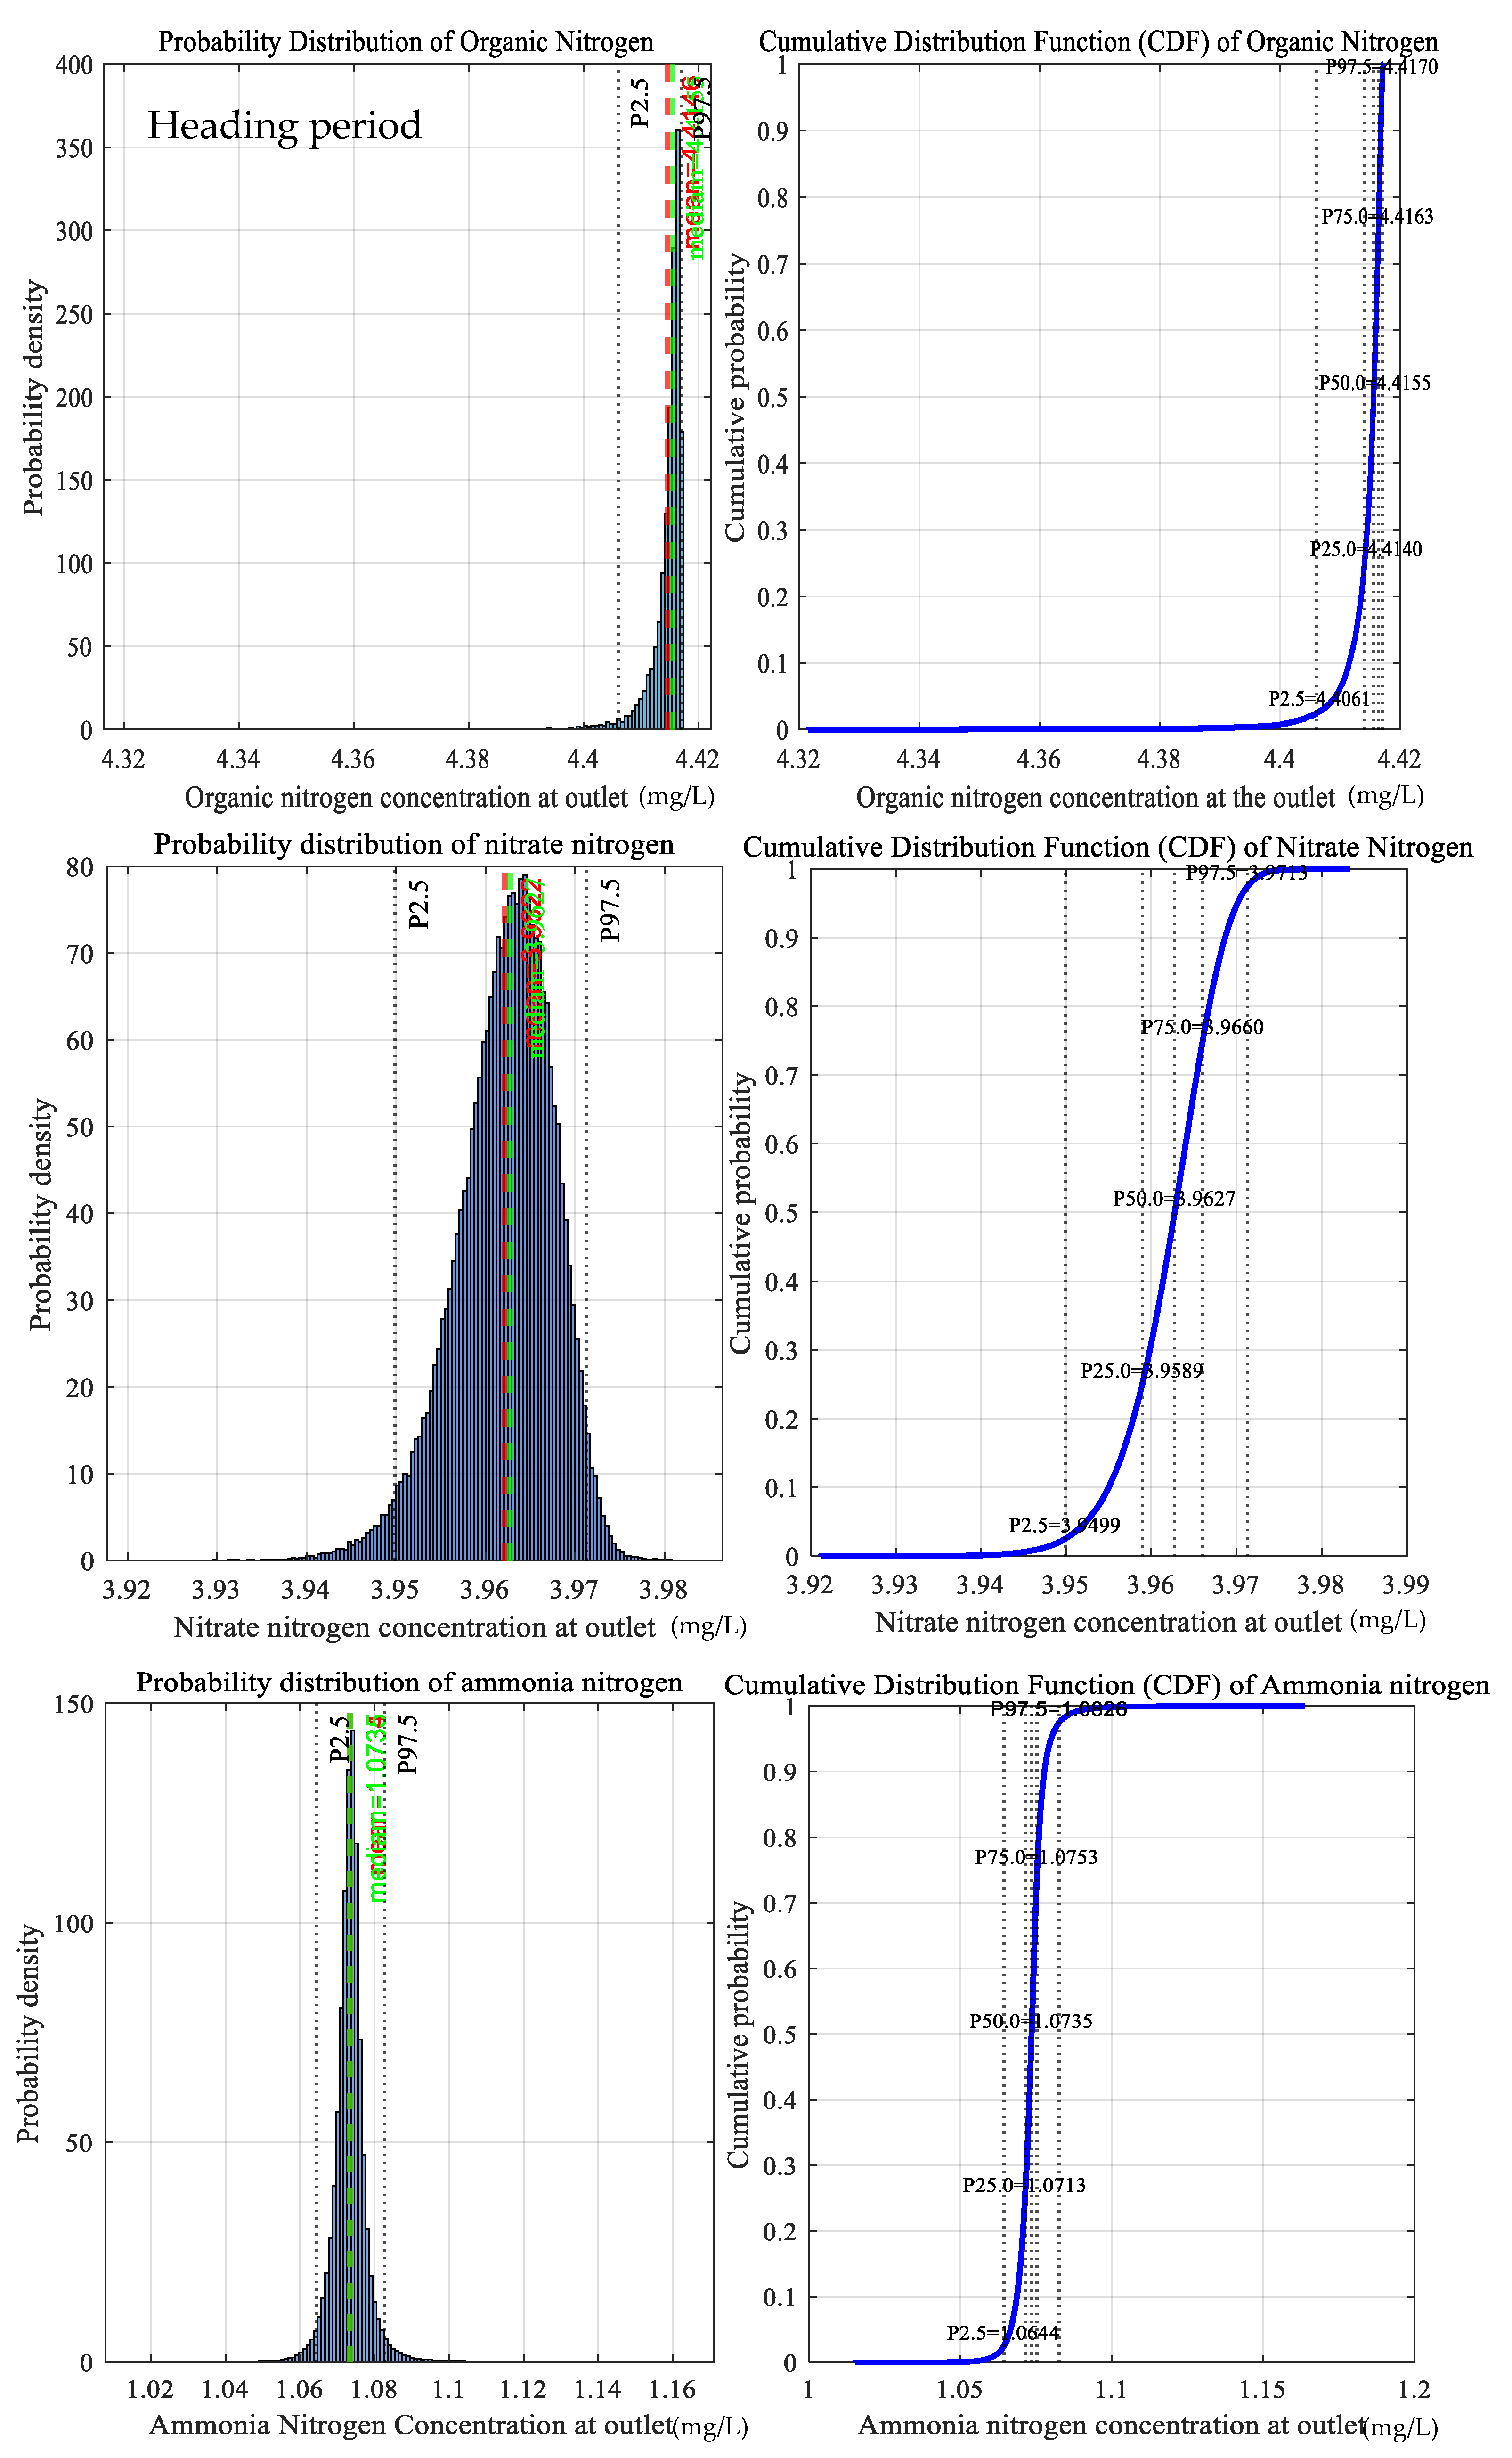
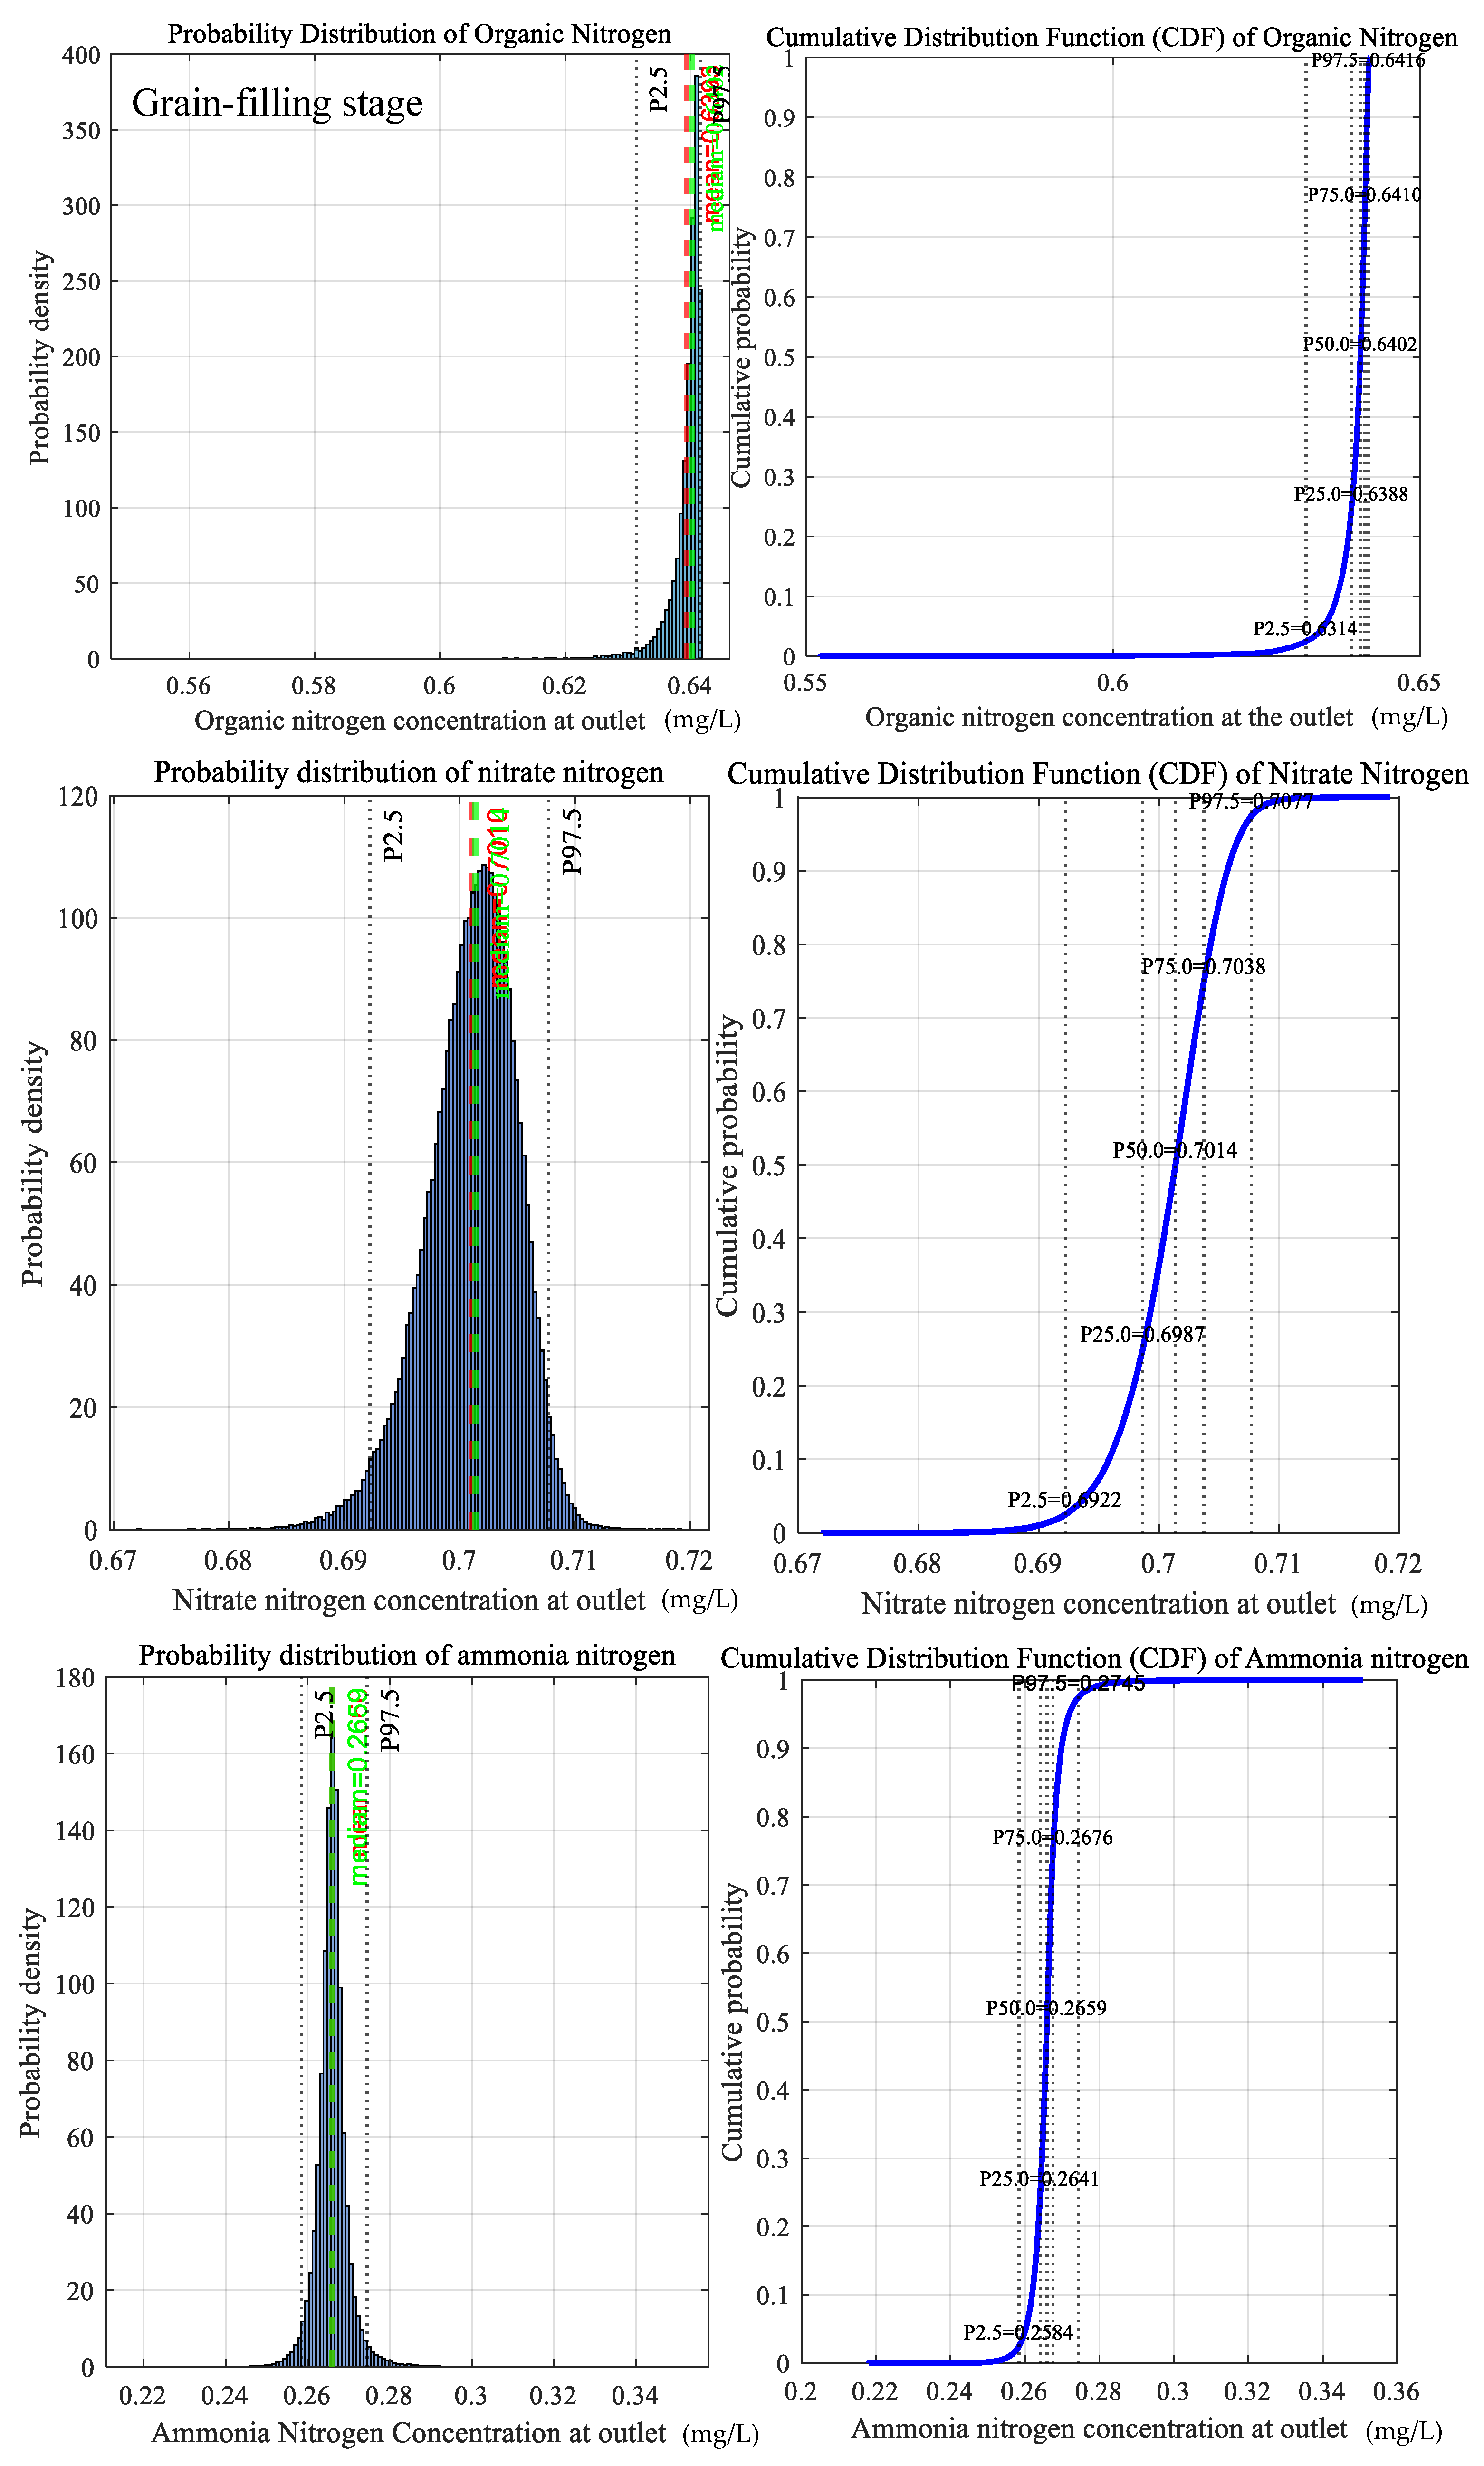
The probability density and cumulative probability density distributions of nitrogen outlet concentrations for each growth period are shown in Figure 7, and the associated variation ranges and uncertainty levels are summarized in Table 6.
Figure 7.
Uncertainty of nitrogen outlet loads during each growth period.
Table 6.
Results of uncertainty analysis.
According to the uncertainty analysis, the nitrogen outlet concentrations fluctuated only slightly during all growth periods. The confidence interval width under P97.5 was narrow, and the uncertainty levels remained below 2.5%. These findings indicate that the analysis results exhibited high precision and strong repeatability, and that the model was not highly sensitive to variations in the input parameters. Therefore, the output concentrations were stable and reliable. Moreover, all nitrogen outlet concentrations satisfied the Class III discharge standard specified in the Environmental Quality Standards for Surface Water (GB3838-2002). This suggests that environmental management decisions based on this model carry a relatively low risk. In this study, the three rate constants were experimentally determined and optimized (Table 2) following standard analytical procedures, while the remaining parameters were obtained from observations in nearby regions.
3.2. Solution of the Optimization Model for Water Surface Ratio and Inflow Rate Under the Maximum Pollution Removal Rate of the Paddy Polder
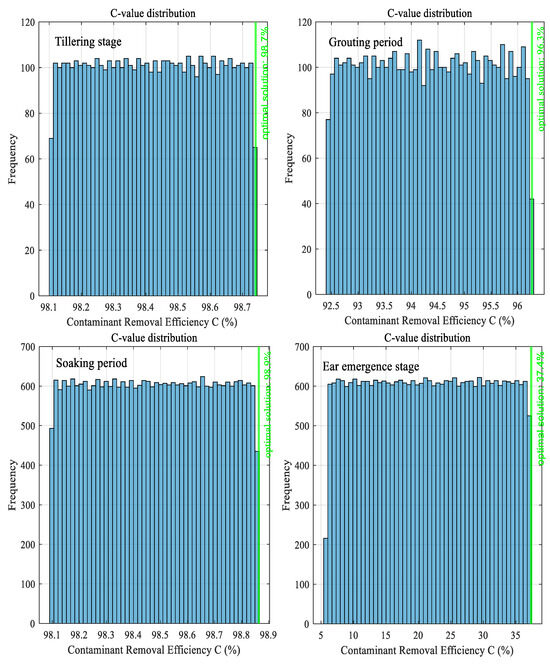
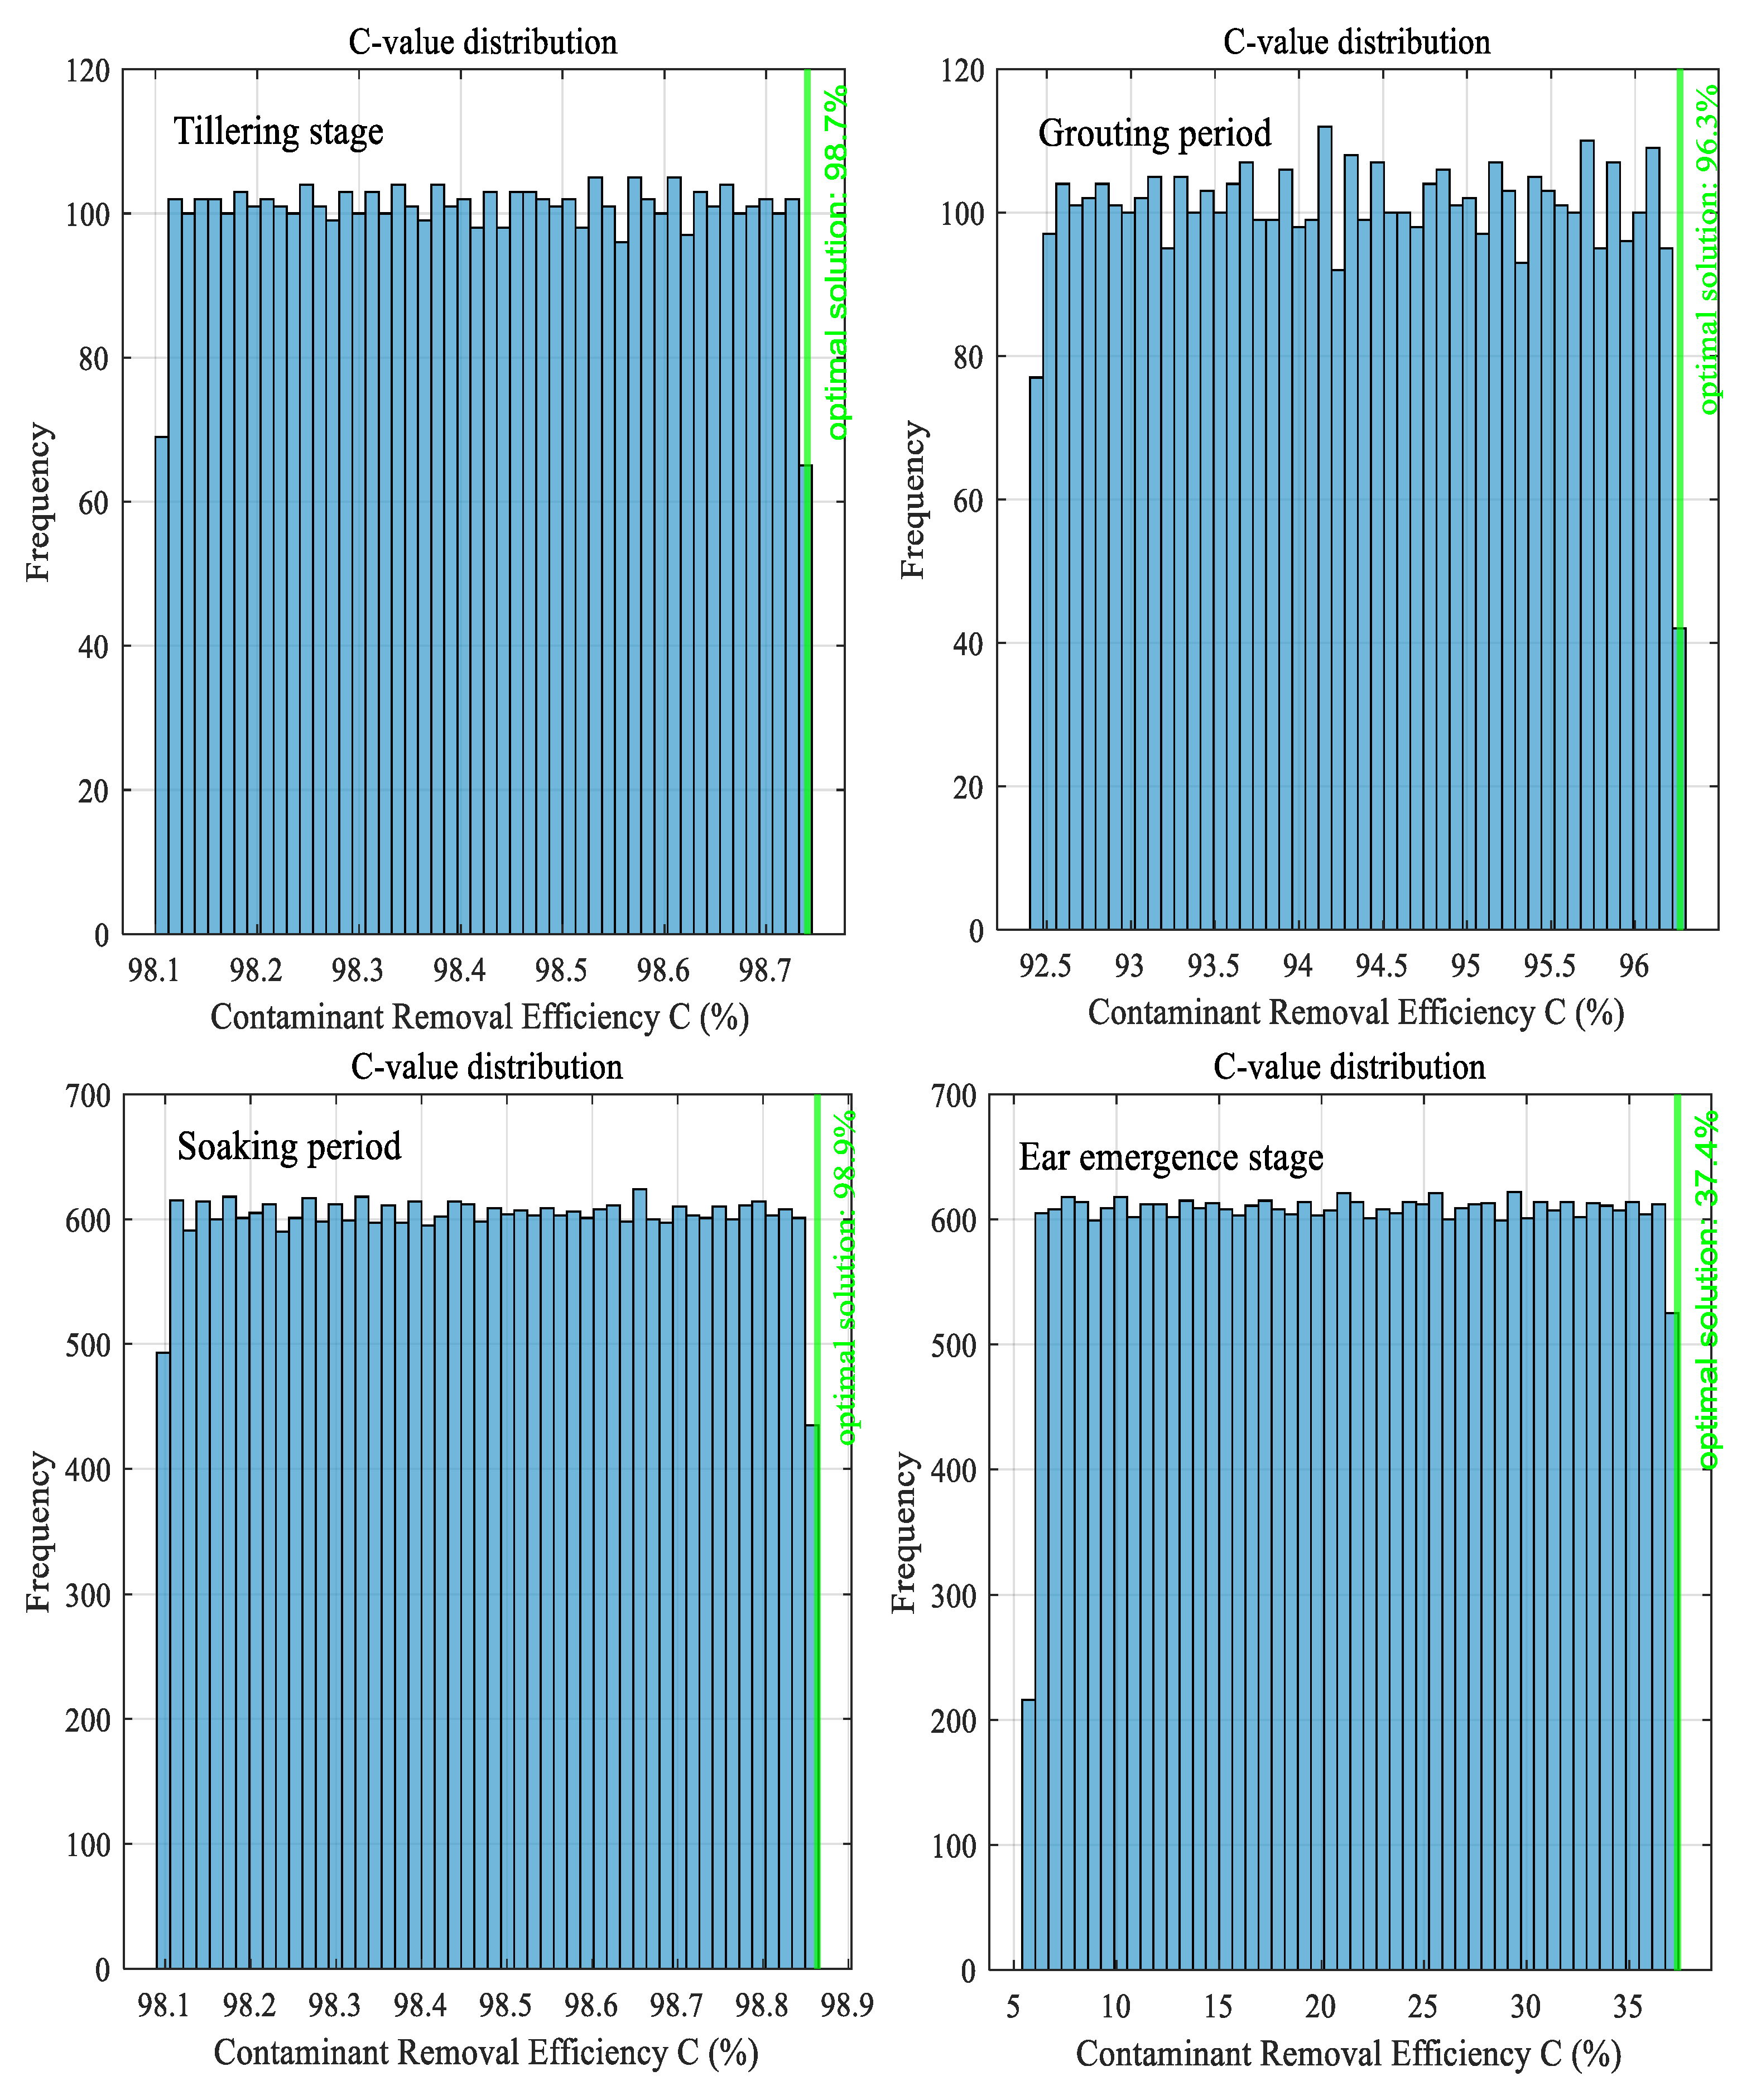
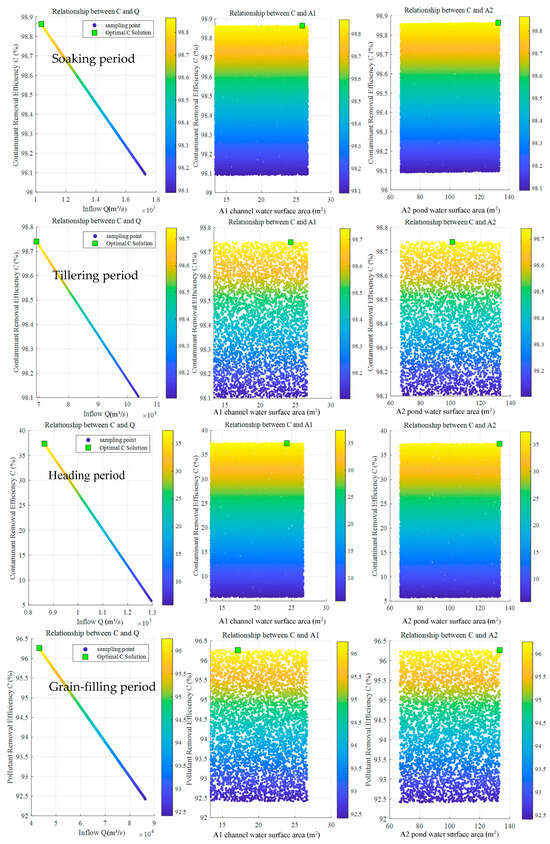
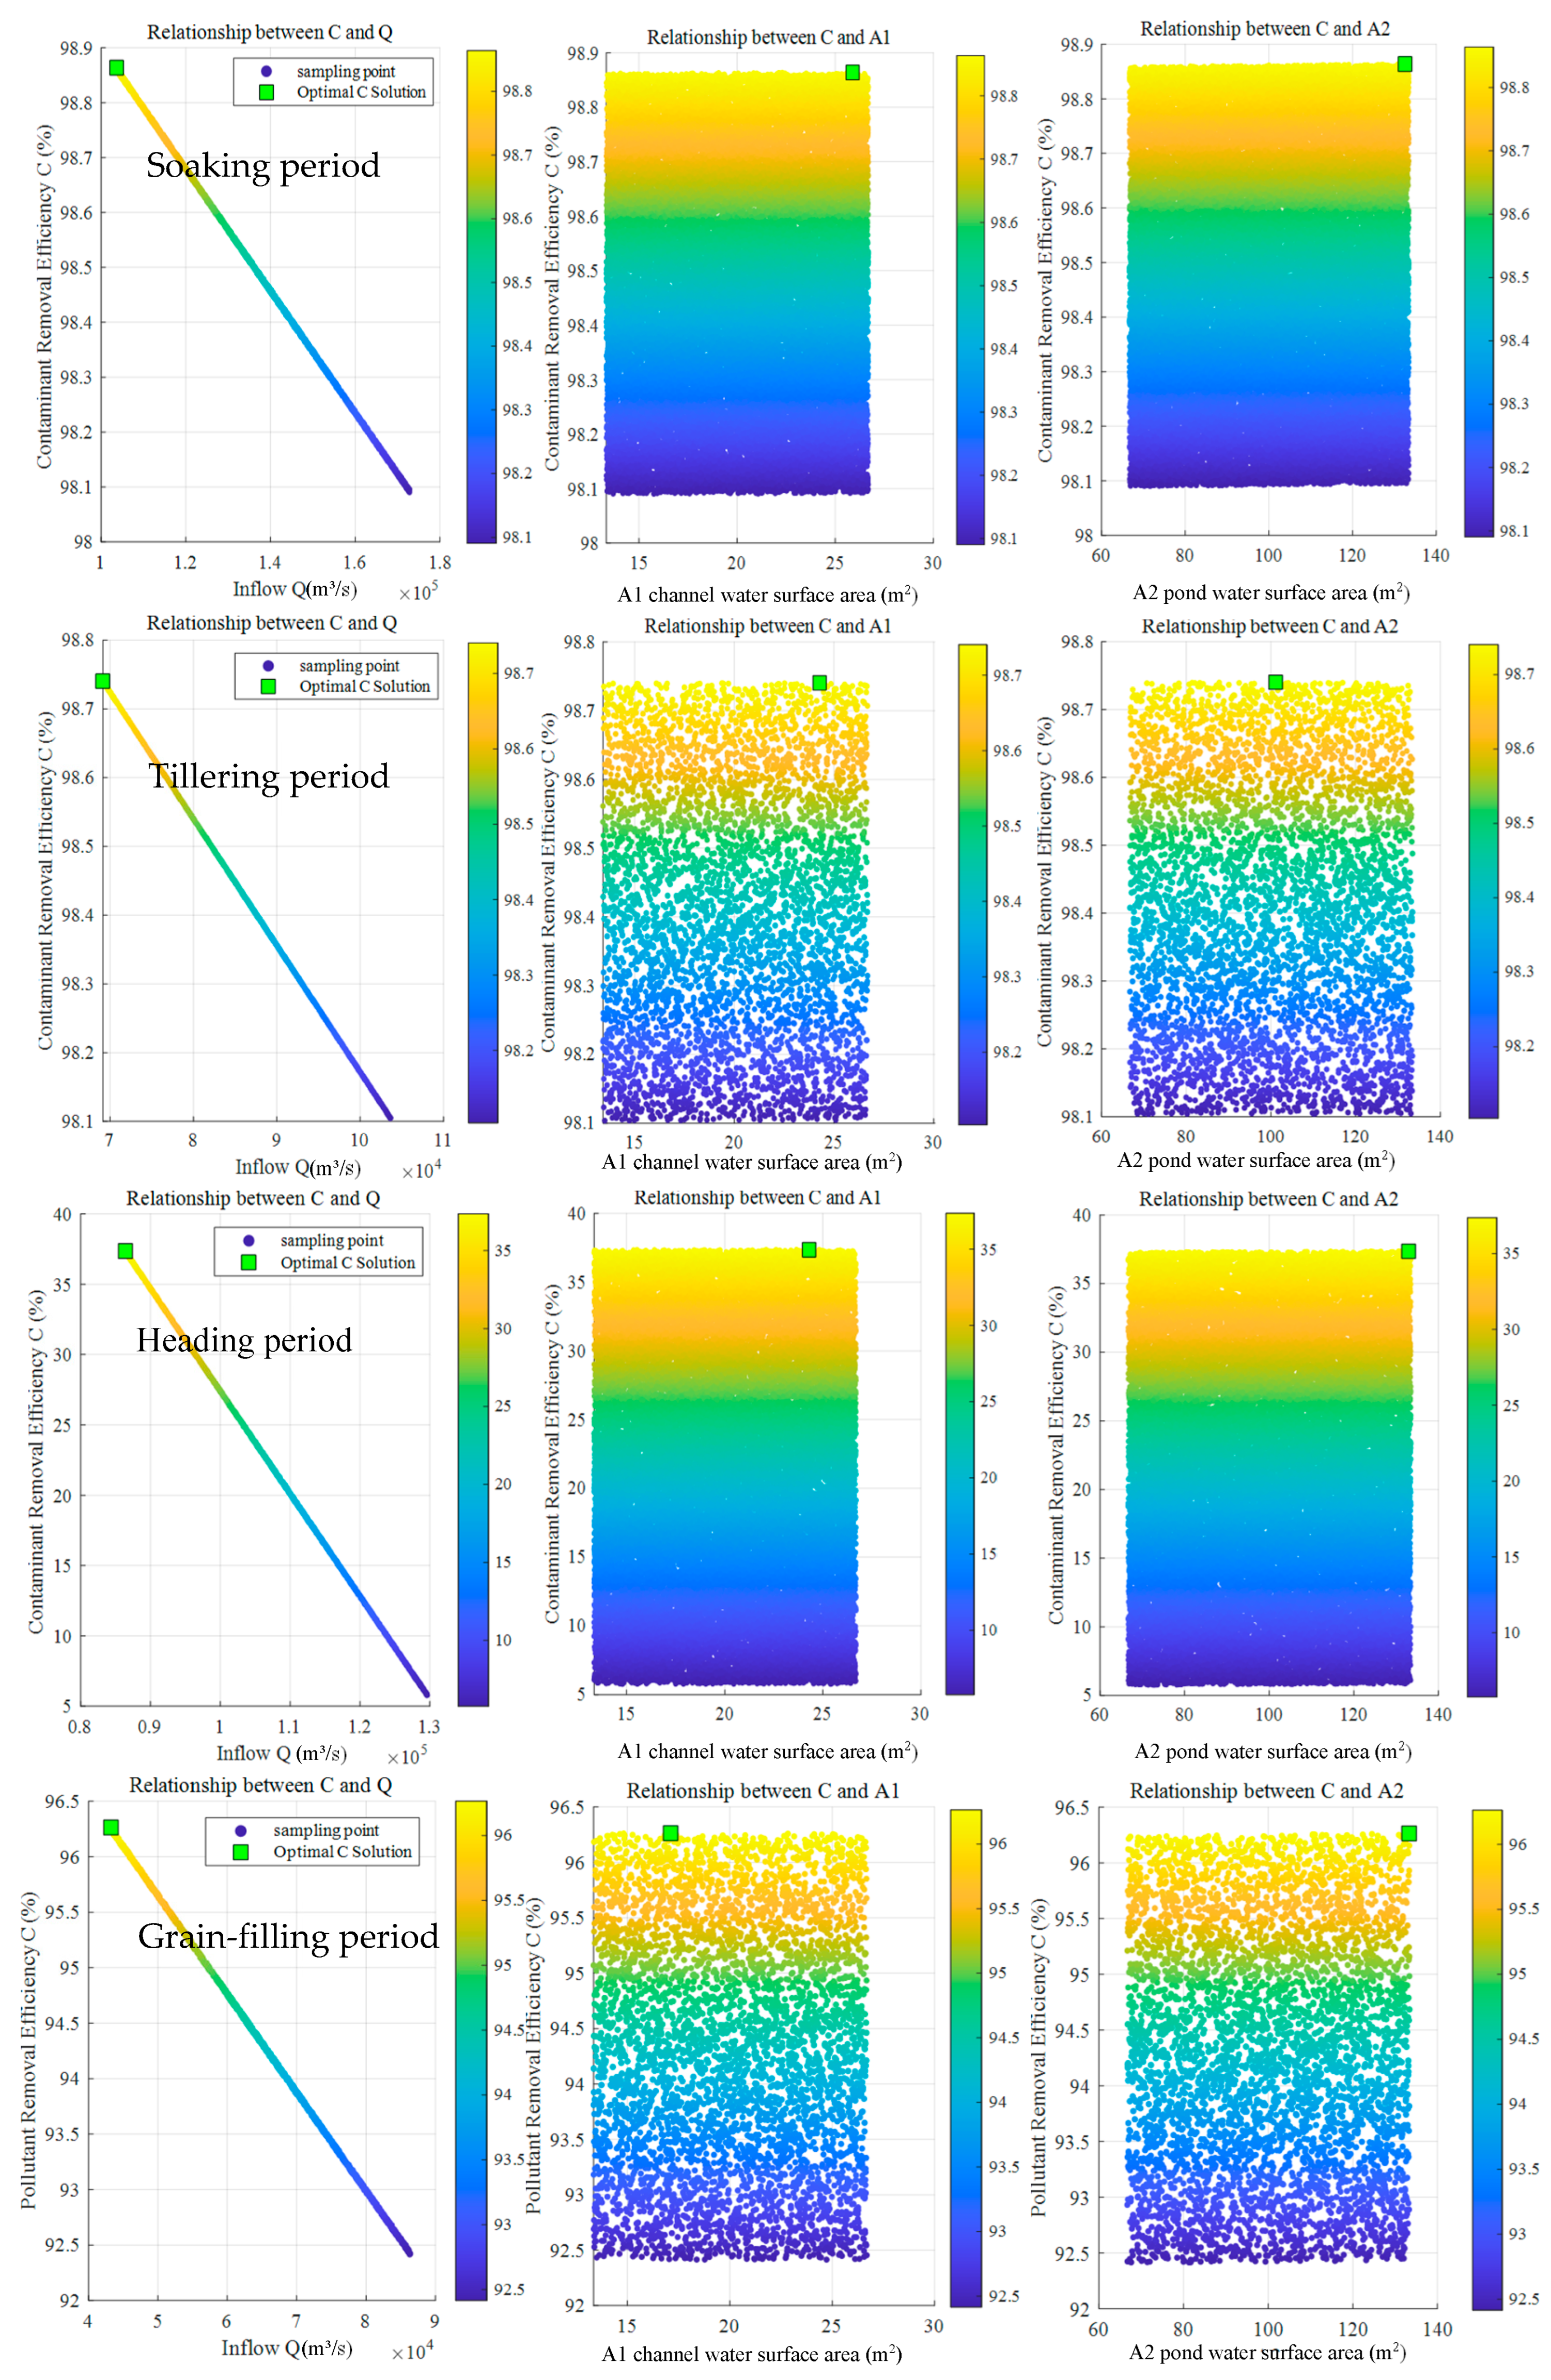
Based on the simulation results of the Stella eco-dynamic model and the nested application of the system optimization algorithm, Latin hypercube sampling was applied to generate the design points (n = 5000) [36]. The nonlinear mathematical model developed in this study was subsequently utilized to obtain the maximum value of the objective function Z. According to measurements from the local farmland water conservancy experimental station, the target water layer depths for Field water storage capacity, Water storage capacity of ponds, and Channel storage capacity were 40, 460, and 400 mm, respectively. By assigning a series of initial conditions and constraint conditions, the distribution of the maximum nitrogen removal rate of the paddy polders after fertilization in each growth period was derived (Figure 8). In addition, the relationship between the maximum removal rate and the water surface ratio and inflow rate was analyzed (Figure 9).
Figure 8.
Distribution diagram of the maximum nitrogen removal rate of the paddy polders.
Figure 9.
Relationship diagram between the maximum pollution removal rate and the water surface ratio and inflow rate.
- (1)
- The nitrogen eco-dynamic equations of the paddy polder were embedded in the optimization algorithm, enabling the determination of the most suitable water surface ratio and inflow rate under the maximum pollution removal rate. Based on this, a collaborative optimization model of the water surface ratio and inflow rate for the Hongze Lake polder was constructed. From the analysis results, , , , and reached 98.86%, 98.74%, 37.34%, and 96.26%, respectively. , , and all exceeded 95%, and their outlet pollution loads also satisfied the Class III discharge standard of the Environmental Quality Standards for Surface Water (GB3838-2002). However, was 37.34%, and its outlet concentration load far exceeded the Class III standard. This outcome was associated with water retention and drainage characteristics during the heading period. Because the drainage pattern during this period was classified as normal water retention with emergency forced drainage, ensuring that the drainage did not occur for most of the time resulted in notable differences in water levels between high and low terrains in the paddy polder. Furthermore, farmers typically apply panicle fertilizer immediately before or after the heading period. This fertilizer was concentrated and applied quickly. During the heading period, rice shifted from vegetative growth to reproductive growth; root growth essentially stopped, and after the total activity and absorption capacity of the root system reached their peak, they began to decline. Consequently, the absorption efficiency of aging roots could not match the high concentrations of nitrogen in the soil, leaving more nitrogen retained within the soil. Consequently, the outlet nitrogen load became abnormally high, and the removal rate remained low.
Based on the optimization simulation results, the most suitable water surface ratio and inflow rate corresponding to the maximum pollution removal rate after fertilization in each growth period were determined (Table 7).
Table 7.
Water surface ratio and inflow rate under the maximum pollution removal rate after fertilization in each growth period.
- (2)
- The analysis of Figure 9 shows that the nitrogen pollution removal rate was negatively correlated with the inflow rate, which is consistent with the findings of this study. In other words, the higher the inflow rate, the lower the removal rate. This occurred because the increased inflow rate shortened the hydraulic retention time, preventing the internal purification processes, particularly microbial denitrification, from being fully completed. The optimal inflow rates for all growth periods were at the lower limits of the threshold ranges defined by the local agricultural management station. This also confirmed that the inflow rate standards specified by the pump stations were aligned with the broader ecological regulation principles of local paddy polders.
- (3)
- From the scatterplots of pollution removal rate versus pond and channel water surface ratios in Figure 9, the relationships between removal rate and the pond or channel water surface ratio were not consistent across the different growth stages. During the tillering and grain-filling periods, the optimal pond water surface ratios remained relatively low. This was because in these two periods, the physiological requirements of the rice plant contradicted the purification needs of the wetland. During the tillering period, field drainage and partial soil drying were required to shift the paddy field soil from flooded to semi-arid conditions. This indicates that a portion of the surface water needs to be discharged. If the water surface ratio is maintained at a high level, this may increase ineffective tillers, population density, susceptibility to pests and diseases, and late-stage lodging, which could reduce the yield. During the grain-filling period, alternate wetting and drying irrigation should be maintained to achieve a relatively low optimal pond surface ratio. The suitable channel water surface ratio during the heading period was relatively small, mainly because the heading period primarily required emergency forced drainage, with no drainage allowed for most of the time. This causes the suitable channel water surface ratio for drainage channels to decrease slightly.
- (4)
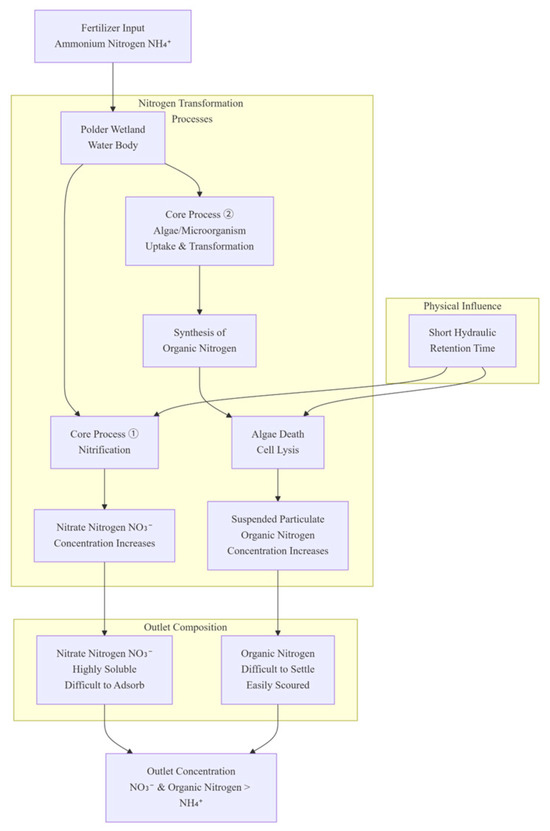
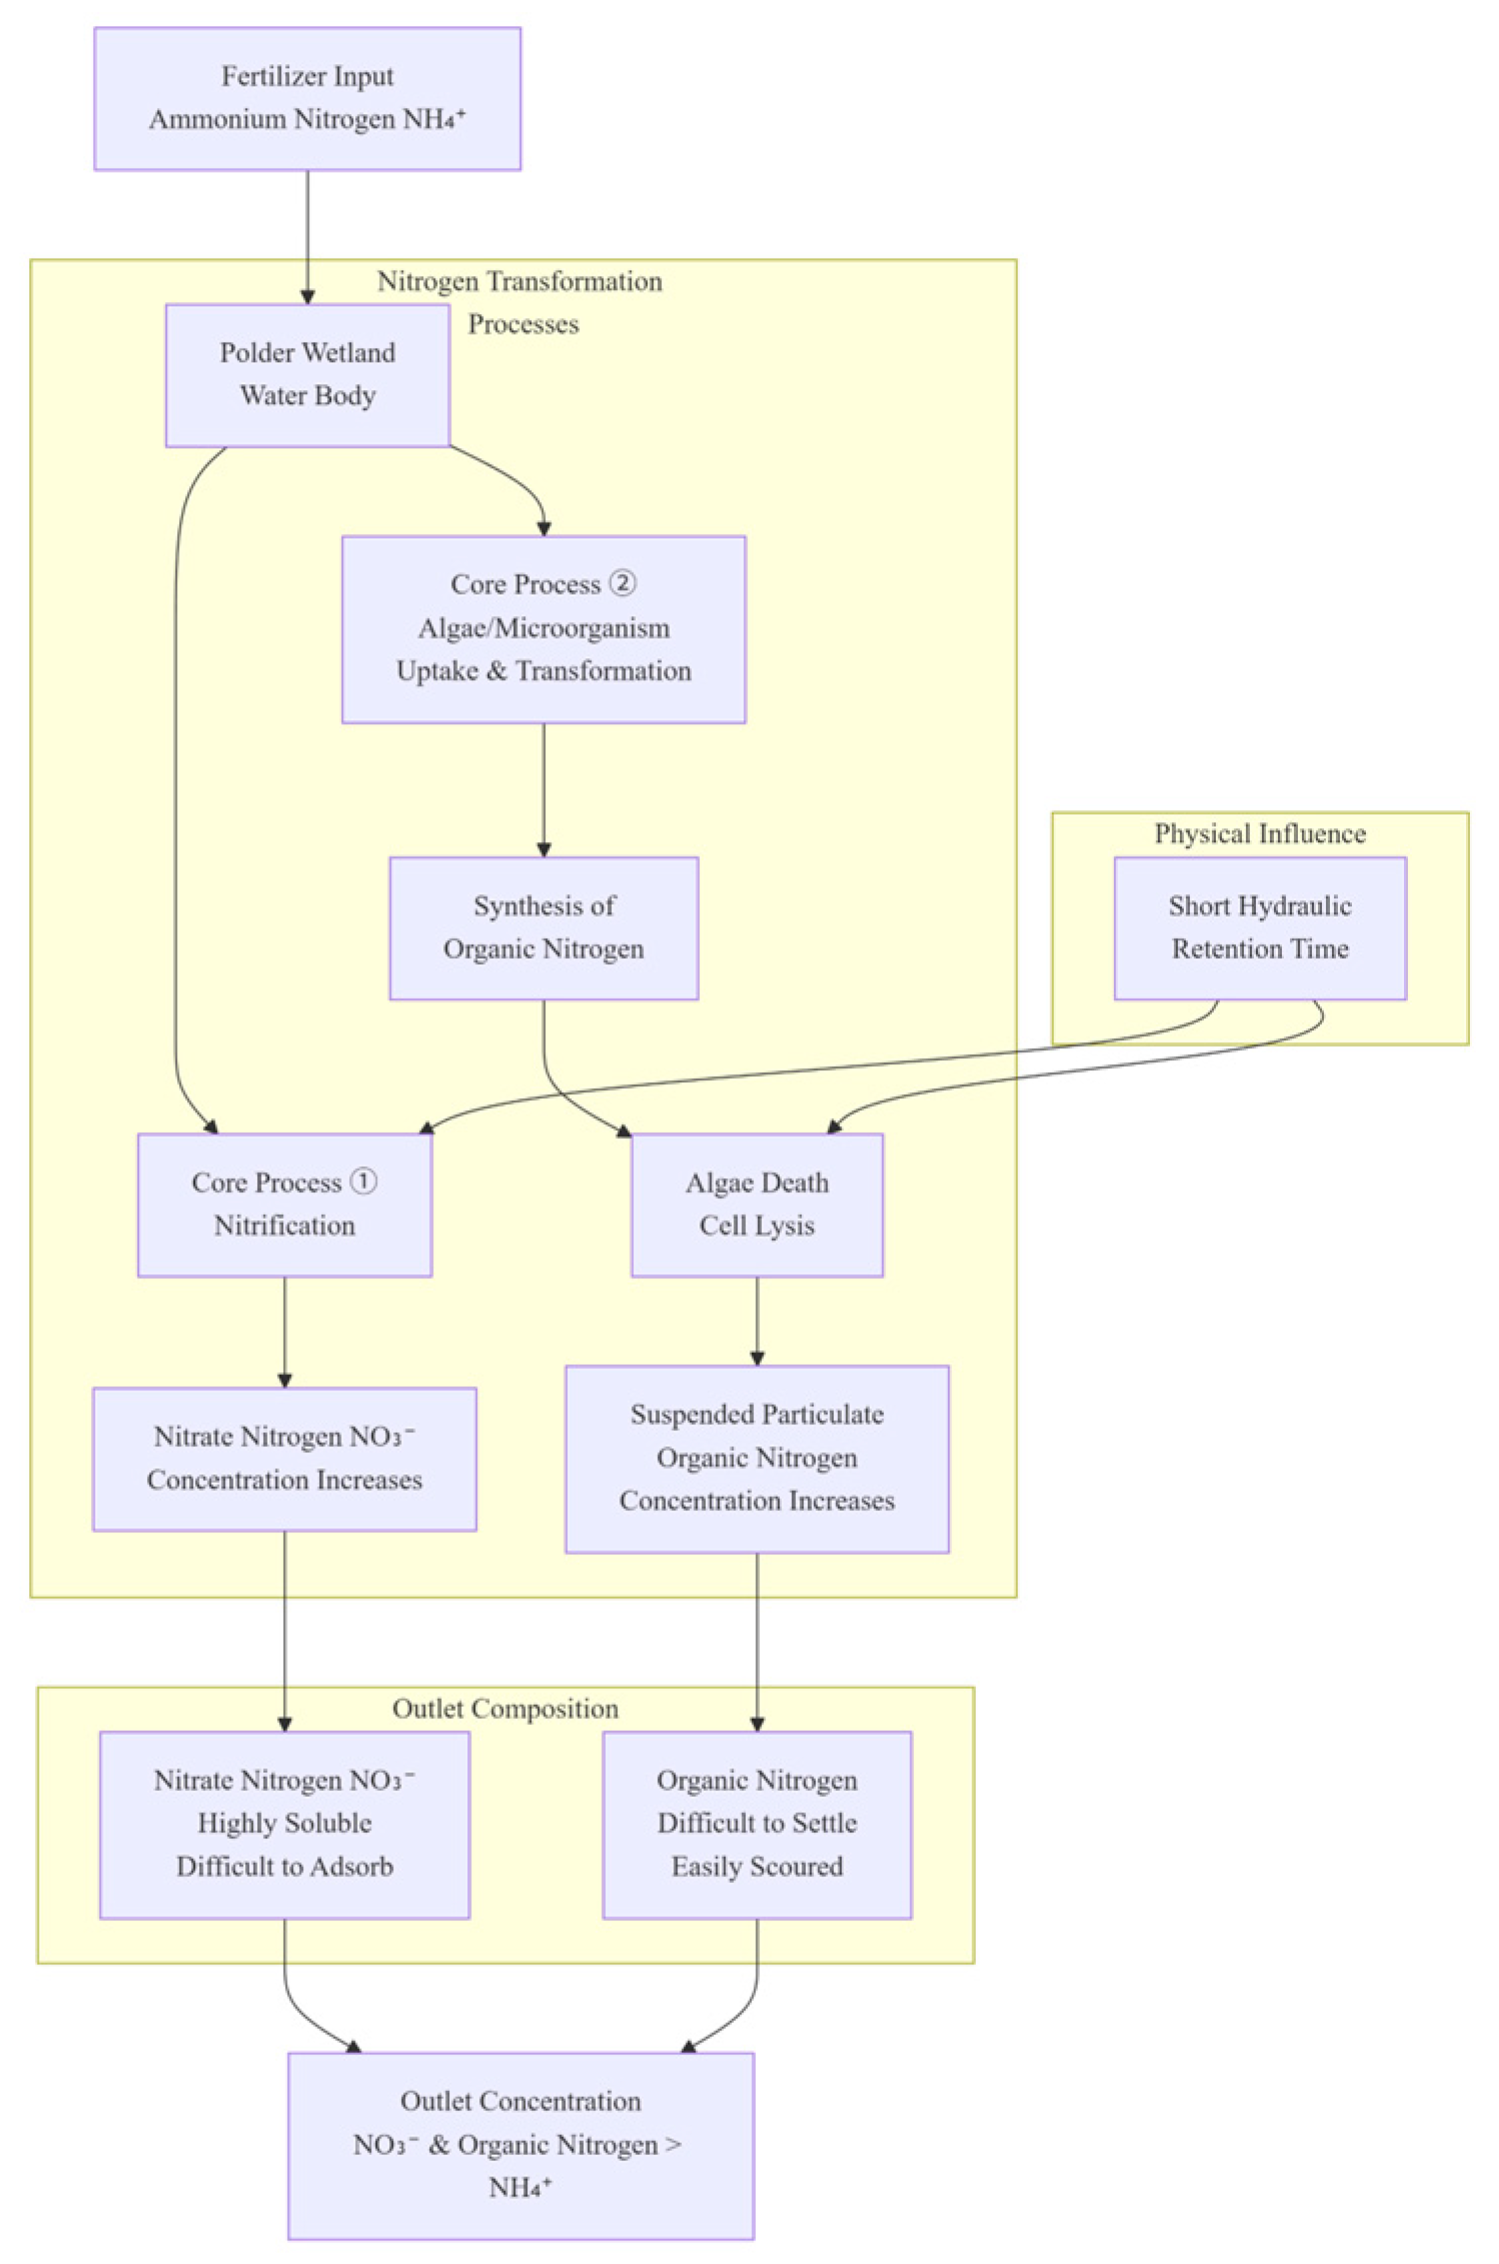
- According to the analysis in Table 7, the outlet nitrogen concentrations under the maximum pollution removal rate demonstrated that after fertilization in each growth period and after purification through the paddy polder, the outlet concentrations of organic nitrogen and nitrate nitrogen were consistently higher than those of ammonium nitrogen. This reflects the core biological processes of the nitrogen cycle within a typical paddy polder wetland (Figure 10). First, the input ammonium nitrogen was rapidly nitrified under aerobic conditions and converted to mobile nitrate nitrogen. Concurrently, nutrient stimulation and microorganism blooms assimilated inorganic nitrogen into particulate and dissolved organic nitrogen. During drainage, nitrate nitrogen became the dominant species at the outlet because it was weakly adsorbed and readily transported with flowing water, whereas organic nitrogen was easily scoured from sediments. In contrast, ammonium nitrogen was largely retained through sediment adsorption and volatilization, leading to comparatively lower concentrations in drainage water.Figure 10. Mechanism of Dominant Nitrate and Organic Nitrogen at Polder Wetland Outlet.
The “simulation–optimization” coupled framework established in this study achieved a significant step forward from mechanistic interpretation to management-oriented decision-making. It can offer a methodological foundation for non-point source pollution control in polders. Future studies should aim to develop multi-objective optimization models and incorporate broader factors, such as economic and ecological benefits, to further support refined decision-making in polder management.
3.3. Robustness Analysis of Optimal Solutions Under Uncertainty Parameters
To ensure the reliability of the optimized management strategy under model parameter uncertainty, we performed an expanded robustness analysis. From the 10,000 parameter sets generated via Monte Carlo simulation, we selected three key scenarios representing distinct effluent concentration outcomes: a baseline scenario (S1, median concentrations), a conservative scenario (S2, concentrations at the 90th percentile, P90), and an optimistic scenario (S3, concentrations at the 10th percentile, P10). For each fixed parametrization, we re-executed the optimization process outlined in Section 2.3. The corresponding optimal solutions are summarized in Table 8.
Table 8.
Robustness Analysis of Optimal Solutions Under Uncertainty Parameters.
As shown in Table 7, while the predicted effluent concentrations vary across the three parameter scenarios, the optimal inflow rates and water surface ratios for each growth stage remain relatively stable (e.g., the inflow rate during the soaking period fluctuates between 1.15 and 1.22 m3/s). This demonstrates that the optimal management strategy derived from the baseline scenario (S1) is highly robust. Even under real-world parameter uncertainties, the strategy remains near-optimal. These results strongly support the practical applicability of the recommended management plan for achieving desired outcomes.
4. Discussion
- Integration of the Stella model and nitrogen dynamic equations: From concept to a computable framework
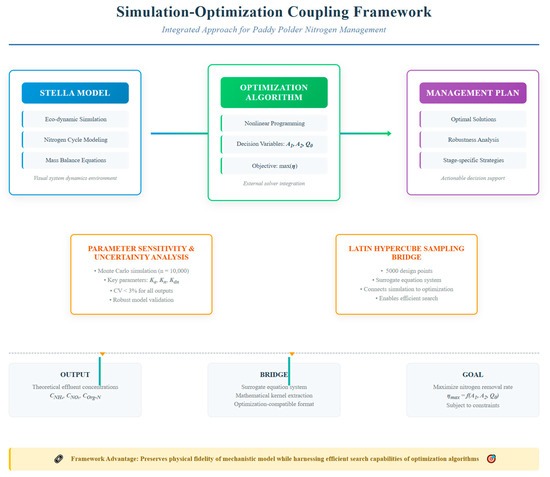
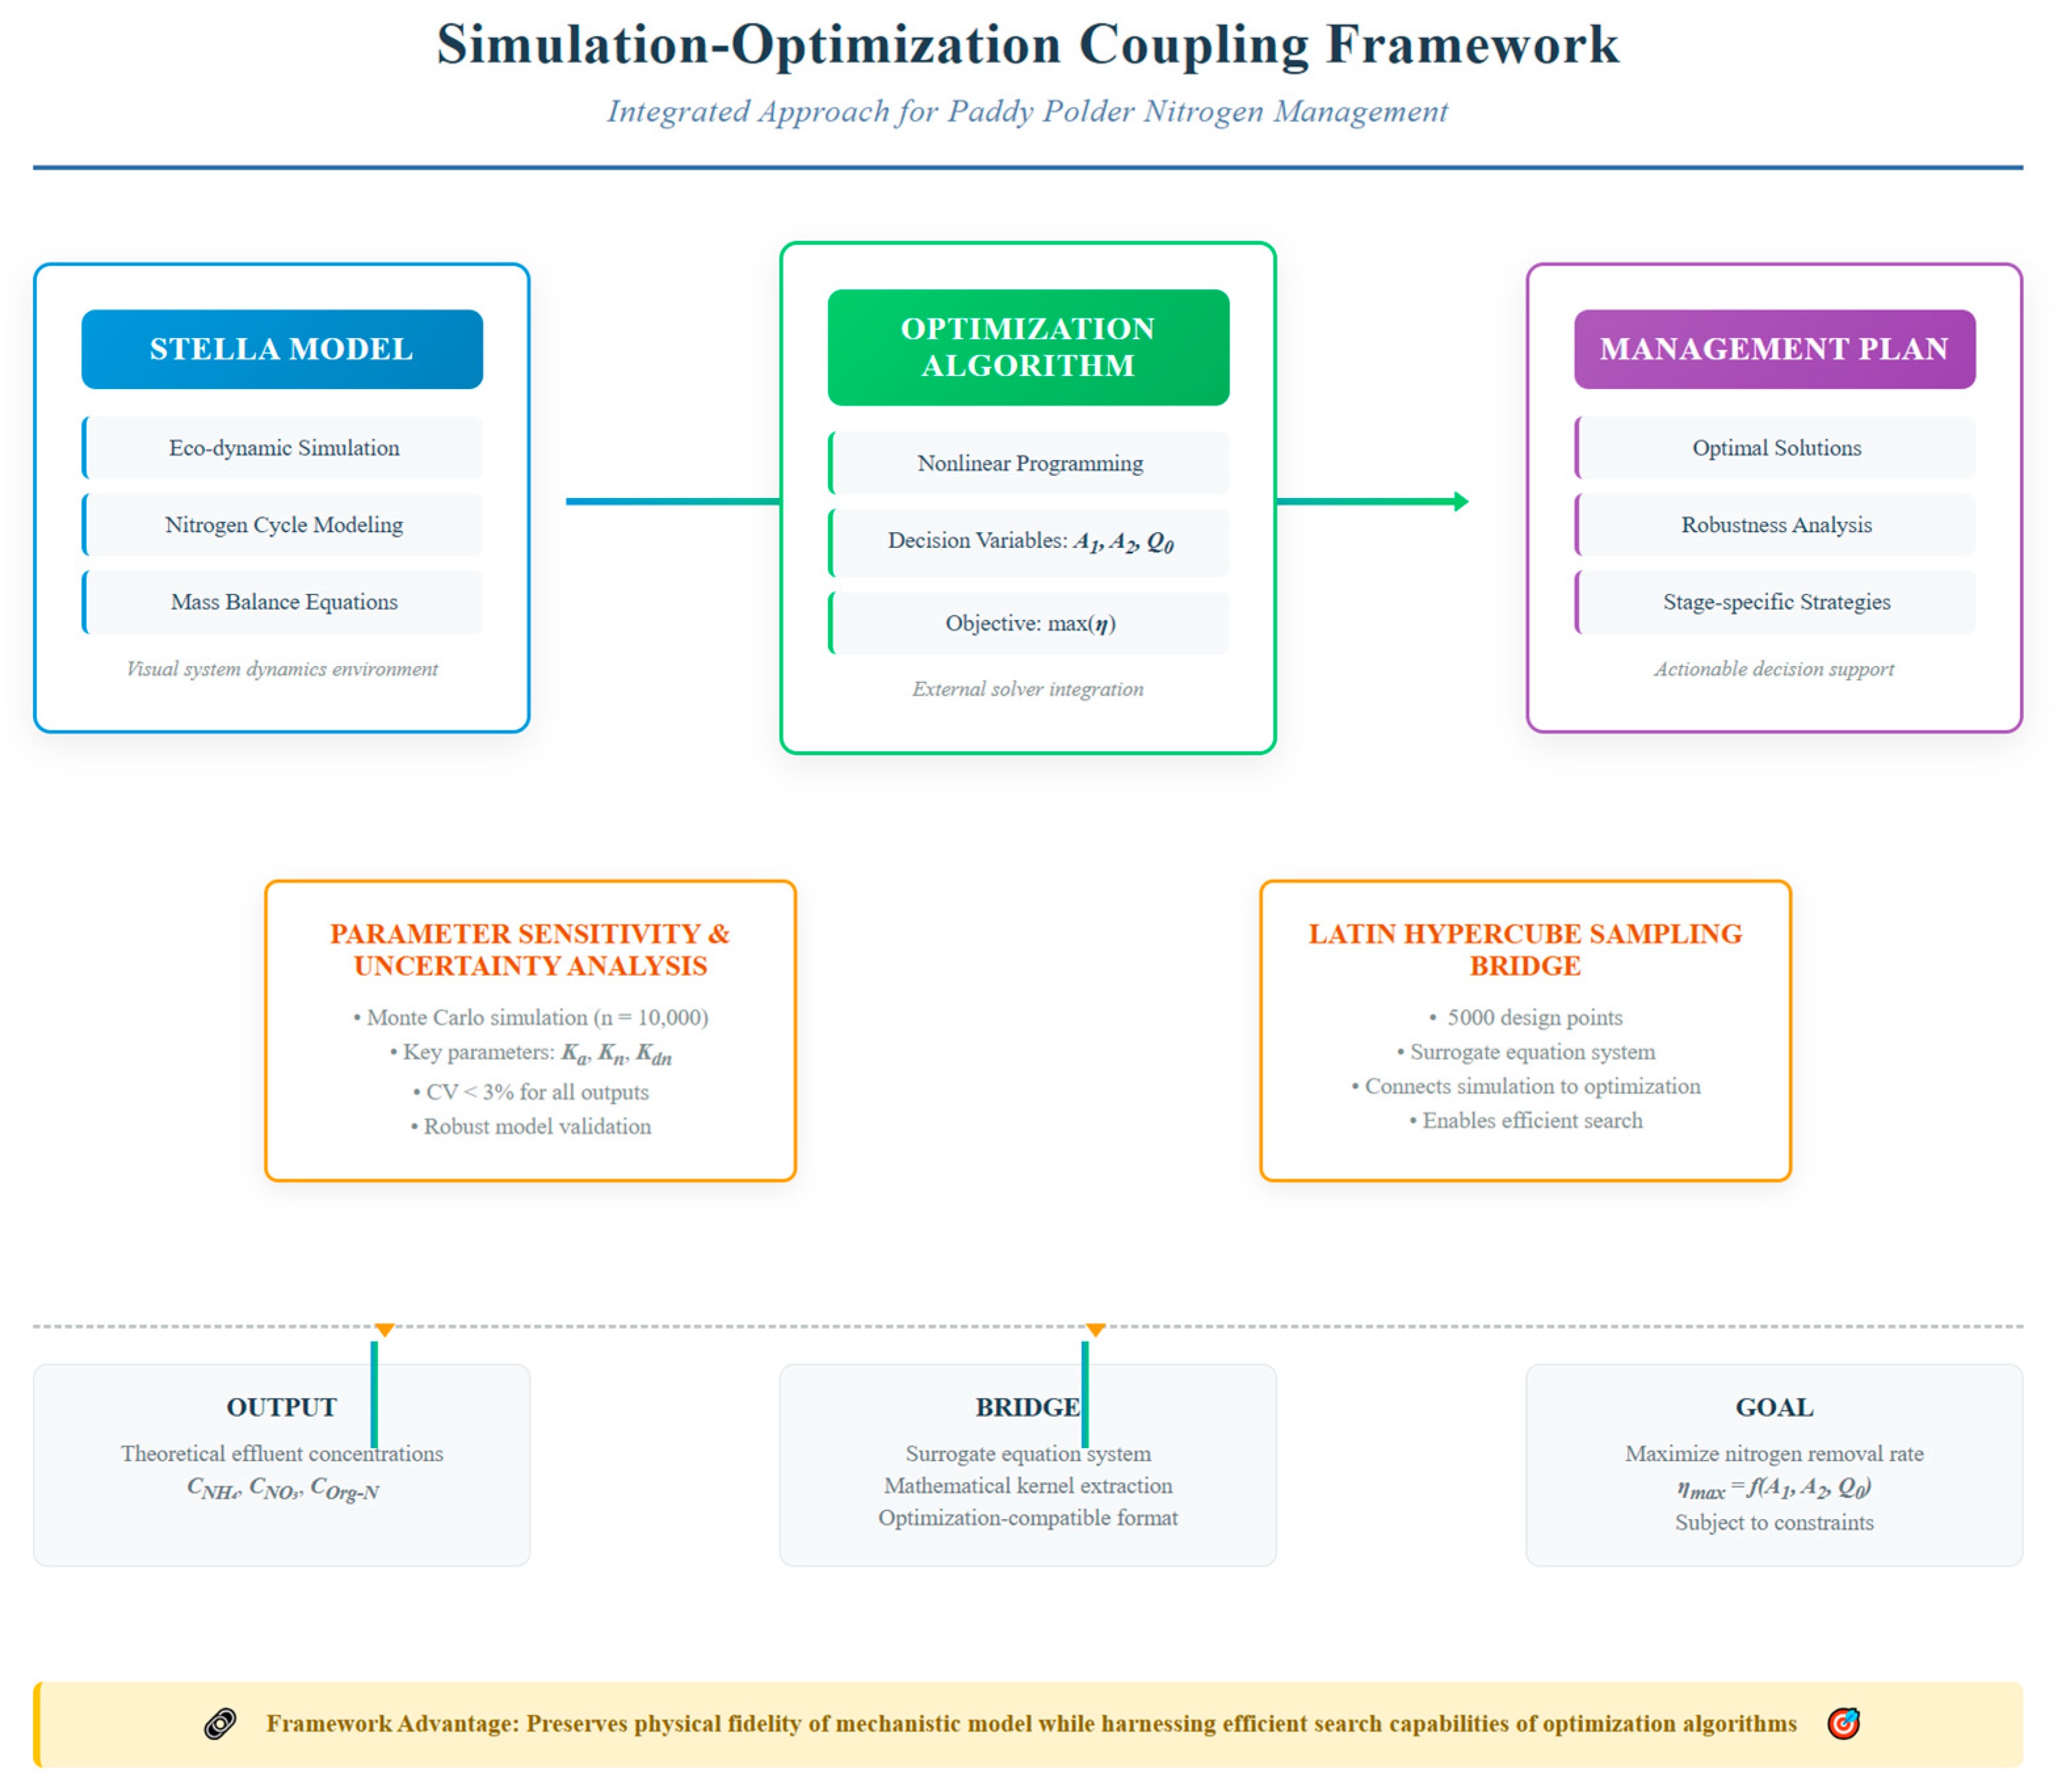
This study applied the Stella Architect V1.95 software to integrate a set of first-order kinetic equations describing the nitrogen cycle in paddy polder, including the ammonification of organic nitrogen, nitrification of ammonium nitrogen, and denitrification of nitrate nitrogen, into a visual and computable system dynamics model [37]. The model structure shown in Figure 5 intuitively represents the three nitrogen forms (ammonia nitrogen, nitrate nitrogen, and organic nitrogen) as “stocks”, and the associated processes of volatilization, sedimentation, nitrification, denitrification, and crop uptake as “flows”, along with their mutual transformations. This integration allowed the model to overcome the limitations of static formulas and dynamically simulate the entire nitrogen migration and transformation process in the interconnected water network of the paddy polder system (ponds, channels, and rice fields) after fertilization. The model became not only a visualized representation of the theoretical equations but also a powerful simulation tool capable of rapidly calculating the theoretical minimum nitrogen concentration at the polder outlet under different scenarios, thus providing a mechanistic foundation for subsequent optimization analysis (as illustrated in Figure 11).
Figure 11.
Schematic of the simulation–optimization coupling framework.
- Key parameter uncertainty analysis: Evaluation and verification of model robustness
Given that key parameters, such as the organic ammonification rate constant, nitrification rate constant, and denitrification rate constant, have relatively broad value ranges in the literature, this study performed a detailed uncertainty analysis using Monte Carlo simulation. The results demonstrated that under 10,000 samples, the confidence interval widths of the outlet concentrations of each nitrogen form remained narrow, and the uncertainty levels (CV) consistently remained below 3% (Table 6). These outcomes strongly indicate that although some parameter uncertainty existed, the model system constructed in this study maintained a high degree of robustness, and the output results were not highly sensitive to variations in the input parameters. This ensured that the simulations and management recommendations derived from this model were reliable and low-risk. This paper incorporates uncertainty directly into the optimization framework. Its objective is to identify a solution that may not yield the highest performance but demonstrates relatively stable and reliable behavior across diverse parameter scenarios. Such a solution is typically more dependable than the nominal optimal solution. providing essential quality assurance for transitioning the model from scientific research to management-oriented application.
- Nesting of eco-dynamic models and optimization algorithms: Leap from simulation to decision making
The core innovation of this study lies in effectively nesting the mechanistic model constructed using Stella into an external optimization algorithm. Because the Stella software interface is closed and cannot directly perform complex optimization tasks, a nonlinear programming model was developed based on the nitrogen removal mechanisms revealed by the Stella model, with the pollution removal rate as the objective function and the pond water surface ratio, channel water surface ratio, and inflow rate as decision variables. By generating 5000 design points through Latin hypercube sampling, this approach transformed a simulation model that only described the system behavior into a decision model capable of identifying optimal management schemes. Powerful mechanistic models such as Stella and SWMM possess complex internal structures and are regarded as “black boxes”, making direct coupling with optimization algorithms challenging. Consequently, much research either employs simplified models for optimization or conducts scenario simulations without automated optimization capabilities. This paper employs Stella as a ‘mechanistic core’ for understanding and quantifying processes. Subsequently, its mathematical kernel is extracted to construct a surrogate equation system directly callable by optimization algorithms. This approach preserves the physical fidelity of the mechanistic model while harnessing the efficient search capabilities of optimization algorithms. This methodological advance effectively resolved the common practical challenge of applying complex ecological models, namely, the situation of having a model but no optimal solution.
- Mechanistic interpretation of the characteristics of water surface ratio and inflow rate under the maximum pollution removal rate in different growth periods
In conventional ecological hydrological optimization, a single “optimal water surface ratio or inflow rate” applicable throughout the year may be proposed. This proves impracticable in implementation as it disregards critical agronomic requirements for rice growth. This paper aims to identify hydrological optimal solutions for different growth stages and elucidates the underlying driving factors. The optimization results indicated that the combinations of water surface ratio and inflow rate required to achieve the maximum nitrogen removal rate differed significantly across growth periods. This differentiation reflected the complex interactions among hydrological, biological, and agronomic processes within the paddy polder system.
During the soaking period and the tillering period, the optimized values were both located at the lower limits of the threshold ranges defined for each growth stage (1.20 and 0.80 m3/s, respectively). This aligns well with the classical wetland theory, which states that “a lower hydraulic load is conducive to prolonging the hydraulic retention time and promoting denitrification” [38]. During the soaking period, the required value (19.94%) was markedly higher than that during the tillering period (16.30%), reflecting the crucial regulatory role of agronomic measures. The commonly implemented “drain and sun the field” during the tillering stage lowered the field water level to restrict ineffective tillering, while this unavoidably reduced the storage capacity and reaction space of the ponds. During the heading period, although the optimized was also at the lower limit (1.00 m3/s), was exceptionally low (37.34%). The core mechanism behind this seemingly contradictory phenomenon laid in the inherent conflict between the agronomic requirement of “normal water retention with emergency forced drainage” and the concentrated fertilizer application that typically occurred during this stage. Farmers generally apply “panicle fertilizer” shortly before and after the heading period, causing a rapid surge in nitrogen input. To meet the high water demand of reproductive growth, the paddy polder system remained essentially in a closed-gate state, leading to pollutant accumulation. Although the hydraulic retention time was long, this “closed-loop” operation suppressed pollutant discharge and hindered subsequent purification. During the grain-filling period, further decreased to 0.50 m3/s, accompanied by a moderate value of 17.54%. This pattern reflected the alternating wetting and drying irrigation strategies used during this stage. The lower inflow prevented a rapid increase in the field water depth, which helped maintain soil aeration and promoted root vitality. Meanwhile, maintaining a certain pond water surface ratio ensured sufficient buffering capacity and purification space for nitrogen during intermittent drainage. Overall, the dynamic characteristics of the optimal water surface ratio and inflow rate across the different growth periods represented the external manifestation of the paddy polder as a “production–ecology” coupled system. These characteristics arise from the combined effects of agronomic practices, hydrological regulation, and biogeochemical processes. Through optimization, this study revealed, for the first time, the internal mechanisms governing this dynamic trade-off relationship, thereby providing scientific support for developing differentiated paddy-polder management strategies across growth periods.
- Analysis of the characteristics of outlet concentrations of different nitrogen species under the maximum pollution removal rate
Under the condition of maximum pollution removal rate, the outlet concentrations of the different nitrogen forms during each growth period showed clear and significant differences. This pattern reflects the complexity of nitrogen transformation processes in the paddy-polder wetland. The optimization results demonstrated that during high-removal-rate periods such as the soaking, tillering, and grain-filling stages, nitrate nitrogen and organic nitrogen were the dominant forms in the outlet water, with concentrations consistently higher than those of ammonium nitrogen. This characteristic is closely associated with the biogeochemical processes in the system. Continuous nitrification converts ammonium nitrogen into nitrate nitrogen, and the decomposition of plant residues and sediments continuously releases organic nitrogen [39].
Even under the maximum removal conditions, the total nitrogen concentration at the outlet during the heading period reached 8.39 mg/L, far exceeding the Class III discharge standard for surface water. Among the nitrogen forms, nitrate nitrogen accounted for the largest proportion (3.43 mg/L), followed by organic nitrogen (3.21 mg/L) and ammonium nitrogen (1.75 mg/L). This distribution indicated that during the heading period, although the system maintained a long hydraulic retention time, the decline in root nitrogen uptake capacity and continuous mineralization–nitrification processes contributed to substantial nitrate accumulation. Simultaneously, the aging and decomposition of plant tissues further enhanced the release of organic nitrogen.
The differences in the distribution of nitrogen forms across growth periods could provide important guidance for optimizing paddy-polder management strategies. For instance, during the soaking and tillering periods, denitrification served as the primary nitrogen removal pathway. Ensuring sufficient hydraulic retention time and maintaining an adequate carbon source supply are essential during these stages. In contrast, during the grain-filling period, agronomic operations tended to maintain nitrogen pollution at a relatively high level. Consequently, this period was considered a high-risk stage for nitrogen loss, and drainage should follow the principles of small flow and slow discharge. This involved shifting from rapid drainage to gradual flow and directing water from channels into purification zones, thereby retaining fertilizer and water within the system and sustaining internal resource recycling. To address relatively high concentrations of nitrate nitrogen and organic nitrogen in effluent, two mitigation measures may be employed: supplementing carbon sources and managing sediments. Firstly, artificial carbon source addition: During critical periods (such as the drainage phase following fertilization), slow-release carbon sources (e.g., crop straw, lignocellulose, biodegradable polymers) are introduced into the ditch-pond system to specifically ‘feed’ denitrifying bacteria, significantly enhancing nitrate nitrogen removal rates. Secondly, ecological carbon sequestration: Cultivating high-yield aquatic plants like common reed and water sedge in ditches and ponds within the paddy field area. These plants not only directly absorb nitrogen, but their decomposing biomass after death provides a stable natural carbon source for the system, establishing a long-term internal carbon cycle. Thirdly, hydraulic regulation: controlling water levels to create more stable anaerobic zones (such as saturated soil layers), providing suitable environments for denitrification; Fourthly, controlling algal growth: suppressing algal blooms by planting submerged plants to compete for nutrients or regulating water body light conditions, thereby reducing organic nitrogen inputs at source; Fifthly, optimizing drainage timing: avoiding drainage during peak algal bloom periods directly reduces particulate organic nitrogen output. The challenges encountered in practical applications should also be accompanied by corresponding strategic analysis. (as illustrated in Table 9).
Table 9.
Practical Challenges and Recommendations.
- Limitations and prospects
The eco-dynamic optimization algorithm framework developed in this study is conceptually clear, computationally feasible, and highly applicable for practical applications. It not only supports differentiated water surface ratio and inflow-rate regulation schemes for various polder regions but also functions as a simulation platform for evaluating long-term impacts of climate change or agricultural structural adjustments on nitrogen loads in polders. This provides scientific support for regional non-point source pollution control and agricultural green development planning. However, several challenges remain. First, the localization and verification of model parameters require long-term, systematic in situ monitoring to ensure sufficient data support. In the future, integrating remote-sensing inversion with water-quality sensor networks into the existing monitoring framework for constructed wetland performance may help improve the applicability of the model at larger regional scales [40]. Second, the current model adopts the nitrogen removal rate as the sole optimization objective. Future research should incorporate multi-objective optimization methods from ecological economics to include additional goals, such as agricultural production value, water resource consumption, carbon emissions, and biodiversity conservation, thereby identifying Pareto-optimal solutions that maximize overall benefits. Third, the paddy-polder system serves as a key interface linking watersheds to farmland. Future modeling efforts may attempt to couple this framework with watershed hydrological models (such as SWAT) or crop growth models (such as DSSAT) to evaluate system evolution and adaptive management pathways under the combined effects of climate change and human activities at broader spatial scales. Finally, this study employs a simplified temporal resolution in its modeling and optimization framework. Model inputs are based on daily average data aggregated over each growth stage (approximately 15 days), which aligns with the timescale of decision-making for hydrological management and agricultural production in paddy field systems. However, this approach does not capture short-term peaks in nitrogen concentration that may occur within days following fertilization, nor does it reflect rapid, intraday fluctuations in hydrology and water quality driven by heavy rainfall events. While these transient dynamics are important for accurately predicting instantaneous water quality at the paddy outlet, the primary objective of this study is to optimize integrated management parameters—such as water surface ratio and inflow rate—at the growth stage scale to maximize overall nitrogen removal efficiency over this period. Short-term fluctuations can be buffered and integrated over several weeks through the storage capacity of paddy systems (including ponds and ditches) and ongoing biogeochemical processes such as denitrification. Notably, the optimized strategy derived here—adopting lower inflow rates during each growth stage—itself enhances system resilience to sudden rainfall by maintaining buffer capacity. Thus, optimization results based on stage-averaged data remain robust and provide valuable guidance for medium- to long-term water resource allocation and non-point source pollution control in paddy fields. Future research could incorporate high-frequency online monitoring or couple physically based event-scale hydrological models to better capture system responses during extreme rainfall events, thereby refining management strategies at finer temporal resolutions.
- Outlook: From Benchmark Paradigms to Differentiated Scenario Management
The hydrological optimization baseline established in this study offers a unified standard for assessing the environmental performance of various agronomic practices. Building on this foundation, future research can develop an integrated analytical framework that couples “baseline hydrological regulation with diverse agronomic scenarios.” Specific directions include:
*Scenario Analysis:
Simulate practices such as reduced fertilizer application, split fertilization, and deep-water irrigation under fixed optimal hydrological conditions, and evaluate their corresponding nitrogen runoff loads.
*Synergistic Benefit Assessment:
Identify agronomic measures that exhibit synergistic effects with optimized hydrological management to further mitigate environmental risks without compromising crop yield.
*Prioritization Strategy:
This framework can assist decision-makers in prioritizing interventions: first implementing robust hydrological control—a core finding of this study—and then complementing it with optimized agronomic practices to maximize overall benefits.
5. Conclusions
This study successfully implemented an eco-dynamic model of the paddy polder nitrogen cycle on the Stella platform, enabling the dynamic simulation and visual analysis of nitrogen migration and transformation processes. The model rapidly responded to parameter changes and computed the theoretical outlet concentrations, thereby offering an effective dynamic framework for simulating nitrogen fluxes in constructed wetlands in polder regions.
By integrating the proposed model with an optimization algorithm, a nonlinear programming model was developed with the maximum nitrogen removal rate as the objective function, and the optimal combinations of water surface ratio and inflow rate for each growth period were quantitatively obtained. This approach addresses the limitations of traditional models in addressing complex optimization tasks and provides a long-term, actionable regulatory framework for the sustainable management of water environments in the floodplain area.
The optimization results indicated that during the soaking, tillering, and grain filling periods, when lower inflow rates of 1.20, 0.80, and 0.50 m3/s, respectively, were applied in combination with appropriate water surface ratios, the nitrogen removal rates exceeded 96%. In contrast, during the heading period, agronomic constraints limited the removal rate to only 37.34%, and the outlet total nitrogen concentration reached 8.39 mg/L, far exceeding the discharge standard. Across all growth periods, nitrate nitrogen and organic nitrogen were the dominant nitrogen species at the outlet, reflecting the continuous mineralization nitrification processes and plant residue decomposition in the paddy polder system, contributing to the sustainable development of the ecological environment in the paddy polder area. These findings provide scientific support for the design of targeted control strategies for different nitrogen species.
Author Contributions
Y.J. designed the study, conducted the experiments and data analyses, completed the manuscript, and approved it for submission. L.W. designed the framework of the paper. J.H. and F.Z. provided relevant data support. J.C. is the initiator of the overall support project and provided oversight and conceptualization. All authors have read and agreed to the published version of the manuscript.
Funding
This research was funded by [National Natural Science Foundation of China] grant number [52079119] And The APC was funded by [Jilin Cheng].
Institutional Review Board Statement
Not applicable.
Informed Consent Statement
Not applicable.
Data Availability Statement
The data supporting the findings of this study are available from the corresponding author upon reasonable request.
Acknowledgments
This work was supported by the projects Research on Soil and Water Conservation and Water Ecological Environment Protection Countermeasures and Measures for the Recent Construction Project of the Flood Detention and Storage Area around Hongze Lake funded by the National Key Projects.
Conflicts of Interest
The authors declare no conflicts of interest.
Correction Statement
This article has been republished with a minor correction to the existing affiliation information. This change does not affect the scientific content of the article.
References
- Wang, J. The impact of river network enclosed fields and Yellow-Huai River Basin management in the Yangtze River Delta Region on national sustainable development. Jianghan Forum. 2023, 120–124. [Google Scholar] [CrossRef]
- Kadlec, R.H. The inadequacy of first-order treatment wetland models. Ecol. Eng. 2000, 15, 105–119. [Google Scholar] [CrossRef] [Scilit]
- Maina, C.W.; Mutua, B.M.; Oduor, S.O. Simulation of constructed wetland treatment in wastewater polishing using PREWet model. Desalination Water Treat. 2012, 41, 356–363. [Google Scholar] [CrossRef] [Scilit]
- Giraldi, D.; de Michieli Vitturi, M.; Iannelli, R. FITOVERT: A dynamic numerical model of subsurface vertical flow constructed wetlands. Environ. Model. Softw. 2010, 25, 633–640. [Google Scholar] [CrossRef] [Scilit]
- Ouyang, Y.; Luo, S.M.; Cui, L.H. Estimation of nitrogen dynamics in a vertical-flow constructed wetland. Ecol. Eng. 2011, 37, 453–459. [Google Scholar] [CrossRef] [Scilit]
- Wen, Y.; Zhou, Q. Horizontal subsurface flow constructed wetland model. J. Appl. Ecol. 2007, 18, 456–462. [Google Scholar]
- Langergraber, G. Simulation of subsurface flow constructed wetlands—Results and further research needs. Water Sci. Technol. 2003, 48, 157–166. [Google Scholar] [CrossRef] [Scilit]
- Chavan, P.V.; Dennett, K.E. Wetland simulation model for nitrogen, phosphorus, and sediments retention in constructed wetlands. Water Air Soil Pollut. 2008, 187, 109–118. [Google Scholar] [CrossRef] [Scilit]
- Almeida, A.; Ribeiro, C.; Carvalho, F.; Durao, A.; Bugajski, P.; Kurek, K.; Pochwatka, P.; Józwiakowski, K. Phytoremediation potential of Vetiveria zizanioides and Oryza sativa to nitrate and organic substance removal in vertical flow constructed wetland systems. Ecol. Eng. 2019, 138, 19–27. [Google Scholar] [CrossRef] [Scilit]
- Xu, P.; Xiao, E.R.; He, F.; Xu, D.; Zhang, Y.; Wang, Y.F.; Wu, Z.B. High performance of integrated vertical-flow constructed wetland for polishing low C/N ratio river based on a pilot-scale study in Hangzhou, China. Environ. Sci. Pollut. Res. 2019, 26, 22431–22449. [Google Scholar] [CrossRef] [Scilit]
- Ganser, G.H.; Hewett, P. Models for nearly every occasion: Part II—Two box models. J. Occup. Environ. Hyg. 2017, 14, 58–71. [Google Scholar] [CrossRef] [Scilit]
- Wang, N.M.; Mitsch, W.J. A detailed ecosystem model of phosphorus dynamics in created riparian wetlands. Ecol. Model. 2000, 126, 101–130. [Google Scholar] [CrossRef] [Scilit]
- Kumar, J.L.G.; Wang, Z.Y.; Zhao, Y.Q.; Babatunde, A.O.; Zhao, X.H.; Jórgensen, S.E. STELLA software as a tool for modelling phosphorus removal in a constructed wetland employing dewatered alum sludge as main substrate. J. Environ. Sci. Health Part A 2011, 46, 751–757. [Google Scholar] [CrossRef] [Scilit] [PubMed]
- Jeyakumar, L.; Zhao, Y.Q.; Hu, Y.S.; Babatunde, A.; Zhao, X.H. Modelling high rate p-removal in a two-stage pilot scale alum sludge based constructed wetland system. Environ. Eng. Manag. J. 2019, 18, 359–366. [Google Scholar] [CrossRef] [Scilit]
- Ouyang, Y. Modeling the mechanisms for uptake and translocation of dioxane in a soil-plant ecosystem with STELLA. J. Contam. Hydrol. 2008, 95, 17–29. [Google Scholar] [CrossRef] [Scilit]
- Ouyang, Y.; Feng, G.; Renninger, H.; Leininger, T.; Parajuli, P.; Grace, J. A STELLA-Based Model to Simultaneously Predict Hydrological Processes, N Uptake and Biomass Production in a Eucalyptus Plantation. Forests 2021, 12, 515. [Google Scholar] [CrossRef] [Scilit]
- Naimi, B.; Voinov, A. StellaR: A software to translate Stella models into R open-source environment. Environ. Model. Softw. 2012, 38, 117–118. [Google Scholar] [CrossRef] [Scilit]
- He, P.R.; Ma, T.; Ding, J.H.; Wang, Y.Y.; Liu, F.; Yu, S.E. Analysis of optimal water surface ratio based on flood control, drought resistance, and water ecological requirements. Jiangsu Water Resour. 2022, 20–25. [Google Scholar] [CrossRef]
- Kim, T.I.; Kim, H.; Han, M.; Park, H. Quantitative evaluation of the urban water cycle: Definition and use of the water cycle area ratio. Ain Shams Eng. J. 2024, 15, 102786. [Google Scholar] [CrossRef] [Scilit]
- Liu, Y.C. Investigation of Factors Affecting the Operational Performance of Surface-Flow Constructed Wetlands and Comparison of Pollutant Removal Kinetic Models; WuHan University: Wuhan, China, 2021. [Google Scholar]
- Jiangsu Provincial Department of Water Resources. Jiangsu Rural Water Conservancy, 1st ed.; China Water & Power Press: Beijing, China, 2020; p. 313. [Google Scholar]
- GB 3838-2002; Environmental Quality Standards for Surface Water. Ministry of Ecology and Environment of the People’s Republic of China: Beijing, China, 2002.
- Zhang, J.; Zhou, Q.; He, R. Mechanism of nitrogen and phosphorus removal in surface-flow constructed wetlands. Ecol. Environ. 2004, 98–101. [Google Scholar] [CrossRef]
- Xie, L.; Liu, Y.; Zhao, S.; Dai, L.; Zhang, Z.; Zhang, M.; Zhang, Z. How Waterlogged Conditions Influence the Nitrogen Dynamics in a Soil-Water-Plant System: Implications for Wetland Restoration. Water 2021, 13, 2957. [Google Scholar] [CrossRef] [Scilit]
- Ding, X.W.; Xue, Y.; Zhao, Y.; Xiao, W.H.; Liu, Y.; Liu, J.G. Effects of different covering systems and carbon nitrogen ratios on nitrogen removal in surface flow constructed wetlands. J. Clean. Prod. 2018, 172, 541–551. [Google Scholar] [CrossRef] [Scilit]
- Deng, C.G.; Cai, M.K. Research on dynamic models of constructed wetlands. Anhui Agric. Sci. 2007, 4583–4584+4613. [Google Scholar] [CrossRef]
- Barnwell, T.O.; Brown, L.C.; Whittemore, R.C. Importance of field data in stream water quality modeling using QUAL2E-UNCAS. J. Environ. Eng. 2004, 130, 643–647. [Google Scholar] [CrossRef] [Scilit]
- Ahn, C.W.; Mitsch, W.J. Evaluating the use of recycled coal combustion products in constructed wetlands: An ecologic-economic modeling approach. Ecol. Model. 2002, 150, 117–140. [Google Scholar] [CrossRef] [Scilit]
- Brix, H.; Dyhr-Jensen, K.; Lorenzen, B. Root-zone acidity and nitrogen source affects Typha latifolia L. growth and uptake kinetics of ammonium and nitrate. J. Exp. Bot. 2002, 53, 2441–2450. [Google Scholar] [CrossRef] [Scilit]
- McAndrew, B.; Ahn, C. Developing an ecosystem model of a floating wetland for water quality improvement on a stormwater pond. J. Environ. Manag. 2017, 202, 198–207. [Google Scholar] [CrossRef] [Scilit]
- Dong, Y.Y.; Xu, B.; Wang, P.; Hua, Z.L. A wetland nitrogen dynamics model based on stella and R. Chin. Environ. Sci. 2020, 40, 198–205. [Google Scholar] [CrossRef]
- Sajib, A.; Diganta, M.; Moniruzzaman, M.; Rahman, A.; Dabrowski, T.; Uddin, M.; Olbert, A. Assessing water quality of an ecologically critical urban canal incorporating machine learning approaches. Ecol. Inform. 2024, 80, 102514. [Google Scholar] [CrossRef] [Scilit]
- Jiangsu Provincial Department of Water Resources (24 August 2021). Jiangsu Province Water Resources Development Plan for the 14th Five-Year Plan Period. Available online: https://water-patent.hhu.edu.cn/_upload/article/files/79/37/1fab9cbc4fe8a1dab5b0f204f6a5/e93fbb5f-df43-4192-ae9c-06309bd4b097.pdf (accessed on 15 September 2025).
- Chuangtang, W.; Guanghui, W. Agricultural Hydraulic Engineering, 1st ed.; China Hydropower Publishing House: Beijing, China, 2023; p. 358. [Google Scholar]
- Tartero, G.; Krauth, W. Concepts in monte carlo sampling. Am. J. Phys. 2024, 92, 65–77. [Google Scholar] [CrossRef] [Scilit]
- Saurette, D.D.; Biswas, A.; Heck, R.J.; Gillespie, A.W.; Berg, A.A. Determining minimum sample size for the conditioned Latin hypercube sampling algorithm. Pedosphere 2024, 34, 530–539. [Google Scholar] [CrossRef] [Scilit]
- Ouyang, Y.; Zhang, J.E.; Leininger, T.D.; Frey, B.R. A STELLA model to estimate water and nitrogen dynamics in a short-rotation woody crop plantation. J. Environ. Qual. 2015, 44, 200–209. [Google Scholar] [CrossRef] [Scilit]
- Moorman, T.B.; Tomer, M.D.; Smith, D.R.; Jaynes, D.B. Evaluating the potential role of denitrifying bioreactors in reducing watershed-scale nitrate loads: A case study comparing three Midwestern (USA) watersheds. Ecol. Eng. 2015, 75, 441–448. [Google Scholar] [CrossRef] [Scilit]
- Liu, W.X.; Dahab, M.F.; Surampalli, R.Y. Nitrogen transformations modeling in subsurface-flow constructed wetlands. Water Environ. Res. 2005, 77, 246–258. [Google Scholar] [CrossRef] [Scilit]
- Newcomer, M.E.; Kuss, A.J.M.; Ketron, T.; Remar, A.; Choksi, V.; Skiles, J.W. Estuarine sediment deposition during wetland restoration: A GIS and remote sensing modelling approach. Geocarto Int. 2014, 29, 451–467. [Google Scholar] [CrossRef] [Scilit]

Disclaimer/Publisher’s Note: The statements, opinions and data contained in all publications are solely those of the individual author(s) and contributor(s) and not of MDPI and/or the editor(s). MDPI and/or the editor(s) disclaim responsibility for any injury to people or property resulting from any ideas, methods, instructions or products referred to in the content. |
© 2026 by the authors. Licensee MDPI, Basel, Switzerland. This article is an open access article distributed under the terms and conditions of the Creative Commons Attribution (CC BY) license.