Article

Coupling Agricultural Carbon Emission Efficiency and Economic Growth: Evidence from Jiangxi Province, China

1
College of Economic and Management, Henan Agricultural University, Zhengzhou 450046, China
2
Faculty of Humanities and Social Sciences, Macao Polytechnic University, Macao 999078, China
3
School of Economics and Management, Jiangxi Agricultural University, Nanchang 330045, China
4
Research Center for “Agriculture, Rural Areas, and Farmers”, Jiangxi Agricultural University, Nanchang 330045, China
5
School of Humanities and Public Administration, Jiangxi Agricultural University, Nanchang 330045, China
*
Author to whom correspondence should be addressed.
These authors contributed equally to this work.
Sustainability 2025, 17(9), 4246; https://doi.org/10.3390/su17094246
Submission received: 11 March 2025 / Revised: 27 April 2025 / Accepted: 29 April 2025 / Published: 7 May 2025

Abstract

:
Exploring the law and evolution mechanism of coupling and coordination between agricultural carbon emission efficiency (ACE) and agricultural economic growth (AEG) can provide a reference basis for agricultural low-carbon transformation. This study takes 11 cities in Jiangxi Province as the research object; measures the level of ACE based on the panel data from 2008 to 2022; and analyzes the development and influencing factors of the coupling and coordination between ACE and AEG by using the coupling coordination degree model, the Dagum Gini coefficient decomposition method, and the Tobit regression model. The results reveal the following: (1) The overall ACE in Jiangxi Province displays a significant upward trend, with the average efficiency value increasing from 0.172 to 0.624, reflecting an average annual growth rate of 72.43%. Nonetheless, there remains clear regional heterogeneity, characterized by lower efficiencies in Central and Southern Jiangxi compared to the higher efficiencies found in Northern and Western Jiangxi. (2) Despite gradual improvements in regional coordination, the Central and Southern Jiangxi regions still lag Northern and Western Jiangxi in terms of the linked coordination between ACE and AEG, symptoms of which had been previously misaligned. (3) The results of Dagum’s Gini coefficient decomposition show that inter-regional disparities are the main source of overall disparities, with a contribution of 37.43%, which is higher than the synergistic effect of intra-regional disparities and hyper-variable densities, corroborating the core contradiction of uneven development across regions. (4) The Tobit model reveals that government investment, industrial structure optimization, urbanization, and educational attainment exert a significant positive influence on promoting coupling coordination. To establish a scientific basis for achieving a low-carbon agricultural transformation and equitable AEG in Jiangxi Province, this research recommends bolstering regional cooperation, fostering innovations in agricultural science and technology, optimizing the industrial structure, and enhancing farmers’ awareness of low-carbon practices. This study expands the theoretical system of agricultural low-carbon transition in terms of research methods and scales to provide a scientific basis for agricultural provinces to realize agricultural low-carbon transition and balanced economic development.

1. Introduction

The global challenge of climate change, particularly global warming, has reached a level that cannot be ignored. According to the Intergovernmental Panel on Climate Change Sixth Assessment Report, the average temperature of our planet has risen by 1.1 °C over the past century [1]. Increased emissions of greenhouse gases are leading to more severe weather phenomena, posing significant risks to both human societies and natural ecosystems [2]. The concept of “carbon neutrality” emerged in 2018, when the IPCC recommended that net-zero global greenhouse gas emissions be achieved by mid-century as a strategy to effectively combat global climate change [3]. Given that China is the leading carbon emitter, it is actively engaging in international climate governance and has set the goal of “actively and steadily promoting carbon peaking and carbon neutrality” [4], responding to mounting pressures to decrease emissions. In this context, researchers are focusing on the interrelated development of the ecological environment and regional economies.

1.1. Literature Review

Existing studies provide a foundational framework for understanding the relationship between agricultural carbon emission efficiency (ACE) and agricultural economic growth (AEG). Early scholars defined carbon emissions and carbon emission efficiency through the Kaya equation [5] and energy intensity indicators [6], and then the research was gradually extended to the field of agriculture by integrating them into a comprehensive indicator that considers economic growth, resource consumption, and agricultural carbon emissions [7]. In the field of research methodology, scholars have adopted different methods to measure the efficiency of agricultural carbon emissions. Charnes first proposed the data envelopment analysis model to assess the relative efficiency of decision-making units [8]. However, the DEA model was unable to solve the slackness of inputs and outputs, which led to a large bias in the efficiency measurement [9]. In contrast, the super-efficient SBM model has been widely used to analyze the spatio-temporal divergence of ACE in different regions of China by integrating the non-expected outputs and slack optimization [10,11,12,13]. In terms of influencing factors, studies have shown that the labor force size has an inhibitory effect on ACE, while the optimization of agricultural industrial structure and urbanization process can significantly enhance efficiency [14]. Ye pointed out that agro-industrial agglomeration has an inverted U-shape nonlinear effect on agro-environmental efficiency [15]. In addition, the urbanization process [16], AEG [17,18], agricultural tax and fee levels [19], and digital finance [20] have all been shown to be dynamically associated with ACE. It is noteworthy that some studies have pointed out that the evolution of ACE shows significant provincial differences [21]. Therefore, in the exploration of ACE, regional characteristics and spatial correlation should be taken into account [22].
Academics usually measure AEG by the total output value of agriculture, forestry, animal husbandry, and fishery, but it is difficult to reflect the internal differences of the industry and the characteristics of regional resource endowment, which can easily lead to the bias of economic level measurement [3]. For this reason, this study draws on the research results found by Tan [23] and adopts per capita agricultural value added (agricultural value added/agricultural employees) as an indicator for measuring AEG to comprehensively reflect the actual AEG level of the agricultural industry in each region. In the study of the relationship between agricultural carbon emissions and economic growth, scholars have explored the relationship between agricultural carbon emissions and economic growth based on the EKC model [24], the Tapio decoupling model [25], the ARDL-ECM model [26], and the coupled coordination model [3]. The short-term expansion of the agricultural economy may push up carbon emissions, whereas long-term technological innovation and structural optimization significantly inhibit the growth of carbon emissions. By decomposing the drivers of ACE, Cui et al. revealed that the spatial and temporal evolution of agricultural carbon emissions is characterized by a gradient of “high in the east, low in the west, and fast in the north and slow in the south”, which provides a theoretical basis for the analysis of regional heterogeneity [27]. On this basis, Qian et al. introduced a dynamic DEA model to measure provincial efficiency and found that there are also significant spatial differences in the efficiency of agricultural carbon emissions in Chinese provinces. It is worth noting that existing studies began to pay attention to the synergistic relationship between carbon emissions and economic development [28]; Ma et al.’s case study for the Yellow River Basin showed that the inter-provincial coupling coordination degree presents different coupling coordination states [29]; Tian et al. further expanded the research perspective to the dimension of new urbanization, which contributes to the research ideas in this study [3]. Meanwhile, some studies found that the spatial distribution of carbon emission efficiency gradually shifted from decentralization to agglomeration, and its relationship with the agricultural economy also transitioned from weak decoupling to negative decoupling [30]. In addition, the utilization of renewable energy and the promotion of low-carbon technologies can not only alleviate the inhibitory effect of carbon emissions on the agricultural economy [31,32] but also promote sustainable development by enhancing the competitiveness of agricultural exports [33]. Thus, it is necessary to improve low-carbon production technologies, increase renewable energy consumption, and improve agricultural production and ecological conditions in order to realize the goal of sustainable development in the agricultural sector [34].
The relationship between ACE and AEG has been widely discussed in the existing literature, providing an important basis for understanding the transformation and upgrading of modern agriculture in the context of the new era. However, there are still some limitations in the study of ACE and AEG. First, current research focuses more on the relationship between agricultural carbon emissions and economic growth, while relatively little attention is paid to ACE. ACE not only focuses on the total amount of carbon emissions but also considers economic output and environmental factors, which helps to more accurately reveal the impact of agricultural carbon emissions on agricultural economic development. Secondly, current research focuses on large-scale studies, such as national and regional studies, which may overlook local or micro-level correlations due to differences in agricultural management practices in different regions.

1.2. Research Problems

Jiangxi Province is an important ecological barrier and agricultural province in China, with rich natural resources and ecological advantages, and its agricultural structure and carbon emissions also have significant uniqueness, which provides an ideal research sample for analyzing the mechanism of low-carbon transition in agriculture. The rice sowing area in Jiangxi Province ranks among the top three in the country, and methane emissions from rice cultivation account for more than 50% of the total agricultural greenhouse gases [25], while compared with Hunan Province, which is also a major rice-producing area, Jiangxi Province has a higher fertilizer application per unit of production, resulting in lower carbon emission efficiency [35], and this “high-carbon lock” phenomenon is closely related to the crude production model. This high-carbon lock-in is attributed to inefficient traditional production practices. Despite the implementation of the “river chief system” [36] and the ecological compensation mechanism [37], the shrinking of wetland area [38] and agricultural surface pollution [39] still constrain the green development of Jiangxi Province [40]. In addition, there are significant differences in the agricultural structures of the 11 district cities in the province, leading to prominent spatial heterogeneity in ACE [41]. Therefore, clarifying the synergistic law of ACE and AEG in Jiangxi Province is both an urgent need for regional low-carbon development and an important supplement to improve small- and medium-scale studies.
This study aims to address the following scientific questions: first, what is the spatio-temporal divergence pattern of ACE in Jiangxi Province? Second, does the coupled and coordinated relationship between ACE and AEG in Jiangxi Province show dynamic evolution? Third, what are the main sources of spatial differences in the coupled coordination of ACE and AEG in Jiangxi Province? Fourth, what are the external factors limiting the coordinated development between the two systems?

1.3. Research Objectives

This study takes Jiangxi Province as the research object and takes 2008–2022 as the research period to explore the coupling and coordination relationship between ACE and AEG in Jiangxi Province. The specific research contents are as follows: first, we quantify the spatial and temporal differentiation characteristics of ACE by using the super-efficiency SBM model; second, we explore the coupling and coordination level and spatial and temporal characteristics between ACE and AEG by means of the coupling and coordination model; third, we combine with the Dagum Gini coefficient to further decompose the spatial differences, and explore the sources of differences in the level of coupling and coordination; fourth, we identify the coupling and coordination relationship between ACE and AEG by means of the Tobit model. Fourth, the Tobit model is used to identify the external factors affecting coupled and coordinated development and propose a balanced development path for regional low-carbon agriculture. Figure 1 presents the research roadmap, outlining the study’s investigative trajectory and key methodological milestones.
Compared with the established literature, the innovations are reflected in two aspects: (1) revealing the coupling and coordination law between ACE and AEG in 11 cities in Jiangxi Province, making up for the shortcomings of the existing research on the provincial scale, filling the gap of spatial heterogeneity research, and providing a more detailed empirical basis for understanding the regional characteristics of the relationship between ACE and AEG; (2) this study introduces the Dagum Gini coefficient decomposition method into the study of the coupling and coordination relationship between ACE and AEG in order to clarify the three major sources of spatial differences. The Dagum Gini coefficient decomposition method is used in the study of the coupled and coordinated relationship between ACE and AEG in order to clarify the three major sources of spatial differences, which not only provides a scientific tool for in-depth analysis of the spatial differentiation of the coupled and coordinated relationship between the regions but also provides an important methodological reference for the future study of coordinated development in the region, which has strong theoretical and practical value.

2. Methodology and Data Source

2.1. Data Sources

This study takes 11 district cities in Jiangxi Province as the research object. Based on the principles of geographic proximity, similarity of resource endowment, and continuity of administrative divisions, this study divides them into four major regions: North Jiangxi (Nanchang and Jiujiang), Northeast Jiangxi (Shangrao, Jingdezhen, and Yingtan), West Jiangxi (Yichun, Pingxiang, and Xinyu), and Central–South Jiangxi (Ganzhou, Ji’an, and Fuzhou), corresponding to the main functional area positioning of the collaborative belt of the city clusters in the middle reaches of the Yangtze River, the node area of the Shanghai–Kunming Economic Corridor, the demonstration area of the transformation of the Xiang–Gan border, and the revitalization belt of the former Central Soviet Union. It corresponds to the positioning of the main functional zones, such as the collaborative belt of city cluster in the middle reaches of Yangtze River, the node area of Shanghai–Kunming Economic Corridor, the demonstration area of transformation of Xiang–Gan Border, and the revitalization belt of the former Central Soviet Region. The study period is 2008–2022. China Statistical Yearbook, Jiangxi Statistical Yearbook, and the statistical bulletin of national economic and social development of each prefectural-level city are the primary sources of the indicator data used in the study, which primarily consist of ACE, AEG, and their influencing factors. Some of the residual values were supplemented using interpolation. In this study, the linear interpolation algorithm was utilized in the data preprocessing stage to interpolate the missing values to ensure the accuracy and reliability of the data.

2.2. Agricultural Carbon Efficiency

ACE is a comprehensive indicator of agricultural carbon emissions and agricultural economic growth [42], and its measurement needs to consider the dual attributes of desired outputs (economic value) and non-desired outputs (environmental costs). Traditional DEA models may have limitations in dealing with non-desired outputs, making it difficult to effectively identify inefficiencies due to non-desired outputs. And although the GML index can capture the dynamic characteristics of productivity, it is unable to decompose the components of efficiency over a specific time period [43]. In contrast, the Super-SBM model can effectively solve the problems of neglecting slack variables in the radial model and the inability to rank the efficiency values by restricting them to the [0, 1] interval. This model is closer to practical applications and thus has been widely used in the assessment of carbon emission efficiency [44].
Based on the economic growth theory and drawing on Wang’s study [45], this study, combined with the characteristics of agricultural development in Jiangxi Province, utilizes the super-efficient SBM model to construct an ACE evaluation system covering production inputs, desired outputs and non-desired outputs. The construction of the specific index system contains three dimensions: (1) the production inputs are selected as core factors, such as labor, land, water resources, fertilizers, pesticides, etc., reflecting the characteristics of the allocation of agricultural production factors and that the selection of the indicators passed the robustness check; (2) the desired outputs characterize the economic efficiency by the total agricultural output value; (3) the non-desired outputs use the agricultural carbon emissions to characterize the environmental load. Agricultural carbon emissions are calculated as the product of the quantity of agricultural inputs (fertilizers, pesticides, agricultural films, agricultural machinery, land tilling, and effective irrigated area) and its carbon emission coefficient. The specific indicator system is shown in Table 1.
The expression is
ρ = min 1 + 1 m i = 0 m s i x x i 0 1 1 s 1 + s 2 k = 1 s 1 s k y y k 0 + l = 1 s 2 s l z z l 0
s .   t .   x i 0 j = 1 n λ j x j s i x , i ; y k 0 j = 1 n λ j y j + s k y , k ; z l 0 j = 1 n λ j z j s l z , l 0   1 1 s 1 + s 2 k = 1 s 1 s k y y k 0 + l = 1 s 2 s l z z l 0 > 0 s i x 0 ,   s k y 0 , s l z 0 ,   λ j 0 ,   i , j , k , l
where ρ is the ACE; x i 0 , y k 0 , and z l 0 stand for input factors, desired output, and non-desired output, respectively; s i x , s k y , and s l z indicate input factor slack variables, desired output, and non-desired output, respectively; λ j is the intensity variable; m, s 1 , s 2 are the number of input indicators, desired output indicators, and non-desired output indicators, respectively; and λ is the vector of weights.
This study builds an agricultural carbon emission evaluation system from three aspects of agricultural production—inputs, desired outputs, and non-desired output elements—based on the economic growth theory and prior research [43], as well as the features of agricultural development in Jiangxi Province. This essay makes the case that three factors, such as labor input, land input, and agricultural input, ought to be included in agricultural input indicators. Table 1 displays the evaluation index system.

2.3. Coupled Coordination Model

The coupling and coordination model is used as an analytical tool to measure the level of interaction and coordination development between two or more systems [46]. Among them, coupling degree is an indicator to measure the strength of interactions between systems, coordination degree is a further measure of inter-systems based on coupling degree, while coordination is a coordinated and cooperative, virtuous cycle relationship between systems or elements [47,48]. Compared with the traditional coupling degree model and single-indicator evaluation model, it can simultaneously quantify the strength of interactions between systems and the overall level of coordinated development, thus reflecting the synergistic relationship between the economy and society and the ecosystem in a more comprehensive and dynamic way [49]. Therefore, this study adopts the coupling coordination degree model to explore the coupling relationship between ACE and AEG in Jiangxi Province. The following formula is used for calculation:
C = U 1 × U 2 ( U 1 + U 2 ) 2 2 1 2
The degree of coupling, denoted by C, has a value range of [0, 1]. The higher its value, the more correlated the two systems are conversely, and less interaction between the systems is indicated. This study presents the coordinated development degree model, whose computation formula is as follows, to examine the total coordination more thoroughly between the systems:
D = C · T
T = U 1 α + U 2 β
where α and β are the coefficients to be found, T is the system’s comprehensive evaluation index, D is the degree of coordinated development, and the sum of the two is 1. Given the significance of the ecological environment to AEG, the two are set to α , β = 1 / 2 , respectively, in the evaluation process because they both support and constrain one another. To analyze the evolution of their coupling coordination, the degree of coupling coordination is simultaneously separated into the five levels listed below (refer to Table 2).

2.4. Dagum Gini Coefficient Decomposition Method

The Dagum Gini coefficient decomposition is a statistical method that decomposes overall income inequality into within-group differences, between-group differences, and hyper variance density. Among them, the within-group disparity reflects the differences within the same group, the between-group disparity reflects the average differences between different groups, and the hyper variance density reflects the differences in the overlapping parts of the groups. Compared with Theil’s index, which was mostly used in earlier studies [50], Dagum’s Gini coefficient decomposition method overcomes the limitations of the subgroup overlap problem by introducing an index of the degree of net difference between subgroups [51] and is able to analyze the differences in the intra-region, inter-region, and hyper variance densities of the Yangtze River Economic Belt in a clearer way. In order to examine the spatial variations in the coupled coordination degree of ACE and AEG, as well as its causes, this research uses the Dagum Gini coefficient decomposition approach. The formula is as follows:
G = 1 2 n 2 D ¯ j j = 1 k h = 1 k i = 1 n j r = 1 n h D j i D h r
D j i ( D h r ) is the coupled coordination degree of ACE and AEG of any district city in the j (h) region, n j ( n j ) is the number of district cities in the j (h) region, D j i ( D h r ) is the mean value of the coupled coordination degree of ACE and AEG, and G is the overall Gini coefficient.
G j j = 1 2 n j 2 D ¯ j i = 1 n j r = 1 n j D j i D h r
G j h = i = 1 n j r = 1 n h D j i D h r n j n h D ¯ j + D ¯ h
The overall Gini coefficient is broken down into the intra-region Gini coefficient contribution ( G w ) and the inter-region Gini coefficient contribution ( G b ) as follows: D ¯ j and D ¯ h are the mean values of the coupled coordination degree of ACE and AEG in the region. D ¯ j is defined as being larger than D ¯ h .
G w = j = 1 k G j j p j s j
G b = j = 2 k h = 1 j 1 G j h ( p j s h + p h s j )
G = G w + G b
In the formula, p j = n j / n , s j = n j D ¯ j / n D ¯ , the two parts are the proportion of the number of cities in the region and the proportion of the value of the coupling degree of coordination, respectively, and the product of the two indicates the regional Gini coefficient weight.
The net value of the contribution of the inter-regional Gini coefficient must be determined since the contribution contains a cross-term. The formula for this calculation is as follows:
T j h = t j h p j h t j h + p j h
t j h = 0 0 y ( y x ) d F h ( x ) d F j ( y )
p j h = 0 0 y ( y x ) d F j ( x ) d F h ( y )
In the formula, T j h is the relative difference between the coupled coordination of ACE and AEG between the two regions j and h, t j h is the difference between the coupled coordination of ACE and AEG between the two regions j and h, and p j h is the hypervariable first-order moment. Based on this, the inter-regional Gini coefficient contribution G b is decomposed into the net inter-regional Gini coefficient contribution G n b and the hypervariable intensity contribution G t . The specific formula is as follows:
G n b = j = 2 k h = 1 j 1 G j h ( p j s h + p h s j ) T j h
G t = j = 2 k h = 1 j 1 G j h ( p j s h + p h s j ) ( 1 T j h )
In conclusion, the total Gini coefficient can be broken down into
G = G w + G n b + G t

2.5. Tobit Model

Tobit regression analysis is a statistical model used to analyze binary dependent variables, which can flexibly deal with various types of independent variables and has good interpretability for outliers and non-normally distributed data [52]. In contrast, the least squares method used to explore the relationship between the coupled coordination degree of the two systems and the external factors is prone to bias in the parameter estimates [53]. Therefore, in this study, the Tobit model is chosen to solve the problem of restricted dependent variables to explore the external factors affecting the coupled and coordinated development of ACE and AEG. The explanatory variable of this study is the measured coupling coordination level of ACE and AEG, which is a restricted variable. The coupling coordination level is not only affected by economic factors but also by agricultural production conditions and social factors and plays an increasingly important role in modern agricultural production. Based on the existing research results [45] and the availability of data, this paper summarizes the factors affecting the level of coupled coordination into six aspects, including government input, education level, agricultural industry structure, energy use, living standard, and urbanization level. The formula for calculation is
Y = Y i = β 0 + β T X i + ε i , Y > 0 0 , Y 0
The dependent variable’s size for the ith variable, the explanatory variable for the ith variable, a vector of intercept terms, a vector of unknown parameters, and an independent, normally distributed random error term are all included. Table 3 provides a detailed breakdown of the variables selected for inclusion in this study.

3. Results and Analysis

3.1. An Examination of the State of ACE at the Moment

Using Matlab software, the ACE of Jiangxi Province from 2008 to 2022 was calculated using the ACE evaluation index system. The ACE was then classified into five grades: low, low, general, high, and high.
In Table 4, it is easy to find that the change of the mean value of ACE in the main years of the province shows a continuous upward trend, and the ACE from 2008, 2012, 2018, and 2022 are 0.172, 0.241, 0.422, and 0.624, respectively, with a growth rate as high as 72.433% in the examination period. This indicates that the overall ACE is rising with an accelerating trend. The improvement in ACE cannot be separated from the government’s policy support; for example, through the implementation of the rice planting subsidy policy, the government promotes the effective supply of high-quality rice on the one hand, and on the other hand, it also optimizes the structure of agricultural planting and enhances the efficiency of agricultural production. In 2015, the government of Jiangxi Province explicitly proposed that it should vigorously push forward the water-saving and emission reduction project and resolutely curb the over-exploitation of agricultural resources and other behaviors. The implementation of these initiatives indirectly improved the efficiency of AC. Overall, the growth rate of ACE in Jiangxi Province has improved, but it is still in an inefficient state, and there exists a large potential for emission reduction. At present, Jiangxi Province has issued a series of policy documents, such as “Deepening the construction of the National Ecological Civilization Pilot Area to build a higher standard to create a beautiful China ‘Jiangxi Model’ Planning Outline (2021–2035)”, which provides a systematic guarantee for the improvement in ACE in the future and promotes the development of agriculture in the direction of green and low-carbon development.
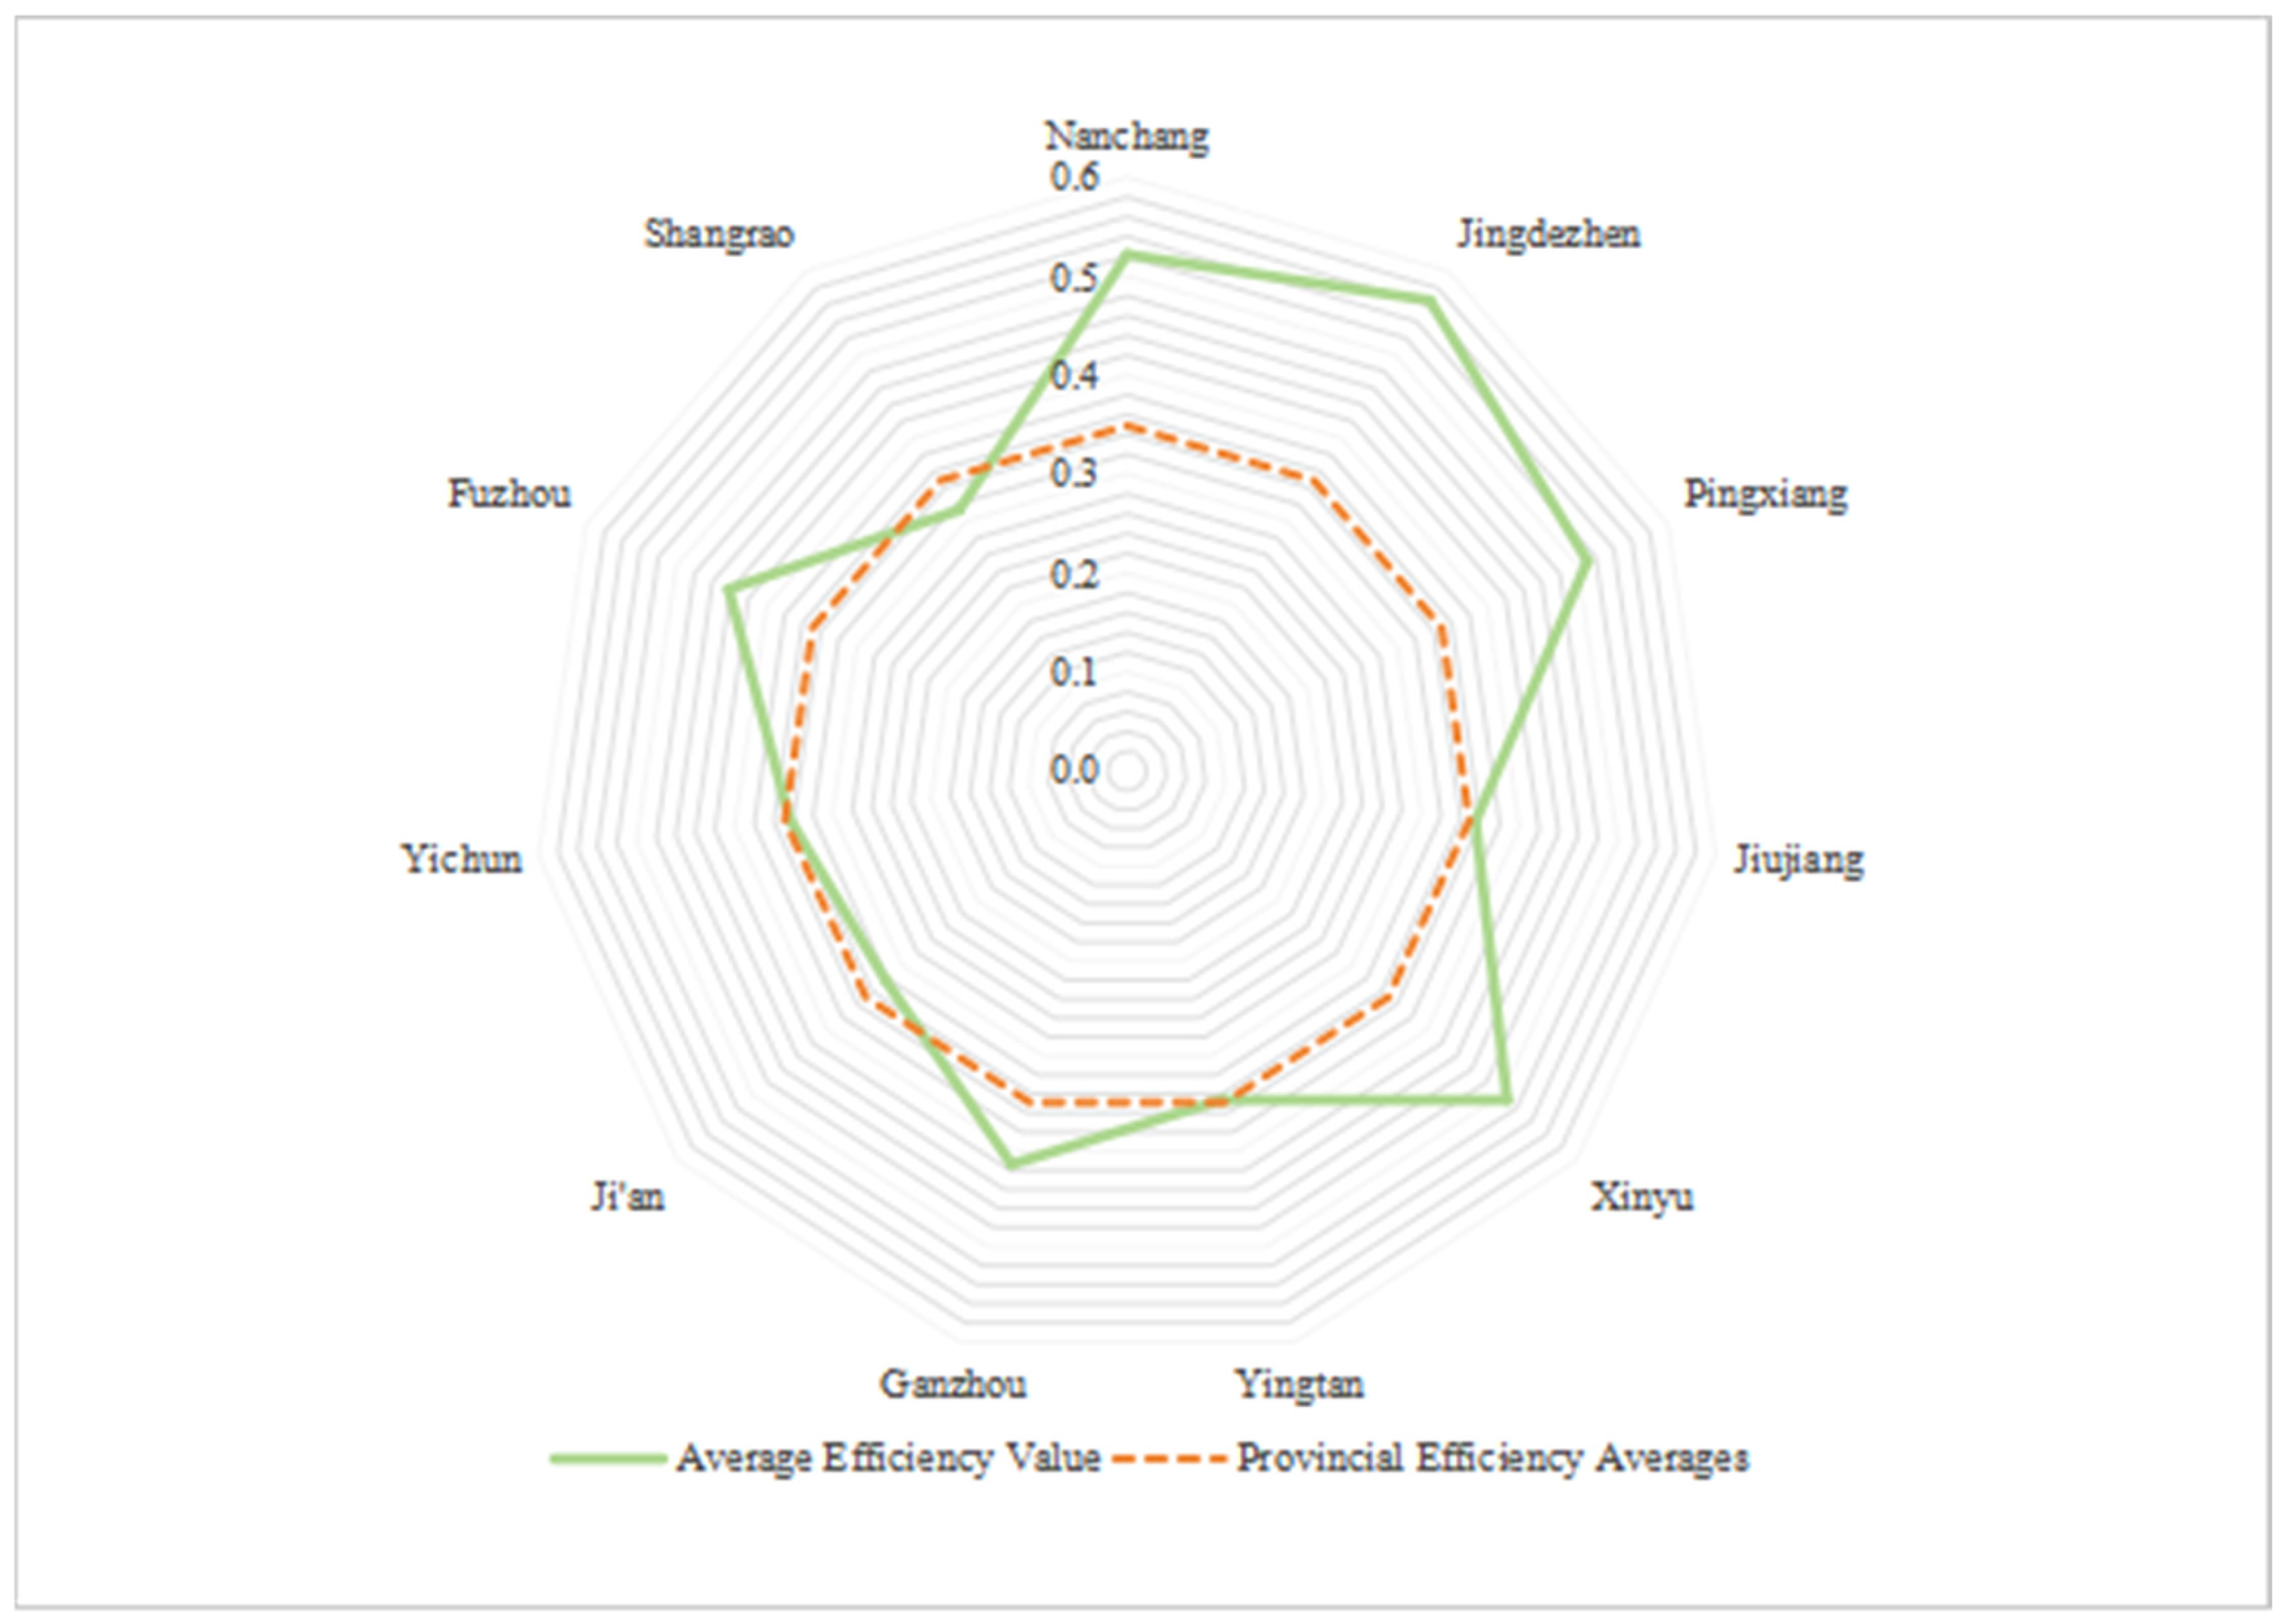
Figure 2 demonstrates the average value of ACE in each district and city in Jiangxi Province. It is not difficult to find that most of the ACE values of the 11 district cities in Jiangxi Province are below 0.5, from 2008 to 2022, which indicates an inefficient state. Among them, the highest average value is that of Jingdezhen, with an efficiency value of 0.565, which may be attributed to its active exploration in the green development of agriculture. Jingdezhen vigorously promotes green agriculture and a recycling economy, on the one hand, through the implementation of the “Zero Growth of Fertilizers” action [54] to reduce carbon emissions from agricultural inputs, and on the other hand, focuses on the innovation of agricultural science and technology and promotes intelligent greenhouse bases. On the other hand, it focuses on agricultural science and technology innovation, promotes the landing of intelligent greenhouse bases, promotes high-efficiency water-saving irrigation technology, and optimizes the structure of agricultural cultivation, which effectively improves the ACE. The average value of ACE in Shangrao City is relatively low, only 0.313, mainly due to its relatively traditional agricultural industrial structure and production mode, extensive grain cultivation area, and large use of fertilizers, pesticides, and other traditional agricultural materials, which leads to higher carbon emissions. In addition, the agricultural infrastructure in some areas of the city is relatively weak, and it is difficult to promote green technologies such as water-saving irrigation, so the potential for agricultural carbon emission reduction has not yet been fully tapped. In addition, Shangrao is located in a hilly and mountainous area, where the land is barren and requires large amounts of fertilizers and agricultural irrigation to support agricultural production, which in turn leads to a rise in AC.
For brevity, this study visualizes key years (2008, 2012, 2018, and 2022) in Figure 3. From the perspective of regional spatial distribution, there are obvious differences in carbon emission efficiency among the cities in Jiangxi Province, and the overall distribution is characterized by a gradual decrease from west to east and from south to north. The West Jiangxi city cluster has promoted the low-carbon development of agriculture due to the support of agricultural high-tech industry and precise agricultural inputs. Meanwhile, North and Northeast Jiangxi, relying on superior natural resource endowment, have less demand for agricultural production factors and relatively higher ACE in agricultural production. In contrast, Central and Southern Jiangxi are mainly mountainous and hilly, with barren and scattered land, which is not conducive to large-scale mechanized farming, relying more on traditional manpower and animal power, and with a greater demand for agricultural materials, thus leading to a lower ACE. In terms of absolute value analysis, nine cities in Jiangxi province have achieved high or high levels of ACE in 2022, accounting for about 81.818% of the total number of cities in the province. These data indicate that the overall ACE in the region has significantly improved, and the practice of low-carbon agricultural production has achieved positive results.

3.2. Analysis of the Coupled Harmonization of ACE and AEG

According to the coupled coordination degree model, the coordinated relationship between ACE and AEG in each district and city in Jiangxi Province was measured from 2008 to 2022 (Figure 4). From the perspective of the province, the coupled coordination degree of ACE and AEG in Jiangxi Province shows an increasing trend during the examination period, with a mean value of 0.461, increasing from 0.190 in 2008 to 0.730 in 2022, based on the coupled coordination degree level division, i.e., it develops from the stage of serious disorders to the stage of intermediate coordination, indicating that the transformation of the province’s agricultural modernization has achieved greater success, but there is also greater room for progress. In terms of regional differences, the coupling coordination degree is higher in Northern Jiangxi, followed by Western Jiangxi, and relatively lower in Central–Southern Jiangxi and Northeastern Jiangxi. The coupling and coordination degree between ACE and AEG in Jiangxi Province shows a decreasing trend from east to west and from north to south.
As can be seen in Figure 4, in 2022, the coupling coordination degrees of Xinyu and Nanchang are 0.986 and 0.916, respectively, which are at the level of high-quality coordination, indicating that the efficiency of their ACE and AEG has achieved synergistic development, and the economic development and regional ecology have achieved simultaneous improvement. Specifically, Xinyu City has improved the efficiency of its agricultural carbon emissions by optimizing its agricultural industrial structure. Nanchang, on the other hand, realized a win–win situation between AEG and ecological protection by strengthening agricultural science and technology innovation and green agricultural development. Jingdezhen, Fuzhou, and Yingtan follow in the third, fourth, and fifth places, with coupling coordination degrees of 0.882, 0.848, and 0.811, respectively. Jingdezhen enhances the efficiency of agricultural carbon emissions through the development of eco-tourism and green agriculture, Fuzhou City enhances the efficiency of agricultural carbon emissions through the development of three-dimensional agriculture, and Yingtan City enhances the efficiency of agricultural carbon emissions through the promotion of low-carbon planting technology and other diversified strategies. Meanwhile, Jiujiang, Ganzhou, Yichun, and Pingxiang have coupling harmonization degrees between 0.76 and 0.8, with greater progress during the examination period. Among them, Jiujiang City improves the ACE by promoting planting methods with low farm inputs, Ganzhou City develops specialty and ecological agriculture to achieve coordinated economic and ecological development, Yichun City promotes organic agriculture and ecological planting techniques to enhance agricultural output and reduce carbon emissions, and Pingxiang City strengthens the construction of agricultural infrastructure and the promotion of water-saving irrigation techniques to improve the sustainability of agricultural production. Together, these initiatives have contributed to the green transformation and sustainable development of agriculture in the region.
Comparatively speaking, the coupling coordination degree of Shangrao and Ji’an needs to be improved, and their coupling coordination degrees are still in the primary coordination stage, with a coupling coordination degree of 0.66 and 0.657, respectively. Compared with 2008, the coupling coordination degree of the 11 cities in the region has increased significantly and realized a hierarchical leap. Among them, Jinjiang has the largest improvement, with an increase of 87.421% in the coupling coordination degree, followed by Shangrao, Ganzhou, and Yingtan, with increases of 80.909%, 78.742%, and 78.052%, respectively. Xinyu, Jingdezhen, and Nanchang saw relatively small increases of 60.953%, 64.505%, and 65.502%, respectively. In terms of tier leaping, Yingtan realized a four-level leap, while all other municipalities, except Ji’an, realized a three-level leap, and Ji’an realized a two-level leap. According to the evaluation results of the coupling coordination level division, it can be seen that as of 2022, six cities, Nanchang, Jingdezhen, Pingxiang, Xinyu, Yingtan, and Fuzhou, have achieved high-quality coupling coordination, and all of them are economically lagging; a total of five cities, Jiujiang, Ganzhou, Ji’an, Yichun, and Shangrao, are well coordinated, and all of them are economically lagging. The coupling coordination of each district city in Jiangxi Province in 2022 reached good coordination and greater, and the overall situation is much better than that in 2008. By reviewing the economic development data and carbon emission data of the cities in Jiangxi Province, it can be seen that the root causes of the failure to synchronize the development of the cities vary: in 2008, the lower degree of coupling coordination of the cities in Jiangxi Province can be attributed to the lagging level of the development of the agricultural economy, while the increase in the degree of coupling coordination in 2022 is more limited by the ACE.
Figure 5 demonstrates a significant upward trend in Jiangxi’s level of coupled coordinated development from 2008 to 2022. The coordination level in the study period is shown in Table 2. Specifically, it seems that the coupling coordination degree of five cities, Yichun, Yingtan, Ganzhou, Shangrao, and Jiujiang, is 0.185, 0.178, 0.169, 0.126, and 0.100, respectively, in 2008, which is lower than 0.200, and is in the stage of serious dislocation, and that the coupling coordination degree of Xinyu, Nanchang, Jingdezhen, Pingxiang, Fuzhou, and Ji’an is 0.385, respectively, 0.316, 0.301, 0.252, 0.235, and 0.213, respectively, which is in the intermediate dissonance stage. From the perspective of regional distribution, most of the cities with a low level of coordinated development are in hilly areas. The level of economic development in these areas is relatively lagging behind, and due to the limitations of natural resources, the scale and mechanization of agricultural operations are insufficient, resulting in their coupling coordination level being in a dysfunctional state. In 2012, the coupling coordination degree grade of many cities improved, among which Xinyu’s coupling coordination degree improved to 0.643, where the grade jumped from primary dysfunctional to intermediate coordination, and Nanchang, Jingdezhen, Pingxiang, and Fuzhou were upgraded from primary dysfunctional to intermediate coordination, which is worthy of attention. Regarding intermediate coordination, it is noteworthy that the coupling coordination degree of Jiujiang, Yingtan, Ganzhou, Ji’an, Yichun, and Shangrao, a total of six municipalities, is lower than 0.400, and is still in the stage of primary dysfunction. The lagging of agricultural surface pollution management due to high agricultural inputs in these areas is the main constraint. In 2018, the coupling coordination degree of all the cities was greater than 0.400, and the coordination level was also raised to endangered dislocation and greater, among which Nanchang, Jingdezhen, Pingxiang, Xinyu, Yingtan, and Fuzhou were in the intermediate coordination stage, while Jiujiang, Ganzhou, Ji’an, Yichun, and Shangrao were in the endangered dislocation stage. This indicates that the transformation and development of green and low-carbon industries in Jiangxi Province has achieved certain results, and the scale operation of agriculture and per capita efficiency output have been improved, which in turn enhances the ACE and the level of AEG. In 2022, the coupling coordination degrees of Nanchang, Xinyu, Jingdezhen, Yingtan, Fuzhou, and Pingxiang were 0.916, 0.986, 0.848, 0.811, 0.882, and 0.800, respectively. These were further upgraded to the high-quality coordination stage, and the coupling coordination degrees of Jiujiang, Ganzhou, Yichun, Ji’an, and Shangrao were 0.795, 0.795, 0.760, 0.657, and 0.660, all in the medium coordination stage. The effectiveness of this stage mainly stems from the government’s emphasis on improving the quality and efficiency of the agricultural industry, as well as the strong support of relevant complementary policies, which promote the synchronization of the ACE and AEG.

3.3. Regional Differences and Sources of Coupled Coordination of ACE and AEG in Jiangxi Province

This study utilizes the Dagum Gini coefficient and decomposition method to measure the overall differences and sources of the coupled coordination level of ACE and AEG in Jiangxi Province from 2008 to 2022.

3.3.1. Regional Differences in the Level of Coordination Between ACE and AEG Coupling in Jiangxi Province

The Gini coefficients and contribution rates of the coupled and coordinated level of ACE and AEG in Jiangxi Province are shown in Table 5, and the changes in the Gini coefficients of the four major regions in Jiangxi Province are displayed in Figure 6. It is not difficult to find that the overall Gini coefficient of the level of coupling and coordination of ACE and AEG in Jiangxi Province during the examination period is reduced from 0.205 in 2008 to 0.064 in 2022—a reduction of up to 68.78%, indicating that the regional differences in the coupling and coordination of ACE and AEG in Jiangxi Province generally show a decreasing trend. In terms of the size of the difference, the difference is the largest in Northern Jiangxi, followed by Northeastern Jiangxi and Northwestern Jiangxi, and the smallest in Southern Jiangxi. In terms of the trend of the difference, the Gini coefficient of North Jiangxi, Northeast Jiangxi, and Northwest Jiangxi shows a decreasing trend, and the Gini coefficient of Central and South Jiangxi is relatively stable and does not float much, indicating that the regional differences in the level of the coupling and coordination of the ACE and AEG in Jiangxi Province are gradually narrowing, but there still exist certain spatial differentiation characteristics.
From the perspective of the change process of the coupled coordination level of ACE and AEG in the four major regions of Jiangxi Province, the Gini coefficient of the Northern Jiangxi region shows a continuously decreasing trend (Figure 5). West Jiangxi and Northeast Jiangxi are like the overall change process, showing a continuous decrease in the early period and a slight rebound in 2022. The overall Gini coefficient and the Gini coefficients of West Jiangxi and Northeast Jiangxi all peaked in 2008 at 0.160, 0.162, and 0.193, respectively, and reached a minimum in 2021 at 0.060, 0.038, and 0.049, respectively, and then rebounded to 0.064, 0.059, and 0.054 in 2022. The Gini coefficient of North Jiangxi peaked in 2008 at 0.260, and then rebounded slightly in 2022. Then, affected by economic fluctuations, it had a roseshaped trend of change, with the Gini coefficient decreasing from the peak of 0.071 in 2008 to 0.032 in 2017, and then, affected by economic fluctuations, the Gini coefficient rose to 0.064 in 2022.
Table 6 characterizes the changes in the Gini coefficient of the coupled coordination level of ACE and AEG in Jiangxi Province. Among these, Figures a–e respectively depict the conditions across distinct geographical regions of Jiangxi Province. Examining the Gini coefficient change patterns of Northeast Jiangxi–North Jiangxi, Northeast Jiangxi–North Jiangxi–West Jiangxi, Northeast Jiangxi–Central–South Jiangxi, Central–South Jiangxi–North Jiangxi, Central–South Jiangxi–West Jiangxi, and North Jiangxi–North Jiangxi–West Jiangxi, they are relatively similar. The Gini coefficients of Northeast Jiangxi, Central–South Jiangxi, West Jiangxi, and North Jiangxi are all in a declining trend. By region, the Gini coefficient of Northeast Jiangxi–Central–South Jiangxi decreased from 0.171 to 0.063, the Gini coefficient of Northeast Jiangxi–North Jiangxi decreased from 0.264 to 0.065, and the Gini coefficient of Northeast Jiangxi–North Jiangxi–West Jiangxi decreased from 0.229 to 0.074, and all of these decreases were significant, indicating that the Gini coefficient of Northeast Jiangxi and the other regions of the province is decreasing. The Gini coefficient of the South–Central Jiangxi–Northern Jiangxi region decreased from 0.261 to 0.065, and the Gini coefficient of the South–Central Jiangxi–Western Jiangxi region decreased from 0.179 to 0.076, indicating that the difference between the South–Central Jiangxi and Western Jiangxi regions is significantly narrowed. In addition, the Gini coefficient of the Northern Jiangxi–Western Jiangxi region decreased from 0.272 to 0.056, indicating that the difference between the Northern Jiangxi–Western Jiangxi regions has significantly narrowed. Overall, the differences in the coupled coordination level of ACE and AEG between regions in Jiangxi Province have significantly narrowed, and regional coordination has gradually improved.

3.3.2. Sources of Regional Differences in the Coupled Coordination Level of ACE and AEG in Jiangxi Province

This study uses the Dagum Gini coefficient decomposition method to break down the overall differences into intra-region differences (G), inter-region differences (Gb), and hypervariable density (Gt) to better investigate the causes of regional variations in the coupled coordination level of ACE and AEG in Jiangxi Province. The largest contributor to the overall variation during the studied period is inter-regional variation, which increased from 31.490% to 37.430% and peaked at 62.200% in 2021. This suggests that the primary cause of the variations in the degree of coordination between the coupling of ACE and AEG in Jiangxi Province is the disparities across the four areas. Hypervariable density is the second-largest contributor to the overall difference, and it is trending downward, with a minimum value of 19.690% in 2021. Furthermore, with a fluctuation range of 18% to 22%, intra-regional variances have the lowest and most steady contribution to the total difference, suggesting that variations among cities within the same region are stable and contribute less to the overall difference. Thus, regional differences in the degree of coupled coordination of ACE and AEG are primarily caused by inter-regional differences, i.e., the differences between Northern, Northeastern, Western, and Central–Southern Jiangxi. In contrast, intra-regional differences and hypervariable density have a negligible impact on regional differences in this regard.

3.4. Analysis of Factors Influencing the Coupling and Coordination of ACE and AEG

3.4.1. Benchmark Regression Results

Table 7 displays the findings of this study, which uses the Tobit model to investigate the external factors influencing the linked and coordinated development of ACE and AEG in Jiangxi Province. It is easily observed that the ACE is significantly impacted positively by government inputs, industrial structure, energy use, and the degree of urbanization; conversely, the ACE is significantly impacted negatively by the standard of living of the rural population. The relationship between agroecological efficiency and educational attainment is unaffected.
First, government input is significant at the 1% level with positive variable coefficients. This indicates that the government’s expansion of investment in the agricultural sector contributes to the optimization and upgrading of the agricultural industrial structure and improves the level of coupling coordination. At the same time, the government establishes an ecological compensation mechanism to improve the agricultural production environment, which provides support for the sustainable development of agriculture and promotes the benign interaction between ACE and AEG.
Second, the industrial structure is significant at the 5% level, and the variable coefficients are positive. The government has realized the positive interaction between the two systems through the promotion of green agriculture and the circular economy model and the implementation of the “zero-growth of chemical fertilizers and pesticides” action. In addition, Jiangxi Province, as one of the first demonstration zones of ecological civilization, has extended the agricultural industry chain through the development of high-value-added agricultural industries such as specialty agriculture and high-efficiency agriculture, which further promotes the coupling and coordination between the ACE and AEG.
Third, the coupling effect of living standards on agricultural carbon emission efficiency and economic development in Jiangxi Province is insignificant. Based on prior research, enhancements in living standards can alter farmers’ consumption patterns, leading to increased energy consumption and carbon emissions. However, within the agricultural sector, agricultural carbon emission efficiency is predominantly influenced by agricultural technology and the structure of agricultural production. Technological advancements or optimizations in the agricultural production structure can notably reduce agricultural carbon emissions. Although improvements in living standards may foster progress in agricultural technology and the transformation of agricultural production methods, thereby influencing agricultural carbon emissions, this impact is indirect and subject to various constraints. Changes in living standards do not directly affect the coupling effect between agricultural carbon emission efficiency and economic development.
Fourth, the coupling effect of energy utilization on agricultural carbon emission efficiency and economic development in Jiangxi Province is found to be insignificant, which deviates from the findings of previous studies. Energy utilization intensity emerges as the primary factor influencing carbon emissions in the region, with reductions in intensity or enhancements in energy utilization efficiency playing a pivotal role in determining emission levels. However, this study reveals that the impact of energy utilization is not as pronounced. Potential reasons for this phenomenon are elaborated as follows: First, agricultural production constitutes an organic integration of natural and social reproductive processes, inevitably subject to dual constraints imposed by natural and societal factors. Furthermore, the agricultural production methods in Jiangxi Province are relatively entrenched, thereby limiting the potential of energy utilization to significantly reduce agricultural carbon emissions. Second, the proportion of clean energy adoption in Jiangxi Province remains comparatively low, particularly within the agricultural sector. The absence of widespread new energy utilization and the constraints on technological promotion severely impede the capacity of energy utilization to mitigate agricultural carbon emissions. Third, the coupled development of energy utilization, agricultural carbon emission efficiency, and economic growth in Jiangxi Province is more pronounced in the industrial and service sectors. In contrast, the agricultural sector exhibits a relatively backward mode of energy utilization, resulting in an insignificant effect on the aforementioned coupling relationship.
Fifth, the level of urbanization is significant at the 1 per cent level, and the coefficient of the variable is positive. The deepening of the urbanization process promotes the implementation of the land transfer policy and promotes the transformation of agriculture to large-scale and intensive operation. At the same time, the acceleration of urbanization absorbs excess rural labor on the one hand and promotes agricultural modernization and low-carbon development through scientific and technological innovation on the other. In addition, urbanization drives the extension of the agricultural industry chain and the formation of industrial clusters, reduces production and transaction costs, and improves the efficiency of resource utilization, which further promotes the positive coupling of the ACE and AEG.
Sixth, the level of education exhibits a significant positive coefficient at the 1% significance level. An enhancement in educational attainment directly bolsters agricultural carbon emission efficiency and spurs economic development, fostering a coupled and coordinated advancement between the two domains. First, an elevated level of education serves as a catalyst for technological innovation and dissemination. It enhances agricultural production efficiency and optimizes agricultural planting structures, thereby promoting green and sustainable agricultural practices. Second, the augmentation of educational levels facilitates the accumulation of human capital in rural regions. This, in turn, drives the industrial upgrading of the agricultural sector and sustains economic development in rural areas. Consequently, the level of education plays a pivotal role in promoting the coupled development of agricultural carbon emission efficiency and economic growth in Jiangxi Province.

3.4.2. Robustness Checks

Elimination of Extreme Values. In order to mitigate the potential distortion caused by outliers on model estimation, a two-tailed truncation procedure is applied to the independent variables at the 1%, 5%, and 10% thresholds in this research. The outcomes of the analysis conducted after the elimination of extreme values are presented in Table 8. Notably, the estimated results following the removal of extreme values exhibit a high degree of consistency with the benchmark regression results. This congruence serves as strong evidence that the model estimation results obtained in this study are robust.
Model Replacement Approach. To further ascertain the robustness of the benchmark regression findings, this study utilizes quantile regression. Specifically, quantile points at the 25th, 50th, 75th, and 90th percentiles are chosen, and the quantile regression model is applied to re-estimate the outcomes. The estimated results of the quantile regression are reported in Table 9. The findings demonstrate a high degree of similarity between the quantile regression results and the benchmark regression results. This similarity strongly suggests that the model estimation results in this study exhibit robustness.
Potential Endogeneity. Given the potential endogeneity issues between government expenditure, industrial structure, and agricultural carbon emissions, our research team lagged the data of government expenditure and industrial structure by one period and employed the fixed-effects model for estimation. Table 10 reports the results of endogeneity estimation. The results reveal that the impact of the one-period-lagged data on agricultural carbon emissions is generally consistent with that of the current-period data, indicating the absence of endogeneity problems among government expenditure, industrial structure, and agricultural carbon emissions.

3.5. Discussion

This study investigates the synergistic development of agro-ecology and agro-economy in Jiangxi Province by measuring the coupling relationship between ACE and AEG, the sources of regional differences, and the influencing factors.
The results of this study show that the coupling of ACE and AEG in Jiangxi Province shows an upward trend, from “serious dissonance” to “intermediate coordination”, and the regional differences are gradually narrowed. This is consistent with the overall direction of the national agricultural low-carbon transition [3], indicating that Jiangxi Province has achieved success in the agricultural low-carbon transition. For example, optimizing agricultural irrigation methods not only reduces energy consumption and lowers carbon emissions but also improves soil quality and enhances the ecological environment [55]. Therefore, a low-carbon transition in agriculture is not only a necessary measure to cope with climate change but also an important path to realize the overall health of agroecosystems.
In terms of regional differences, the level of coupling harmonization is higher in Northern Jiangxi, Northeastern Jiangxi, and Western Jiangxi, while it is relatively lower in Central–Southern Jiangxi. This regional imbalance is consistent with the influence of regional resource endowment and economic development level on ACE [19]. In addition, this study found that inter-regional differences are the main source of overall differences, i.e., differences in the level of economic and ecological development between regions are important factors constraining the coupling and harmonization of ACE and AEG [35].
This study reveals the source of regional differences through Dagum’s Gini coefficient decomposition and finds that inter-regional differences are the main contributing factor. This is consistent with Li’s findings that inter-regional differences in economic status are key to coordinated regional development [56]. Through further analysis, this study also found that the contribution rate of hypervariable density showed a decreasing trend, while the contribution rate of intra-regional differences remained relatively stable, which is consistent with the overall direction of high-quality development of agriculture in the Yangtze River Economic Belt [57]. This indicates that the coordinated development between regions is gradually improving, but further efforts are still needed to reduce the intra-regional differences.
In terms of influencing factors, this study found that government inputs, optimization of agricultural industrial structure, urbanization level, and educational level have a significant positive effect on the improvement of coupling coordination, a result similar to the actual situation in Hebei Province [58], indicating that in the process of agricultural modernization and low-carbon transition, the above indicators are key factors in promoting the coordinated development of regional economy and ecology.
It is worth noting that the influence of rural residents’ living standards on the coordination level is not statistically significant. This finding deviates from the emphasis placed in existing studies on the positive impacts of enhanced living standards among rural residents on the ecological environment [59]. This discrepancy may arise from the unique characteristics of the agricultural sector, wherein agricultural carbon emission efficiency is predominantly influenced by agricultural technology and the structure of agricultural production. Although an elevation in living standards may foster advancements in agricultural technology and facilitate the transformation of agricultural production methods, thereby exerting an influence on agricultural carbon emissions, this effect is indirect and subject to various constraints. Consequently, future research endeavors should delve deeper into the underlying mechanisms through which living standards impact agricultural carbon emissions, elucidate potential limitations, and subsequently identify viable solutions.

4. Conclusions and Recommendations

4.1. Conclusions

This study systematically reveals the spatio-temporal evolution law of the coupling and coordination of ACE and economic growth in Jiangxi Province from 2008 to 2022 and its driving mechanism, and the main conclusions are as follows:
First, the low-carbon transformation of Jiangxi Province’s agriculture is remarkable. The overall carbon emission efficiency shows an upward trend, growing from 0.172 in 2008 to 0.624 in 2022, with a growth rate of 72.433%. This shows that Jiangxi Province has achieved remarkable results in agricultural low-carbon transformation, but there is still a certain distance from the optimal production frontier, and there is a large potential for emission reduction.
Second, the degree of coordination between ACE and economic growth in Jiangxi Province increased significantly from 0.190 to 0.730 during the study period, realizing the leap from “serious dissonance” to “intermediate coordination”. The gradual narrowing of inter-regional differences indicates that Jiangxi Province has achieved success in the low-carbon transformation of agriculture, but the problem of unbalanced development still exists. The North, Northeast, and West regions have higher levels of coupling and coordination due to their technological and scale advantages, while the Central and South regions have lower coupling and coordination efficiencies due to their traditional cropping patterns and topographical constraints.
Third, the Dagum Gini coefficient decomposition reveals that inter-regional differences are the main source of overall differences, with the contribution rate increasing from 31.49% to 37.43% and peaking at 62.20% in 2021. The Gini coefficients of Northern, Northeastern, and Western Jiangxi show a decreasing trend, indicating a gradual increase in regional coordination, but the differences in Central and Southern Jiangxi still need to be further reduced. This finding fills the gap in the study of low-carbon transformation of agriculture in small- and medium-scale regions and reveals the necessity of fine-grained governance within the province.
Fourth, government investment, the agricultural industrial structure, the level of urbanization, and educational attainment all exert a significantly positive impact on enhancing the degree of coupling coordination. To foster the coupled and coordinated development of agricultural carbon emission efficiency and economic growth, it is imperative to adopt a multifaceted approach and facilitate the formulation of a comprehensive and effective sustainable development strategy.
This study not only provides a regional case for understanding the synergistic relationship between low-carbon transformation of agriculture and economic growth but also probes deeply into the actual development of Jiangxi Province by combining the super-efficient SBM-DEA model with Dagum’s Gini coefficient decomposition method, and the results of this study provide reference to theoretical research and practical applications for promoting agricultural modernization and optimizing regional development.

4.2. Suggestions

First, it is important to strengthen inter-regional cooperation and establish a “cross-regional ecological compensation and technology sharing” mechanism to promote the balanced development of low-carbon agriculture. According to the resource endowment and economic development level of each region, Jiangxi Province should formulate a low-carbon agriculture development plan according to local conditions. It is important to set up a low-carbon agriculture demonstration zone in Poyang Lake Plain in Northern Jiangxi, promote technologies such as precision fertilization by drones and intelligent mechanization, and promote information sharing and experience sharing. At the same time, it is important to break the development barriers between regions, set up a province-wide technology transfer platform, and share the rice water-saving irrigation technology in Northern Jiangxi with Central and Southern Jiangxi and Northeast Jiangxi to improve agricultural productivity and ecological benefits.
Second, to speed up the growth of agricultural modernization, it is important to spend more on agricultural research and technology innovation. The government should encourage the deeper integration of agricultural research institutes and production methods, boost funding for agricultural science and technology innovation, and quicken the adoption and dissemination of agricultural scientific and technological advancements. It is important to pilot bio-pesticides and green manure rotations in Northeast Jiangxi, use the Yichun Agricultural Science and Technology Park platform to deploy soil moisture sensors and early warning systems for pests and diseases and other digital agricultural technologies, and popularize straw biogas cogeneration and livestock and poultry manure nano-film fermentation waste recycling technologies in Central and Southern Jiangxi to achieve low-carbon development of the agricultural industry.
Third, it is important to encourage the expansion of the agricultural industry chain and optimize the industrial structure. Jiangxi Province should keep modifying the agricultural industrial structure and encourage the growth of agriculture toward high-value-added and low-energy consumption. The agricultural industry chain can be expanded to realize the double enhancement of economic and ecological benefits through the development of the vegetable industry and the breeding of distinctive livestock and poultry in Northeast Jiangxi, the large-scale rice cultivation in North Jiangxi, the selenium-rich agriculture in West Jiangxi, and the ecological and recycling agriculture in Central and South Jiangxi.
Fourth, it is important to increase the degree of urbanization and reduce the conflict between rural residents and the land. Jiangxi Province should keep pushing for urbanization, create a more harmonious urban–land interaction, resolve the conflict between rural residents and land, and encourage the transition from small-scale to intensive farming. At the same time, relying on the characteristics of the agricultural town, it is important to attract agricultural product processing enterprises, cold chain logistics, e-commerce platforms stationed in the extension of the agricultural industry chain, and the formation of industrial clusters to improve the efficiency of resource utilization.
In conclusion, the policy recommendations proposed in this study are not only applicable to Jiangxi Province but also have the potential to be replicated in other provinces. Different provinces can formulate low-carbon agricultural development strategies suitable for their regions based on their own resource endowments, economic development levels, and agricultural characteristics. For example, similar cross-regional cooperation mechanisms can be established among provinces in the Yangtze River Economic Belt to promote appropriate agricultural technologies and management models and optimize the structure of agricultural industries such as rice cultivation. In addition, Shanghai, Jiangsu, and Zhejiang can establish technology transfer platforms and demonstration zones, which can promote the exchange and application of agricultural technologies and improve the efficiency of agricultural production and ecological benefits. Therefore, the policy recommendations of this study are not only of guiding significance for Jiangxi Province but also provide replicable models for other provinces, which can help promote the development of low-carbon agriculture nationwide.

4.3. Research Shortcomings and Future Prospects

Although this study has achieved some results in analyzing the coupled and coordinated development of ACE and AEG in Jiangxi Province, there are still some shortcomings, and future research can be further improved and expanded through the following aspects: First, the scope of the study is limited. This study only focuses on Jiangxi Province and lacks comparisons with other provinces in the country and the Yangtze River Economic Belt. Future studies can broaden the study area and analyze Jiangxi Province in comparison with other agricultural provinces to better grasp the inter-regional variability and its potential impact on the coupling and coordination of ACE and AEG. Second, data limitations. The study data only cover the prefecture-level city level, making it difficult to capture the refined characteristics of county-level units. Meanwhile, key environmental variables such as water footprint and biodiversity index were not included, which may underestimate the comprehensive pressure on agroecosystems. Future research can expand data sources by integrating multi-source data and further incorporating more comprehensive environmental indicators, such as water use and biodiversity index, to more comprehensively assess the coupled and coordinated relationship between ACE and AEG. Third, methodological limitations. The Dagum Gini coefficient decomposition does not consider interregional spatial spillover effects and may underestimate the impact of cross-regional interactions. Future research can introduce spatial econometric methods, combining spatial autocorrelation analysis and geographic information system technology, so as to more accurately assess the coupled and coordinated relationship between ACE and AEG.

Author Contributions

L.Y. and X.L. contributed equally to this work and should be considered as co-first authors. Conceptualization, L.Y. and X.L.; methodology, L.Y. and X.L.; software, X.L. and C.W.; validation, L.Y. and B.L.; formal analysis, L.Y.; investigation, X.L. and Y.Z.; resources, L.Y.; data curation, X.L. and Y.Z.; writing—original draft preparation, L.Y.; writing—review and editing, L.Y. and W.L.; visualization, W.L.; supervision, X.K. and B.L.; project administration, W.L. All authors have read and agreed to the published version of the manuscript.

Funding

This work is co-funded by the Industrial Integration Position Project of Jiangxi Provincial Industrial Economic System (JXARS-16) and the Jiangxi Provincial Philosophy and Social Science Key Research Base Project (23ZXSKJD14).

Institutional Review Board Statement

Not applicable.

Informed Consent Statement

Not applicable.

Data Availability Statement

The data supporting this study’s findings are available upon request from the corresponding author, upon reasonable request.

Acknowledgments

The authors are grateful to the editor and the anonymous reviewers of this paper.

Conflicts of Interest

The authors declare no conflicts of interest.

References

  1. Huang, C.; Xu, N. Quantifying Urban Expansion from 1985 to 2018 in Large Cities Worldwide. Geocarto Int. 2022, 37, 18356–18371. [Google Scholar] [CrossRef]
  2. Li, L.; Zhu, L.; Xu, N.; Liang, Y.; Zhang, Z.; Liu, J.; Li, X. Climate Change and Diurnal Warming: Impacts on the Growth of Different Vegetation Types in the North–South Transition Zone of China. Land 2022, 12, 13. [Google Scholar] [CrossRef]
  3. Tian, Y.; Lin, Z. Coupling Coordination between Agricultural Carbon Emission Efficiency and Economic Growth at Provincial Level in China. China Popul. Resour. Environ. 2022, 32, 13–22. (In Chinese) [Google Scholar]
  4. The State Council of the People’s Republic of China. Actively and Prudently Promoting Carbon Peak and Carbon Neutrality. Available online: https://www.gov.cn/yaowen/2023-04/06/content_5750183.htm (accessed on 6 April 2023).
  5. Dong, F.; Li, Y.; Gao, Y.; Zhu, J.; Qin, C.; Zhang, X. Energy Transition and Carbon Neutrality: Exploring the Non-Linear Impact of Renewable Energy Development on Carbon Emission Efficiency in Developed Countries. Resour. Conserv. Recycl. 2022, 177, 106002. [Google Scholar] [CrossRef]
  6. Mielnik, O.; Goldemberg, J. The Evolution of the “Carbonization Index” in Developing Countries. Energy Policy 1999, 27, 307–308. [Google Scholar] [CrossRef]
  7. Zhu, S.; Huang, J.; Li, Y.; Maneejuk, P.; Liu, J. A Non-Linear Exploration of the Digital Economy’s Impact on Agricultural Carbon Emission Efficiency in China. Agriculture 2024, 14, 2245. [Google Scholar] [CrossRef]
  8. Charnes, A.; Cooper, W.W.; Rhodes, E. Measuring the Efficiency of Decision Making Units. Eur. J. Oper. Res. 1978, 2, 429–444. [Google Scholar] [CrossRef]
  9. Chen, Y.; Miao, J.; Zhu, Z. Measuring Green Total Factor Productivity of China’s Agricultural Sector: A Three-Stage SBM-DEA Model with Non-Point Source Pollution and CO2 Emissions. J. Clean. Prod. 2021, 318, 128543. [Google Scholar] [CrossRef]
  10. Tone, K. A Slacks-Based Measure of Super-Efficiency in Data Envelopment Analysis. Eur. J. Oper. Res. 2002, 143, 32–41. [Google Scholar] [CrossRef]
  11. Luo, M.; Hamdan, R.; Ab-Rahim, R. Data-Driven Evaluation and Optimization of Agricultural Environmental Efficiency with Carbon Emission Constraints. Sustainability 2022, 14, 11849. [Google Scholar] [CrossRef]
  12. Zhao, X.; Yang, J.; Chen, H.; Zhang, X.; Xi, Y. The Effect of Urbanization on Agricultural Eco-Efficiency and Mediation Analysis. Front. Environ. Sci. 2023, 11, 1199446. [Google Scholar] [CrossRef]
  13. Xiao, Q.; Wang, Y.; Liao, H.; Han, G.; Liu, Y. The Impact of Digital Inclusive Finance on Agricultural Green Total Factor Productivity: A Study Based on China’s Provinces. Sustainability 2023, 15, 1192. [Google Scholar] [CrossRef]
  14. Li, J.; Li, S.; Liu, Q.; Ding, J. Agricultural Carbon Emission Efficiency Evaluation and Influencing Factors in Zhejiang Province, China. Front. Environ. Sci. 2022, 10, 1005251. [Google Scholar] [CrossRef]
  15. Ye, R.; Qi, Y.; Zhu, W. Impact of Agricultural Industrial Agglomeration on Agricultural Environmental Efficiency in China: A Spatial Econometric Analysis. Sustainability 2023, 15, 10799. [Google Scholar] [CrossRef]
  16. Huang, X.H.; Yang, F.; Lu, Q. Urbanization, Spatial Spillover Effect and Agricultural Carbon Emissions: An Empirical Analysis Based on Provincial Panel Data from 2007 to 2019. East China Econ. Manag. 2022, 36, 107–113. (In Chinese) [Google Scholar]
  17. Xie, H.; Wu, X. Impact and Its Mechanism of Urban-Rural Integration on the Efficiency of Agricultural Carbon Emissions in China. Resour. Sci. 2023, 45, 48–61. (In Chinese) [Google Scholar] [CrossRef]
  18. Tian, Y.; Lin, Z.J. Temporal and Spatial Coupling Relationship between Agricultural Carbon Emissions and Economic Growth in Yangtze River Economic Belt. J. China Agric. Univ. 2021, 26, 208–218. (In Chinese) [Google Scholar]
  19. Murray, B.C. Overview of Regional and Forestry GHG Offsets on the US Landscape. Choices 2004, 19, 14–18. [Google Scholar]
  20. Jin, S.; Chen, Z.; Bao, B.; Zhang, X. Study on the Influence of Digital Financial Inclusion on Agricultural Carbon Emission Efficiency in the Yangtze River Economic Belt. Int. J. Low Carbon Technol. 2023, 18, 968–979. [Google Scholar] [CrossRef]
  21. Wu, X.; Zhang, J.; Tian, Y. Provincial Agricultural Carbon Emissions in China: Calculation, Performance Change and Influencing Factors. Resour. Sci. 2014, 36, 129–138. (In Chinese) [Google Scholar]
  22. Tang, K.; Xiong, C.; Wang, Y.; Zhou, D. Carbon Emissions Performance Trend across Chinese Cities: Evidence from Efficiency and Convergence Evaluation. Environ. Sci. Pollut. Res. 2021, 28, 1533–1544. [Google Scholar] [CrossRef] [PubMed]
  23. Tan, T.; Yang, Q.; Ren, J. Research on the Coupling Coordination between Agricultural Carbon Emission Efficiency and Agricultural Economic Growth in Hainan Province under the “Two Mountains” Theory. China Agric. Resour. Reg. Plan. 2024, 45, 28–38. (In Chinese) [Google Scholar]
  24. Zhang, L.; Pang, J.; Chen, X.; Lu, Z. Carbon Emissions, Energy Consumption and Economic Growth: Evidence from the Agricultural Sector of China’s Main Grain-Producing Areas. Sci. Total Environ. 2019, 665, 1017–1025. [Google Scholar] [CrossRef] [PubMed]
  25. Liu, X.; Ye, Y.; Ge, D.; Wang, Z.; Liu, B. Study on the Evolution and Trends of Agricultural Carbon Emission Intensity and Agricultural Economic Development Levels: Evidence from Jiangxi Province. Sustainability 2022, 14, 14265. [Google Scholar] [CrossRef]
  26. Ning, C.; Yang, S. Study on the Relationship between the Driving Factors of Agricultural Economic Development and Agricultural Carbon Emissions in China Based on the ARDL Model. J. Southwest Sci. Technol. Univ. 2020, 37, 47–52. [Google Scholar]
  27. Cui, X.; Wang, Y.; Zhang, G. Measuring and Analyzing the Temporal and Spatial Evolution of Agricultural Ecological Efficiency for Low-Carbon Development Based on the SBM-ESDA Model. Issues Agric. Econ. 2022, 9, 47–61. (In Chinese) [Google Scholar]
  28. Qian, L.; Sun, F.; Song, J. Measuring Agricultural Carbon Emission Efficiency and Spatial Convergence: A Dynamic Analysis Based on Chinese Provincial Panel Data. J. Jianghan Univ. 2024, 41, 104–115. (In Chinese) [Google Scholar]
  29. Ma, Z. Research on the Spatiotemporal Coupling Relationship between Agricultural Carbon Emissions and Economic Growth in the Yellow River Basin. Chin. J. Agric. Resour. Reg. Plan. 2024, 45, 15–26. (In Chinese) [Google Scholar]
  30. Zhao, X.; Yang, D.; Duan, X. Temporal and Spatial Evolution Characteristics and Decoupling Trend of Chinese Agricultural Carbon Emission Efficiency. PLoS ONE 2024, 19, e0311562. [Google Scholar] [CrossRef]
  31. Wise, M.; Dooley, J.; Luckow, P.; Calvin, K.; Kyle, P. Agriculture, Land Use, Energy and Carbon Emission Impacts of Global Biofuel Mandates to Mid-Century. Appl. Energy 2014, 114, 763–773. [Google Scholar] [CrossRef]
  32. Ali, R.; Ishaq, R.; Bakhsh, K.; Yasin, M.A. Do Agriculture Technologies Influence Carbon Emissions in Pakistan? Evidence Based on ARDL Technique. Environ. Sci. Pollut. Res. 2022, 29, 43361–43370. [Google Scholar] [CrossRef] [PubMed]
  33. Liu, W.; Xu, R.; Deng, Y.; Lu, W.; Zhou, B.; Zhao, M. Dynamic Relationships, Regional Differences, and Driving Mechanisms between Economic Development and Carbon Emissions from the Farming Industry: Empirical Evidence from Rural China. Int. J. Environ. Res. Public Health 2021, 18, 2257. [Google Scholar] [CrossRef] [PubMed]
  34. Shu, Q.; Su, Y.; Li, H.; Li, F.; Zhao, Y.; Du, C. Study on the Spatial Structure and Drivers of Agricultural Carbon Emission Efficiency in Belt and Road Initiative Countries. Sustainability 2023, 15, 10720. [Google Scholar] [CrossRef]
  35. Yang, C.; Zhang, Y. Research on the Connection between Agricultural Carbon Emission Efficiency and Food Security in Major Grain-Producing Areas. Chin. J. Agric. Resour. Reg. Plan. 2024, 45, 12–27. [Google Scholar]
  36. Jiangxi Provincial People’s Congress Standing Committee. Jiangxi Province Implementation of the River and Lake Chiefs System Regulation [Local Regulation]. National Laws and Regulations Database. 29 November 2018. Available online: https://flk.npc.gov.cn/detail2.html?MmM5MGU1YmI2NWM2OGNmZDAxNjdlZDZhMTZkZDQ4YTA (accessed on 8 April 2025).
  37. Ai, X.; Zheng, L.N.; Xiao, J.N.; Zhang, L.; Wang, L. Ecological Compensation Mechanism of Liaoning Seas. In Environmental Technology and Resource Utilization II; Trans Tech Publications: Zurich, Switzerland, 2014; pp. 471–475. [Google Scholar]
  38. Atikah, S.N.; Yahya, M.S.; Ong, K.W.; Sanusi, R.; Norhisham, A.R.; Azhar, B. Continuous Forests and Non-IBA Forest Patches Provide a Safe Haven for the Tropical Bird Community in Highly Fragmented Urban Landscapes. Biodivers. Conserv. 2024, 33, 971–986. [Google Scholar] [CrossRef]
  39. Duan, S.; Yang, Z.; Li, Y.; Li, Y.; He, B.; Shi, J.; Song, W. Advances in the Study of Agricultural Non-Point Source Pollution in the Erhai Basin. J. Eco-Environ. Rural. 2021, 37, 279–286. [Google Scholar] [CrossRef]
  40. Shen, J.; Zhu, Q.; Hou, Y.; Cong, W.-F.; Xu, W.; Xu, J.; An, Z.; Jiao, X.; Zhang, K.; Yu, T.; et al. Agriculture Green Development in China: Insights and Advances. Front. Agric. Sci. Eng. 2024, 11, 5–19. [Google Scholar]
  41. Ye, Y.; Zou, P.; Zhang, W.; Liu, X.; Liu, B.; Kang, X. Spatial–Temporal Evolution Characteristics of Agricultural Economic Resilience: Evidence from Jiangxi Province, China. Agronomy 2022, 12, 3144. [Google Scholar] [CrossRef]
  42. Wang, L.; Zhang, Y.; Xia, J.; Wang, Z.; Zhang, W. Agricultural Production Efficiency and Differentiation of City Clusters along the Middle Reaches of Yangtze River under Environmental Constraints. Sustainability 2024, 16, 6126. [Google Scholar] [CrossRef]
  43. Wang, G.; Zhao, M.; Zhao, B.; Liu, X.; Wang, Y. Reshaping Agriculture Eco-Efficiency in China: From Greenhouse Gas Perspective. Ecol. Indic. 2025, 172, 113268. [Google Scholar] [CrossRef]
  44. Yao, S.; Liu, S.Y.; Wu, G.S. Regional Differences, Spatiotemporal Evolution, and Convergence of Agricultural Green Development in China: A Comparison Based on Two Types of Regional Divisions. Appl. Ecol. Environ. Res. 2024, 23, 1071–1099. [Google Scholar] [CrossRef]
  45. Wang, Z.; Zhou, Y. Research on the Coordination Development of Carbon Emission Efficiency and Grain Production in China’s Major Grain-Producing Areas. Geogr. Geo-Inf. Sci. 2024, 40, 102–108. [Google Scholar]
  46. Yin, Z.X.; Dai, L.Y.; Gan, C.; Voda, M. Coupling Coordination Relationship between Tourism Development and Urban-Rural Integration. Geogr. Tech. 2024, 19, 197–212. [Google Scholar] [CrossRef]
  47. Fan, Y.; Fang, C.; Zhang, Q. Coupling Coordinated Development between Social Economy and Ecological Environment in Chinese Provincial Capital Cities-Assessment and Policy Implications. J. Clean. Prod. 2019, 229, 289–298. [Google Scholar] [CrossRef]
  48. Liu, N.; Liu, C.; Xia, Y.; Da, B. Examining the Coordination between Urbanization and Eco-Environment Using Coupling and Spatial Analyses: A Case Study in China. Ecol. Indic. 2018, 93, 1163–1175. [Google Scholar] [CrossRef]
  49. Li, Y.; Zhen, W.; Shi, D.; Tang, Y.; Xia, B. Coupling Coordination and Influencing Mechanism of Ecosystem Services Using Remote Sensing: A Case Study of Food Provision and Soil Conservation. Remote Sens. 2024, 16, 4598. [Google Scholar] [CrossRef]
  50. Huang, X.; Wu, X.; Guo, X.; Shen, Y. Agricultural carbon emissions in China: Measurement, spatiotemporal evolution, and influencing factors analysis. Front. Environ. Sci. 2024, 12, 1488047. [Google Scholar] [CrossRef]
  51. Zhang, X.; Zhou, X.; Liao, K. Regional differences and dynamic evolution of China’s agricultural carbon emission efficiency. Int. J. Environ. Sci. Technol. 2023, 20, 4307–4324. [Google Scholar] [CrossRef]
  52. Weiss, C.H.; Zhu, F.K. Tobit models for count time series. Scand. J. Stat. 2025, 52, 381–415. [Google Scholar] [CrossRef]
  53. Xu, H.; Tong, J.; Chen, G.; Zhuang, T. Does feminization of agriculture promote outsourcing of agricultural machinery services? Acta Agric. Zhejiangensis 2022, 34, 173–183. (In Chinese) [Google Scholar]
  54. Ministry of Agriculture. Notice on Issuing the Action Plan for Zero Growth in Fertilizer Use by 2020 and the Action Plan for Zero Growth in Pesticide Use by 2020; Ministry of Agriculture: Beijing, China, 2015.
  55. He, J.F.; Zhang, S.Y.; Liu, B. Ecological Restoration and Carbon Sequestration Technology in Yellow River Irrigation Areas under the “Dual Carbon” Perspective: A Case Study of the Jingdian Irrigation Area. South. Agric. Mach. 2024, 55, 168–171. [Google Scholar]
  56. Li, L.; Chen, J. Spatiotemporal differences and influencing factors of regional economic development in China. Urban Probl. 2024, 347, 4–14. (In Chinese) [Google Scholar]
  57. Wang, Y.; Wang, L.; Luo, Z.G. The Temporal and Spatial Characteristics and Influencing Factors of the Coupling Relationship between Agricultural High-Quality Development and Agricultural Integration: A Case Study of the Yangtze River Economic Belt Urban Agglomerations. Resour. Environ. Yangtze Basin 2024, 33, 2525–2539. [Google Scholar]
  58. Xu, Y.; Xu, Z.H. Agricultural carbon emission efficiency and influencing factors in Hebei Province. Chin. J. Eco-Agric. 2024, 32, 1981–1993. [Google Scholar]
  59. Chen, H.; Ren, X. The Temporal and Spatial Evolution and Impeding Factors of the Coordination between Rural Living Environment and Economic Development. Ecol. Econ. 2024, 40, 184–195. [Google Scholar]
Figure 1. Research roadmap.
Sustainability 17 04246 g001
Figure 2. Average value of ACE of 11 cities in Jiangxi Province.
Sustainability 17 04246 g002
Figure 3. Spatial and temporal distribution of ACE in cities in Jiangxi province.
Sustainability 17 04246 g003
Figure 4. Coupling coordination degree of 11 cities in Jiangxi Province.
Sustainability 17 04246 g004
Figure 5. Spatial distribution of ACE and AEG coupling and harmonized development in various cities in Jiangxi Province.
Sustainability 17 04246 g005
Figure 6. Trends in the Gini coefficient among the four major regions of Jiangxi Province, 2008–2022.
Sustainability 17 04246 g006
Table 1. Selection and explanation of ACE variables in Jiangxi Province.
Level 1 TitleStandardVariableUnit (of Measure)
Input metricslabor inputPeople working in agricultureten thousand people
land inputCrop sown areathousand hectares
water inputEffective irrigated areathousand hectares
Fertilizer inputsFertilizer usagetons
Pesticide inputsPesticide usagetons
Agricultural film inputsAgricultural plastic film usetons
Expected outputsGross agricultural outputGross agricultural outputCNY trillion
Non-expected outputsAgricultural carbon emissionsCarbon emissions from agricultural inputstons
Table 2. Classification of coupling coordination degree.
Harmonization of Development Degree RangesRating Levels
[0~0.2)Severe disorder
[0.2~0.4)Moderate disorder
[0.4~0.6)Elementary dissonance
[0.6~0.8)Moderate coordination
[0.8~1.0)Quality coordination
Table 3. Selection and explanation of indicator variables of factors influencing the coupling coordination degree of ACE and AEG in Jiangxi Province.
VariableNormDescription of IndicatorsUnit (of Measure)
explained variabledegree of coupling coordinationACE and AEG Coupling Harmonization Degree-
explanatory variablegovernment inputExpenditure on agriculture, forestry, and water/general expenditure budget of local finances%
educational levelRatio of effective irrigated area to sown crop area%
industrial structureGross value of agricultural output/gross value of agricultural, forestry, livestock, and fishery output%
energy useRural electricity consumptionkW·h
living standardsPer capita disposable income of rural residentsYuan
urbanization level (of a city or town)Urban residents as a proportion of total population%
Table 4. Mean value of ACE in Jiangxi Province, 2008–2022.
YearAverage Efficiency ValueYearAverage Efficiency ValueYearAverage Efficiency Value
20080.17220130.25620180.422
20090.17820140.27520190.472
20100.19320150.32420200.529
20110.2220160.36220210.579
20120.24120170.38220220.624
Table 5. Gini coefficients and contribution rates of coupled harmonization levels of ACE and AEG in Jiangxi Province, 2008–2022.
YearGini CoefficientContribution (%)
TotallyIntra-Group Gini Coefficient GwInter-Group Gini Coefficient GbGini Coefficient of Hypervariable Density GtIntra-Group Contribution GwIntergroup Contribution GbGini Coefficient of Hypervariable Density G
20080.2050.0410.0650.10019.755%31.486%48.759%
20090.1600.0310.0540.07519.594%33.678%46.728%
20100.1350.0250.0560.05318.854%41.806%39.340%
20110.1260.0250.0480.05220.157%38.307%41.536%
20120.1240.0250.0490.04920.359%39.654%39.987%
20130.1140.0240.0380.05220.892%33.583%45.526%
20140.1090.0220.0350.05120.490%32.474%47.036%
20150.1060.0220.0390.04520.528%36.493%42.979%
20160.0900.0190.0400.03120.765%44.326%34.908%
20170.0780.0150.0330.03019.589%42.087%38.325%
20180.0790.0150.0340.03019.344%43.096%37.560%
20190.0740.0140.0360.02418.759%49.118%32.123%
20200.0660.0120.0370.01618.215%56.864%24.921%
20210.0600.0110.0370.01218.104%62.203%19.693%
20220.0640.0140.0240.02622.157%37.425%40.418%
Table 6. Trends in the Gini coefficient among the four major regions of Jiangxi Province, 2008–2022.
YearNortheast Jiangxi–Central–South JiangxiNortheast Jiangxi–North JiangxiNortheast Jiangxi–West JiangxiCentral–South Jiangxi–North JiangxiCentral–South–West JiangxiNorth and West Jiangxi
20080.1710.2640.2290.2610.1790.272
20090.1330.1990.1790.2000.1460.209
20100.1110.1480.1660.1380.1500.171
20110.1000.1390.1490.1310.1310.168
20120.0930.1300.1500.1220.1350.168
20130.0890.1190.1400.1110.1180.151
20140.0840.1200.1290.1200.1110.145
20150.0810.1110.1230.1130.1160.140
20160.0640.0990.1130.0880.0980.114
20170.0720.0960.0810.0930.0850.086
20180.0710.1010.0770.1010.0860.089
20190.0780.0910.0710.0920.0850.069
20200.0660.0740.070.0850.0860.048
20210.0600.0720.0550.0910.0720.051
20220.0630.0650.0740.0650.0760.056
Table 7. Analysis of factors influencing the coupling and coordination degree of ACE and AEG in Jiangxi Province.
ProjectsDegree of Coupling Coordination
Regression CoefficientStandard Error
Government input0.458 **(0.210)
Industrial structure0.505 ***(0.124)
Living Standards0.001(0.002)
Energy use−0.000(0.000)
Urbanization Level0.006 ***(0.002)
Educational level0.126 ***(0.042)
Year fixed effectsYes
Province fixed effectsYes
_cons−0.341 ***(0.128)
N165
Standard errors in parentheses. ** p < 0.05, *** p < 0.01.
Table 8. Analysis results after removing outliers.
ProjectsTwo-Tailed Truncation
1%5%10%
(1)(2)(3)
Government input0.511 **0.527 ***0.419 **
(0.205)(0.202)(0.203)
Industrial structure0.575 ***0.602 ***0.546 ***
(0.125)(0.129)(0.132)
Living Standards0.0020.0010.001
(0.002)(0.002)(0.002)
Energy use0.0000.000−0.000
(0.000)(0.000)(0.000)
Urbanization Level0.006 ***0.007 ***0.006 ***
(0.002)(0.002)(0.002)
Educational level0.133 ***0.154 ***0.160 ***
(0.041)(0.042)(0.045)
Year fixed effectsYesYesYes
Province fixed effectsYesYesYes
_cons−0.389 ***−0.490 ***−0.378 ***
(0.129)(0.141)(0.142)
N163143134
adj. R20.9830.9800.980
Standard errors in parentheses. ** p < 0.05, *** p < 0.01.
Table 9. Analysis of quantile regression results.
ProjectsQ25Q50Q75Q90
(1)(2)(3)(4)
Government input0.0940.737 **0.864 ***0.749 ***
(0.200)(0.312)(0.182)(0.144)
Industrial structure0.697 ***0.611 ***0.294 ***0.437 ***
(0.118)(0.185)(0.108)(0.085)
Living Standards−0.001−0.0000.0010.006 ***
(0.002)(0.003)(0.002)(0.002)
Energy use0.000−0.0000.000−0.000
(0.000)(0.000)(0.000)(0.000)
Urbanization Level0.004 **0.007 **0.004 ***0.003 **
(0.002)(0.003)(0.001)(0.001)
Educational level0.146 ***0.117 *0.169 ***0.147 ***
(0.040)(0.062)(0.036)(0.029)
Year fixed effectsYesYesYesYes
Province fixed effectsYesYesYesYes
_cons−0.287 **−0.427 **−0.180−0.157 *
(0.124)(0.193)(0.113)(0.089)
N163163163163
adj. R20.8330.8460.8590.870
Standard errors in parentheses. * p < 0.1, ** p < 0.05, and *** p < 0.01.
Table 10. Results of endogeneity analysis.
ProjectsACE
(1)(2)(3)
Government input2.263 ***2.224 ***0.425 **
(0.384)(0.419)(0.189)
Industrial structure−1.936 ***−1.994 ***0.406 **
(0.200)(0.227)(0.164)
L. Government input 0.2310.459 **
(0.393)(0.187)
L. Industrial structure 0.180 **
(0.075)
Other variablesControledControledControled
Year fixed effectsYesYesYes
Province fixed effectsYesYesYes
_cons0.3760.311−0.540 ***
(0.229)(0.254)(0.156)
N165150150
adj. R20.9830.9830.983
Standard errors in parentheses. ** p < 0.05, *** p < 0.01.
Disclaimer/Publisher’s Note: The statements, opinions and data contained in all publications are solely those of the individual author(s) and contributor(s) and not of MDPI and/or the editor(s). MDPI and/or the editor(s) disclaim responsibility for any injury to people or property resulting from any ideas, methods, instructions or products referred to in the content.

