Abstract
This study examines the impact of green finance policies on corporate biodiversity disclosures, focusing on China’s Green Finance Reform and Innovation Pilot Zones (GFPZs). Utilizing a comprehensive dataset of Chinese-listed firms from 2010 to 2022, we apply textual analysis to annual reports to quantify biodiversity-related disclosures. Our findings reveal that GFPZ policies significantly reduce biodiversity disclosures, suggesting a trade-off between carbon-focused financial incentives and broader environmental transparency. Cross-sectional analysis indicates that firms with higher R&D intensity and those in regions with stricter environmental enforcement exhibit fewer negative effects. Mechanism analysis highlights that carbon production intensity and green information disclosure quality mediate this relationship. Robustness checks, including propensity score matching, confirm these results. Our study underscores the need for policymakers to integrate biodiversity considerations into green finance frameworks to ensure balanced ESG priorities.
1. Introduction
The intersection of green finance and corporate environmental behavior has emerged as a critical domain in academic and policy discourse, driven by the global urgency to address climate change and biodiversity loss. Over the past decade, substantial progress has been made in understanding how green finance policies can incentivize firms to adopt sustainable practices [1]. Scholars have explored the effects of environmental regulations, green bond issuance, and renewable energy investments on firm performance and innovation [2,3]. Concurrently, research on corporate environmental disclosures has advanced, examining the prevalence and quality of voluntary reporting and its potential links to firm value [4], with textual analysis techniques increasingly used to quantify firms’ attention to sustainability issues [5,6]. However, improving corporate accountability for specific impacts, such as those on biodiversity, remains a significant challenge [7]. These studies underscore the importance of aligning corporate practices with environmental goals, contributing to the broader literature on environmental, social, and governance (ESG) performance.
Despite these advancements, biodiversity, a cornerstone of ecological sustainability, remains underexplored in the context of corporate disclosures, green finance policies, and within frameworks for corporate accountability more broadly [7]. Institutional theory suggests that corporate disclosure is shaped by economic incentives and regulatory, normative, and mimetic pressures. In China, strong government influence means that coercive pressures from regulators play a key role in firms’ environmental reporting. The introduction of Green Finance Reform and Innovation Pilot Zones (GFPZs) reflects a top-down policy aligning corporate sustainability with national priorities, but its impact on biodiversity disclosure remains unclear. Firms must balance ESG priorities amid resource constraints.
While biodiversity loss is a pressing global challenge with far-reaching implications for ecosystems and economies, its integration into corporate sustainability strategies has lagged behind other environmental metrics, such as carbon emissions or renewable energy adoption [8]. Given the centrality of biodiversity to environmental health, understanding how firms address biodiversity concerns within the framework of green finance policies is both timely and essential. The existing literature has focused extensively on the broader impacts of green finance policies, such as their influence on firm competitiveness [9], innovation [10], and carbon reduction initiatives [1]. However, within the domain of corporate environmental disclosures, the emphasis has largely been placed on carbon-related metrics, while biodiversity-related disclosures remain underexplored [8]. Although some studies have investigated general ESG disclosure trends, few have specifically examined how green finance policies shape corporate transparency regarding biodiversity conservation [6]. In the meantime, few studies have examined how these policies affect specific dimensions of corporate environmental behavior, such as biodiversity disclosures. The limited attention to biodiversity in green finance research is partly due to the methodological challenges of quantifying biodiversity-related concerns and the complexity of integrating biodiversity into financial frameworks.
This gap persists despite the introduction of targeted green finance policies, such as China’s Green Finance Reform and Innovation Pilot Zones (GFPZs), which aim to incentivize firms to adopt environmentally sustainable practices. While these policies represent a significant step toward promoting green finance, their effectiveness in fostering corporate biodiversity concerns has not been rigorously examined. The lack of research on this topic is surprising, given the growing international emphasis on biodiversity preservation, as highlighted in the Convention on Biological Diversity and the Kunming-Montreal Global Biodiversity Framework. Thus, the question of how green finance policies influence corporate biodiversity disclosures remains unresolved and significant in the literature.
This study addresses the identified gap by investigating how green finance policies, specifically the Green Finance Reform and Innovation Pilot Zones in China, influence corporate biodiversity disclosures. Theoretically, this study integrates institutional, stakeholder, and legitimacy theories to explain corporate sustainability disclosures. Institutional theory [11] suggests firms conform to regulatory and normative pressures, particularly state-driven green finance policies in China. Stakeholder theory [12] emphasizes that investor, regulator, and consumer expectations shape disclosure strategies. Legitimacy theory [13] posits that firms seek societal approval by aligning with accepted environmental norms. Combining these perspectives, this study offers a comprehensive framework to understand corporate biodiversity disclosures in response to green finance policies.
By leveraging novel textual analysis methods and a large dataset of Chinese-listed firms, this study provides a unique opportunity to quantify biodiversity-related concerns within corporate disclosures. This study uses textual analysis of corporate annual reports to construct biodiversity disclosure indices. It provides a quantitative framework for assessing how firms integrate biodiversity into their reporting, which differs from prior methodologies focusing on survey-based ESG ratings. This approach addresses the methodological challenges of studying biodiversity and contributes to the growing body of literature on the intersection of green finance and corporate environmental behavior. Unlike most carbon and energy efficiency studies, this research examines how green finance policies, specifically GFPZs, influence corporate biodiversity disclosures. This study’s focus on biodiversity disclosures aligns with recent calls for a more comprehensive understanding of environmental sustainability, offering new insights into how firms respond to green finance incentives.
This paper contributes to three key strands of literature. First, this study contributes to the literature on green finance and corporate environmental performance by revealing a potential unintended consequence of targeted green finance policies. While GFPZs aim to promote sustainability, our findings suggest their strong focus on carbon-related metrics may inadvertently lead to a crowding-out effect or resource reallocation away from disclosures on other critical environmental dimensions like biodiversity. This highlights the importance of examining the scope and specificity of green finance incentives and challenges the assumption that such policies uniformly enhance all aspects of environmental transparency. It provides crucial evidence on the mechanisms (prioritization under resource constraints) linking specific policy designs to heterogeneous corporate environmental reporting outcomes. Second, it advances the field of environmental, social, and governance (ESG) disclosures, particularly in textual analysis. While prior work has developed methods to quantify corporate environmental disclosures, most studies have concentrated on generic environmental metrics or climate-related disclosures [6]. This paper applies textual analysis to biodiversity-specific terms, enabling the quantification of this often-overlooked dimension and revealing the nuanced corporate responses to policy. Finally, this paper contributes significantly to the policy evaluation literature by empirically demonstrating a substitution effect in corporate environmental disclosure priorities resulting from a targeted policy intervention. When regulations like GFPZs intensify pressure on specific, measurable targets (e.g., carbon), firms may strategically substitute disclosure efforts away from less emphasized or harder-to-quantify areas like biodiversity. This finding uncovers a critical policy design gap: the frequent lack of integrated biodiversity considerations within primarily carbon-focused green finance frameworks. Our results caution that evaluating environmental policies requires assessing potential negative spillovers and trade-offs across different environmental dimensions, rather than focusing solely on the intended target.
2. Literature Review
2.1. Green Finance Policies and Corporate Behavior
Green finance, encompassing a range of financial instruments, investments, and policies to support environmental objectives, has garnered significant academic attention. Research indicates that green finance initiatives can stimulate corporate environmental innovation [1,10] and potentially improve firm performance or competitiveness, although findings can be context-dependent [2,9]. Specific instruments like green bonds have been shown to potentially affect total factor productivity [3] and signal corporate commitment to sustainability [14]. Government-led initiatives, such as pilot zones or specific regulations, are often evaluated for their effectiveness in driving environmental improvements [15]. However, a predominant focus within the literature lies on quantifiable metrics related to climate change mitigation, particularly carbon emissions reduction and energy efficiency improvements [1,9]. While crucial, this focus often overshadows other critical environmental dimensions. A dedicated analysis of how green finance policies influence corporate engagement with biodiversity conservation is absent from much of this discourse, a complex issue with fewer standardized metrics than carbon.
2.2. Corporate Environmental Disclosure and Biodiversity
Corporate environmental disclosure is a key mechanism for firms to communicate their environmental performance and commitment to stakeholders. Research suggests disclosures are influenced by regulatory pressures, market expectations, and firm-specific characteristics [6]. The quality of voluntary environmental disclosures has also been shown to be relevant for firm valuation [4]. Furthermore, a firm’s broader commitment to social responsibility, often signaled through disclosure practices, can build stakeholder trust and social capital, which may prove valuable, particularly during economic stress [16]. Textual analysis has become increasingly prominent for quantifying disclosure levels and content, moving beyond simple binary indicators [5]. Studies have applied these techniques to assess climate-related disclosures, general ESG reporting quality, and specific environmental topics. However, biodiversity disclosure remains a relatively nascent area of investigation. The inherent complexity of biodiversity, challenges in developing standardized measurement and reporting frameworks [8], and historically lower regulatory or investor pressure compared to climate change have contributed to its insufficient representation in both corporate reports and academic research. Recent studies further highlight the determinants of biodiversity disclosure, finding significant roles for institutional factors, corporate governance mechanisms [17], and country-level or industry-specific environmental performance and pressures, particularly in high-impact sectors like mining [18]. Consequently, how firms report on biodiversity and how policies like green finance influence this specific type of disclosure require dedicated investigation.
3. Theoretical Framework and Research Hypotheses
We integrate insights from institutional, stakeholder, and legitimacy theories to understand how Green Finance Reform and Innovation Pilot Zones (GFPZs) influence corporate biodiversity disclosure. Collectively, these perspectives illuminate the pressures shaping corporate reporting in response to significant policy interventions like GFPZs.
Institutional theory [11] highlights that firms conform to institutional pressures to gain legitimacy. In the context of China’s state-driven economy, GFPZs represent a significant coercive pressure. However, firms’ responses to such pressures are not always uniform; they may engage in symbolic compliance, adopting the language or structure of required reporting without substantive changes in underlying practices, particularly when seeking legitimacy from powerful state actors [19]. If the GFPZ policy’s requirements and associated incentives predominantly focus on quantifiable metrics like carbon emissions or green bond criteria, firms might strategically allocate their limited compliance resources primarily to these mandated areas to visibly meet explicit demands. This prioritization could inadvertently lead to reduced attention and disclosure concerning other environmental aspects like biodiversity, which may be less emphasized or enforced under the specific GFPZ framework.
Concurrently, stakeholder theory [12] suggests firms prioritize demands from salient stakeholders. GFPZ policies likely increase the salience of regulators and specific financial institutions offering green finance products, including potentially influential sustainable investors [20]. If these key, policy-activated stakeholders primarily demand information related to carbon performance and the use of green funds, focusing on readily available climate metrics, firms will likely tailor their disclosures accordingly to satisfy these influential groups. Consequently, disclosures on biodiversity may decrease if these powerful, policy-activated stakeholder groups are not perceived as critical, even if other stakeholders hold concerns.
Furthermore, legitimacy theory [13] posits that firms disclose information to align with societal expectations and maintain legitimacy, fostering trust among stakeholders and potentially enhancing firm resilience [16]. GFPZ policies shape the perception of what constitutes legitimate corporate environmental action within the pilot zones. If compliance with carbon-focused targets and reporting becomes the dominant, highly visible symbol of environmental responsibility under the GFPZ, firms may strategically concentrate their efforts on these disclosures, potentially prioritizing symbolic actions [19] to secure legitimacy from the government and investors. This could lead to the marginalization of disclosures on biodiversity, viewing them as less critical for maintaining their social license to operate within the specific institutional field defined by the policy.
Integrating these perspectives provides a comprehensive framework. GFPZs act as a significant institutional pressure, altering the landscape and heightening the influence of specific stakeholders focused on the policy’s primary objectives (likely carbon-centered). In response, firms strategically adjust disclosures to align with these pressures and maintain legitimacy. If policy incentives and demands emphasize specific, measurable metrics like carbon reduction, firms, especially under resource constraints, may prioritize these aspects in their operations and disclosures. These theoretical perspectives suggest that, while GFPZs aim to foster environmental sustainability, their specific focus might create trade-offs, potentially leading firms to prioritize carbon-related disclosures over biodiversity disclosures. Building on this integrated framework, we propose our primary hypothesis:
H1.
The implementation of Green Finance Reform and Innovation Pilot Zones (GFPZs) is negatively associated with the level of corporate biodiversity disclosure.
4. Data and Methodology
4.1. Data and Sample
The data used in this study comes from several sources. Firm-level variables are sourced from multiple datasets within the CSMAR database, a comprehensive Chinese corporate and financial data resource. Biodiversity indices are constructed using textual analysis of annual reports, capturing terms like “biodiversity” and “ecosystem”. Data on Green Finance Reform and Innovation Pilot Zones (GFPZs) are obtained from official documents and announcements by the National Development and Reform Commission. City-level variables, such as population density and GDP, are derived from the China City Statistical Yearbook and provincial statistical yearbooks, providing robust macroeconomic and environmental context.
The sample consists of Chinese-listed firms from 2010 to 2022. The construction begins by merging firm-level data with city-year data on the Green Finance Reform and Innovation Pilot Zones (GFPZs). Firms in cities designated as GFPZs are assigned a binary variable (GFPZ = 1) after the pilot zone’s implementation year. Observations with missing key variables, such as biodiversity metrics (BCfreq, BCnwords, BChar) or financial data (Age, Size, ROA, etc.), are excluded to ensure data completeness. Firms in the financial industry are dropped due to their distinct regulatory environment. Additionally, firms under special treatment (ST), typically facing financial distress or regulatory issues, are excluded to avoid bias. After applying these filters, the final dataset contains 39,544 firm-year observations across various industries. This refined sample ensures robust analysis of how GFPZ policies affect corporate biodiversity disclosures while maintaining data quality and consistency.
4.2. Variable Construction
The Green Finance Reform and Innovation Pilot Zones (GFPZs) are specific regions in China designated by the central government to promote green finance policies to foster environmental sustainability. They focus on promoting sustainable financial practices. It highlights two phases of reform, emphasizing green credit, environmental rights trading, and risk prevention mechanisms. Key initiatives include supporting green bonds, developing green insurance, and encouraging innovative financial products. It details specific goals and tasks for various provinces, such as Zhejiang, Jiangxi, and Guangdong, aiming to build comprehensive green financial systems. The document also emphasizes establishing risk prevention mechanisms, digital infrastructure, international cooperation, and policies to integrate green finance with industrial transformation for ecological and economic sustainability. The GFPZ designation is treated as a policy intervention in this study. A binary variable is constructed, where GFPZ equals one for firms located in cities within the designated pilot zones after the policy implementation year and zero otherwise. This construction allows for identifying the causal effects of GFPZ policies on corporate behavior, following the difference-in-differences approach commonly used in policy evaluation.
Corporate biodiversity concerns are measured using textual analysis of annual reports, capturing the extent to which firms disclose biodiversity-related information. Following prior ESG disclosure studies [3,5], biodiversity-related terms were systematically validated for robustness. We first compiled keywords from global sustainability standards (e.g., GRI, TNFD) and prior research [6], including terms like “biodiversity”, “ecosystem”, and “habitat restoration”. To enhance reliability, we cross-validated these terms using external biodiversity databases (e.g., IUCN Red List) and manually labeled firm reports. At the same time, expert reviewers in corporate sustainability conducted iterative refinements to ensure contextual relevance.
Based on our validated dictionary, we constructed three quantitative metrics—BCfreq, BCnwords, and BChar—to meticulously assess the intensity of corporate biodiversity disclosure within annual reports. While related, each metric offers a slightly different calculation based on the textual units analyzed (overall terms, specific Chinese terms, character counts). Firstly, BCfreq (Biodiversity Disclosure Frequency) quantifies the relative prominence or density of all biodiversity-related topics by calculating the total occurrences of any dictionary term per 10,000 report words. Its core function is normalization, controlling for report length variations to enable robust, standardized comparisons of disclosure intensity across firms and periods, with higher values indicating greater relative emphasis. Secondly, BCnwords (Biodiversity Disclosure Chinese Words Frequency) mirrors this approach but focuses specifically on the frequency of appearance of Chinese biodiversity-related terms, also presenting it as a standardized density per 10,000 report words. This metric isolates the disclosure intensity related specifically to Chinese language components identified in our dictionary. Finally, BChar (Biodiversity Disclosure Characters) shifts the perspective entirely, offering character-level granularity by measuring the proportion of the report’s actual textual substance allocated to biodiversity. It is calculated as the ratio of the total Chinese characters constituting all identified biodiversity terms to the total characters in the entire report text, multiplied by 10,000, thus capturing emphasis based on the fundamental units of written Chinese rather than word counts.
Employing these three related metrics is a deliberate choice to provide a robust assessment of biodiversity disclosure intensity, recognizing that relying on a single calculation might be less reliable. While these metrics primarily capture the volume of disclosure, using variations helps ensure the stability of our findings regarding changes in textual emphasis. While related, each metric offers unique incremental value: BCfreq reflects the overall relative intensity normalized for report length; BCnwords isolates this intensity specifically for potentially significant Chinese terminology; and BChar assesses the fundamental textual proportion at the character level, offering a different perspective on volume and emphasis independent of word structure normalization. Using all three metrics as dependent variables allows for a comprehensive test of how green finance policies impact the intensity of biodiversity disclosure and ensures that our main findings are robust across these alternative calculations of the core construct. These measures align with recent advancements in using textual analysis to quantify corporate environmental disclosures [6].
4.3. Empirical Strategy
We formulate the primary panel data fixed-effect regression model as follows:
where represents the dependent variable of interest, such as BCfreq, BCnwords, or BChar, which collectively serve as indicators of the intensity of corporate biodiversity disclosure. is the main explanatory variable, a binary indicator equal to one if the city is designated as a Green Finance Reform and Innovation Pilot Zone and zero otherwise. denotes a vector of control variables that influence corporate environmental behavior, including firm-specific characteristics such as Age, Size, LEV, ROA, TQ, Top1, GPATENT, and Boards. , , and represent city, industry, and year fixed effects, respectively, accounting for unobservable heterogeneity across cities, industries, and time. is the error term, which is clustered at the city-year level.
The empirical model examines how the establishment of a Green Finance Reform and Innovation Pilot Zone (GFPZ) affects corporate biodiversity-related disclosures. A GFPZ is expected to increase firms’ attention to ecological sustainability due to stricter green policies and financial incentives. Control variables capture firm-specific characteristics influencing biodiversity disclosures, such as firm age, size, profitability, leverage, and ownership concentration. To account for regional environmental regulatory intensity, we constructed the city-level Urban Environmental Performance Level (UEPL). This variable proxies local government emphasis on environmental protection and sustainability, derived via textual analysis of annual city government work reports. UEPL is calculated based on the frequency of predefined environmental keywords (covering pollution control, ecological conservation, green development, etc.), sourced from policy documents and prior literature, within these reports, normalized by report length. A higher UEPL value signifies a stronger institutional environmental focus at the city level.
Furthermore, to control for firms’ internal environmental commitment and capabilities, we included the firm-level Green Governance Performance (GGP) variable. This index captures the quality of a company’s internal green governance structures and practices, constructed using data from annual or ESG reports (often via CSMAR). It aggregates indicators such as board-level environmental oversight, established environmental management systems [21], explicit environmental targets, and the detail of environmental reporting. The GGP score, typically derived from summing or averaging binary/scaled component scores, reflects the firm’s internal green governance strength and helps isolate the GFPZ policy effect from inherent firm characteristics. Additionally, given the significance of state ownership in the Chinese economy, we also control for whether a firm is a State-Owned Enterprise (SOE). We define SOE status using a dummy variable based on the ultimate controller information from the CSMAR database. Fixed effects address potential omitted variable bias by controlling for city-specific, industry-specific, and year-specific factors. This approach aligns with recent studies [2,3], emphasizing the importance of fixed effects and clustered standard errors in panel data analysis.
4.4. Summary Statistics
The descriptive statistics in Table 1 provide an overview of key variables. Biodiversity-related variables reveal notable variation: the average frequency of biodiversity-related terms (BCfreq) is 1.94, with a standard deviation of 4.04, while the frequency of Chinese words related to biodiversity (BCnwords) have a mean of 1.35 and a median of 0.46, indicating a skewed distribution. The biodiversity character ratio (BChar) averages 0.69, with a maximum of 10.31, suggesting that some firms place significant emphasis on biodiversity in their disclosures. Firm size, measured as the natural logarithm of total assets, has a mean of 22.12 and a standard deviation of 1.31, highlighting variations in corporate scale. Profitability (ROA) averages 0.04, ranging from −0.33 to 0.21, while leverage (LEV) has a mean of 0.42, indicating moderate debt usage. State-Owned Enterprise (SOE), a dummy variable whether a firm is a State-Owned Enterprise, has a mean of 0.35 and a standard deviation of 0.48. The Green Finance Reform and Innovation Pilot Zone indicator (GFPZ) averages 0.02, reflecting limited policy implementation across the sample.

Table 1.
Descriptive statistics. This table presents descriptive statistics for a sample of Chinese-listed firms from 2010 to 2022. The sample consists of 39,544 firm-year observations. Detailed variable definitions are presented in Abbreviations.
The correlation matrix in Table 2 shows a near-zero correlation between the GFPZ policy and the three biodiversity disclosure metrics (BCfreq, BCnwords, BChar), indicating a lack of direct linear association. However, these three disclosure metrics are highly positively correlated with each other (coefficients > 0.99, significant), stemming from their common basis in text analysis of annual reports and measuring the same core concept—the intensity of biodiversity disclosure. BCfreq counts the frequency of all relevant terms, BCnwords focuses on Chinese terms, and BChar calculates the proportion of relevant characters. Rooted in the same text source and sharing a common objective, the three indicators generally move in tandem when a firm increases its related discussion. Therefore, despite slightly different perspectives, they consistently reflect the overall strength of corporate biodiversity disclosure.
Table 2.
Correlation matrix. This table presents a correlation matrix for a sample of Chinese-listed firms from 2010 to 2022. *** denotes the significance at the 1% level.
5. Empirical Results
5.1. Baseline Regression
The results in Table 3 highlight that the establishment of a Green Finance Reform and Innovation Pilot Zone (GFPZ) has a statistically and economically significant impact on corporate biodiversity concerns. The coefficient for GFPZ is consistently negative and highly significant across all specifications, with a value of −0.405 for BCfreq, −0.276 for BCnwords, and −0.142 for BChar in the baseline regressions. The statistical significance of these results, with t-values exceeding 4, suggests that the findings are robust. These results indicate that firms in cities designated as GFPZs exhibit fewer biodiversity-related disclosures.
Table 3.
Establishment of Green Finance Reform and Innovation Pilot Zones and corporate biodiversity concern. This table presents the effect of the establishment of Green Finance Reform and Innovation Pilot Zones on corporate biodiversity concern for a sample of Chinese-listed firms from 2010 to 2022. The dependent variables include BCfreq, BCnwords, and BChar. The main explanatory variable, GFPZ, is a dummy variable that equals one for cities set as Green Finance Reform and Innovation Pilot Zones, and zero otherwise. All regressions include the city, industry, and year-fixed effects. The robust t-statistics clustered by the city and year are reported in parentheses. The detailed variable definitions are presented in Abbreviations. ***, **, and * denote the significance at the 1%, 5%, and 10% levels, respectively.
In models including only firm-level control variables (Columns 1, 3, 5), the results show that older (Age) and larger (Size) firms possess more green patents (GPATENT), potentially have better board structures (Boards), exhibit higher bank dependence (BANKD), demonstrate better internal green governance performance (GGP), and show significantly higher levels of biodiversity disclosure. This indicates that factors such as corporate history, resource endowment, innovation capacity, governance quality, and the influence of key stakeholders (like banks) are important drivers of disclosure. Conversely, firms with higher profitability (ROA) and more concentrated ownership (Top1) disclose significantly less biodiversity information, which may reflect different operational priorities or focal points of shareholder oversight. Under this specification, financial leverage (LEV), market valuation (TQ), and institutional investor ownership (INST) do not show a significant direct impact on biodiversity disclosure. Furthermore, in addressing the specific institutional context of China, we explicitly controlled for whether a firm is a State-Owned Enterprise (SOE). Across all model specifications (Columns 1–6), State-Owned Enterprise (SOE) status does not show a statistically significant effect on the level of corporate biodiversity disclosure (whether measured by overall frequency, Chinese word frequency, or character ratio). The coefficients are very small in magnitude and inconsistent in sign, further indicating that, within the model specifications and sample of this study, SOE status itself is not an independent and significant factor in explaining the variation in biodiversity disclosure among companies.
When city-level control variables are included (Columns 2, 4, 6), the aforementioned firm-level findings remain largely robust, reaffirming the independent impact of firms’ own characteristics (such as size, governance, and innovation) on biodiversity disclosure. Meanwhile, city-level macroeconomic and environmental factors also demonstrate significant effects: firms located in cities with higher levels of economic development (LPGDP), higher industrial solid waste utilization rates (ISW), and more developed financial sectors (POP) tend to engage in greater biodiversity disclosure, possibly reflecting higher requirements stemming from regional development levels, environmental management capabilities, and financial market maturity. On the other hand, the higher the degree of industrialization (IND2GDP), industrial pollution (LDUST, LPM), and carbon emission levels (LMT) in a firm’s host city, the significantly lower its level of biodiversity disclosure, suggesting a shift in focus or avoidance behavior under different environmental pressure contexts. The impact of population density (LPDEN) is weaker and inconsistent, while the composite city environmental performance indicator (UEPL) constructed in this study does not show a significant effect after controlling for other specific variables.
These findings provide strong empirical support for our central hypothesis, H1, which posits that GFPZ implementation is negatively associated with the level of corporate biodiversity disclosure. This seemingly counterintuitive result aligns with our integrated theoretical framework. GFPZs’ institutional pressures [11], salient stakeholder demands [12]—particularly from regulators and investors focused on quantifiable metrics emphasized in green finance literature [1,9]—and corporate legitimacy needs [13] converge to drive firm behavior. Firms appear to prioritize conformity with the policy’s explicit, measurable (likely carbon-centered) objectives to satisfy key stakeholders and signal regulatory compliance efficiently. Biodiversity, being more complex and less standardized [8], offers a less direct pathway to achieving this policy-specific legitimacy.
Therefore, the negative coefficient suggests a strategic prioritization effect: faced with targeted institutional pressures and stakeholder demands focused on specific (likely carbon-related) environmental goals, firms allocate their limited resources and attention to meeting these primary requirements. This occurs potentially at the expense of other environmental factors like biodiversity, leading to the observed reduction in disclosure. This finding highlights a trade-off between motivating specific environmental actions and encouraging broad environmental transparency.
Figure 1 illustrates the parallel trend test and dynamic treatment effect analysis. The graph shows that pre-treatment trends between the treated and control groups are parallel, satisfying the parallel trend assumption necessary for the difference-in-differences methodology. Post-policy implementation, the treated group diverges significantly, indicating a measurable impact of GFPZ on biodiversity-related disclosures. The dynamic treatment effect captures changes over time, providing further robustness by visualizing the timing and magnitude of policy effects.
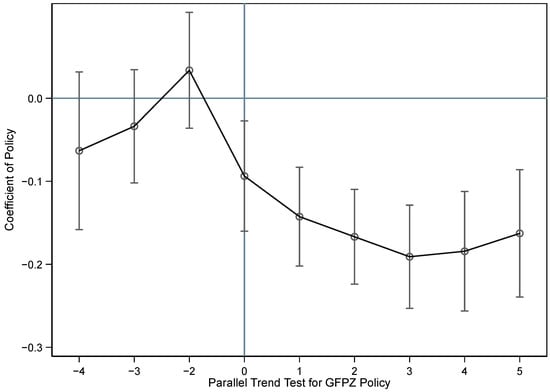
Figure 1.
Parallel trend and dynamic treatment effect.
Figure 2 presents the placebo test results. The test assigns false treatment dates to firms and examines whether significant effects appear during these placebo periods. The graph shows no statistically significant changes in biodiversity disclosures during placebo periods, confirming that the observed effects in the main analysis are not random or driven by unrelated factors. This strengthens the causal interpretation of the GFPZ policy’s impact, ensuring the results are not influenced by spurious correlations.
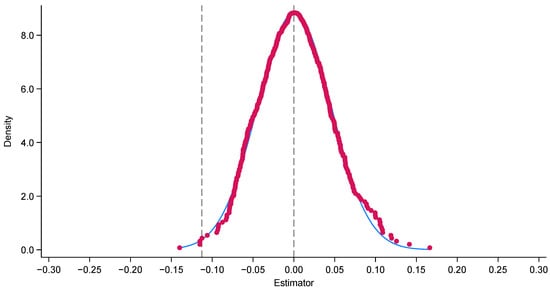
Figure 2.
Placebo test. Red dots: The distribution of estimated coefficients from 500 placebo tests. The central vertical dashed line: The null effect. The left vertical dashed line: the actual estimated effect from the original model.
5.2. Cross-Sectional Examination
The relationship between the establishment of a Green Finance Reform and Innovation Pilot Zone (GFPZ) and corporate biodiversity concerns is likely heterogeneous across various dimensions due to firm-specific and regional factors influencing environmental behavior. For instance, firms with higher R&D intensity may have greater capacity to adapt to green policies by innovating environmentally friendly practices, leading to more biodiversity disclosures. R&D-intensive firms often possess the resources to integrate environmental considerations into their operations [1]. Financial constraints may exacerbate this relationship, as firms facing greater financial limitations may have reduced capacity to invest in long-term environmental initiatives, prioritizing short-term financial stability. Furthermore, regional differences in environmental law enforcement could also drive heterogeneity, as stricter enforcement incentivizes firms to align with biodiversity goals. Stronger institutional frameworks often enhance corporate environmental engagement [22]. These dimensions highlight that firm-specific characteristics, such as financial flexibility and innovation capacity, alongside external regulatory pressures, shape how firms respond to green finance policies. This conjecture suggests that policy effectiveness depends on the alignment of incentives with firms’ financial and operational realities and the regional enforcement of environmental standards.
The regression results in Table 4 reveal significant heterogeneity in the relationship between GFPZ and corporate biodiversity concerns across three dimensions: R&D intensity, financial constraints, and regional environmental law enforcement. In Panel A, the interaction term between GFPZ and R&D intensity (GFPZRDP) is positive and statistically significant at the 1% level for all biodiversity measures (e.g., BCfreq, BCnwords, and BChar), suggesting that firms with greater R&D capacity exhibit a less negative relationship between GFPZ and biodiversity disclosures. The moderating variable R&D intensity (RDP) is the ratio of R&D personnel to total employees. In Panel B, the interaction term between GFPZ and financial constraints (GFPZW) is negative and significant at the 1% level, indicating that firms with stronger financial constraints are more negatively affected by GFPZ policies. Financial constraints are measured by the WW index. In Panel C, the interaction term between GFPZ and regional environmental law enforcement (GFPZBCP) is also positive and significant at the 5% level. This moderating variable (BCP) captures the proportion of environmental terms in government work reports. These results highlight that firms’ financial flexibility, innovation capacity, and external regulatory pressures significantly influence their responses to green finance reforms.
Table 4.
Cross-sectional heterogeneity. This table presents the cross-sectional heterogeneity of the association between the establishment of a Green Finance Reform and Innovation Pilot Zone (GFPZ) and corporate biodiversity concern for a sample of Chinese-listed firms from 2010 to 2022. Panel A examines heterogeneity based on firm R&D intensity, Panel B focuses on financial constraints, and Panel C focuses on regional environmental law enforcement. The dependent variables are frequency-related biodiversity Concern (BCfreq), Chinese words frequency-related biodiversity concern (BCnwords), and characters-related biodiversity concern (BChar). The regression includes city, industry, and year fixed effects, with robust t-statistics clustered by city and year reported in parentheses. ***, **, and * denote significance at the 1%, 5%, and 10% levels, respectively.
The results in Table 4 reveal significant heterogeneity in the GFPZ effect, providing further nuance consistent with our theoretical framework. The finding that higher R&D intensity mitigates the negative impact of GFPZ on biodiversity disclosure (Panel A) suggests that innovative capacity enhances a firm’s ability to manage multiple environmental demands. Drawing on institutional theory, firms with strong R&D may possess superior capabilities to interpret and respond strategically to complex regulatory environments. This allows them to address core GFPZ requirements and maintain attention on broader issues like biodiversity [1]. Stakeholder theory suggests R&D-intensive firms often operate in sectors with higher stakeholder expectations for comprehensive ESG performance, motivating them to maintain broader disclosures despite policy focus [12]. From a legitimacy perspective, innovation can be leveraged to signal proactive environmental stewardship across multiple fronts, enhancing overall legitimacy beyond mere compliance [13]. Conversely, the finding that financial constraints worsen the negative impact (Panel B) aligns with the resource constraints inherent in theoretical perspectives; firms lacking financial flexibility can pursue discretionary or complex disclosures like biodiversity less when faced with pressing, policy-driven mandates. Similarly, the mitigating effect of stricter regional environmental enforcement (Panel C) underscores the power of coercive institutional pressure; when the overall regulatory environment demands broad environmental accountability, firms are less likely to selectively reduce disclosures, even if specific policies emphasize certain areas [22]. These variations highlight that the policy’s impact depends on firm capabilities and the broader institutional context.
5.3. Plausible Economic Mechanisms
This paper explores two plausible channels through which Green Finance Reform and Innovation Pilot Zones influence corporate biodiversity disclosure: carbon production intensity and green information disclosure quality. These mechanisms reflect trade-offs in corporate environmental priorities and the broader institutional constraints shaping disclosure behavior.
Carbon production intensity is a mediating factor, suggesting that firms prioritize carbon reduction efforts over biodiversity disclosures. This is consistent with prior research indicating that green finance policies often heavily emphasize climate change mitigation and carbon reduction targets [1,9]. This strong focus might compel firms to prioritize investments, actions, and reporting related to carbon performance. Policies often incentivize firms to adopt low-carbon technologies, which may divert attention and reporting from biodiversity-related concerns [1]. Additionally, carbon metrics are more standardized and measurable, making them a more accessible target for firms seeking regulatory compliance [9]. The second channel, green information disclosure quality, suggests that GFPZs influence biodiversity disclosure through firms’ overall ESG reporting practices. Prior research highlights that firms enhance sustainability disclosures when institutional pressures increase transparency requirements [6]. However, biodiversity remains underrepresented compared to carbon-related disclosures due to the lack of standardized reporting frameworks. The emphasis on green finance policies may improve overall ESG reporting without necessarily increasing biodiversity-specific transparency.
The regression results in Table 5 examine the mediating effects of carbon production intensity (CPI) and green information disclosure quality (GIDQ) in the relationship between Green Finance Reform and Innovation Pilot Zone (GFPZ) and corporate biodiversity disclosures. First, in Panel A, the coefficient of GFPZ on CPI is 0.124 and statistically significant at the 10% level, indicating that firms located in GFPZs tend to exhibit slightly higher carbon productivity (lower carbon intensity). The second-stage regression demonstrates that CPI negatively affects biodiversity disclosure metrics BCfreq (−0.026), BCnwords (−0.018), and Bchar (−0.010), both significant at the 5% level. This suggests that firms with higher carbon productivity (lower intensity) disclose less about biodiversity. CPI is the ratio of total carbon productivity relative to total assets, reflecting the extent of a firm’s carbon intensity. Second, Panel B examines GIDQ as a potential channel. The coefficient of GFPZ on GIDQ is −0.053, which is significant at the 1% level, suggesting that GFPZ reduces the overall quality of green information disclosure. Moreover, GIDQ positively affects BCfreq (0.240), BCnwords (0.148), and BChar (0.075), all significant at the 5% level. This implies that firms in GFPZ zones provide lower-quality green disclosures, reducing biodiversity-related transparency. GIDQ is a textual analysis-based measure reflecting the quality of firms’ green disclosures, constructed by evaluating the frequency and depth of environmental reporting in corporate annual reports.
Table 5.
Mechanism analysis: the mediating effects. This table presents the results of the mediating effect analysis between Green Finance Reform and Innovation Pilot Zone (GFPZ) and corporate biodiversity disclosure. Panel A reports the mediating effect through the carbon production intensity (CPI) channel, while Panel B reports the mediating effect through the green information disclosure quality (GIDQ) channel. The dependent variables include overall frequency-related biodiversity concern (BCfreq), character-related biodiversity concern (BChar), and Chinese word frequency-related biodiversity concern (BCnwords). Column (1) presents the first-stage regression results of GFPZ on mediating variables. Columns (2)–(4) present the second-stage regression results of mediating variables on biodiversity disclosure measures. All regressions include the full set of control variables and fixed effects. The robust t-statistics clustered by city and year are reported in parentheses. The detailed variable definitions are presented in Abbreviations. ***, **, and * denote significance at the 1%, 5%, and 10% levels, respectively.
The observed trade-off between carbon reduction and biodiversity disclosures aligns with economic theories of corporate resource allocation. Firms face budgetary and managerial constraints when complying with environmental policies, leading them to prioritize regulatory requirements over voluntary sustainability efforts [23]. Since GFPZ policies primarily emphasize carbon reduction and energy efficiency, firms in these zones are incentivized to shift ESG efforts toward compliance with carbon-related metrics, reducing attention to biodiversity concerns [8]. From a financial perspective, firms may prioritize carbon-related disclosures as they directly impact access to green financing instruments, such as green bonds and sustainability-linked loans [3]. Biodiversity, by contrast, lacks standardized financial incentives and remains a secondary concern in ESG reporting frameworks [5]. The results suggest that, while green finance initiatives drive improvements in carbon efficiency, they may inadvertently discourage comprehensive environmental disclosures. The results confirm that CPI and GIDQ significantly mediate the relationship between GFPZ and biodiversity disclosures, reinforcing the argument that green finance policies create environmental trade-offs.
5.4. Robustness Checks
The robustness checks aim to ensure the validity and reliability of the findings by addressing potential concerns such as omitted variable bias, measurement errors, and endogeneity. For example, excluding high-polluting industries checks whether the results are driven by sector-specific effects. Additionally, we use alternative model specifications to help address potential biases arising from unobserved industry-specific and region-specific factors. These checks strengthen confidence in the causal interpretation of the findings.
The robustness checks in Table 6 verify the consistency and reliability of the results under different conditions. First, Panel A presents the regression results under alternative sampling criteria, showing that the establishment of a Green Finance Reform and Innovation Pilot Zone (GFPZ) has a negative and statistically significant impact on corporate biodiversity concerns across all three measures (BCfreq, BCwords, and BChar) at the 1% significance level. The result reinforces the robustness of the primary results. Second, Panel B incorporates industry-year and province-year fixed effects to further validate the robustness of the findings. The coefficients for GFPZ remain negative and statistically significant at the 1% level across all three biodiversity concern measures, suggesting that green finance policies consistently reduce corporate biodiversity concerns, regardless of industry or regional differences, further supporting the robustness of the findings. These checks collectively confirm the validity of the causal relationship and rule out alternative explanations.
Table 6.
Robustness checks. This table presents the association between the establishment of a Green Finance Reform and Innovation Pilot Zone (GFPZ) and corporate biodiversity concern for a sample of Chinese-listed firms from 2010 to 2022 under different robustness specifications. Panel A excludes high-pollution industries. Panel B incorporates additional fixed effects, including industry-year and province-year fixed effects. Robust t-statistics clustered by the city and year are reported in parentheses. Detailed variable definitions are presented in Abbreviations. *** denotes significance at the 1% level.
To mitigate selection bias and further validate the robustness of the baseline regression, this study employs propensity score matching (PSM) to match firms in a Green Finance Reform and Innovation Pilot Zone (GFPZ) with non-GFPZ firms, creating a more comparable control group. We use entropy balancing to ensure covariate balance between the treatment and control groups. The matching process incorporates firm-level and city-level control variables to estimate a firm’s propensity scores for GFPZ assignment.
The regression results in Table 7 show that the coefficient for Green Finance Reform and Innovation Pilot Zones is negative after matching and statistically significant at the 5% level for all biodiversity disclosure measures (e.g., BCfreq, BCnwords, and BChar), suggesting that, even after controlling for selection bias, GFPZ still significantly reduces corporate biodiversity disclosure, further confirming the robustness of the baseline regression. This finding reinforces the core argument of this study. While green finance policies effectively promote corporate low-carbon transitions, they may also lead firms to prioritize carbon reduction metrics over biodiversity transparency, especially when ESG resources are limited. Furthermore, the persistently significant negative impact after matching suggests that the reduction in biodiversity disclosure is not driven by firm-specific characteristics, but rather a systematic outcome of GFPZ policy incentives.
Table 7.
Propensity score matching. This table presents the propensity score matching analysis results examining the effect of Green Finance Reform and Innovation Pilot Zone (GFPZ) on corporate biodiversity concern for a sample of Chinese-listed firms from 2010 to 2022. The dependent variables include overall frequency-related biodiversity concern (BCfreq), character-related biodiversity concern (BChar), and Chinese word frequency-related biodiversity concern (BCnwords). The matching is performed using entropy balancing based on firm- and city-level controls. All regressions include the city, industry, and year-fixed effects. The robust t-statistics clustered by the city and year are reported in parentheses. Detailed variable definitions are presented in Abbreviations. ***, and ** denote significance at the 1%, and 5% levels, respectively.
6. Conclusions
This study addresses a novel research question by investigating how green finance policies influence corporate biodiversity disclosures, a critical but underexplored dimension of environmental sustainability. It bridges the gap between policy implementation and corporate environmental behavior, contributing to the growing literature on the intersection of green finance and biodiversity [8]. Our primary finding, robust across various specifications and confirmed through propensity score matching, is that GFPZ implementation is associated with a significant reduction in corporate biodiversity disclosures. This supports our hypothesis (H1) and resonates strongly with predictions derived from institutional, stakeholder, and legitimacy theories. It suggests that the targeted pressures and incentives within the GFPZ framework, while promoting specific environmental actions like carbon reduction, may lead firms to strategically shift their focus and disclosure efforts away from less emphasized or harder-to-measure areas like biodiversity, reflecting resource allocation trade-offs and legitimacy-seeking behavior within a constrained institutional environment. The observed heterogeneity, whereby R&D intensity and stricter regional enforcement mitigate this negative effect, while financial constraints exacerbate it, further reinforces this interpretation, highlighting the interplay between policy pressures, firm capabilities, and the broader institutional context. Mechanism analysis implicating carbon intensity reduction and disclosure quality dynamics provides plausible pathways for this effect.
Therefore, our finding presents significant policy implications. This counterintuitive result underscores a potential trade-off from the likely carbon-centered focus of current green finance frameworks, necessitating a more integrated approach to environmental sustainability.
First, they serve as a cautionary note: while targeted green finance policies like GFPZ are valuable tools, their specific focus can create unintended “blind spots”. As our theoretical framework suggests, the institutional pressures generated by such policies can lead firms to prioritize policy-centered metrics over other critical environmental dimensions like biodiversity. To foster a more comprehensive approach, it is imperative for policymakers to proactively embed biodiversity considerations into the architecture of green finance policies, rather than assuming positive spillovers from carbon-focused initiatives. Failing to explicitly include biodiversity risks creates significant environmental blind spots. Key actions include expanding the eligibility criteria for green financial instruments (e.g., bonds, loans) to encompass mandatory or incentivized biodiversity metrics alongside carbon ones, supporting and potentially mandating the adoption of standardized biodiversity reporting frameworks (such as TNFD), thereby enhancing corporate biodiversity accountability [7], and designing policy incentives (e.g., subsidies) to reward holistic environmental performance across multiple dimensions. Furthermore, regulators must acknowledge that firms respond strategically to policy signals; thus, broadening disclosure mandates beyond carbon, guiding on managing climate-biodiversity interrelationships, and tailoring requirements based on firm characteristics (e.g., offering support for financially constrained firms while setting higher expectations for R&D-intensive ones) are crucial steps to mitigate unintended prioritization effects.
Second, recognizing that firms navigate complex stakeholder demands and legitimacy concerns, policies should create a balanced incentive structure that encourages holistic ESG performance rather than potentially forcing trade-offs. Investors also have a critical role, potentially leveraging their influence through various sustainable investing mechanisms [20]. Relying solely on green labels or ESG ratings heavily weighted towards carbon may obscure significant nature-related risks. Therefore, investors should enhance scrutiny by demanding more comprehensive environmental data from companies, particularly on biodiversity impacts and dependencies. Critically evaluating the scope and weighting of biodiversity within ESG assessment methodologies and engaging with companies and policymakers to advocate for integrated reporting reflecting environmental challenges’ interconnections is essential for informed, sustainable investment decisions.
In conclusion, while GFPZs signify progress in aligning finance with environmental goals, this study cautions against an overly narrow focus. Achieving genuine ecological sustainability requires a balanced policy approach that recognizes and integrates the interdependence of climate and biodiversity within financial regulations and corporate reporting practices, thereby preventing the inadvertent marginalization of critical nature-related transparency.
Finally, it is important to acknowledge the limitations of our study. Our textual analysis (using BCfreq, BCnwords, BChar), while robustly measuring disclosure volume/intensity through three variations, does not capture other important dimensions like quality, specificity, comparability, or substance versus symbolism. Consequently, our findings specifically concern the amount of biodiversity attention in reports following GFPZ implementation. Future research exploring these other dimensions (e.g., via qualitative analysis, advanced NLP, or linking to performance data) is needed for a more holistic understanding of corporate engagement beyond reporting volume.
This study also prompts examining financial materiality and policy–practice decoupling. Following Madison and Schiehll [24], future research could assess if biodiversity’s financial materiality influences the disclosure reduction under GFPZs’ carbon focus. Furthermore, using frameworks like Loko and Schiehll [25], research could investigate if this reduction reflects decoupling—whether firms decrease disclosure while maintaining internal actions or if both diminish. Understanding these materiality and decoupling aspects is key to explaining the mechanisms driving the disclosure shifts we identified.
Author Contributions
Methodology, T.Y.; Formal analysis, T.Y.; Writing—original draft, T.Y.; Writing—review & editing, K.W.; Project administration, K.W. All authors have read and agreed to the published version of the manuscript.
Funding
This research received no external funding.
Institutional Review Board Statement
Not applicable.
Informed Consent Statement
Not applicable.
Data Availability Statement
The data presented in this study are available on request from the corresponding author.
Conflicts of Interest
The authors declare no conflict of interest.
Abbreviations
| Variable | Definition |
| BCfreq | The frequency count of biodiversity-related terms appearing in annual reports based on a predefined dictionary |
| BCnwords | The frequency count of Chinese biodiversity-related terms appearing in annual reports based on a predefined dictionary |
| BChar | The ratio of characters in biodiversity-related terms to total characters in corporate disclosures |
| GFPZ | A dummy variable that equals one for cities set as Green Finance Reform and Innovation Pilot Zones, and zero otherwise |
| Age | Natural logarithm of the number of years since the initial public offerings |
| Size | Natural logarithm of total assets |
| LEV | Total debt over total assets |
| ROA | Operating income over total assets |
| TQ | Market value of the company over the replacement cost of the company’s assets |
| Top1 | Number of shares held by the largest shareholder over the total number of shares |
| GPATENT | Total number of green patent applications |
| Boards | Number of shares held by the board over the total number of shares |
| LPDEN | The natural logarithm of population density |
| IND2GDP | Value added of the secondary industry over GDP |
| LPGDP | The natural logarithm of GDP per capita |
| LDUST | The natural logarithm of industrial soot emissions |
| LPM | The natural logarithm of the average annual concentration of fine particulate matter that can be inhaled |
| ISW | Comprehensive utilization rate of industrial solid waste |
| LMT | The natural logarithm of carbon dioxide emissions |
| RDP | Total number of R&D personnel over the total number of company employees |
| WW_index | Financing constraint index |
| BCP | The proportion of environmental protection-related words in the total word count of government work reports |
| BANKD | The standard deviation of the ratio of aggregate borrowings (sum of short-term and long-term loans) to total liabilities |
| POP | Number of employees in the financial sector over the total resident population |
| GGP | Green governance performance of listed companies |
| INST | The number of shares held by institutional investors over the total share capital |
| CPI | Total carbon productivity over total assets |
| GIDQ | Green information disclosure quality |
| UEPL | The number of green word frequencies in municipal government work reports at various levels over the total number of texts |
| SOE | A dummy variable equal to 1 if the firm is classified as a state-owned enterprise (based on the nature of the ultimate controller reported in the CSMAR database), and 0 otherwise |
References
- Aghion, P.; Dechezleprêtre, A.; Hemous, D.; Martin, R.; Van Reenen, J. Carbon taxes, path dependency, and directed technical change: Evidence from the auto industry. J. Political Econ. 2016, 124, 1–51. [Google Scholar] [CrossRef]
- Ramanathan, R.; He, Q.; Black, A.; Ghobadian, A.; Gallear, D. Environmental regulations, innovation and firm performance: A revisit of the Porter hypothesis. J. Clean. Prod. 2017, 155, 79–92. [Google Scholar] [CrossRef]
- Li, Y.; Yu, C.; Shi, J.; Liu, Y. How does green bond issuance affect total factor productivity? Evidence from Chinese listed enterprises. Energy Econ. 2023, 123, 106755. [Google Scholar] [CrossRef]
- Plumlee, M.; Brown, D.; Hayes, R.M.; Marshall, R.S. Voluntary environmental disclosure quality and firm value: Further evidence. J. Account. Public Policy 2015, 34, 336–361. [Google Scholar] [CrossRef]
- Maibaum, F.; Kriebel, J.; Foege, J.N. Selecting textual analysis tools to classify sustainability information in corporate reporting. Decis. Support Syst. 2024, 183, 114269. [Google Scholar] [CrossRef]
- Chang, K.; Li, J.; Xiao, L.; Yang, M. Peer effects of firm’s sustainable transformation: Evidence from textual information analysis of annual financial reports in China. J. Clean. Prod. 2024, 434, 140044. [Google Scholar] [CrossRef]
- Addison, P.F.E.; Bull, J.W.; Milner-Gulland, E.J. Using conservation science to advance corporate biodiversity accountability. Conserv. Biol. 2018, 33, 307–318. [Google Scholar] [CrossRef]
- Dasgupta, P.; Treasury, H.M. The economics of biodiversity: The Dasgupta review. Odisha Econ. J. 2022, 54, 170–176. [Google Scholar]
- Zhou, Z.; Zhou, Y.; Wu, Y.; Ge, X. The impact of green finance policy on total factor productivity: Based on quasi-natural experiment evidence from China. J. Clean. Prod. 2023, 425, 138873. [Google Scholar] [CrossRef]
- Wang, Q.J.; Wang, H.J.; Chang, C.P. Environmental performance, green finance and green innovation: What’s the long-run relationships among variables? Energy Econ. 2022, 110, 106004. [Google Scholar] [CrossRef]
- DiMaggio, P.J.; Powell, W.W. The Iron Cage Revisited: Institutional Isomorphism and Collective Rationality in Organizational Fields. Am. Sociol. Rev. 1983, 48, 147–160. [Google Scholar] [CrossRef]
- Freeman, R.; Mcvea, J. A Stakeholder Approach to Strategic Management. In The Blackwell Handbook of Strategic Management; Wiley: Hoboken, NJ, USA, 2001. [Google Scholar] [CrossRef]
- Suchman, M.C. Managing legitimacy: Strategic and institutional approaches. Acad. Manag. Rev. 1995, 20, 571–610. [Google Scholar] [CrossRef]
- Bhutta, U.S.; Tariq, A.; Farrukh, M.; Raza, A.; Iqbal, M.K. Green bonds for sustainable development: Review of literature on development and impact of green bonds. Technol. Forecast. Soc. Change 2022, 175, 121378. [Google Scholar] [CrossRef]
- Dechezleprêtre, A.; Sato, M. The impacts of environmental regulations on competitiveness. Rev. Environ. Econ. Policy 2017, 11, 183–206. [Google Scholar] [CrossRef]
- Lins, K.V.; Servaes, H.; Tamayo, A. Social capital, trust, and firm performance: The value of corporate social responsibility during the financial crisis. J. Financ. 2017, 72, 1785–1824. [Google Scholar] [CrossRef]
- Hambali, A.; Adhariani, D. Corporate biodiversity disclosure: The role of institutional factors and corporate governance. Corp. Soc. Responsib. Environ. Manag. 2024, 31, 5260–5274. [Google Scholar] [CrossRef]
- Duho, D.M.; Duho, W.D.; Duho, K.C.T.; Asare, E.T. Determinants and convergence of biodiversity or extinction disclosures of mining firms in Africa. J. Environ. Manag. 2024, 370, 122471. [Google Scholar] [CrossRef]
- Marquis, C.; Qian, C. Corporate social responsibility reporting in China: Symbol or substance? Organ. Sci. 2014, 25, 127–148. [Google Scholar] [CrossRef]
- Kölbel, J.F.; Heeb, F.; Paetzold, F.; Busch, T. Can sustainable investing save the world? Reviewing the mechanisms of investor impact. Organ. Environ. 2020, 33, 554–574. [Google Scholar] [CrossRef]
- ISO 14001:2015; Environmental Management Systems—Requirements with Guidance for Use. International Organization for Standardization: Geneva, Switzerland, 2015.
- Tang, P.; Jiang, Q.; Wang, C. Beyond environmental actions: How environmental regulations stimulate strategic-political CSR engagement in China? Energy Econ. 2024, 129, 107171. [Google Scholar] [CrossRef]
- Porter, M.E.; Linde, C.V.D. Toward a new conception of the environment-competitiveness relationship. J. Econ. Perspect. 1995, 9, 97–118. [Google Scholar] [CrossRef]
- Madison, N.; Schiehll, E. The Effect of Financial Materiality on ESG Performance Assessment. Sustainability 2021, 13, 3652. [Google Scholar] [CrossRef]
- Loko, A.G.S.; Schiehll, E. ESG Policy–Practice Decoupling: A Measurement Framework and Empirical Validation. Sustainability 2025, 17, 1203. [Google Scholar] [CrossRef]
Disclaimer/Publisher’s Note: The statements, opinions and data contained in all publications are solely those of the individual author(s) and contributor(s) and not of MDPI and/or the editor(s). MDPI and/or the editor(s) disclaim responsibility for any injury to people or property resulting from any ideas, methods, instructions or products referred to in the content. |
© 2025 by the authors. Licensee MDPI, Basel, Switzerland. This article is an open access article distributed under the terms and conditions of the Creative Commons Attribution (CC BY) license (https://creativecommons.org/licenses/by/4.0/).