Article

Natural Environmental Change and Firm Sustainable Development in China: The Moderating Effect of Slack Resources and Digital Transformation

1
Business School, Hohai University, Nanjing 211100, China
2
SKEMA Business School, China Campus, Suzhou 215123, China
*
Author to whom correspondence should be addressed.
Sustainability 2025, 17(9), 4232; https://doi.org/10.3390/su17094232
Submission received: 19 March 2025 / Revised: 22 April 2025 / Accepted: 28 April 2025 / Published: 7 May 2025

Abstract

The existing research lacks a comprehensive framework to explain the impact of natural environmental change on corporate sustainable development. After analyzing 2010–2023 data from 4816 Shanghai/Shenzhen A-share firms (39,271 firm-year observations), fixed-effects models reveal that natural environmental change improves financial performance but harms environmental–social performance. Absorbed slack resources weaken the positive influence of natural environmental change on financial performance and the negative influence on environmental–social performance; unabsorbed slack resources strengthen the influence of natural environmental change on financial performance but weaken the negative influence on environmental–social performance. Digital transformation diminishes the positive financial effects of natural environmental change. Findings suggest that firms should prioritize strategic slack resource allocation to manage environmental uncertainty, as digital initiatives currently demonstrate limited effectiveness in mitigating these challenges.

1. Introduction

Changes within the natural environment can restrict human access to crucial resources such as water, food, minerals, and land, thereby significantly impacting human society. According to The Global Risks Report 2025, whether in the short or long term, natural environmental changes represented by extreme climate events have become one of the greatest risks facing mankind. Meanwhile, more than 70% of global business activities have been affected by frequent extreme weather events [1]. Nowadays, how to deal with the change in natural environment is really an important issue for the sustainable development of enterprises.
Despite the challenges, management scholars have often been slow to respond to the complexities of natural environmental changes [2,3]. Existing studies have focused on the impact of physical changes in nature on firm-level financial performance [4] and ESG [5]. Meanwhile, the perception of changes in the natural environment is also regarded as a key factor influencing the sustainable development of enterprises [6]; enterprises will adapt or mitigate due to changes in perception to ensure their own survival and development [7]. However, the existing research has not integrated the physical changes or the perceived changes into a framework to think more comprehensively about how enterprises respond to natural environmental change to achieve sustainable development. Therefore, it is necessary to re-examine the impact of natural environmental change on the sustainable performance of enterprises.
When dealing with environmental change, a company’s resource base is crucial. Enterprises can cushion the impact of the system, market, and other environments through slack resources [8]. They can also use technological breakthroughs such as artificial intelligence and big data to optimize the ability to allocate resources through digital transformation [9]. However, we do not yet know which changes are brought about by resource redundancy and digital transformation as companies pursue sustainable development in response to natural environmental change, and this requires further exploration.

2. Literature Review

2.1. Definition and Composite of Natural Environmental Change

The development of society and economy is shaped by interaction between humans and the natural environment [10]. Natural environmental change in this study refers to the environmental change caused by water, soil, geography, temperature, climate, and other natural elements. One of the most striking features of natural environmental change is its uncertainty. This unexpected change arises from the natural environment’s role as a vast information source that is characterized by unsystematic and non-linear shifts and has a substantial impact on the operation of business entities [11]. On the one hand, the natural environment has an objective impact on business, and natural environmental uncertainty stems from physical changes in the natural environment [12], e.g., extreme weather events and temperature affect the green innovation of enterprises, thus promoting firm sustainable development [13]. On the other hand, natural environmental change pertains to the challenges associated with accurately observing, analyzing, perceiving, and predicting changes in natural states [14]. The perceived changes stem from physical changes, but due to the existence of differences such as executive personality traits and institutional pressure, the two do not always remain consistent. Consequently, natural environmental change constitutes two dimensions: objective and physical changes of the natural environment and subjective and cognitive changes from the natural environment.

2.2. Composite of Sustainable Development

The concept of sustainable development has been rooted in ecology and the understanding of the utilization of both renewable and non-renewable resources, such as forests, fisheries, and minerals. The United Nations Sustainable Development Goals (SDGs) delineate the development challenges that must be addressed across these three dimensions: social, economic, and environmental [15], also known as the triple bottom line (TBL). Because the activities of enterprises to protect the environment and serve society are often considered non-market strategies in practice, management scholars often further summarize the three dimensions of sustainable development into corporate environmental–social performance (CESP) and corporate financial performance (CFP) at the corporate level [16,17]. Therefore, corporate sustainable performance refers to the value or effectiveness of enterprises in finance, society, and the environment, including continuously improved financial performance and healthy environmental–social performance [18].

2.3. Natural Environmental Changes, Resource Slack, and Digital Transformation Under the Resource-Based View

The resource-based view (RBV) is well suited to addressing what causes firms to perform well on a sustained basis [19]. The natural environment provides enterprises with natural resources that are indispensable resource bases for enterprise operation. Hart (1995) proposed the natural resource-based view (NRBV), believing that change in the natural environment affects the service and supply of natural resources, and further impacts enterprise performance [20]. The uncertainty of the natural environment can hinder companies’ ability to secure essential resources [21], while natural environmental changes also serve as both a foundation and a catalyst for enterprises to pursue sustainable development by fostering opportunities and driving reform [22]. Changes in the physical natural environment affect the direct acquisition of natural resources or cause disruptions in supply chain services, thereby influencing the natural resource base of enterprises. Perceived natural environmental changes affect the attention of decision-makers, causing changes in the ability of resource allocation to cope with the constraint of natural resources.
Secondly, in the process of responding to natural environmental change, enterprises will take the initiative to respond to and adjust the relationship between themselves and the natural environment by deploying slack resources to be more adaptable and allocate more resources to innovation [23]. With the intensification of natural environmental changes, more and more enterprises increase the reserves of material resources such as equipment and raw materials to cope with uncertainties. For example, ski resorts provide their own snow-making machines to deal with global warming [7]. Therefore, slack resources are effective means to enhance firm resilience for responding to unexpected crises [24].
Digital transformation is an exciting area for new applications of RBV [19], which refers to the increasing digitization of products and services and the implications of this change for business [25]. Digital transformation provides enterprises with virtual resources [26] and the assistance of optimizing the allocation of physical resources [27]. However, it will also take a large amount of expense and costs [28], which become a burden on the existing resource base of enterprises. There is still a debate about the impact of digital transformation on business performance. Several studies have concluded that digital transformation can significantly improve business performance by enhancing green innovation efficiency [29,30,31], whereas others hold that digital transformation has no significant relevance to firm performance, or even negatively affects firm performance [32,33,34].
Therefore, this paper expands RBV to deeply explore the changes that occur in the sustainable development performance of enterprises under the multiple resource conditions of slack resources and digital transformation in the face of natural resource constraints caused by natural environmental changes.

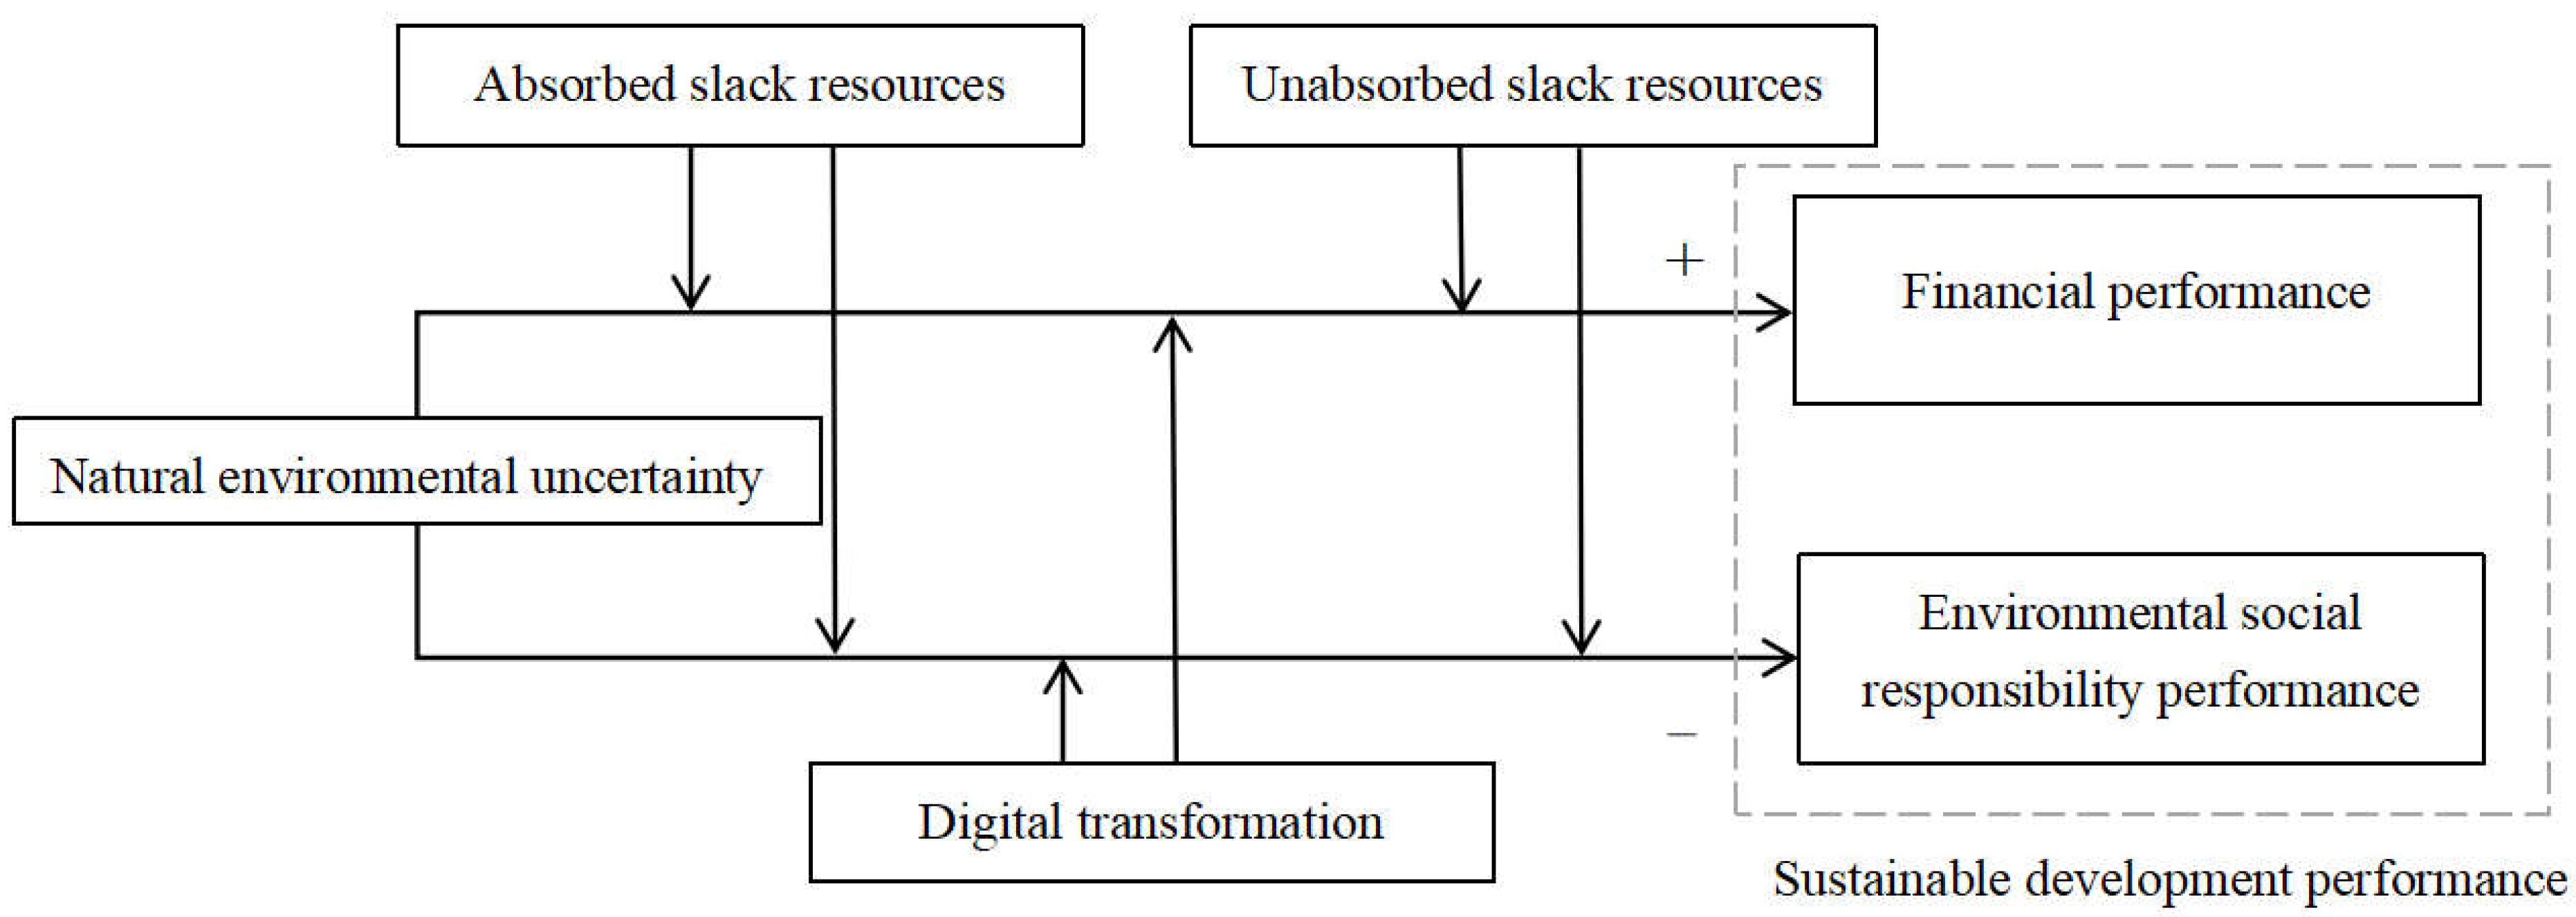
3. Hypothesis Development

3.1. Natural Environmental Change and Firm Sustainable Performance

Enterprises depend on the external environment to acquire resources and information. Environmental factors serve as significant boundary conditions influencing corporate behavior and are also crucial variables affecting corporate performance. As research progresses, an increasing number of scholars recognize that environmental change does not solely exert a negative impact on enterprises. Rather, this change could be transformed into opportunities that enhance performance and competitiveness [35].
The highly changeable natural environment presents numerous opportunities, enabling enterprises to effectively reconstruct their resources. The intensification of physical changes leads to the instability of enterprises’ natural resource base, forcing them to seek alternative raw materials or more resilient supply chains to ensure economic competitiveness. Perceived changes will lead firms to shift their attention to dealing with risks in the natural environment, and the inclination of management resources will promote the prediction and prevention of crises. These changes may act as a catalyst for these enterprises to engage in development activities, with the intensity of such changes influencing their choices regarding model innovation [36]. On this basis, natural environmental change provides all enterprises with equal competitive opportunities and blurs the boundaries of entire industries, rendering market participants indistinct and uncertain. Consequently, the resource basis and allocation practices that companies previously relied upon have become less effective, diminishing their ability to fulfill expected roles, and undermining the advantages held by first-mover companies [37]. Such natural environmental change may motivate companies to invest and instigate significant changes. Enterprises are compelled to accelerate their integration into the dynamically evolving environment, rapidly adapt to create new knowledge and practices, and establish a robust development platform to address unforeseen natural environmental change, thereby maintaining their competitiveness in the market. Based on this analysis, this article proposes the following hypotheses:
Hypothesis 1.
There is a positive correlation between natural environmental change and the financial performance of enterprises.
Environmental and social responsibility activities have certain commonalities with R&D activities in that they are not rewarded in kind, are more risky, and have longer payback periods, and companies are more cautious when engaging in related activities. Companies tend to exercise caution when engaging in such activities. From the perspective of perceived natural environmental change, natural environmental change can catch firms’ attention and shift corporate risk preferences towards more immediate concerns [38], which in turn affects environmental–social performance. For example, severe cold can prompt enterprises to increase heating rather than worry about carbon issues. Increased physical natural environmental change also may affect the ability of enterprises to access key resources. Enterprises will be more inclined to prioritize the investment of their limited resources in protecting financial performance [39], which in turn may lead to a reduction in the investment of resources in environmental–social aspects of the enterprise, limiting the improvement of its environmental–social performance. Based on this analysis, this article proposes the following hypotheses:
Hypothesis 2.
There is a negative correlation between natural environmental change and the environmental–social performance of enterprises.

3.2. The Moderating Effect of Slack Resources

Slack resources facilitate enterprises’ response to external environmental pressures such as climate change [40], which is manifested in two forms: absorbed slack and non-absorbed slack.

3.2.1. Absorbed Slack Resources

Absorbed slack resources refer to idle resources that are specifically oriented toward enterprise-specific applications and are closely associated with the key internal business processes of the enterprise [41]. These resources are primarily utilized in non-innovative activities within the production and operational processes of the enterprise. This type of resource exhibits a limited scope of use and low liquidity, characterized by a high degree of asset specificity. It is typically tailored to specific application scenarios and possesses weak resource conversion and utilization capabilities. Consequently, reallocating resources within the organization prove to be both challenging and inflexible, leading to high coordination costs. Due to its pronounced specificity, the resulting redundancy restricts the flexibility of resource reallocation, which can contribute to rigidity in the environmental matching behavior of enterprises. As a result, these enterprises often respond slowly to natural environmental change, potentially missing developmental opportunities and hindering their financial performance.
It is challenging for companies to yield tangible returns on environmental social activities, and they are often associated with higher risks and longer payback periods. The presence of absorbed slack resources may lead managers of enterprises to concentrate on activities essential for the survival of the enterprise, potentially resulting in a narrow and singular strategic focus [42]. Existing studies have found that absorbed slack resources have a negative effect on a firm’s social and environmental performance [43,44], because the absorbed slack cannot be reused in non-business activities. This study holds that enterprises with a high degree of absorbed slack resources have more difficulty in mobilizing these resources to implement behaviors that protect the environment and give back to society when responding to natural environmental changes. That is to say, absorbed slack resources could diminish the sensitivity of enterprises to uncertainties in the natural environment, making them vulnerable to disruptions from minor changes in that environment. Based on this premise, this paper proposes the following hypotheses:
Hypothesis 3.
Absorbed slack resources moderate the positive relationship between natural environmental change and financial performance, which is weaker when absorbed slack resources are more sufficient.
Hypothesis 4.
Absorbed slack resources moderate the negative relationship between natural environmental change and environmental–social performance, which is stronger when absorbed slack resources are more sufficient.

3.2.2. Unabsorbed Slack Resources

Unabsorbed slack resources refer to idle resources that are not restricted to specific uses within the enterprise [45]. These resources can be flexibly allocated in the context of production and operational management, as well as product and service innovation [46]. Unabsorbed slack resources lack clear scope and boundaries of use, exhibit low asset specificity, possess strong flexibility, and can be rapidly mobilized by enterprises. In contrast to absorbed slack resources, unabsorbed slack resources are not closely tied to the daily operational activities of the enterprise, granting enterprises greater autonomy in their scheduling and utilization. When uncertain environments create development opportunities, the unabsorbed slack resources owned by the enterprise could be swiftly deployed and transformed into new profit growth points, thereby enabling enterprises to gain a competitive advantage in development. Conversely, when enterprises face uncertainties in the natural environment, the flexible characteristics of unabsorbed slack resources allow for their rapid conversion into various resources needed by the enterprise, thereby minimizing the adverse effects of natural environmental change. This adaptability can mitigate the loss of core business operations caused by these uncertainties. In such cases, the accumulation of unabsorbed slack resources can facilitate a swift adaptation to the natural environment, enabling continued production and operational activities.
In response to the change in the natural environment, enterprises actively seek to expand external channels to secure stable resources while fulfilling their environmental and social responsibilities. The unabsorbed slack resources as surplus resources provide conditions for enterprises to carry out non-short-term behaviors. When the level of unabsorbed slack is high, it can help enterprises reduce risks and uncertainties arising from stakeholders and shareholders. In such a relaxed environment, enterprises are alleviating the negative relationship between nature environmental change and social performance. For environmental performance, not unabsorbed slack resources can shape a more flexible environment, helping enterprises have more flexibility to transfer or reconfigure resources to solve environmental issues, and also weaken the negative main effect. Based on this analysis, the following hypotheses are proposed:
Hypothesis 5.
Unabsorbed slack resources moderate the positive relationship between natural environmental change and financial performance, which is stronger when unabsorbed slack resources are more sufficient.
Hypothesis 6.
Unabsorbed slack resources moderate the negative relationship between natural environmental change and environmental–social performance, which is weaker when unabsorbed slack resources are more sufficient.

3.3. The Moderating Effect of Digital Transformation

According to the digital paradox [47], despite the fact that companies have already invested heavily in digital transformation, they usually do not get the same returns. Developments in the field of digital technology are rapidly changing, and enterprises need to continuously invest money and resources to update and iterate their technologies, which may be faster than the enterprises can afford, resulting in a lower return on investment, and may even render the technology obsolete. In addition, when the degree of digital transformation of enterprises is high, enterprises rely excessively on digital technology and pay less attention to natural environmental change. In this case, enterprises with a high degree of digital transformation are often unable to make timely changes or model innovations based on changes in the natural environment, which may instead weaken the positive impact of natural environmental change on financial performance.
In addition, digital transformation is often accompanied by investments in new technologies and equipment that may require the consumption of more firm resources, such as energy and materials [32]. In the context of high natural environmental change, resource scarcity and price volatility may increase, leading to higher resource acquisition costs and environmental risks for enterprises. This increased dependence may make it more difficult for enterprises to fulfill their environmental social responsibilities, especially in contexts of resource constraints or stringent environmental regulations. Based on this analysis, the following hypotheses are proposed:
Hypothesis 7.
The degree of digital transformation moderates the positive relationship between natural environmental change and financial performance, which is weaker when the degree of digital transformation is higher.
Hypothesis 8.
The degree of digital transformation moderates the negative relationship between natural environmental change and environmental–social performance, which is stronger when the degree of digital transformation is higher.

4. Methodology

4.1. Sample Selection and Data Source

This article examines 4816 Chinese companies listed on the Shanghai and Shenzhen A-shares from 2010 to 2023 as research samples. We implemented the subsequent procedures on the sample: (1) we omitted financial listed enterprises, (2) we excluded information from companies bearing ST and *ST designations, and (3) we removed samples characterized by incomplete or irregular financial data. Every continuous variable underwent winsorization at the 1st and 99th percentiles. As a result of these steps, a total of 39,271 firm-year observations were obtained. The data and sources necessary for calculating natural environmental change are detailed in the variable description and will not be reiterated here. The data regarding the environmental, social, and governance (ESG) performance of the companies were sourced from the Wind database. In contrast, the data for the other variables employed in this study were acquired from the CSMAR database. Data processing and regression analysis were conducted. See Figure 1.

4.2. Measurement

4.2.1. Dependent Variables

Drawing on the research of Alexopoulos et al. [48], this study categorizes corporate sustainable performance into two dimensions: financial performance and environmental–social performance. Corporate financial performance is defined according to the work of Alsaifi et al. [49] and is measured by the company’s return on net assets (ROA); corporate environmental and social responsibility performance is based on the research of Lian et al. [50] and is evaluated using the Sino-Securities Index ESG ratings from the Wind database. The ratings are categorized into nine distinct levels according to various performance benchmarks. Adopting the methodology proposed by Lian et al. [50], we allocate levels ranging from AAA-C to 9-1 to facilitate quantification. Given that the Sino-Securities Index ESG ratings are reported on a quarterly basis, this study computes the annual ratings by taking the average of the quarterly data.

4.2.2. Independent Variable

The independent variable of this article is the natural environmental change encountered by enterprises. From the perspective of information uncertainty, a company cannot acquire perfect knowledge about its external natural environment, and this lack of information will trigger uncertainty about the natural environment within the organization [51,52]. Currently, scholars recognize the influence of natural environmental change on enterprise development; however, there is no standardized system for measuring this concept. This lack of a unified measurement framework leads to challenges in comparing different companies, industries, and regions.
Referring to the research of Ref. [53], the entropy weight method is used for index construction in this paper. Environmental change is used in one part by scholars as a description of the state of the environment, and in another to describe the state of observers who believe they lack critical information about the environment [52]. The former means that the environment can be described according to the objective uncertainty of the environment, while the latter means that environmental uncertainty is essentially “in the eyes of bystanders” and therefore [54] should be studied as a perceptual phenomenon. When assessing flood hazards, Dou et al. (2018) proposed a combination of weights, considering the uncertainty of flooding, to make the weights of the indicators reflect both subjective experience and objective data [55]. Given this, this paper constructs a natural environmental change index based on two dimensions: objective physical natural environmental conditions and subjective perceived natural environmental change (Table 1). Utilizing the calculated natural environmental change index, we assess the environmental change faced by enterprises.
Because climate change is one of the most threatening natural environmental problems today [56], this paper characterizes natural environmental change in terms of the degree of climate change. Based on the results of other studies [57,58], annual average differences in the three meteorological indicators of temperature, precipitation, and wind power are used to quantify the physical natural environmental uncertainty faced by enterprises. The study will first manually locate the main office city of the listed company and match the weather station that is closest to that city in a straight line; then, temperature, precipitation, and wind data will be obtained from that station and the difference between the annual average temperature for that year and the average temperature for all years (the same for precipitation/wind) will be calculated to measure the physical natural environmental uncertainty that the company is facing. In addition, referring to the research of Wu (2022) [59], this study constructs a canon of keyword synonyms for climate change risk to measure firms’ perception of natural environmental change in terms of their perceived level of climate risk. This study retrieved the keywords in the social responsibility and sustainable development report from WinGo, which is a commonly used financial and economic structured text database platform. The higher the word frequency, the more the enterprise pays attention to the climate and invests resources in it, and the higher the level of perceived climate change by the enterprise. The keyword lexicon is shown in Table 2.
Finally, referring to the research of Li et al. (2019) [53], in this paper, the entropy weight method is used for index construction. The generation of uncertainty in the natural environment often stems from the disorderly degree of change in certain factors. Therefore, using the entropy weight method to determine the weights can better reflect the influence of factor indicators on changes in the natural environment. The smaller the entropy value is, the greater the degree of variation (dispersion) of this index will be, indicating that the amount of information contained in this index is greater, its importance in the comprehensive index system is greater, and the weight of this index is greater. The steps for determining the weight by the entropy weight method are as follows:
(1)
Construct the original data as a judgment matrix R:
R = (I = 1, 2, …, n; j = 1, 2, …, m)
(2)
The data of the judgment matrix R are normalized to become the standardized matrix U. Different standardization methods are adopted according to the positive and negative directions of the indicators:
u i j = r i j r m i n r m a x r m i n
u i j = r m a x r i j r m a x r m i n
rmax and rmin represent the most satisfactory or least satisfactory aspects of different things, respectively, under the same evaluation index (the larger, the more satisfied, or the smaller, the more satisfied).
(3)
Calculate the probability Pij of each state and construct the probability matrix:
P i j = u i j j = 1 m u i j
(4)
Calculate the entropy of each evaluation index as:
H i j = P i j ln P i j ln n
Obviously, when Pij = 0, it is meaningless. Therefore, the calculation of Equations (3) and (4) is corrected to:
P i j = 1 + u i j j = 1 m ( 1 + u i j )
(5)
The entropy weight Wi of the evaluation index i is:
W i = ( w i ) 1 n = 1 H i n i = 1 n H i 1 n
Here, w i = 1, and Hi is the entropy of each evaluation index.

4.2.3. Moderating Variables

Drawing on Tyler’s research [60], slack resources are represented from two dimensions: absorbed slack resources and unabsorbed slack resources. Absorbed idle resources are measured by the ratio of the sum of administrative expenses and selling expenses to sales revenue, while unabsorbed idle resources are measured by the ratio of current assets to current liabilities. Concerning previous literature [61,62], digital transformation is measured by calculating the frequency of 76 digitization-related terms across five dimensions: artificial intelligence technology, big data technology, cloud computing technology, blockchain technology, and digital technology use.

4.2.4. Control Variables

Drawing upon existing literature within the same field [63], this study identifies relevant control variables based on the company’s fundamental characteristics, governance features, and external environment (see Table 3). The primary variables include enterprise size (Size), enterprise age (Age), the shareholding ratio of the largest shareholder (Nol), the ratio of intangible assets (Int), equity ratio (ER), asset–liability ratio (Lev), the intensity of government subsidies (Sub), financing constraints (SA), capital intensity (CI), cashflow ratio (CF), and impact of the pandemic (Peri). Peri is a temporal dummy variable; on January 30, 2020, the World Health Organization officially categorized COVID-19 as a global public health emergency, a designation that reflected the broad and urgent nature of the crisis [64]. Therefore, in this paper, the date after 2020 is defined as the period of impact of the pandemic, and Peri takes a value of 1 in the range of the period of impact, and 0 otherwise. The table that follows provides detailed and precise definitions for each of the variables under consideration, ensuring clarity and facilitating a comprehensive understanding of their respective meanings.

4.3. Method and Research Model

The Hausman test shows the rejection of the random-effects model hypothesis (p < 0.01), so we construct panel data fixed-effects models to further investigate the impact of natural environmental change on the financial and environmental–social performance of firms.
Models 1 and 2 are formed to verify the impact of natural environmental change on the financial and environmental performance of firms. This study constructs Models (3)–(8). In these models, the dependent variables include financial performance (Fina) and environmental–social performance (Envi). The explanatory variable is natural environmental change (Nec). The moderating variables are absorbed slack resources (RS), unabsorbed slack resources (AS), and digital transformation (DT), respectively.
The variables i and t in the multivariate regression model below represent individual companies and years, respectively. This study focuses on estimating the coefficients β0 and β1 of Neci,t, which measure the effect of natural environmental change on financial performance and environmental–social performance, respectively. μ t denotes year fixed effects, αi represents firm individual fixed effects, εi,t represents the random disturbance term, and Controls refers to the control variables selected in this study.
Finai,t = β0 + β1Neci,t + Σβi Controlsi,t + αi + εi,t
Envii,t = β0 + β1Neci,t + Σβi Controlsi,t + αi + εi,t
Finai,t = β0 + β1Neci,t + β2RSi,t + β3RSi,t Neci,t + Σβi Controlsi,t + αi + εi,t
Envii,t = β0 + β1Neci,t + β2RSi,t + β3RSi,t Neci,t + Σβi Controlsi,t + αi + εi,t
Finai,t = β0 + β1Neci,t + β2ASi,t + β3ASi,t Neci,t + Σβi Controlsi,t + αi + εi,t
Envii,t = β0 + β1Neci,t + β2ASi,t + β3ASi,t Neci,t + Σβi Controlsi,t + αi + εi,t
Finai,t = β0 + β1Neci,t + β2DTi,t + β3DT,t Neci,tt + Σβi Controlsi,t + αi + εi,t
Envii,t = β0 + β1Neci,t + β2DTi,t + β3DT,t Neci,tt + Σβi Controlsi,t + αi + εi,t

5. Empirical Results

5.1. Descriptive Statistics

The descriptive statistics of the variables are presented in Table 4. As indicated in Table 4, the mean value of corporate financial performance (Fina) is 0.052, with a standard deviation of 0.141, a maximum value of 0.334, a minimum value of −0.788, and a median of 0.068. This suggests a considerable disparity in corporate financial performance among the samples, with a left-skewed distribution influenced by the minimum values. The mean value of corporate environmental–social performance (Envi) is 4.133, with a maximum value of 6.000, a minimum value of 1.500, a standard deviation of 0.916, and a median of 4.000. This indicates a significant gap in environmental–social performance across different enterprises, characterized by a right-skewed distribution due to the maximum values. The mean value of the natural environmental change index (Nec) is 0.083, with a maximum value of 0.209, a minimum value of 0.016, a standard deviation of 0.043, and a median of 0.074, also exhibiting a right-skewed distribution influenced by the maximum value. The mean value of absorbed slack resources (RS) is 0.162, with a maximum value of 0.691, a minimum value of 0.013, a median of 0.125, and a standard deviation of 0.131, resulting in a right-skewed distribution due to the maximum value. The mean value of unabsorbed slack resources (AS) is 0.680, with a maximum value of 3.043, a minimum value of 0.055, a median of 0.575, and a standard deviation of 0.514, which also shows a right-skewed distribution influenced by the maximum value. The mean value of digital transformation (DT) is 12.910, with a maximum value of 172.000 and a minimum value of 0.0000. The standard deviation is 27.860, and the median is 2.000, resulting in a right-skewed distribution affected by the maximum value. The descriptive statistics for the remaining variables have been analyzed previously and will not be reiterated here.

5.2. Correlation Matrix

Regarding the control variables examined, the findings indicate that variables such as company size, maturity (Age), dual leadership structure (Dual), non-operating losses (Nol), innovation (Int), earnings retention (ER), leverage (Lev), subsidiaries (Sub), corporate image (CI), capital flow (CF), and period (Peri) exhibit a statistically significant positive correlation with both financial performance (Fina) and environmental performance (Envi) at the 1% significance level (see Table 5). This observation underscores the strong interlinkage between a firm’s scale, financial robustness, governance efficacy, and capacity for sustainable development.

5.3. Regression Results

5.3.1. Impact of Natural Environmental Change and Sustainable Performance

Table 6 presents the regression results concerning the impact of natural environmental change (Nec) on the financial performance and environmental–social performance of enterprises. Results (1) and result (2) indicate that while natural environmental change significantly enhances financial performance (β = 0.108, p < 0.01), it also harms the environmental–social performance of enterprises (β = −0.425, p < 0.01). For most companies, achieving financial performance alongside environmental and social performance is challenging due to limited resources. Increased natural environmental change will affect the ability of enterprises to access key resources, so enterprises will be more inclined to prioritize the investment of their limited resources in improving financial performance, which in turn may lead to a reduction in the investment of resources in environmental–social aspects of the enterprise, limiting its environmental–social performance.

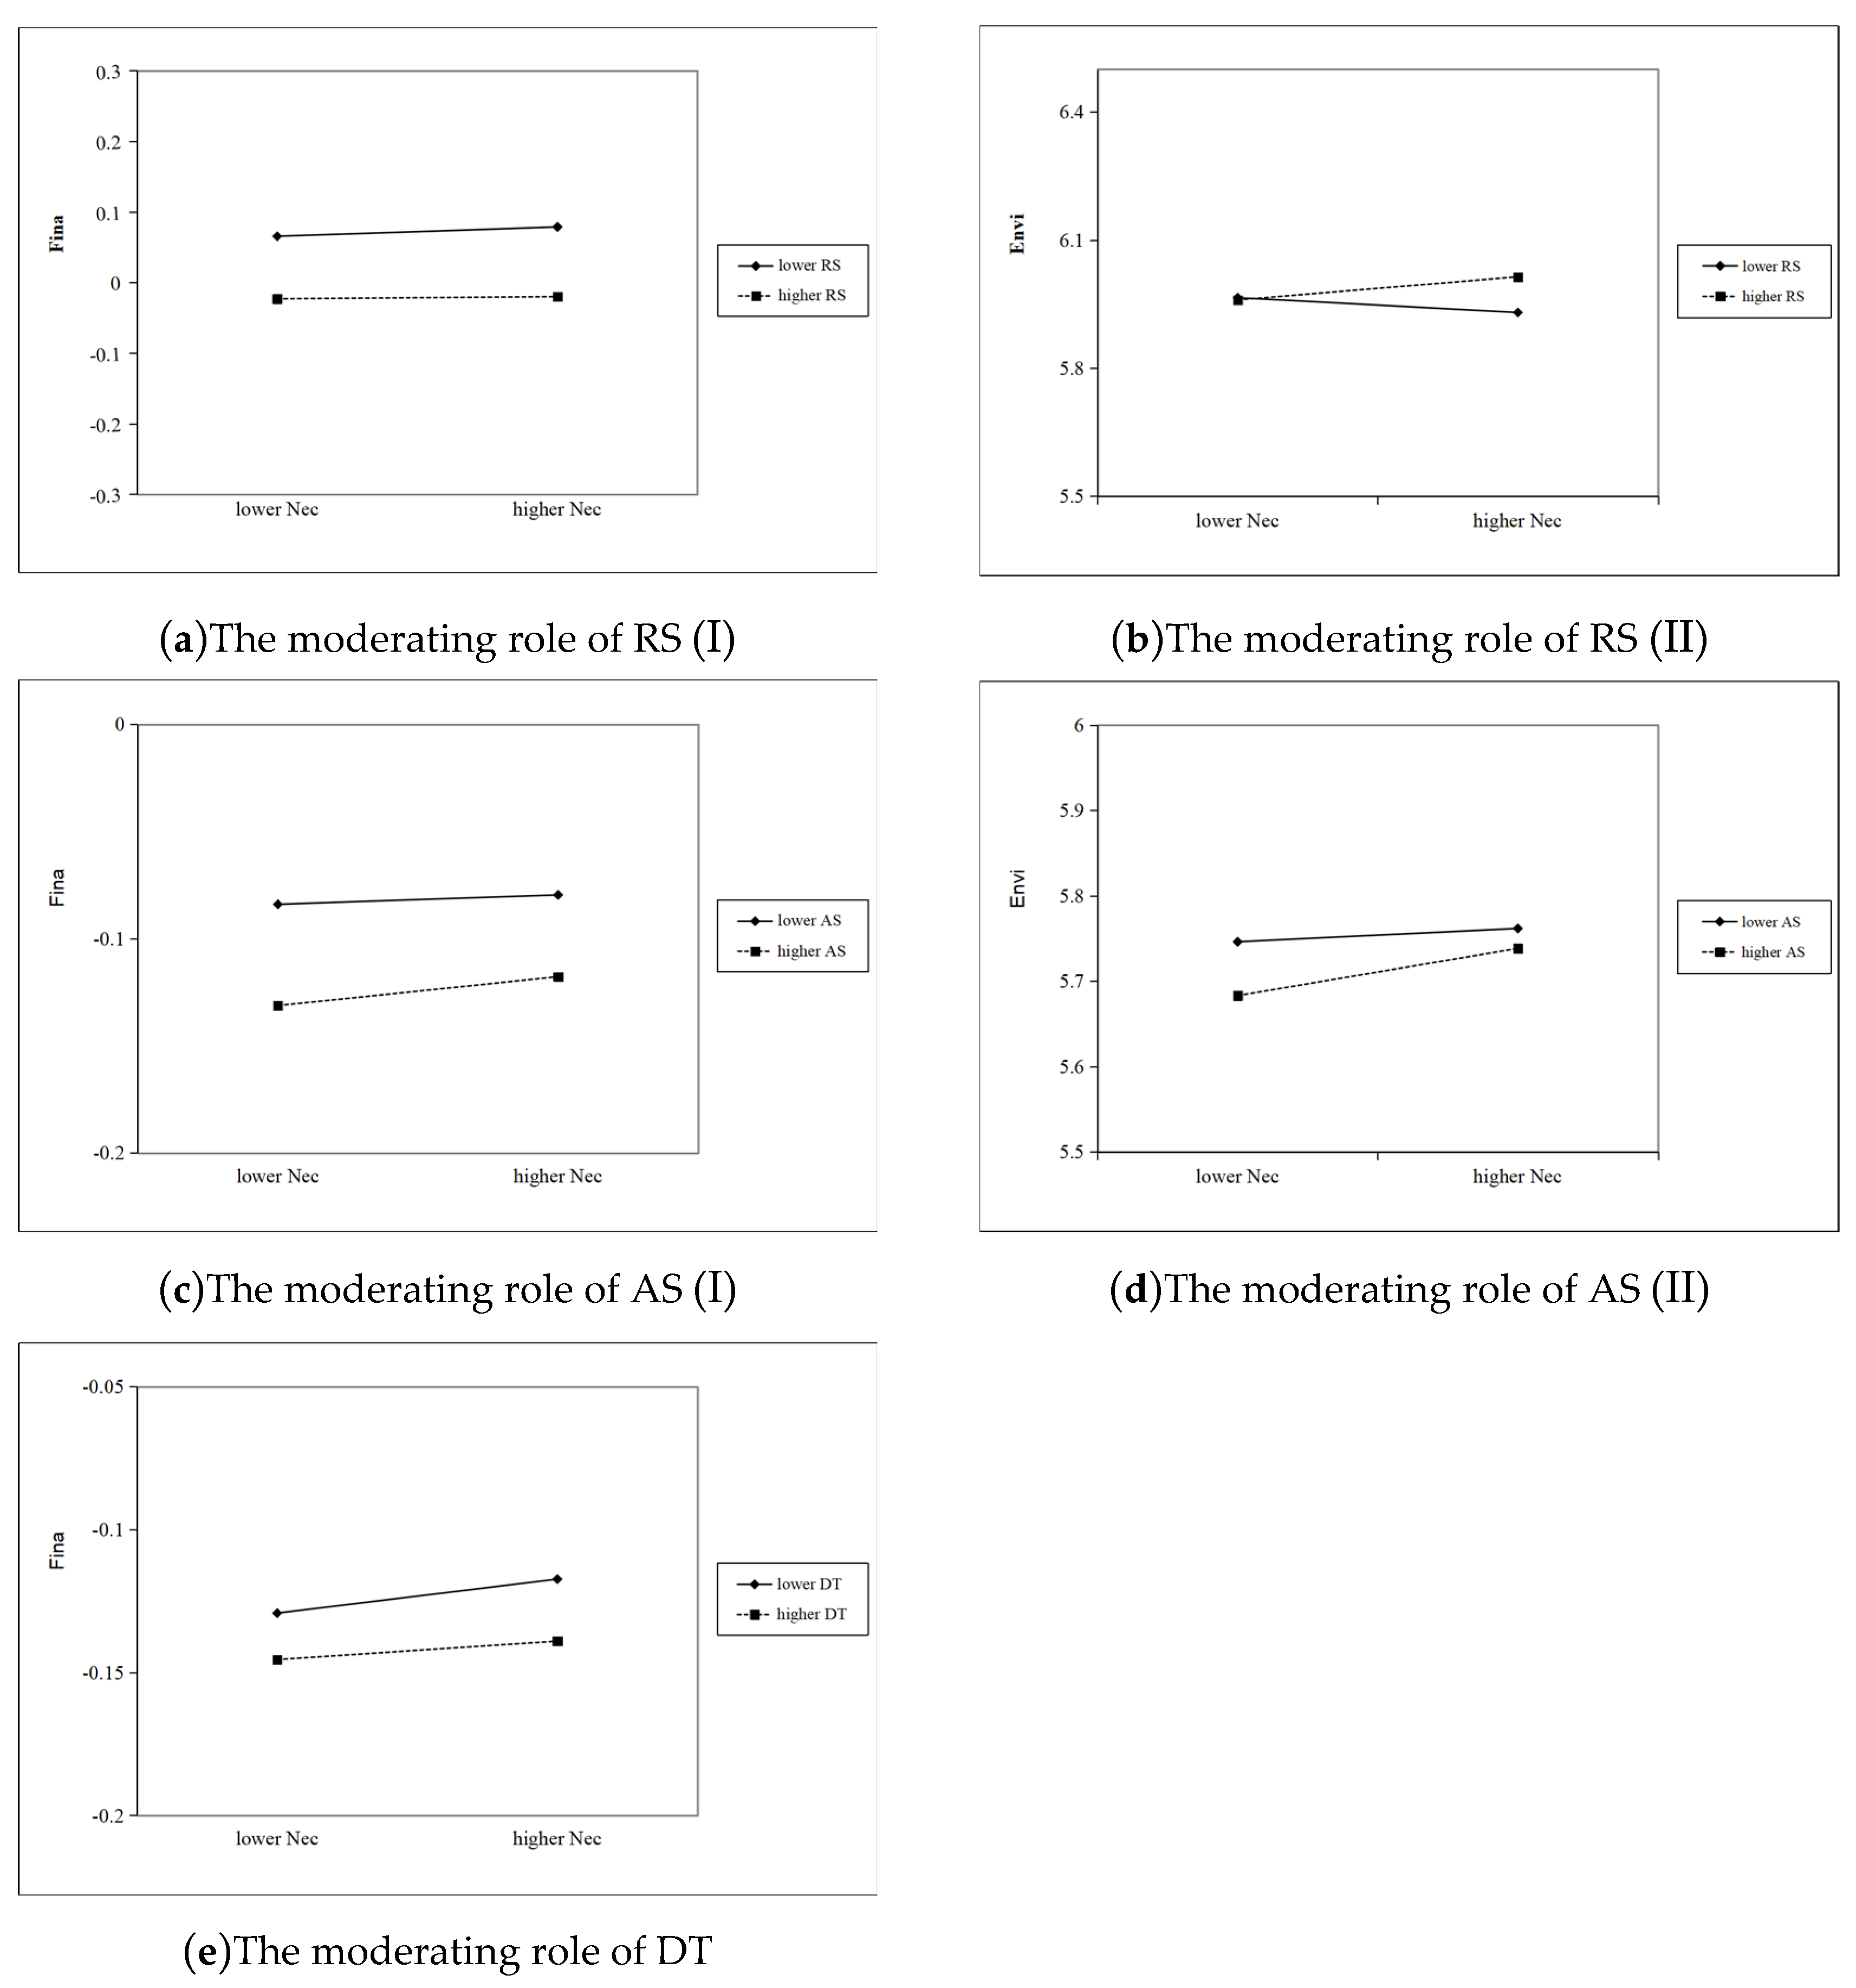
5.3.2. Moderating Effect

Table 7 presents the regression results of the moderating effect of absorbed slack resources on the financial performance and environmental–social performance of enterprises. The regression results indicate that the coefficient of the interaction term between absorbed slack resources and natural environmental change is −0.448, which is statistically significant at the 5% level. This suggests that absorbed slack resources weaken the positive relationship between natural environmental change and financial performance, thereby confirming Hypothesis 3. Furthermore, the coefficient of the interaction term between absorbed slack resources and natural environmental change is 3.928, which is significant at the 1% level. This indicates that absorbed slack resources weaken the negative relationship between natural environmental change and financial performance and environmental–social performance; therefore, Hypothesis 4 is not proven.
Table 8 illustrates that the coefficient of the interaction term between unabsorbed slack resources and natural environmental change is 0.102, which passes the 1% significance test. This indicates that unabsorbed slack resources strengthen the positive relationship between natural environmental change and financial performance, thereby verifying Hypothesis 5. Additionally, the coefficient of the interaction term between unabsorbed slack resources and natural environmental change is 0.447, which passes the 5% significance test. This indicates that unabsorbed slack resources strengthen the negative relationship between natural environmental change and environmental–social performance, thereby verifying Hypothesis 6.
Table 9 presents the regression results of the moderating effect of digital transformation on financial performance and environmental–social performance of enterprises. The regression results indicate that the coefficient of the interaction term between digital transformation and natural environmental change is −0.001, which is statistically significant at the 10% level. This suggests that the degree of digital transformation weakens the positive relationship between natural environmental change and the financial performance of enterprises, thereby confirming Hypothesis 7. Furthermore, The coefficient on the interaction term for model 8 is not significant. (β = 0.005, p > 0.1), Hypothesis 8 is not proven.
To explore the specific direction of the moderating effect in depth, this study uses the PROCESS plug-in in SPSS 25.0, and the moderating effect is plotted, as detailed in Figure 2.
Figure 2a indicates that the positive effect between natural environmental change and financial performance is significantly weaker in the context of a higher level of absorbed slack resources. Figure 2b indicates that the decrease in the level of absorbed slack resources significantly weaken the negative effect of natural environmental change on environmental–social performance.
Figure 2c shows that unabsorbed slack resources moderate the positive relationship between natural environmental uncertainty and financial performance specifically, which is stronger when unabsorbed slack resources are more sufficient. Figure 2d shows that unabsorbed slack resources also weaken the negative relationship between natural environmental change and environmental–social performance.
Figure 2e illustrates that the degree of digital transformation moderates the positive relationship between natural environmental change and financial performance specifically, which is weaker when the degree of digital transformation is higher.

5.4. Robustness Test

5.4.1. Substitute Variables

Substituting variables is a common method for robustness testing in regression analysis. This study employs return on total assets (ROA) as a metric for the financial performance of companies, while the ESG score instead of the ESG rating [65] is utilized to represent environmental–social performance in the robustness test. The regression results are presented in Table 10: the coefficient of the interaction term between absorbed slack resources and natural environmental change is −0.181, which passes the 1% significance test. Consequently, the effect of absorbed slack resources on the relationship between natural environmental change and financial performance remains significant, thereby demonstrating that the empirical results are both robust and reliable. Similarly, the coefficient of the interaction term between absorbed slack resources and natural environmental change is 20.866, passing the 1% significance test. This indicates that the effect of absorbed slack resources on the relationship between natural environmental change and financial performance also remains significant. Thus, the empirical results are shown to be robust and reliable.
Table 11 demonstrates that the coefficient of the interaction term between unabsorbed slack resources and natural environmental change is 0.042 and 2.203, which both pass the 1% significance test. This indicates that the effects of unabsorbed slack resources on the relationship between natural environmental change and financial performance and environmental–social performance remain significant. Furthermore, the robustness of the regression results aligns with the main regression findings, confirming the empirical results’ robustness and reliability.
Table 12 indicates that the coefficient of the interaction term between digital transformation and natural environmental change is −0.0008, which passes the 10% significance test. This demonstrates that the effects of digital transformation on the relationship between natural environmental change and financial performance remain significant. The robustness of regression results aligns with the main regression findings, confirming the empirical results’ robustness and reliability.
In addition, referring to the study by Wei and Li (2024) [66], this paper uses the number of annual patent applications +1 to obtain the firm’s innovation level (lnPatent) as a proxy for the firm’s level of digital transformation, and the regression results in Table 13 show that the coefficients on the interaction terms of the proxies and the independent variables remain positive and marginally significant.

5.4.2. Stricter Fixed-Effects Model

The differences in the level of economic development and the level of construction of digital hardware in the provinces are taken into account, which affect the financial performance and green development performance of local firms. This paper further adds province fixed effects to ensure the robustness of the empirical results. Models (1) and (2) of Table 14 show that natural environmental change still significantly enhances financial performance and also harms the environmental–social performance of enterprises. Models (3) and (4) in Table 13 present the coefficient of the interaction term between absorbed slack resources and natural environmental change as −0.439, which passes the 1% significance test. This indicates that the moderating effect of absorbed slack resources on the relationship between natural environmental change and the financial performance of enterprises remains significant. Furthermore, the coefficient of the interaction term between precipitated redundant resources and natural environmental change is 4.003, which passes the 1% significance test, indicating that the moderating effect of absorbed slack resources on the relationship between natural environmental change and corporate environmental–social performance is likewise significant.
Table 15 presents the coefficient of the interaction term between unabsorbed slack resources and natural environmental change, which is 0.106 and passes the 1% significance test. This indicates that the moderating effect of unabsorbed slack resources on the relationship between natural environmental change and financial performance in enterprises remains significant. Furthermore, the coefficient of the interaction term between unabsorbed slack resources and natural environmental change is 0.486, which also passes the 1% significance test. This suggests that unabsorbed slack resources mediate the relationship between natural environmental change and corporate environmental–social performance, with the effect remaining significant.
Table 16 presents the coefficient of the interaction term between digital transformation and natural environmental change as −0.001, which passes the 10% significance test. This indicates that the moderating effect of digital transformation on the relationship between natural environmental change and the financial performance of enterprises remains significant, thereby demonstrating that the empirical results are both robust and reliable.

5.5. Endogeneity Issues

To control for the endogeneity problem, this paper employs the use of the average of other firms in the annual industry (IV_Nec) as an instrumental variable of fixed-effects–instrumental variables (FE–IV) regression, and the results are presented in Table 17. The results indicate that natural environmental change still significantly enhances financial performance and also harms the environmental–social performance of enterprises.

5.6. Industry Heterogeneity

5.6.1. High-Tech Enterprises and Non-High-Tech Enterprises

The development of high-tech enterprises is mainly driven by technology and relies on technological advantages [66], while non-high-tech enterprises are more dependent on physical assets and natural resources, so natural environmental change is more likely to force non-high-tech enterprises to come in and improve their economic performance through model innovation. Meanwhile, non-high-tech industries (e.g., mining, agriculture) usually consume a lot of resources that emit a lot of pollution, and face stricter environmental regulations. Through policies such as carbon taxes and environmental subsidies, governments are forcing companies to upgrade their green technologies or optimize their processes to promote their social and environmental performance. The results, as shown in Table 18, show that the positive effect of natural environmental change on financial performance is stronger in non-high-tech firms and that its effect on environmental social performance is not significant.

5.6.2. Energy-Intensive Enterprises and Non-Energy-Intensive Enterprises

Energy-intensive firms are subject to stronger government regulation due to their polluting emissions. As the degree of natural environmental change rises, the government will regulate its energy-intensive firms through policies such as carbon tax, pollution emission limitations, and environmental subsidies, driving them to invest heavily in green technologies, so the positive impact of natural environmental change on their financial performance and the negative impact of environmental social performance is not too strong. Based on the 2016 Statistical Bulletin on National Economic and Social Development in China, sectors characterized by high energy consumption encompass the following: (1) industries involved in petroleum refining, coking, and nuclear fuel processing; (2) the manufacturing sector focused on chemical raw materials and chemical products; (3) the industry dedicated to non-metallic mineral product production (e.g., cement, glass manufacturing); (4) the sector of ferrous metal smelting and rolling (encompassing, for instance, iron and steel smelting, as well as steel rolling operations); (5) the industry focused on non-ferrous metal smelting and rolling; and (6) the domain concerning the generation and provision of electric power along with thermal energy. The results in Table 19 show that both the positive impact of natural environmental change on financial performance and the negative impact on environmental social performance are only significant in non-energy-intensive industries and not significant for energy-intensive firms.

5.6.3. Manufacturing Industry and Non-Manufacturing Industry

The manufacturing industry usually relies on natural resource (e.g., energy, raw materials) inputs, so the impact of natural environmental changes on the manufacturing industry is more direct and drastic, and the environmental pressure will force enterprises to reduce costs through technological innovation or process optimization and thus improve long-term financial performance, but it is also easier to ignore environmental social responsibility performance. As shown in Table 20, in the manufacturing industry, the positive impact of natural environmental changes on financial performance and the negative impact on environmental and social performance are both stronger.

6. Discussion

This study analyzes the relationship between natural environmental change and firm sustainable performance, revealing that the impact of multiple resource characteristics, including natural resources, slack resources, and digital resources, to response the changes of natural environment. Such changes introduces uncertainty in the natural environment, which subsequently affects the sustainable performance of enterprises.
Natural environmental change has positive impact on the financial performance but negatively influence the environmental-social performance of enterprises. This finding aligns with the research results of Sun et al. (2020) [67] and Ling and Gao (2023) [38]. On the one hand, it is important to note that the uncertain change of natural environment presents developmental opportunities for these companies. These opportunities may allow them to better address natural resource challenges, improve their financial performance, and become a new source of competitive advantage for sustainable business growth. On the other hand, as enterprises always prioritize profitability in their operations, they are more inclined to prioritize the investment of their limited resources in improving financial performance in the face of the risks posed by change in the natural environment, which in turn may lead to a reduction in the investment of resources in environmental-social aspects of the enterprise, limiting the improvement of its environmental-social performance. Thus, this study finds that enterprises’ response to natural environmental change will not naturally improve their sustainable performance, but may damage the environment and society to ensure their economic development.
From the resources basis of the enterprise, the slack resources play the moderating role between natural environmental change and corporate sustainable performance. Absorbed slack resources weaken the positive relationship between natural environmental change and financial performance, and also reduce the negative impact of natural environmental change on financial performance. Absorbed slack resources is characterized by lower liquidity and flexibility, which makes it challenging for enterprises with absorbed slack resources to navigate a highly uncertain natural environment. When confronted with new opportunities arising from environmental changes, these companies may struggle to respond in a timely manner, potentially missing developmental opportunities and weakening their financial performance. However, absorbed slack plays a role of stabilizer between the natural environmental change and the environmental and social performance of enterprises. Because once environmental protection facilities or donation agreements are reached, they are difficult to be abandoned in a short time. This makes absorbed slack reduce the transfer and loss of resources caused by the natural environmental changes. Unlike absorbed slack resources, unabsorbed slack resources strengthen the positive relationship between natural environmental change and financial performance and weaken the negative relationship between natural environmental change and environmental-social performance. Unabsorbed slack resources poss a high degree of flexibility which reduce the internal constraints within enterprises, help resolve resource conflicts, and alleviate organizational structural and managerial psychological limitations in uncertain environments [68]. When enterprises encounter change in the natural environment, these resources can be swiftly mobilized by the enterprise. Given that their usage scenarios are not constrained, unabsorbed slack resources can provide essential support for enterprises’ environmental adaptation behaviors, enhance their resilience against risks, and effectively mitigate the concerns of enterprises operating under natural environmental uncertainty. Therefore, this study finds that slack resources, especially unabsorbed slack resources with flexibility, not only play a role of buffer in responding to changes in the market environment and institutional environment, but also have a similar function in responding to natural environmental change.
In addition, from the digital resource based perspective, digital transformation inhibits the positive relationship between natural environmental change and corporate financial performance, but no significant influence on the relationship between natural environmental change and corporate environmental-social performance. The results of this study do not support the idea that digitization is good for business performance [20,29,31], while is more inclined to recognize that digital transformation has no positive role for firms [32,33,34]. In terms of responding to natural environmental change, when the degree of digital transformation of enterprises is high, enterprises rely excessively on digital technology and pay less attention to the uncertainty of the natural environment instead. In this case, enterprises with a high degree of digital transformation are often unable to make timely adaptation, which may instead weaken the positive impact of natural environmental change on financial performance. Thus, when it comes to tackling climate change, existing digital transformation efforts are not helping businesses become sustainable (either financially or environmentally and socially).

7. Contribution and Implication

7.1. Theoretical Contribution

This paper has enriched the research achievements on the relationship between responding to changes in the natural environment and the sustainable development of enterprises. This study empirically examined the relationship between natural environmental change and the sustainable development of enterprises by improving the connotation of natural environmental change and constructing new characterization methods. The conclusions obtained integrated the complex relationship between different types of natural environmental change and economic, social, and environmental performance [4,5,6,7]. The obtained results indicate that enterprises have not yet formed a mechanism to promote sustainable development in the process of responding to natural environmental change. Although it can promote economic performance, it has the side effect of undermining environmental–social performance. This finding provides a clearer explanation for the relationship between natural environmental change and enterprise performance.
This paper also expands the application scope of RBV in the dual background of greening and digitalization. With the emergence of new issues such as climate change and artificial intelligence, the resource-based perspective presents more diverse application scenarios and also shows its inadequate explanatory power. Based on the distinction between natural resources, digital resources, and redundant resources, this study integrates and forms an analytical framework for explaining the relationship of multiple resources from the resource basis and resource allocation. This achievement is an expansion of RBV for the traditional single scenario [19,22,69] and provides a framework for explaining multiple resource problems in the future.

7.2. Practical Implications

Based on the theoretical findings, this study puts forward the following three practical suggestions:
First, responding to natural environmental change is beneficial to the development of enterprises, but social and ecological responsibility should not be ignored. In the face of changes in the natural environment, enterprises should adhere to the concept of sustainable development and restrict their own behaviors through environmental disclosure and CSR activities, further helping companies strike a balance between their economic survival and their social and environmental responsibilities.
Second, flexible resources are always an effective tool in responding to natural environmental change, but their catalytic effect in leading to irresponsible behavior should not be overlooked. Therefore, this study suggests that enterprises should strengthen the flexibility of slack resources and develop a system to reserve some resources to address environmental and social responsibility issues. For policymakers, in the face of intensified natural environmental change, such as extreme weather, it is necessary to enhance support for enterprises that obtain unabsorbed slack resources. This can be achieved by reducing the constraints of the green credit, promoting resource sharing among enterprises, and increasing infrastructure support for industrial parks and business incubators, so that enterprises can obtain redundant resources from external space.
Third, under the era of the digital boom, society is optimistic about digital transformation. However, digital transformation does not show a positive effect on enterprises’ response to natural environmental change this time. Therefore, this study suggests that enterprises should not overestimate the role of digitalization. Meanwhile, in order to better cope with natural environmental change, enterprises should pay more attention to materialized adaptation and mitigation rather than simply digitalizing themselves. Furthermore, policymakers need to be committed to reducing the resource occupation of digital transformation and lowering costs to adapt to the scenarios of responding to the natural environment through subsidies or accelerating the progress of adaptive technologies. Under the condition of lower cost, enterprises can be encouraged to give free rein to the positive role of digitalization in providing virtual resources and optimizing the efficiency of resource allocation.

8. Conclusions and Limitations

In addition to being influenced by internal resources and capabilities, the sustainable development of enterprises is also closely linked to the external natural environment. This paper examines the relationship between natural environmental change and the sustainable performance of enterprises.
The study reveals several key findings. Firstly, while natural environmental change significantly enhances the financial performance of firms, it also has a negative impact on environmental-social performance of enterprises.Second, absorbed slack resources weaken the positive relationship between natural environmental change and financial performance and strengthen the negative relationship between natural environmental change and financial performance and environmental-social performance.In addition, unabsorbed slack resources strengthen the positive relationship between natural environmental change and financial performance and the negative relationship between natural environmental change and environmental-social performance.Finally, the degree of digital transformation weakens the positive relationship between natural environmental change and financial performance of enterprises.
This study has several limitations. Given that enterprises are heavily reliant on natural resources, the effects of environmental uncertainty are particularly pronounced in these types of companies. Thus, the focus of this article is on enterprises. Due to constraints in data collection, the companies examined in this study are exclusively listed firms from Shanghai and Shenzhen A-shares in China. However, the nature of listed companies, which operate within the capital market, may lead to deviations in their decisions and behaviors, potentially distorting the direct effects of the natural environment on these firms. Therefore, future research should consider broadening the sample scope to encompass a wider range of industries and include non-listed companies, thereby facilitating a more comprehensive analysis of the variations in the impact of natural environmental change.

Author Contributions

Conceptualization, Y.C. formal analysis, Y.C.; resources, S.X.; writing—original draft preparation, M.T. and X.F.; writing—review and editing, S.X.; funding acquisition, M.T. All authors have read and agreed to the published version of the manuscript.

Funding

This research was funded by the National Social Science Fund of China, grant/award number: 24BGL036.

Institutional Review Board Statement

Not applicable.

Informed Consent Statement

Not applicable.

Data Availability Statement

The information outlined in this research can be obtained by making a request to the principal investigator responsible for the study.

Acknowledgments

Sincere gratitude is extended to the National Social Science Fund of China (grant/award number: 24BGL036) for its vital financial support for this research. With the Fund’s assistance, this paper has been completed and its findings presented. We extend further thanks to the Fund, and we look forward to more collaborations and support in the future.

Conflicts of Interest

The authors assert that they do not possess any conflicting interests. As a researcher bound by ethical duties, I am disclosing that I am in receipt of financial support from the National Social Science Fund of China (grant/award number: 24BGL036), which could potentially be influenced by the research outlined in the accompanying manuscript. I have provided comprehensive information regarding these interests to the journal Sustainability, and I have established an approved strategy for addressing any prospective conflicts that may arise from this association.

References

  1. Bertrand, J.L.; Parnaudeau, M. Understanding the economic effects of abnormal weather to mitigate the risk of business failures. J. Bus. Res. 2019, 98, 391–402. [Google Scholar] [CrossRef]
  2. Prasad, P.; Elmes, M. In the name of the practical: Unearthing the hegemony of pragmatics in the discourse of environmental management. J. Manag. Stud. 2005, 42, 845–867. [Google Scholar] [CrossRef]
  3. Etzion, D. Research on organizations and the natural environment, 1992–present: A review. J. Manag. 2007, 33, 637–664. [Google Scholar] [CrossRef]
  4. Pankratz, N.; Bauer, R.; Derwall, J. Climate change, firm performance, and investor surprises. Manag. Sci. 2023, 69, 7352–7398. [Google Scholar] [CrossRef]
  5. Li, C.; Tang, W.; Liang, F.; Wang, Z. The impact of climate change on corporate ESG performance: The role of resource misallocation in enterprises. J. Clean. Prod. 2024, 445, 141263. [Google Scholar] [CrossRef]
  6. Elijido-Ten, E.O. Does recognition of climate change related risks and opportunities determine sustainability performance? J. Clean. Prod. 2017, 141, 956–966. [Google Scholar] [CrossRef]
  7. Tashman, P.; Rivera, J. Ecological uncertainty, adaptation, and mitigation in the US ski resort industry: Managing resource dependence and institutional pressures. Strateg. Manag. J. 2016, 37, 1507–1525. [Google Scholar] [CrossRef]
  8. Mao, Y.; Li, P.; Li, Y. The relationship between slack resources and organizational resilience: The moderating role of dual learning. Heliyon 2023, 9, e14044. [Google Scholar] [CrossRef]
  9. Cao, W.; Cai, Z.; Yao, X.; Chen, L. Digital transformation to help carbon neutrality and green sustainable development based on the metaverse. Sustainability 2023, 15, 7132. [Google Scholar] [CrossRef]
  10. Chapin, F.S., III; Kofinas, G.P.; Folke, C. (Eds.) Principles of Ecosystem Stewardship: Resilience-Based Natural Resource Management in a Changing World; Springer Science & Business Media: New York, NY, USA, 2009. [Google Scholar] [CrossRef]
  11. Swedlow, B. Cultural surprises as sources of sudden, big policy change. PS Political Sci. Politics 2011, 44, 736–739. [Google Scholar] [CrossRef]
  12. Li, X. Physical climate change exposure and firms’ adaptation strategy. Strateg. Manag. J. 2024, 46, 750–789. [Google Scholar] [CrossRef]
  13. He, F.; Hao, J.; Lucey, B. Effects of climate risk on corporate green innovation cycles. Technol. Forecast. Soc. Change 2024, 205, 123447. [Google Scholar] [CrossRef]
  14. Aguinaldo, M.E.C.; Daddi, T.; Hamza, M.; Gasbarro, F. Climate change perspectives and adaptation strategies of business enterprises: A case study from Italy. Int. J. Sustain. Dev. World Ecol. 2019, 26, 129–140. [Google Scholar] [CrossRef]
  15. Biermann, F.; Kanie, N.; Kim, R.E. Global governance by goal-setting: The novel approach of the UN Sustainable Development Goals. Curr. Opin. Environ. Sustain. 2017, 26, 26–31. [Google Scholar] [CrossRef]
  16. Chowdhury, S.B.; DasGupta, R.; Choudhury, B.K.; Sen, N. Evolving alliance between corporate environmental performance and financial performance: A bibliometric analysis and systematic literature review. Bus. Soc. Rev. 2023, 128, 95–131. [Google Scholar] [CrossRef]
  17. Walsh, P.R. A license to operate? An empirical examination of the influence of environmental and social performance on the financial performance of mining sector firms. Int. J. Innov. Sustain. Dev. 2014, 8, 190–206. [Google Scholar] [CrossRef]
  18. Shahzad, M.; Qu, Y.; Zafar, A.U.; Rehman, S.U.; Islam, T. Exploring the influence of knowledge management process on corporate sustainable performance through green innovation. J. Knowl. Manag. 2020, 24, 2079–2106. [Google Scholar] [CrossRef]
  19. Helfat, C.E.; Kaul, A.; Ketchen, D.J., Jr.; Barney, J.B.; Chatain, O.; Singh, H. Renewing the resource-based view: New contexts, new concepts, and new methods. Strateg. Manag. J. 2023, 44, 1357–1390. [Google Scholar] [CrossRef]
  20. Hart, S.L. A natural-resource-based view of the firm. Acad. Manag. Rev. 1995, 20, 986–1014. [Google Scholar] [CrossRef]
  21. Pindyck, R.S. Irreversibilities and the timing of environmental policy. Resour. Energy Econ. 2000, 22, 233–259. [Google Scholar] [CrossRef]
  22. Williams, S.; Schaefer, A. Small and medium-sized enterprises and sustainability: Managers’ values and engagement with environmental and climate change issues. Bus. Strategy Environ. 2013, 22, 173–186. [Google Scholar] [CrossRef]
  23. Alam, A.; Du, A.M.; Rahman, M.; Yazdifar, H.; Abbasi, K. SMEs respond to climate change: Evidence from developing countries. Technol. Forecast. Soc. Change 2022, 185, 122087. [Google Scholar] [CrossRef]
  24. Conz, E.; Magnani, G.; Zucchella, A.; De Massis, A. Responding to unexpected crises: The roles of slack resources and entrepreneurial attitude to build resilience. Small Bus. Econ. 2023, 61, 957–981. [Google Scholar] [CrossRef] [PubMed]
  25. Adner, R.; Puranam, P.; Zhu, F. What is different about digital strategy? From quantitative to qualitative change. Strategy Sci. 2019, 4, 253–261. [Google Scholar] [CrossRef]
  26. Zhao, X.; Li, X.; Li, Y.; Wang, Z. The impact of digital transformation on firm performance. Ind. Manag. Data Syst. 2024, 124, 2567–2587. [Google Scholar] [CrossRef]
  27. Liu, Y.; He, Q. Digital transformation, external financing, and enterprise resource allocation efficiency. Manag. Decis. Econ. 2024, 45, 2321–2335. [Google Scholar] [CrossRef]
  28. Yang, Y.; Guo, J. Can Supplier Concentration Improve Corporate Risk Taking? Moderating Effects of Digital Transformation. Sustainability 2022, 14, 11664. [Google Scholar] [CrossRef]
  29. Heredia, J.; Castillo-Vergara, M.; Geldes, C.; Gamarra, F.M.C.; Flores, A.; Heredia, W. How do digital capabilities affect firm performance? The mediating role of technological capabilities in the “new normal”. J. Innov. Knowl. 2022, 7, 100171. [Google Scholar] [CrossRef]
  30. Peng, Y.; Tao, C. Can digital transformation promote enterprise performance?—From the perspective of public policy and innovation. J. Innov. Knowl. 2022, 7, 100198. [Google Scholar] [CrossRef]
  31. Zhai, H.; Yang, M.; Chan, K.C. Does digital transformation enhance a firm’s performance? Evidence from China. Technol. Soc. 2022, 68, 101841. [Google Scholar] [CrossRef]
  32. Guo, X.; Li, M.; Wang, Y.; Mardani, A. Does digital transformation improve the firm’s performance? From the perspective of digitalization paradox and managerial myopia. J. Bus. Res. 2023, 163, 113868. [Google Scholar] [CrossRef]
  33. Guo, L.; Xu, L. The effects of digital transformation on firm performance: Evidence from China’s manufacturing sector. Sustainability 2021, 13, 12844. [Google Scholar] [CrossRef]
  34. Viete, S.; Erdsiek, D. Mobile information technologies and firm performance: The role of employee autonomy. Inf. Econ. Policy 2020, 51, 100863. [Google Scholar] [CrossRef]
  35. Elijido-Ten, E.O.; Clarkson, P. Going beyond climate change risk management: Insights from the world’s largest most sustainable corporations. J. Bus. Ethics 2019, 157, 1067–1089. [Google Scholar] [CrossRef]
  36. Roberts, N. Absorptive capacity, organizational antecedents, and environmental dynamism. J. Bus. Res. 2015, 68, 2426–2433. [Google Scholar] [CrossRef]
  37. Schilke, O. On the contingent value of dynamic capabilities for competitive advantage: The nonlinear moderating effect of environmental dynamism. Strateg. Manag. J. 2014, 35, 179–203. [Google Scholar] [CrossRef]
  38. Ling, S.; Gao, H. How does climate risk matter for corporate green innovation? Empirical evidence from heavy-polluting listed companies in China. Front. Energy Res. 2023, 11, 1177927. [Google Scholar] [CrossRef]
  39. Ren, X.; Li, W.; Li, Y. Climate risk, digital transformation and corporate green innovation efficiency: Evidence from China. Technol. Forecast. Soc. Change 2024, 209, 123777. [Google Scholar] [CrossRef]
  40. Amran, A.; Ooi, S.K.; Wong, C.Y.; Hashim, F. Business strategy for climate change: An ASEAN perspective. Corp. Soc. Responsib. Environ. Manag. 2016, 23, 213–227. [Google Scholar] [CrossRef]
  41. Argiles-Bosch, J.M.; Garcia-Blandon, J.; Martinez-Blasco, M. The impact of absorbed and unabsorbed slack on firm profitability: Implications for resource redeployment. In Resource Redeployment and Corporate Strategy; Emerald Group Publishing Limited: Leeds, UK, 2016; pp. 371–395. [Google Scholar]
  42. Miller, D. The architecture of simplicity. Acad. Manag. Rev. 1993, 18, 116–138. [Google Scholar] [CrossRef]
  43. Xu, E.; Yang, H.; Quan, J.M.; Lu, Y. Organizational slack and corporate social performance: Empirical evidence from China’s public firms. Asia Pac. J. Manag. 2015, 32, 181–198. [Google Scholar] [CrossRef]
  44. Symeou, P.C.; Zyglidopoulos, S.; Gardberg, N.A. Corporate environmental performance: Revisiting the role of organizational slack. J. Bus. Res. 2019, 96, 169–182. [Google Scholar] [CrossRef]
  45. Xie, X.; Zhang, Y. Transformation Through Servitization: How Buffer Resources and Social Capital Support Transformation in Manufacturing Companies. Sustainability 2024, 16, 10728. [Google Scholar] [CrossRef]
  46. Maiti, M.; Krakovich, V.; Shams, S.R.; Vukovic, D.B. Resource-based model for small innovative enterprises. Manag. Decis. 2020, 58, 1525–1541. [Google Scholar] [CrossRef]
  47. Gebauer, H.; Fleisch, E.; Lamprecht, C.; Wortmann, F. Growth paths for overcoming the digitalization paradox. Bus. Horiz. 2020, 63, 313–323. [Google Scholar] [CrossRef]
  48. Alexopoulos, I.; Kounetas, K.; Tzelepis, D. Environmental and financial performance. Is there a win-win or a win-loss situation? Evidence from the Greek manufacturing. J. Clean. Prod. 2018, 197, 1275–1283. [Google Scholar] [CrossRef]
  49. Alsaifi, K.; Elnahass, M.; Salama, A. Carbon disclosure and financial performance: UK environmental policy. Bus. Strategy Environ. 2020, 29, 711–726. [Google Scholar] [CrossRef]
  50. Lian, Y.; Ye, T.; Zhang, Y.; Zhang, L. How does corporate ESG performance affect bond credit spreads: Empirical evidence from China. Int. Rev. Econ. Financ. 2023, 85, 352–371. [Google Scholar] [CrossRef]
  51. Duncan, R.B. Characteristics of organizational environments and perceived environmental uncertainty. Adm. Sci. Q. 1972, 17, 313–327. [Google Scholar] [CrossRef]
  52. Milliken, F.J. Three types of perceived uncertainty about the environment: State, effect, and response uncertainty. Acad. Manag. Rev. 1987, 12, 133–143. [Google Scholar] [CrossRef]
  53. Li, Y.; Sun, M.; Yuan, G.; Zhou, Q.; Liu, J. Study on development sustainability of atmospheric environment in Northeast China by rough set and entropy weight method. Sustainability 2019, 11, 3793. [Google Scholar] [CrossRef]
  54. Huber, G.P.; O’Connell, M.J.; Cummings, L.L. Perceived environmental uncertainty: Effects of information and structure. Acad. Manag. J. 1975, 18, 725–740. [Google Scholar] [CrossRef]
  55. Dou, Y.; Xue, X.; Zhao, Z.; Luo, X.; Ji, A.; Luo, T. Multi-index evaluation for flood disaster from sustainable perspective: A case study of Xinjiang in China. Int. J. Environ. Res. Public Health 2018, 15, 1983. [Google Scholar] [CrossRef]
  56. Li, H.; Li, J. Risk governance and sustainability: A scientometric analysis and literature review. Sustainability 2021, 13, 12015. [Google Scholar] [CrossRef]
  57. Lee, C.C.; Zeng, M.; Luo, K. How does climate change affect food security? Evidence from China. Environ. Impact Assess. Rev. 2024, 104, 107324. [Google Scholar] [CrossRef]
  58. Chen, S.; Gong, B. Response and adaptation of agriculture to climate change: Evidence from China. J. Dev. Econ. 2021, 148, 102557. [Google Scholar] [CrossRef]
  59. Wu, K.; Fu, Y.; Kong, D. Does the digital transformation of enterprises affect stock price crash risk? Financ. Res. Lett. 2022, 48, 102888. [Google Scholar] [CrossRef]
  60. Tyler, B.B.; Caner, T. New product introductions below aspirations, slack and R&D alliances: A behavioral perspective. Strateg. Manag. J. 2016, 37, 896–910. [Google Scholar] [CrossRef]
  61. Cheng, L. Does digital transformation matter for trade credit provision? Evidence from China. Pac. Basin Financ. J. 2024, 86, 102422. [Google Scholar] [CrossRef]
  62. Wu, F.; Hu, H.; Lin, H.; Ren, X. Enterprise digital transformation and capital market performance: Empirical evidence from stock liquidity. Manag. World 2021, 37, 130–144. [Google Scholar]
  63. Mishra, P.; Yadav, M. Environmental capabilities, proactive environmental strategy and competitive advantage: A natural-resource-based view of firms operating in India. J. Clean. Prod. 2021, 291, 125249. [Google Scholar] [CrossRef]
  64. Zhu, W.; Lu, S.; Huang, P.; Hu, X.; Wei, J. Predictors of coping behavior during the COVID-19 pandemic: Evidence from China. J. Contingencies Crisis Manag. 2023, 31, 797–808. [Google Scholar] [CrossRef]
  65. Sun, W.; Chen, S.; Jiao, Y.; Feng, X. How does ESG constrain corporate earnings management? Evidence from China. Financ. Res. Lett. 2024, 61, 104983. [Google Scholar] [CrossRef]
  66. Wei, L.; Li, M. Digital transformation, financing constraints and firm growth performance–From the perspective of financing channels. Financ. Res. Lett. 2024, 63, 105272. [Google Scholar] [CrossRef]
  67. Sun, Y.; Yang, Y.; Huang, N.; Zou, X. The impacts of climate change risks on financial performance of mining industry: Evidence from listed companies in China. Resour. Policy 2020, 69, 101828. [Google Scholar] [CrossRef]
  68. Sharfman, M.P.; Wolf, G.; Chase, R.B.; Tansik, D.A. Antecedents of organizational slack. Acad. Manag. Rev. 1988, 13, 601–614. [Google Scholar] [CrossRef]
  69. Hart, S.L.; Dowell, G. Invited editorial: A natural-resource-based view of the firm: Fifteen years after. J. Manag. 2011, 37, 1464–1479. [Google Scholar] [CrossRef]
Figure 1. Conceptual framework.
Sustainability 17 04232 g001
Figure 2. Simple slope analysis graph of moderating effects.
Sustainability 17 04232 g002
Table 1. Index of natural environmental change.
Target LevelFactor LayerIndicator LayerIndicator MeasurementsDirection of Indicators
Index of natural environmental changePhysical changeChange in annual precipitation X1Total average precipitation difference+
Change in average annual temperature X2Global mean temperature difference +
Annual wind
variations X3
Difference in annual wind speeds+
Perceived changeClimate change
awareness X4
Climate risk index+
Table 2. Keyword lexicon for climate change awareness.
Typhoon, tsunami, flood, drought, fire, extreme, heavy rain, severe, waterlogging, strong wind, sandstorm, hail, special, drought, hurricane, frost, flood, storm, mudslide, landslide, flood, flood disaster, drought, heavy snow, frost, snow disaster, ice and snow, climate, weather, nature, humidity, water temperature, temperature drop, cold, air temperature, rainfall, temperature, rain, rainy season, rain conditions, freezing, precipitation, early frost, low temperature, high temperature, rain and snow, snowfall, storm, frost, warm winter, severe winter, lightning strike, climate change, snowfall, extreme heat, forest fires, precipitation, blizzard, sandstorm, flood, energy conservation, electricity, energy, cleanliness, ecology, water conservation, environment, green, transformation, solar energy, recycling, utilization rate, wind power, natural gas, recycling, regeneration, high-efficiency photovoltaic, emission reduction, energy consumption reduction, disasters, earthquakes, global warming, tropical storms, water levels, lightning, carbon dioxide, atmosphere, fog, rainfall, precipitation, greenhouse gases
Table 3. Control variables.
Types of VariablesNames of VariablesSymbols Descriptions
Control variablesCompany sizeSizeThe natural logarithm of the company’s total assets
Company ageAgeYear of establishment
Shareholding ratio of the largest shareholderNo1Number of shares held by the largest shareholder/total number of shares in the company
Intangible asset ratioIntIntangible assets/total assets.
Equity ratioERTotal liabilities/total owners’ equity
Asset–liability ratioLevTotal liabilities/total assets
Government subsidy intensitySubNatural logarithm of government subsidies received by enterprises
Financing constraintsSASA index
Capital intensityCIChanges in fixed assets/sales revenue
Cash flow ratioCFNet cash flows from operating activities/total assets
Impact of the epidemicPeriThe dummy variable of “outbreak time (2020)” is 1 after the outbreak, or 0 otherwise.
Table 4. Descriptive statistics of variables.
Variables SamplesMeanMedianSDMinimum ValueMaximum Value
Fina 40,5390.052 0.068 0.141 −0.788 0.334
Envi40,5394.133 4.000 0.916 1.500 6.000
Nec 40,5390.083 0.074 0.043 0.016 0.209
RS 39,7750.162 0.125 0.131 0.013 0.691
AS 40,4420.680 0.575 0.514 0.055 3.043
DT 40,53712.910 2.000 27.860 0.000 172.000
Size40,5378.351 8.146 1.288 6.024 12.570
Age40,53118.550 18.000 6.056 5.000 34.000
No1 40,5390.338 0.315 0.148 0.084 0.743
Int40,5390.046 0.033 0.050 0.000 0.323
ER 40,5391.056 0.661 1.319 0.053 9.101
Lev 40,5390.408 0.398 0.205 0.050 0.901
Sub39,87316.290 16.290 1.525 11.720 20.220
SA40,537−3.825 −3.829 0.264 −4.470 −3.116
CI40,5252.490 1.910 2.175 0.401 16.180
Peri40,5390.417 0.000 0.493 0.000 1.000
CF 39,9180.048 0.047 0.068 −0.161 0.242
Table 5. Correlation matrix.
FinaEnviNecSizeAgeNo1IntER LevSubSACICFPeri
Fina1
Envi0.194 ***1
Nec0.025 ***0.014 ***1
Size0.097 ***0.193 ***0.040 ***1
Age−0.073 ***−0.059 ***0.045 ***0.192 ***1
No10.141 ***0.089 ***0.011 **0.175 ***−0.109 ***1
Int−0.033 ***−0.051 ***0.024 ***0.073 ***0.028 ***0.035 ***1
ER−0.315 ***−0.162 ***0.035 ***0.325 ***0.126 ***0.0030.019 ***1
Lev−0.217 ***−0.143 ***0.075 ***0.470 ***0.161 ***0.020 ***0.068 ***0.801 ***1
Sub0.096 ***0.204 ***0.023 ***0.646 ***0.079 ***0.081 ***0.017 ***0.154 ***0.273 ***1
SA0.072 ***0.098 ***−0.055 ***−0.053 ***−0.905 ***0.146 ***−0.024 ***−0.035 ***−0.095 ***−0.0081
CI−0.169 ***−0.060 ***−0.0050.024 ***0.042 ***−0.070 ***0.061 ***0.034 ***−0.081 ***−0.119 ***0.012 **1
CF0.329 ***0.107 ***0.019 ***0.110 ***0.034 **0.115 ***0.062 ***−0.138 ***−0.136 ***0.118 ***−0.031 ***−0.170 ***1
Peri−0.061 ***0.067 ***0.151 ***0.097 ***0.351 ***−0.088 ***−0.044 ***−0.022 ***−0.022 ***0.104 ***−0.322 ***0.063 ***0.022 ***1
Note: ** p < 0.05, *** p < 0.01. t value in parentheses.
Table 6. The main effect of natural environmental change on the financial performance and environmental–social performance of enterprises.
(1) Fina(2) Envi
Nec0.108 ***−0.425 ***
(5.55)(−3.67)
Size0.046 ***0.253 ***
(28.55)(26.51)
Age0.006 ***0.045 ***
(2.74)(3.63)
Nol0.137 ***0.278 ***
(13.59)(4.65)
Int−0.291 ***−0.350 ***
(−13.06)(−2.65)
ER−0.052 ***−0.029 ***
(−49.93)(−4.65)
Lev−0.048 ***−0.850 ***
(−5.72)(−17.00)
Sub−0.0010.016 ***
(−0.74)(3.67)
SA0.043 ***1.118 ***
(3.86)(16.92)
CI−0.015 ***−0.025 ***
(−27.99)(−8.14)
Peri−0.170 ***−0.092
(−6.41)(−0.59)
CF0.356 **−0.308 ***
(33.04)(−4.81)
N38,63239,271
Year FEcontrolcontrol
Firm FEcontrolcontrol
F455.8395.39
R20.2410.062
Note: ** p < 0.05, *** p < 0.01. t value in parentheses.
Table 7. The moderating effect of naturally absorbed slack resources.
(3) Fina(4) Envi
Nec0.095 ***−0.464 ***
(4.93)(−3.98)
RS−0.358 ***−0.175 **
(−31.34)(−2.55)
Nec * RS−0.448 **3.928 ***
(−3.49)(5.08)
Size0.032 ***0.253 ***
(18.99)(25.22)
Age0.006 ***0.049 ***
(3.15)(3.95)
Nol0.127 ***−0.248 ***
(12.66)(4.11)
Int−0.265 ***−0.392 ***
(−11.81)(−2.90)
ER−0.051 ***−0.027 ***
(−49.20)(−4.38)
Lev−0.048 ***−0.862 ***
(−5.66)(−17.05)
Sub0.002 **0.017 ***
(2.39)(3.87)
SA0.052 ***1.185 ***
(4.61)(17.51)
CI−0.006 ***−0.021 ***
(−9.20)(−5.52)
Peri−0.166 ***−0.112
(−6.35)(−0.71)
CF0.339 ***−0.321 ***
(31.64)(−4.98)
N38,63238,632
Year FEcontrolcontrol
Firm FEcontrolcontrol
F465.0690.07
R20.2630.065
Note: * p < 0.1, ** p < 0.05, *** p < 0.01. t value in parentheses.
Table 8. The moderating effect of natural unabsorbed slack resources.
(5) Fina(6) Envi
Nec0.103 ***−0.439 ***
(5.30)(−3.79)
AS−0.042 ***−0.079 ***
(−15.16)(−4.85)
Nec * AS0.102 ***0.447 **
(3.25)(2.39)
Size0.044 ***0.250 ***
(27.43)(26.06)
Age0.005 **0.044 ***
(2.54)(3.56)
Nol0.130 ***0.266 ***
(12.95)(4.46)
Int−0.238 ***−0.249 ***
(−10.63)(−1.87)
ER−0.051 ***−0.027 ***
(−49.35)(−4.41)
Lev0.019 **−0.722 ***
(2.03)(−12.77)
Sub−0.00030.016 ***
(−0.41)(3.79)
SA0.041 ***1.112 ***
(3.68)(16.84)
CI−0.014 ***−0.025 ***
(−27.09)(−7.85)
Peri−0.165 ***−0.083
(−6.24)(−0.53)
CF0.359***−0.306 ***
(33.33)(−4.78)
N39,18839,188
Year FEcontrolcontrol
Firm FEcontrolcontrol
F432.6989.11
R20.2460.063
Note: * p < 0.1, ** p < 0.05, *** p < 0.01. t value in parentheses.
Table 9. The moderating effect of digital transformation.
(7) Fina(8) Envi
Nec0.106 ***−0.418 ***
(5.45)(−3.61)
DT−0.0003 ***0.000
(−7.67)(1.43)
Nec * DT−0.001 *0.005
(−1.75)(1.42)
Size0.048 ***0.252 ***
(29.31)(26.08)
Age0.005 **0.046 ***
(2.41)(3.68)
Nol0.132 ***0.283 ***
(13.15)(4.74)
Int−0.288 ***−0.351 ***
(−12.97)(−2.66)
ER−0.052 ***−0.029 ***
(−50.07)(−4.62)
Lev−0.047 ***−0.851 ***
(5.64)(−17.03)
Sub−0.00050.016 ***
(−0.62)(3.65)
SA0.037 ***1.122 ***
(3.33)(16.94)
CI−0.015 ***−0.025 ***
(−28.20)(−8.11)
Peri−0.163 ***−0.100
(−6.12)(−0.64)
CF0.355 ***−0.307 ***
(32.95)(−4.79)
N39,27039,270
Year FEcontrolcontrol
Firm FEcontrolcontrol
F423.7588.19
R20.2420.062
Note: * p < 0.1, ** p < 0.05, *** p < 0.01. t value in parentheses.
Table 10. Robustness test results after replacing the explanatory variables (I).
FinaEnvi
Nec0.033 ***−1.661 ***
(4.23)(−2.60)
RS−0.166 ***−1.201 ***
(−35.44)(−3.19)
Nec * RS−0.181 ***20.866 ***
(−3.44)(4.93)
Size0.012 ***1.320 ***
(17.14)(24.00)
Age0.002 ***0.214 ***
(2.91)(3.16)
Nol0.061 ***0.822 **
(14.92)(2.49)
Int−0.134 ***−2.11 ***
(−14.60)(−2.86)
ER−0.004 ***−0.165 ***
(−9.73)(−4.83)
Lev−0.131 ***−4.680 ***
(−38.02)(−16.90)
Sub0.001 **0.063 ***
(3.45)(2.63)
SA0.028 ***6.149 ***
(6.09)(16.59)
CI−0.004 ***−0.119 ***
(−15.97)(−5.76)
Peri−0.076 ***0.288
(−7.06)(0.33)
CF0.199 ***−1.522 ***
(45.44)(−4.31)
N38,62938,632
Year FEcontrolcontrol
Firm FEcontrolcontrol
F567.3388.77
R20.3030.064
Note: * p < 0.1, ** p < 0.05, *** p < 0.01. t value in parentheses.
Table 11. Robustness test results after replacing the explanatory variables (II).
FinaEnvi
Nec0.036 ***−1.547 **
(4.61)(−2.44)
AS−0.016 ***−0.466 ***
(−14.08)(−5.22)
Nec * AS0.042 ***2.203 ***
(3.31)(2.15)
Size0.017 ***1.309 ***
(26.50)(24.96)
Age0.002 **0.186 ***
(2.32)(2.75)
Nol0.063 ***0.882 ***
(15.29)(2.70)
Int−0.127 ***−1.274 **
(−13.81)(−1.74)
ER−0.004 ***−0.165 ***
(−9.87)(−4.88)
Lev0.106 **−3.867 ***
(−27.16)(−12.50)
Sub0.000010.059 ***
(0.04)(2.49)
SA0.022 ***5.78 ***
(4.92)(15.99)
CI−0.008 ***−0.141 ***
(−37.33)(−8.23)
Peri−0.076 ***0.466
(−6.99)(0.54)
CF0.207 ***−1.416 ***
(46.96)(−4.04)
N39,18839,188
Year FEcontrolcontrol
Firm FEcontrolcontrol
F517.6188.01
R20.2810.062
Note: * p < 0.1, ** p < 0.05, *** p < 0.01. t value in parentheses.
Table 12. Robustness test results after replacing the explanatory variables (III).
FinaEnvi
Nec0.038 ***−1.434 ***
(4.71)(−2.26)
DT−0.0002 ***0.002
(−12.07)(1.43)
Nec * DT−0.0008 ***0.026
(−3.11)(1.24)
Size0.019 ***1.321 ***
(28.9)(25.01)
Age0.002 **0.195 ***
(1.99)(2.88)
Nol0.063 ***0.982 ***
(15.23)(3.00)
Int−0.145 ***−1.870 ***
(−15.97)(−2.59)
ER−0.005 ***−0.173 ***
(−10.59)(−5.10)
Lev−0.131 ***−4.631 ***
(−38.00)(−16.91)
Sub−0.0000.055 ***
(−0.05)(2.35)
SA0.019 ***5.840 ***
(4.24)(16.10)
CI−0.008 ***−0.145 ***
(−38.57)(−8.51)
Peri−0.073 ***0.365
(−6.72)(0.42)
CF0.205 ***−1.426 ***
(46.56)(−4.07)
N39,27039,270
Year FEcontrolcontrol
Firm FEcontrolcontrol
F514.2988.19
R20.2800.062
Note: * p < 0.1, ** p < 0.05, *** p < 0.01. t value in parentheses.
Table 13. Robustness test results after replacing the moderator variable.
FinaEnvi
Nec0.108 ***−0.432 ***
(5.53)(−3.74)
lnPatent0.002 **0.043 ***
(2.53)(8.89)
Nec * lnPatent−0.018 +−0.053
(−1.49)(−0.74)
Size0.046 ***0.250 ***
(28.41)(26.17)
Age0.006 ***0.044 ***
(2.74)(3.52)
Nol0.137 ***0.276 ***
(13.58)(4.64)
Int−0.291 ***−0.364 ***
(−13.09)(−2.76)
ER−0.052 ***−0.028 ***
(−49.92)(−4.58)
Lev−0.048 ***−0.851 ***
(−5.70)(−17.03)
Sub−0.0010.015 ***
(−0.75)(3.43)
SA0.043 ***1.105 ***
(3.85)(16.74)
CI−0.015 ***−0.025 ***
(−27.90)(−7.92)
Peri−0.170 ***−0.082
(−6.41)(0.52)
CF0.356 ***−0.303 ***
(33.03)(−4.74)
N39,25339,253
Year FEcontrolcontrol
Firm FEcontrolcontrol
F420.9091.23
R20.2410.065
Note: + p < 0.15, * p < 0.1, ** p < 0.05, *** p < 0.01. t value in parentheses.
Table 14. Main effects and the moderating effect of absorbed slack resources after adding province fixed effects (I).
(1) Fina(2) Envi(2) Fina(3) Envi
Nec0.111 ***−0.422 ***0.097 ***−0.455 ***
(5.68)(−3.56)(5.02)(−3.90)
RS −0.359 ***−0.175 ***
(−31.32)(−2.54)
Nec * RS −0.439 ***4.003 ***
(−3.41)(5.17)
Size0.046 ***0.259 ***0.032 ***0.252 ***
(28.44)(26.41)(18.84)(24.96)
Age0.005 ***0.046 ***0.006 ***0.047 ***
(2.60)(3.63)(3.03)(3.79)
Nol0.136 ***0.274 ***0.126 ***0.256 **
(13.54)(4.48)(12.52)(4.23)
Int−0.292 ***−0.368−0.267 ***−0.374 ***
(−13.13)(−2.72)(−11.90)(−2.76)
ER−0.052 ***−0.031 ***−0.051 ***−0.027 ***
(−49.74)(−4.93)(−48.89)(−4.36)
Lev−0.048 ***−0.855 ***−0.0471 ***−0.862 ***
(−5.73)(−16.65)(−5.70)(−17.01)
Sub−0.0000.016 ***0.002 ***0.016 ***
(−0.68)(3.62)(2.47)(3.84)
SA0.037 ***1.166 ***0.048 ***1.171 ***
(3.39)(17.17)(4.27)(17.25)
CI−0.015 ***−0.026 ***−0.006 ***−0.021 ***
(−27.90)(−8.29)(−9.12)(−5.52)
Peri−0.169 ***−0.321 ***−0.165 ***−0.093
(−6.37)(−4.89)(−6.31)(−0.59)
CF0.357 ***−0.083 ***0.338 ***−0.321 ***
(33.06)(−0.52)(31.64)(−4.97)
N39,252 39,25238,61338,613
Year FEcontrolcontrolcontrolcontrol
Firm FEcontrolcontrolcontrolcontrol
Province FEcontrolcontrolcontrolcontrol
F220.5547.76234.1746.43
R20.24280.06490.2650.067
Note: * p < 0.1, ** p < 0.05, *** p < 0.01. t value in parentheses.
Table 15. The moderating effect of unabsorbed slack resources after adding province fixed effects (II).
FinaEnvi
Nec0.106 ***−0.433 **
(5.43)(−3.73)
AS−0.042 ***−0.080 ***
(−15.22)(−4.88)
Nec * AS0.106 ***0.486 ***
(3.38)(2.59)
Size0.044 ***0.247 ***
(27.29)(25.79)
Age0.005 ***0.042 ***
(2.39)(3.39)
Nol0.129 ***0.274 ***
(12.90)(4.58)
Int−0.239 ***−0.232 **
(−13.81)(−1.74)
ER−0.051 ***−0.027 ***
(−49.16)(−4.41)
Lev0.019 ***−0.719 ***
(2.05)(−12.70)
Sub−0.00020.016 ***
(−0.33)(3.76)
SA0.035 ***1.099 ***
(3.20 )(16.58)
CI−0.014 ***−0.024 ***
(−26.97)(−7.78)
Peri−0.163 ***−0.062
(−6.18)(−0.40)
CF0.359 ***−0.304 ***
(33.37)(−4.76)
N39,16939,169
Year FEcontrolcontrol
Firm FEcontrolcontrol
Province FEcontrolcontrol
F218.0745.99
R20.2480.065
Note: * p < 0.1, ** p < 0.05, *** p < 0.01. t value in parentheses.
Table 16. Moderating effect of digital transformation after adding province fixed effects (III).
FinaEnvi
Nec0.109 ***−0.409 ***
(5.58)(−3.52)
DT−0.0003 ***0.0004
(−7.63)(1.42)
Nec * DT−0.001 *0.006
(1.80)(1.53)
Size0.048 ***0.250 ***
(29.20)(25.79)
Age0.005 **0.043 ***
(2.27)(3.51)
Nol0.132 ***0.292 ***
(13.10)(4.88)
Int−0.290 ***−0.334 ***
(−13.03)(2.53)
ER−0.052 ***−0.028 ***
(−49.88)(−4.56)
Lev−0.047 ***−0.851 ***
(−5.63)(−17.00)
Sub−0.00040.016 ***
(−0.57)(3.64)
SA0.032 ***1.107 ***
(2.86)(16.6)
CI−0.015 ***−0.025 ***
(−28.11)(−8.07)
Peri−0.161 ***0.081
(−6.09)(−0.51)
CF0.356 ***0.307 ***
(32.97)(−4.79)
N39,25139,251
Year FEcontrolcontrol
Firm FEcontrolcontrol
Province FEcontrolcontrol
F213.5545.150
R20.2440.064
Note: * p < 0.1, ** p < 0.05, *** p < 0.01. t value in parentheses.
Table 17. Endogeneity test.
FinaEnvi
Nec0.736 ***−6.146 ***
(4.14)(−5.18)
Size0.044 ***0.264 ***
(14.56)(14.50)
Age0.0050.050 **
(1.45)(2.14)
Nol0.132 ***0.309 ***
(8.00)(2.85)
Int−0.299 ***−0.259
(−7.61)(−1.12)
ER−0.051 ***−0.034 ***
(−15.21)(−3.49)
Lev−0.050 ***−0.827 ***
(−2.81)(−10.39)
Sub−0.0010.016 ***
(−0.66)(2.86)
SA0.039 **1.164 ***
(2.02)(8.91)
CI−0.015 ***−0.027 ***
(−12.92)(−5.38)
Peri−0.187 ***0.026
(−6.41)(−0.09)
CF0.355 ***−0.294 ***
(20.63)(−3.65)
N39,21739,217
Year FEcontrolcontrol
Firm FEcontrolcontrol
Note: ** p < 0.05, *** p < 0.01. t value in parentheses.
Table 18. Heterogeneity analysis (I).
High-Tech EnterprisesNon-High-Tech Enterprises
(1) Fina(2) Envi(3) Fina(4) Envi
Nec0.106 ***−0.633 ***0.112 ***−0.323 *
(4.35)(−4.33)(3.46)(−1.70)
Size0.044 ***0.261 ***0.048 ***0.259 ***
(20.58)(20.42)(17.47)(16.24)
Age0.0040.071 ***0.007 **0.007
(1.63)(4.59)(1.99)(0.33)
Nol0.142 ***0.387 ***0.115 ***0.093
(10.65)(4.87)(6.81)(0.93)
Int−0.434 ***−0.076−0.145 ***−0.450 **
(−12.92)(−0.38)(−4.62)(−2.44)
ER−0.059 ***−0.032 ***−0.047 ***−0.026 ***
(−40.47)(−3.67)(−30.33)(−2.88)
Lev−0.040 ***−0.831 ***−0.049 ***−0.788 ***
(−3.69)(−12.74)(−3.46)(−9.45)
Sub−0.0000.024 ***−0.0000.003
(−0.07)(4.04)(−0.02)(0.51)
SA0.029 *1.243 ***0.0001.099 ***
(1.96)(13.61)(0.03)(10.12)
CI−0.018 ***−0.023 ***−0.012 ***−0.028 ***
(−24.19)(−4.95)(−15.91)(−6.38)
Peri−0.115 ***−0.347 *0.366 ***0.351
(−4.71)(−1.76)(21.08)(1.34)
CF0.355 ***−0.321 ***−0.209 ***−0.252 **
(24.23)(−3.88)(−4.69)(−2.47)
N24,66724,66714,64014,604
Year FEcontrolcontrolcontrolcontrol
Firm FEcontrolcontrolcontrolcontrol
F294.9262.37166.7233.71
R20.2490.0650.2380.060
Note: * p < 0.1, ** p < 0.05, *** p < 0.01. t value in parentheses.
Table 19. Heterogeneity analysis (II).
Energy-Intensive FirmsNon-Energy-Intensive Industries
(1) Fina(2) Envi(3) Fina(4) Envi
Nec0.069−0.2320.113 ***−0.434 ***
(1.39)(−0.80)(5.36)(−3.45)
Size0.036 ***0.249 ***0.048 ***0.268 ***
(8.55)(9.99)(27.23)(25.37)
Age0.012 ***0.120 ***0.0040.026 *
(2.79)(4.72)(1.50)(1.89)
Nol0.0280.1990.168 ***0.366 ***
(2.79)(1.39)(14.87)(5.43)
Int−0.163 ***−0.613 *−0.313 ***−0.220
(−2.62)(−1.68)(−13.10)(−1.55)
ER−0.066 ***−0.052 ***−0.049 ***−0.026 ***
(−28.67)(−3.88)(−41.67)(−3.69)
Lev−0.018−0.483 ***−0.052 ***−0.945 ***
(0.84)(−3.87)(−5.63)(−17.15)
Sub0.0030.012−0.0000.017 ***
(1.63)(1.24)(−0.62)(3.60)
SA0.0291.125 ***0.042 ***1.187 ***
(0.98)(6.45)(3.46)(16.41)
CI−0.015 ***−0.024 **−0.015 ***−0.029 ***
(−8.35)(−2.39)(−27.22)(−8.85)
Peri−0.261 ***−1.367 ***−0.146 ***0.237
(−4.70)(−4.19)(21.08)(1.32)
CF0.446 ***−0.524 ***0.324 ***−0.277 ***
(16.32)(−3.26)(−4.85)(−3.98)
N6304630432,96732,967
Year FEcontrolcontrolcontrolcontrol
Firm FEcontrolcontrolcontrolcontrol
F24.1562.37166.7288.02
R20.3170.0950.2380.069
Note: * p < 0.1, ** p < 0.05, *** p < 0.01. t value in parentheses.
Table 20. Heterogeneity analysis (III).
Manufacturing IndustryNon-Manufacturing Industry
(1) Fina(2) Envi(3) Fina(4) Envi
Nec0.109 ***−0.607 ***0.095 ***−0.093 ***
(4.96)(−4.44)(2.37)(−0.42)
Size0.044 ***0.259 ***0.045 **0.262 ***
(21.87)(20.82)(14.50)(15.42)
Age0.005 **0.067 ***0.0040.012 *
(2.20)(4.59)(1.00)(−0.52)
Nol0.131 ***0.353 ***0.122 ***0.092 ***
(10.97)(4.76)(5.70)(0.79)
Int−0.401 ***−0.204 ***−0.121 ***−0.616
(−13.59)(−1.12)(−3.25)(−3.00)
ER−0.055 ***−0.015 ***−0.049 ***−0.042 ***
(−42.35)(−1.98)(−26.63)(−4.21)
Lev−0.037 ***−0.883 ***−0.068 ***−0.776 ***
(−3.70)(−14.29)(−4.10)(−8.45)
Sub0.0010.023−0.0020.002 ***
(1.39)(4.10)(−1.24)(0.36)
SA0.001 *1.204 ***0.059 ***1.092 ***
(0.05)(13.51)(2.96)(9.95)
CI−0.018 ***−0.034 ***−0.013 ***−0.021 ***
(−24.22)(−7.57)(−15.44)(−4.60)
Peri−0.183 ***−0.348 ***−0.148 **0.660
(−6.15)(−1.88)(−2.65)(2.15)
CF0.346 ***−0.262 ***0.338 ***−0.436 ***
(27.36)(−3.34)(16.54)(−3.90)
N27,13527,13512,11812,118
Year FEcontrolcontrolcontrolcontrol
Firm FEcontrolcontrolcontrolcontrol
F321.1863.08135.4988.02
R20.2460.0600.23630.51
Note: * p < 0.1, ** p < 0.05, *** p < 0.01. t value in parentheses.
Disclaimer/Publisher’s Note: The statements, opinions and data contained in all publications are solely those of the individual author(s) and contributor(s) and not of MDPI and/or the editor(s). MDPI and/or the editor(s) disclaim responsibility for any injury to people or property resulting from any ideas, methods, instructions or products referred to in the content.

