Article

Research on Spatial Differentiation of Housing Prices Along the Rail Transit Lines in Qingdao City Based on Multi-Scale Geographically Weighted Regression (MGWR) Analysis

College of Civil Engineering and Architecture, Shandong University of Science and Technology, Qingdao 266590, China
*
Author to whom correspondence should be addressed.
Sustainability 2025, 17(9), 4203; https://doi.org/10.3390/su17094203
Submission received: 3 April 2025 / Revised: 27 April 2025 / Accepted: 29 April 2025 / Published: 6 May 2025

Abstract

Urban sprawl and excessive reliance on motorization have led to many urban problems. The balance of supply and demand in the real estate market, as well as price fluctuations, also face many challenges. Urban rail transit not only alleviates traffic congestion and air pollution, but also significantly reduces residents’ commuting time, broadens urban accessibility, and reshapes the decision-making basis for residents when choosing residential locations. This study takes the 1st, 2nd, 3rd, 4th, 8th, 11th, and 13th metro lines that have been opened in Qingdao City as examples. It selects 12,924 residential samples within a 2 km radius along the rail transit lines. By using GIS spatial analysis tools and the multi-scale geographically weighted regression (MGWR) model, it analyzes the spatial differentiation characteristics of housing prices along the rail transit lines and the reasons and mechanisms behind them. The empirical results show that housing prices decrease to varying degrees with the increase in the distance from the rail transit. For every additional 1 km from the rail transit station, the housing price increases by 0.246%. Through model comparison, it was found that MGWR has a better fitting degree than the traditional ordinary least squares method (OLS) and the previous geographically weighted regression model (GWR), and reveals the spatial heterogeneity of the influence of urban rail transit on housing prices. Different indicator elements have different effects on housing prices along these lines. The urban rail transit factor in the location characteristics has a positive impact on housing prices, and has a significant negative correlation in some areas. The significant influence range of the distance to the nearest metro station on housing prices is concentrated within a radius of 373 m, and the effect decays beyond this range. The total floors, building area, green coverage rate, property management fee, and the distance to hospitals and parks in the neighborhood and structural characteristics have spatial heterogeneity. Analyzing the areas affected by the urban rail transit factor, it was found that the double location superposition effect, the networked transportation system, and the agglomeration of urban functional axes are important reasons for the significant phenomena in some local areas. This research provides a scientific basis for optimizing the sustainable development of rail transit in Qingdao and formulating differentiated housing policies. Meanwhile, it expands the application of the MGWR model in sustainable urban spatial governance and has practical significance for other cities to achieve sustainable urban development.

1. Introduction

Under the background of the continuous acceleration of the urbanization process, the disorderly expansion of urban boundaries and urban sprawl have become increasingly prominent. Excessive reliance on motorized transportation has led to huge pressure on urban transportation systems [1]. Traffic congestion not only wastes a lot of time and energy of residents, but also aggravates air pollution problems, resulting in a decline in residents’ quality of life. Urban rail transit, as an efficient, green, and large-capacity public transportation mode, is gradually becoming a key force in solving urban problems and promoting urban sustainable development. Since the 1970s, the impact of urban rail transit on housing prices has attracted widespread attention from the academic community. Early studies have shown that housing prices closer to rail transit are higher than those in other areas, which is attributed to the improvement of rail transit accessibility reducing residents’ commuting costs and making them willing to pay higher prices for this benefit [2]. This is manifested as the shorter travel time leading to higher housing prices [3]. The advantage of transportation convenience is one of the important influencing factors for the fluctuation of housing prices [4,5]. Wang Xia et al. found that the impact of urban rail transit within the city center on housing prices is relatively small, while the impact on housing prices in areas far from the city center is more obvious [6]. Liu Gowen et al. used correlation and regression analysis to discover that the more developed an area is, the smaller the impact of urban rail transit on the value of residential properties [7]. Although in most cases the accessibility of urban rail transit has a positive impact on housing prices [8,9,10], some studies suggest that urban rail transit has a negative effect on housing prices. Fan Zi ying et al. found that the housing market near the metro would have a suction effect on the housing market farther away, resulting in a downward trend in housing prices outside a certain range [11], and Henneberry et al. found that noise pollution generated during the construction of urban rail transit is one of the important factors causing negative impacts on housing prices [12]. In the study of urban rail transit in Houston, the United States, it was found that the housing prices within 400 m of the station would be affected and decrease [13,14]. Wagner et al. calculated the impact of urban rail transit on the housing market and found that urban rail transit would cause a decrease in housing prices [15]. In some regions, there are also cases where urban rail transit has no significant impact on housing prices. Lee et al. found that the high-density housing prices near the urban rail transit stations have not yet shown a significant impact [16,17,18,19], and Ransom M R et al. found that the urban rail transit service did not provide value to the communities in the Rainier Valley of Seattle [20]. According to the research on urban rail transit in Jakarta, Indonesia, compared with other variables, the impact of the rail transit factor on housing prices is insignificant [21].
Regarding the research methods for exploring the relationship between urban rail transit and housing prices, researchers mostly adopt hedonic price models (HPMs) based on ordinary least squares (OLS) [22,23]. This model assumes that housing prices consist of various features, decomposing the factors influencing housing prices and calculating the implicit prices of each factor. However, the HPM lacks consideration for the spatial heterogeneity and dependence of housing prices, and has weak explanatory power for spatial data. Some researchers have found that although the appreciation of residential property prices benefits from the accessibility of light rail, the impact varies greatly across different geographical regions. Some researchers have found that although the appreciation of residential property prices benefits from the accessibility of light rail, the impact varies greatly across different geographical regions. Moreover, the influence of rail transit on housing prices differs at different spatial positions. Edmilson S investigated the impact of urban rail transit in Rio de Janeiro, Brazil, on residential prices and found that transportation infrastructure significantly boosts the prices of surrounding properties, but the effect is influenced by geographical barriers and regional heterogeneity [24]. Kai Cao analyzed public housing prices in Singapore using OLS, ED-GWR, and TT-GWR models and found that factors such as house age, area, distance from CBD, subway station, and park are important influencing factors for housing price increases. Moreover, the TT-GWR model outperforms the ED-GWR and OLS models in terms of fit, proving that transportation big data can effectively enhance the explanatory power of spatial regression models [25]. Yan Richard Alfeu de Oliveira studied São Paulo and found that urban rail transit has a smaller impact on affluent areas [26]. Similarly, based on the research of light rail stations in Kuala Lumpur, Malaysia, it was found that the property value of low- and middle-income communities near light rail stations increased by 8%, while the impact on high-income areas was not significant. This study emphasizes the differential impact of transportation projects on regional development and the convenience of urban rail transit for low- and middle-income groups, while high-income areas may be affected by interference effects and offset the benefits [27]. Sathita Malaitham studied the Bangkok metropolitan area of Thailand and found that factors such as transportation accessibility and proximity to commercial facilities have regional heterogeneity in residential prices. Vichiensan and V’s research found that the GWR model is more accurate than the OLS model, and the appreciation effect of rail transit on housing prices shows significant spatial differences. The property value in the 1 km radius around the station is particularly obvious, further confirming the key role of rail transit in land premium [28,29]. Subsequently, the geographically weighted regression (GWR) model inherited the advantages of the OLS statistical method, considering spatial non-stationarity to reveal the spatial heterogeneity of housing prices and their influencing factors. The fitting method of the GWR model for the spatial bandwidth is essentially a homogenization treatment, failing to reflect the differences at different scales [30,31]. Among them, bandwidth refers to the spatial scale parameters estimated separately for different explanatory variables in the model, which are used to measure the influence range or the scale of the effect of each variable in space. In recent years, some scholars have proposed the multi-scale geographically weighted regression (MGWR) model, which can analyze the spatial influence of variables under different scales. Unlike GWR where all the variables share a single global bandwidth, MGWR allows each variable to have an independent bandwidth value, thereby more flexibly capturing spatial heterogeneity and multi-scale effects, and improving the overall prediction and interpretation accuracy of the model [32,33]. Currently, residential price characteristics have been widely revealed. Shen Tizhen et al. used MGWR to explore the influencing mechanism of residential prices in Beijing, and found that the distance to subway stations negatively affected housing prices and the impact was significant. Multi-scale geographical weighted regression can reflect the scale of the influence of different variables on the dependent variable [34]. Compared with studies based on the classical geographically weighted regression model, the results of MGWR regression are more reliable [35,36,37]. Wu Chao et al. conducted a multi-scale spatial relationship analysis of residential prices and their influencing factors in Nanjing. This study also confirmed that MGWR can more accurately reflect the spatial relationship between housing prices and influencing factors, avoiding the overfitting risk caused by spurious coefficients or distorted spatial heterogeneity relationships [38].
In conclusion, the existing studies mostly focus on inland cities or single functional zones, lacking a systematic investigation of the special geographical elements of coastal cities, which leads to doubts about the universality of the conclusions in coastal areas. Most of the literature takes megacities or the capitals of developing countries as the objects, and insufficiently analyzes the reasons and mechanisms of the impact of urban rail transit on housing prices in coastal cities. The existing studies are mostly limited to statistical correlation descriptions and do not combine local policies, resulting in the low practical feasibility of the research results. The traditional OLS method of the HPM ignores the spatial heterogeneity of housing price influencing factors, leading to limited model explanatory power and inability to capture spatial effects. Although GWR introduces spatial non-stationarity, its single global bandwidth assumption makes all the variables at the same spatial scale, unable to distinguish the differential impact mechanisms of global and local effects, resulting in spurious coefficients or overfitting risks. In recent years, although MGWR models have been widely used in empirical research on urban housing prices, scholars in the field of urban rail transit and housing prices in China have paid very limited attention to MGWR. Qingdao, as an important coastal city in China, has rapid development in both the urban rail transit and housing industry. This study selects the subway lines that have been opened in Qingdao and the residential areas along the lines as the research objects and uses the Kriging interpolation method and spatial autocorrelation analysis to analyze the spatial distribution characteristics of housing prices, comprehensively considering the sea view resources and the proximity to the coastline, and adding a new variable of the distance to the nearest coastline. Combined with MGWR to quantitatively evaluate the correlation and influence degree of different variables and housing prices, this study explores the multi-scale spatial impact of urban rail transit on surrounding housing prices. It is expected to enrich the theoretical system of the relationship between urban rail transit and housing prices and provide references for urban planning and construction. Future research needs to further integrate marine geography and transportation economics to promote the evolution of urban sustainable development towards precision and scientificity.

2. Data Acquisition and Research Methods
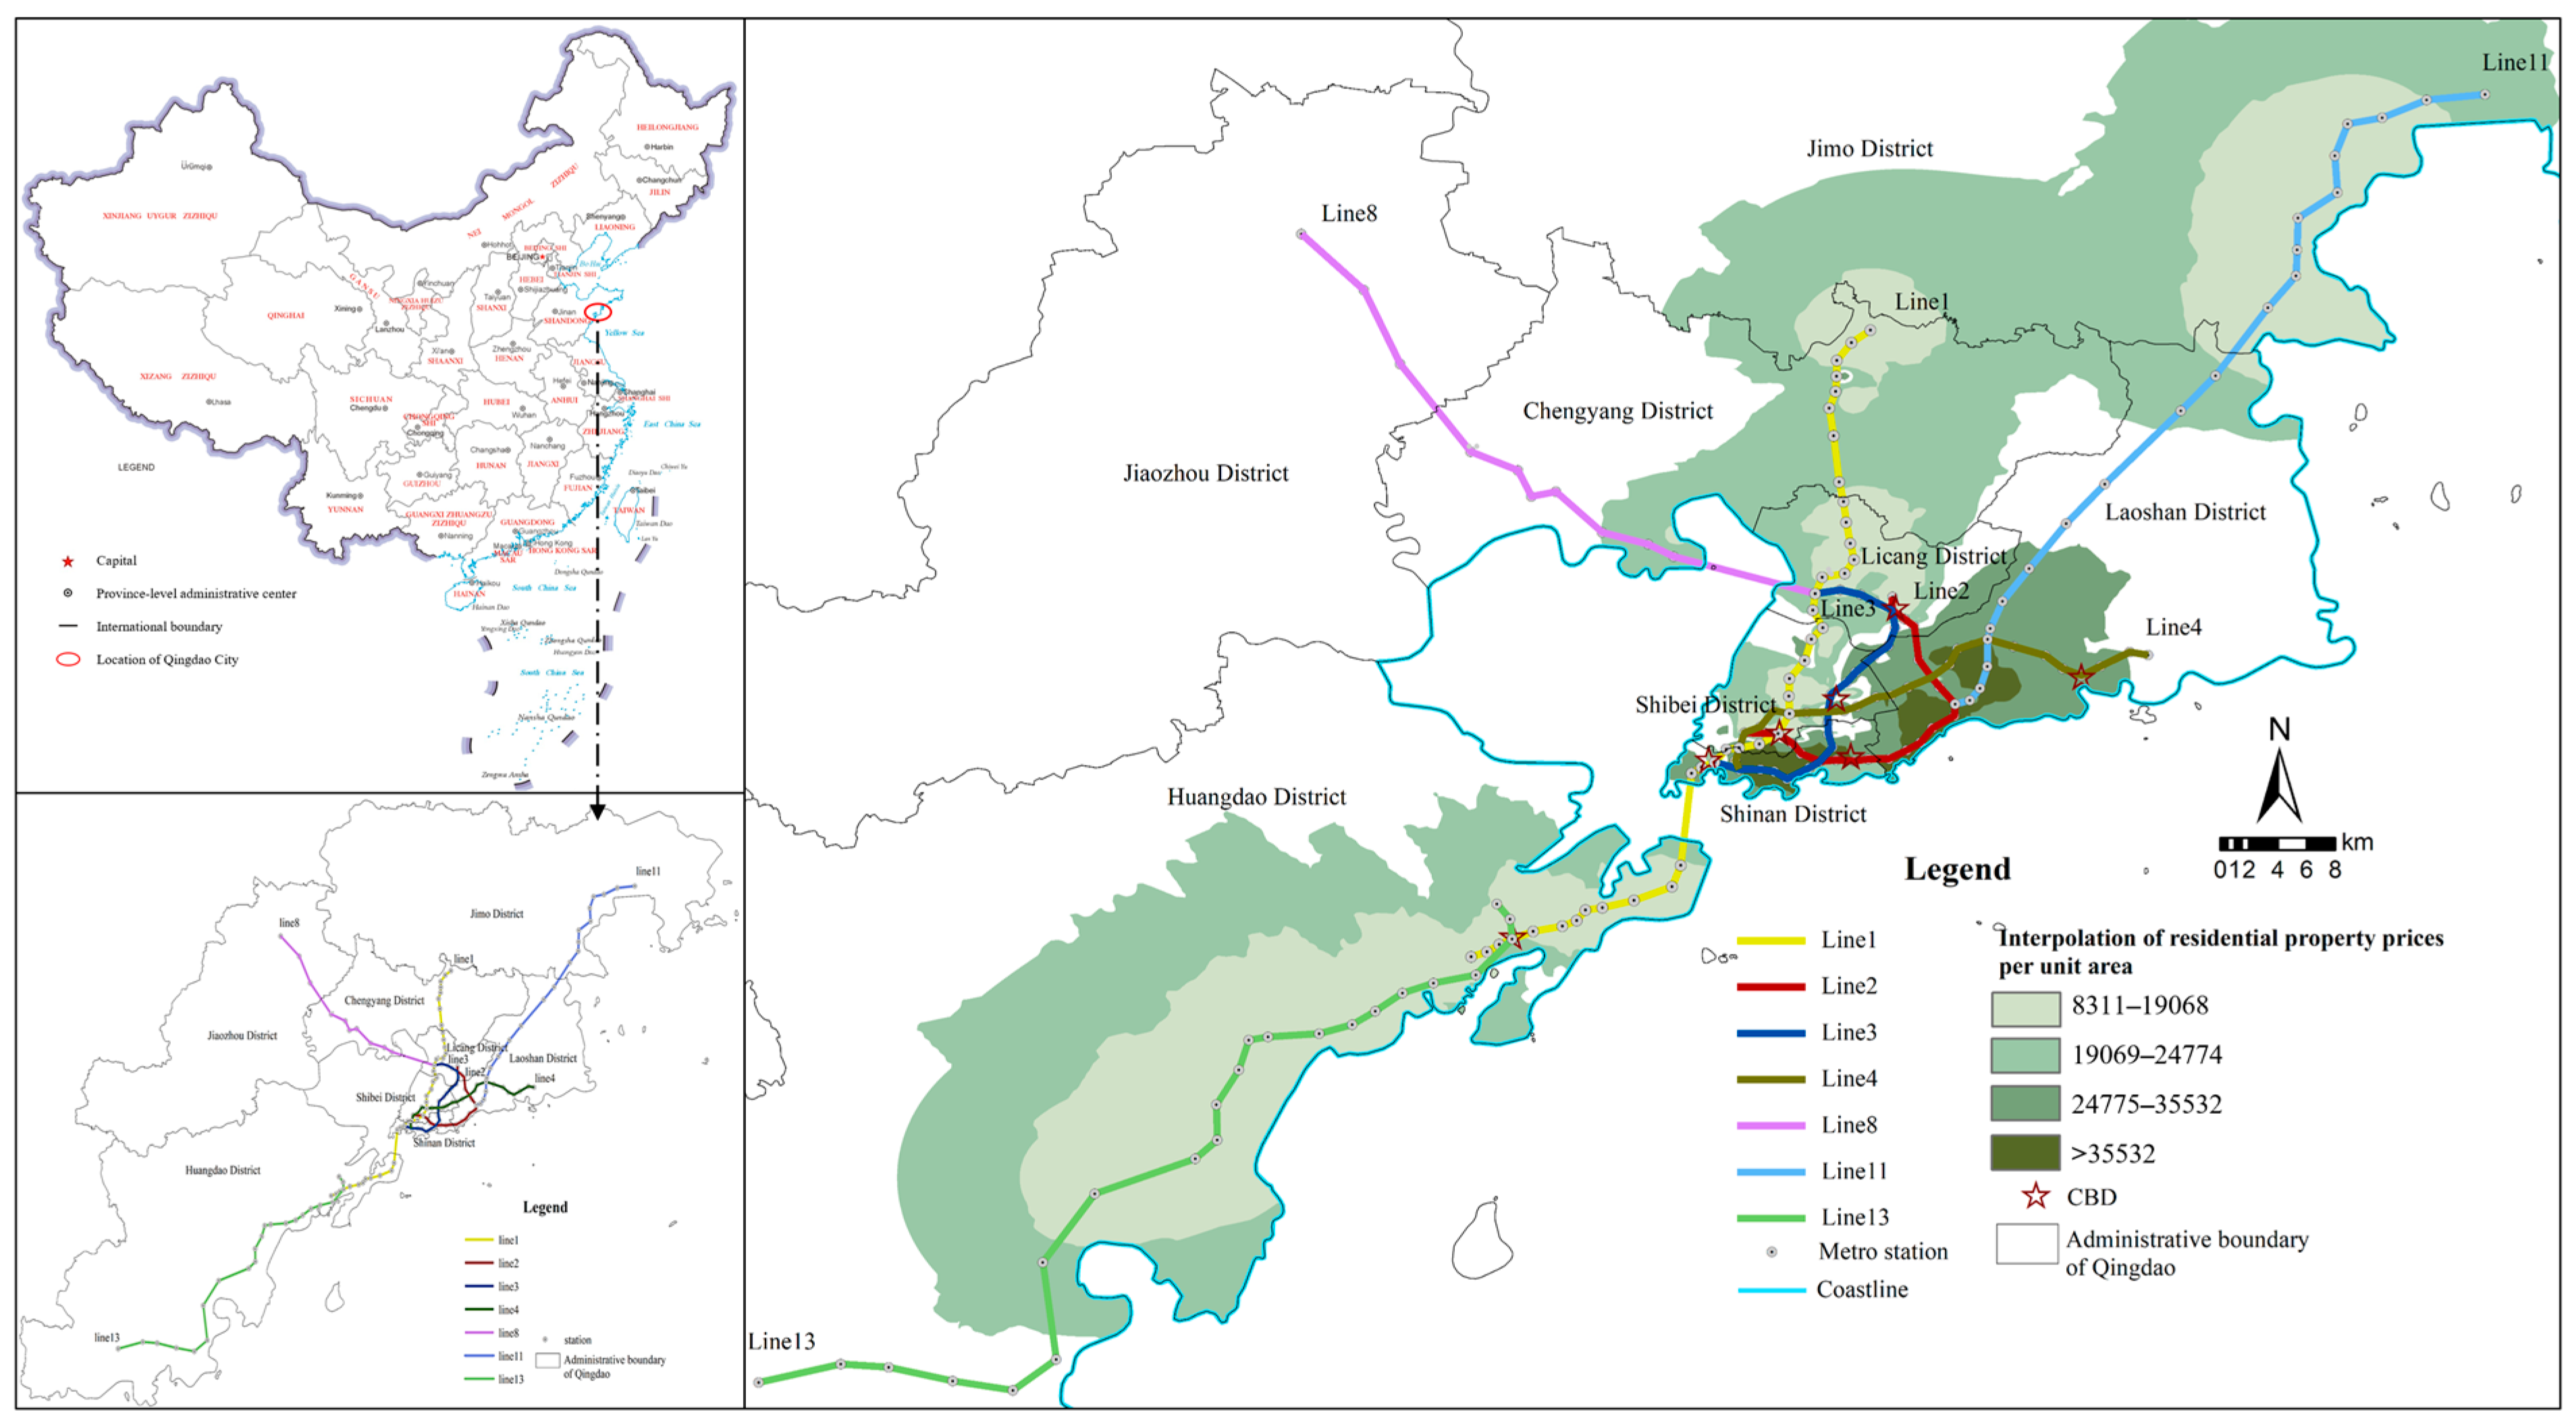
2.1. Research Area

Qingdao City is an important economic center and port city along the eastern coast of China. This study focuses on the seven urban rail transit lines that have been put into operation, namely Lines 1, 2, 3, 4, 5, 8, 11, and 13. These lines cover and run through the eight districts of Shinan District, Shibei District, Licang District, Chengyang District, Laoshan District, Huangdao District, Jiaozhou District, and Jimo District, forming the main trunk network for internal transportation connections within the urban area of Qingdao (Figure 1).

2.2. Data Source

The influence of urban rail transit on housing prices usually ranges from 0.2 to 1.6 km [39,40,41]. In this study, 1260 residential communities within a 2 km radius of the metro stations in Qingdao were selected as the initial sample points. Through web scraping of authoritative real estate websites such as Lianjia and Fangtianxia, key information such as community names, locations, listed prices, building areas, total floors, and year of construction was collected in January 2024. POI data from Gaode, Google, and Baidu Maps was utilized to check whether there are schools, hospitals, shopping malls, parks, and other public service facilities within 1 km of the residential area. The missing values and outliers in the POI data were removed and the coordinates were corrected. By using the neighborhood analysis tool in ArcGIS, we calculated the straight-line distances from each sample point to the nearest subway station, commercial center, coastline, school, hospital, shopping mall, and park. The price levels of villas and basements differ greatly from those of ordinary residences. Including them in the housing price research data would lead to a serious imbalance in data distribution, affecting the accuracy and reliability of statistical analysis results. After data preprocessing, villas and basements were excluded to reduce the influence of data fluctuations and outliers. Finally, the average prices of duplicate residential transaction samples in each area were statistically analyzed, and 12,924 sample data were selected as the research objects.
By reviewing the research findings of numerous scholars, the factors influencing housing prices mostly included location characteristics (such as distance to the city’s CBD, transportation convenience, etc.), neighborhood characteristics (such as medical facilities, surrounding education, commercial service facilities, etc.), structural characteristics (such as building area, decoration degree, floor level, total floors, building structure, etc.), and these three categories [42,43,44,45]. Considering the types and current situation of residential areas in each district of Qingdao and taking into account the availability of data, the variables of various influencing factors were added and subdivided. Considering the regional characteristics of Qingdao, the housing prices in the Shinan District in the coastal area and the western part of Laoshan District are significantly higher. Therefore, a new variable of the distance to the nearest coastline was added [46,47,48]. The data were classified as nominal, ordinal, and interval variables. The independent variable of decoration degree (high-end decoration) of the research sample adopted a dummy variable, where 1 represents yes and 0 represents no. The term “premium finish” refers to the complete set of renovations uniformly completed by the developer, indicating that the hard decoration part, kitchen and bathroom facilities, and basic equipment are all fully equipped. The floor level (low, medium, and high floors) was included in the model in the form of scores. Floor classification: for multi-story residences with less than 6 floors, small high-rise residences ranging from 7 to 11 floors, and high-rise residences with more than 12 floors, all were classified as low floors; for multi-story residences with 3 to 4 floors, small high-rise residences ranging from 4 to 8 floors, and high-rise residences located between 1/3 and 2/3 of the total floors, all were classified as medium floors; for multi-story residences with 5 to 6 floors, small high-rise residences with 9 floors and above, and high-rise residences with more than 2/3 of the total floors up to the top floor, all were classified as high floors (Table 1).
In the aspects of infrastructure development and cross-border spatial governance, Soft Space demonstrates unique policy leverage capabilities. Allmendinger et al. defined Soft Space as “flexible planning domains that intersect, bypass or overlap with formal administrative jurisdictions”, which reshape local development trajectories through informal and strategic spatial frameworks, even without legally binding force, and can profoundly influence spatial practices through resource allocation and power networks [49,50]. The rail transit and urban projects in Qingdao City reflect the governance logic of Soft Space, whose spatial operation mechanism cannot be explained by traditional administrative units and requires the use of MGWR to capture its multi-scale influence. Soft Space is the institutional root of spatial heterogeneity, creating imbalances through cross-level governance tools, and MGWR quantifies the multi-scale penetration of this institutional influence through variable bandwidth differences. The boundaries and functions of Soft Space change dynamically with policy adjustments, and the flexible bandwidth selection of MGWR can map this dynamism in real time, which is superior to traditional fixed boundary models. This study selected the core motivation of MGWR in order to decouple the differentiated effects of multi-level governance tools on housing prices, and by integrating the Soft Space theory and MGWR method, the capitalization effect of urban rail transit was no longer simplified as a “distance attenuation function”, but regarded as a multi-scale result of institutional levers and local spatial practices. This perspective not only challenges the static assumptions of traditional spatial analysis but also promotes the innovation of spatial analysis methods, providing more coordinated methodological tools to address increasingly complex problems in spatial governance.

2.3. Research Methodology

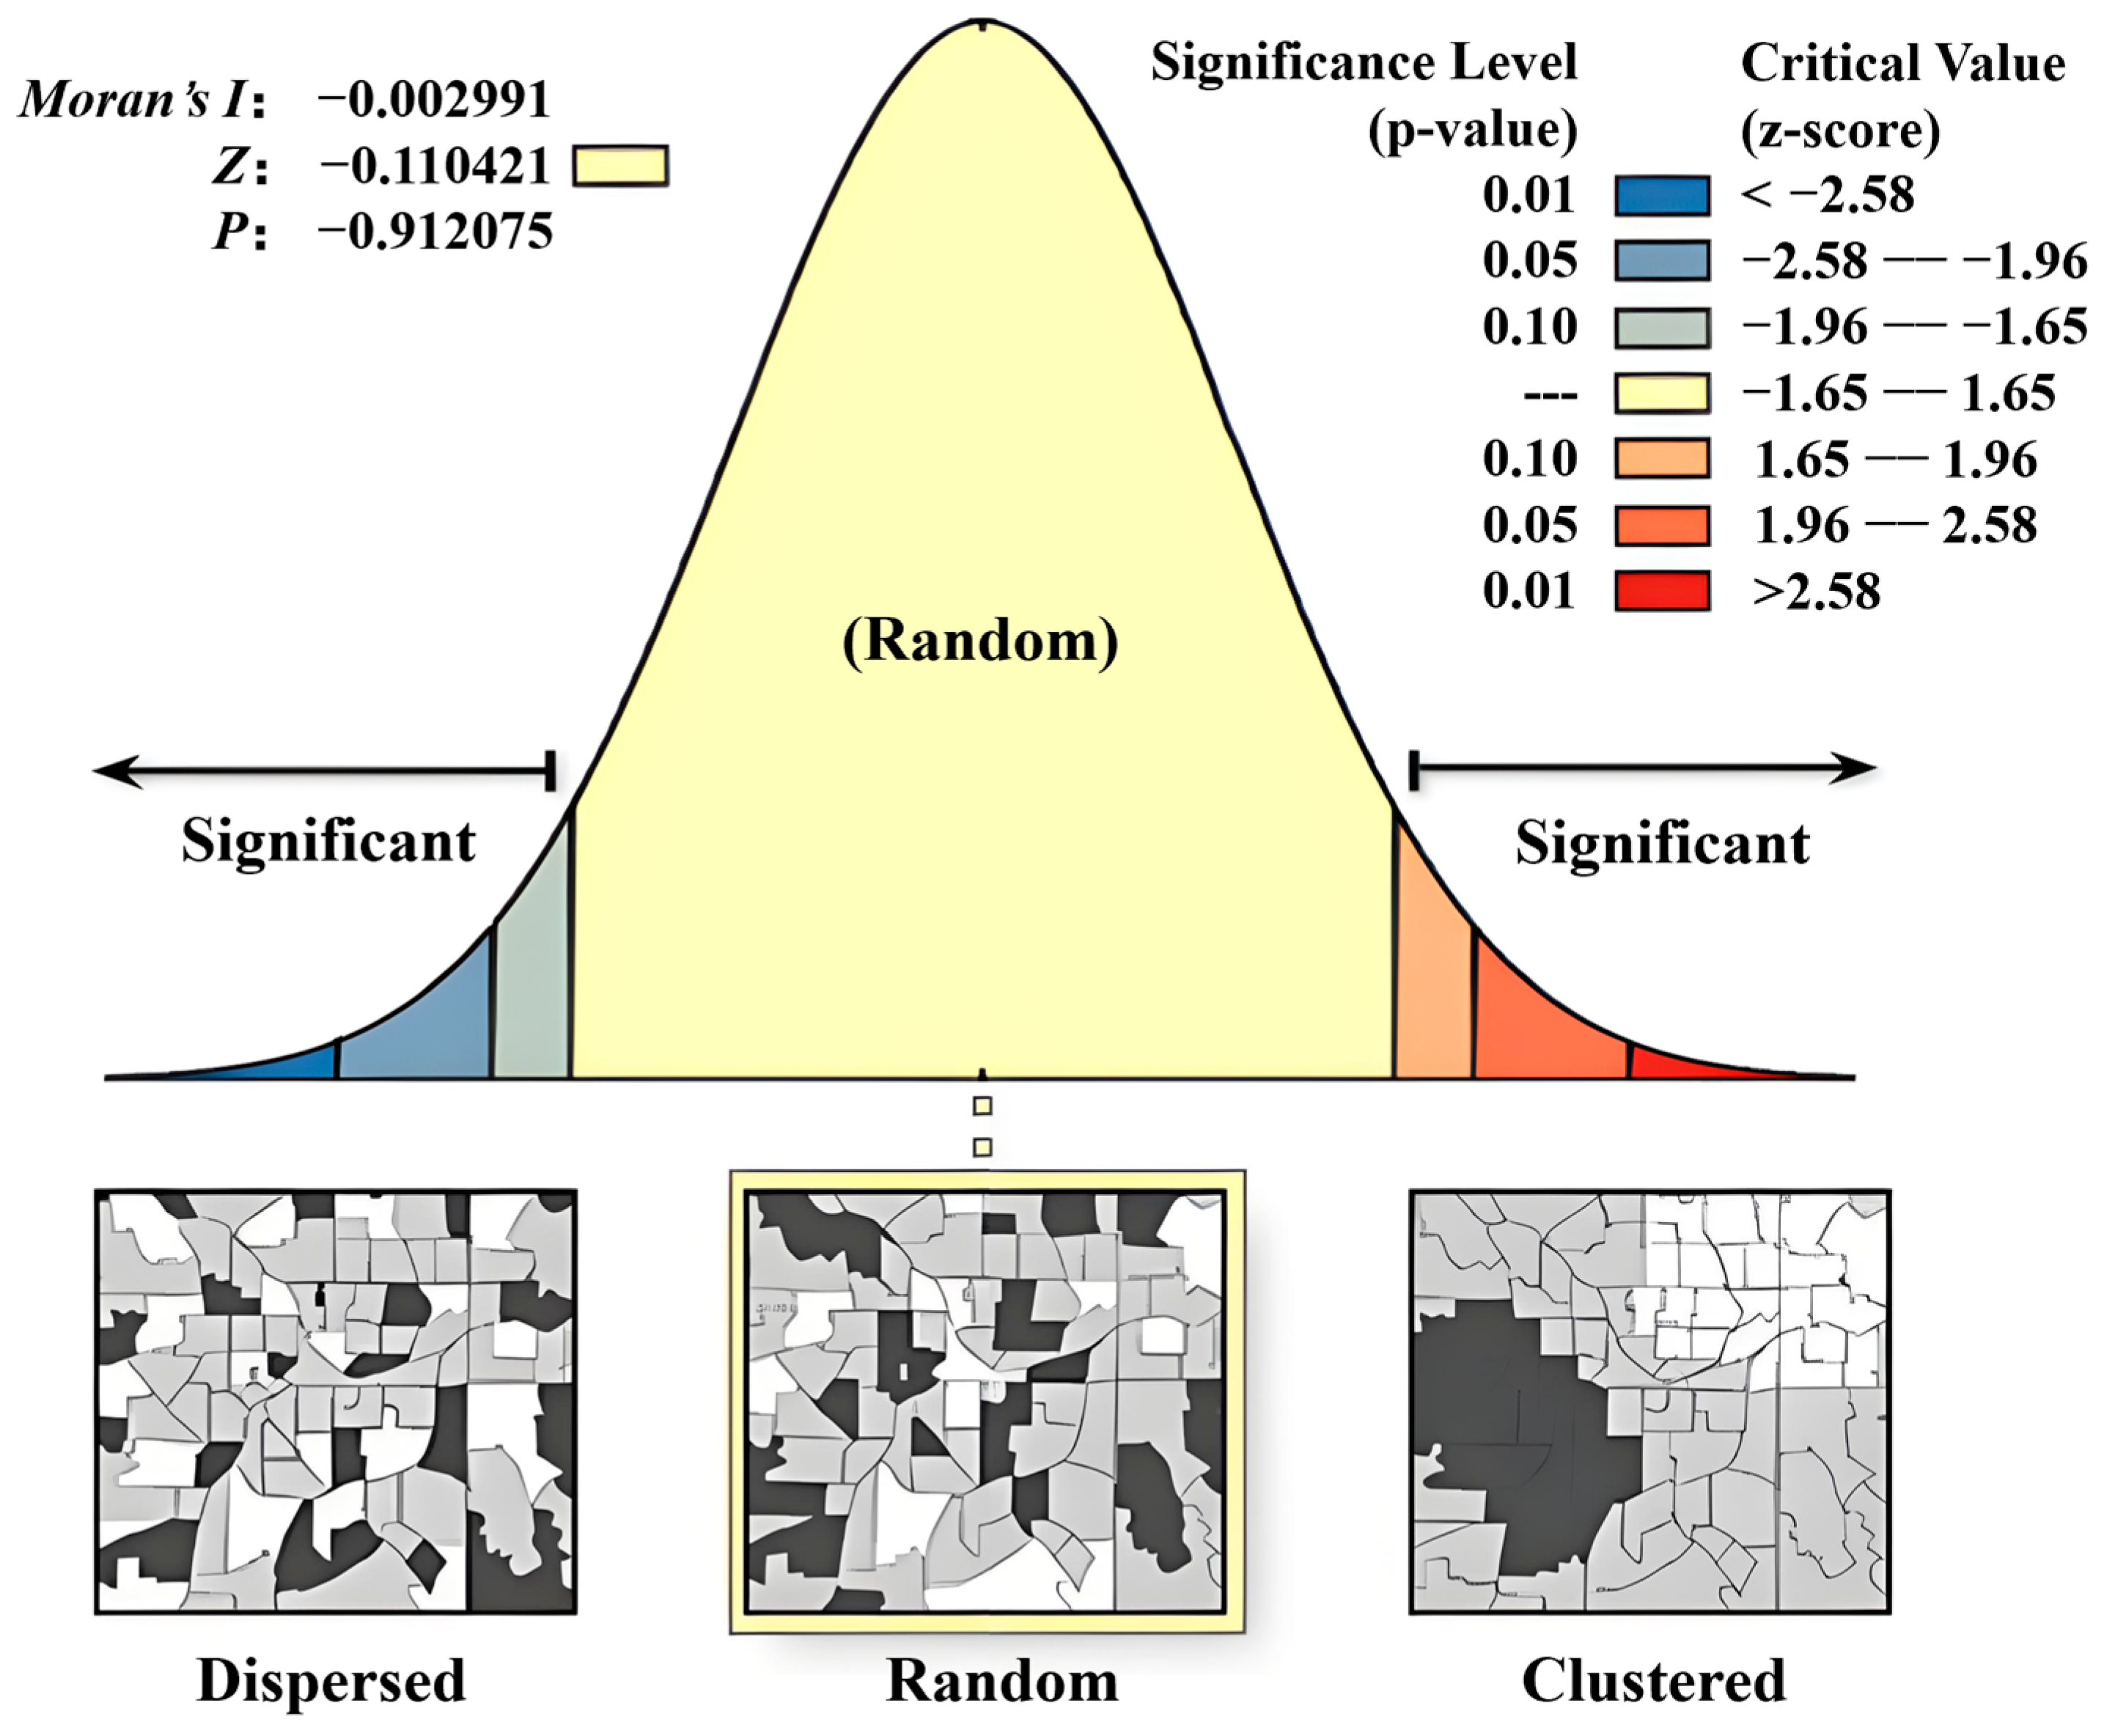
2.3.1. Spatial Autocorrelation Analysis

A spatial autocorrelation analysis was conducted to explore the interrelationships among various types of residential spaces based on housing price data and the spatial locations of residential areas. It included both global spatial autocorrelation and local spatial autocorrelation. The Moran’s I Index is commonly used to measure this, with Moran’s I > 0 indicating a positive correlation, suggesting that the residential spaces are aggregated; conversely, Moran’s I < 0 indicates a negative correlation, suggesting that the residential spaces are dispersed; and Moran’s I = 0 indicates no correlation, suggesting that the residential spaces are randomly distributed. Among them, global spatial autocorrelation was used to determine the overall degree of correlation and dependence of housing prices, with a larger value indicating greater spatial correlation. The calculation formula is as follows:
I = n S 0 n i = 1 n j = 1 W i j Z i Z j n i = 1 Z i 2
In the formula, I represents Moran’s index, n is the total number of elements, Wij is the spatial weight between elements i and j, and S0 is the set of all the spatial weights.

2.3.2. Kriging Interpolation Analysis

The Kriging interpolation method takes into account the similarity of various data characteristics of residential buildings within the study area, and calculates and generates a continuous spatial structure from the discrete data points. Therefore, it is widely used in the study of the spatial distribution of housing prices. In this paper, the Kriging interpolation method was used to conduct a linear optimal unbiased estimation of unknown points of rent and its influencing factors in space. The expression is as follows:
Z ( x 0 ) = n i = 1 W i Z ( x i )
In Equation (2), Z(x0) represents the observed value of the prediction point in the study area, n is the number of sample points, Z(xi) is the observed value of the known points around the ith prediction point, and Wi is the weight value of Z(xi).

2.3.3. Multi-Scale Geographically Weighted Regression

The MGWR model adds spatially stationary variables on the basis of the GWR model, integrating global variables and local variables, effectively preventing the problem that regression analysis and results may be erroneous due to the complete equalization of all influencing factors. This paper used the MGWR model to estimate the impact of independent variables on housing prices using the two-stage iterative method. The general form of its model is as follows:
P i = n j = 1 β b w j ( u i v i ) X i j + ε i
Pi represents the housing price of sample point i; βbwj denotes the regression coefficient of variable j under different bandwidth levels; Xij is the observed value of variable j at point i; and εi is the random error term. In this model, a quadratic kernel function was adopted, and the bandwidth value was determined by the AICc criterion.

3. Empirical Analysis on Influencing Factors of Housing Prices Along Urban Rail Transit Lines

3.1. The Pattern of Housing Price Differentiation Along the Rail Transit Lines

Based on the Kriging interpolation method, the spatial visualization of housing prices was conducted (Figure 1), revealing that the price range distribution of housing properties along the urban rail transit lines in Qingdao City varies from 8311 CNY/square meter in the peripheral areas such as Chengyang and Huangdao to 80,895 CNY/square meter in the core areas such as Laoshan and Shinan District. The price span indicates the gradient differentiation phenomenon of housing values within the coverage area of the urban rail transit network. Further analysis indicated that the prices in Shinan District and Laoshan District have reached 80,642 CNY/square meter and 80,895 CNY/square meter, respectively. The price peaks are spatially distributed in a dual-core pattern, which is closely related to the functional layout of the city’s CBD and the spatial effect of high-quality public service resources. This is closely related to the functional layout of the CBD in the city and the spatial effect of high-quality public service resources. Secondly, the price depressions are mainly distributed in the terminal areas of the rail transit network. The average prices of residential properties in the northern part of Licang District and along the Huangdao District are generally lower than CNY 14,316 per square meter. This spatial pattern verifies the dynamic evolution law of the “core–edge” structure during urban expansion; that is, although urban rail transit construction can enhance the accessibility along the lines, the edge areas, due to lagging supporting facilities and low land development intensity, have obvious time lags in the release of their value.
The Moran’s I analysis of the spatial autocorrelation report shows that the global Moran’s I index is 0.25, with a Z-score of 12.9 and a p-value of 0.000 (Table 2). This indicates that the residential prices in Qingdao show a significant spatial clustering phenomenon and there is a positive correlation. The high/low clustering report reveals that the Z-score corresponds to high clustering, meaning that high housing prices are concentrated. This phenomenon has strong statistical significance, indicating that the distribution of residential prices is significantly influenced by spatial factors. This further validates the capturing ability of Kriging interpolation for spatial dependence and confirms that the distribution of residential prices is significantly affected by spatial factors.

3.2. Comparison of OLS, GWR and MGWR

A normality test was conducted on the dependent variable, housing price. Based on the histogram and the residual P-P plot, it was observed that the housing price data of the dependent variable conform to a normal distribution. Next, the stepwise method in the Version 25.0 of SPSS software was used for OLS regression analysis. After the model was transformed into linear, logarithmic, and semi-logarithmic forms, the semi-logarithmic model was found to have the best fit when taking the housing price as the dependent variable. Therefore, this model form was selected. Further, multicollinearity tests were conducted on 15 variables. The results showed that the VIF values of the variables such as the distance to the nearest school, park, and shopping mall were greater than 10, indicating the presence of multicollinearity among the variables. Moreover, the VIF values of the variables such as the distance to the hospital, CBD, and metro station were greater than 5, suggesting the possibility of local multicollinearity. Pearson tests were used to correct and eliminate the variables such as the distance to the nearest school, shopping mall, and CBD. Finally, 12 variables were selected to enter the model, with an R-squared value of 42.2%. Variables such as building area, total floors, green coverage rate, property management fee, distance to the nearest metro station, hospital, and park distance would significantly affect housing prices. However, the distance to the nearest coastline, floor level, decoration degree, plot ratio, and years had insignificant effects on housing prices. The global coefficients of the OLS model (Table 3) show that within a radius of 2 km of the metro, for every 1 km increase in the distance to the metro station, the housing price increases by 0.246%. Other influencing factors could also be explained according to the regression coefficients. It can be seen that the global coefficients of the OLS model have a certain explanatory power.
Due to the relatively low goodness-of-fit of the OLS method, it is sensitive to outliers and has limited interpretability. In this study, ArcGIS was utilized for geographically weighted regression analysis (GWR), with an R-squared fit of 72.4%. Although the model results have a relatively high fit, GWR models have limitations in handling model complexity and interpretability, as well as bandwidth selection issues. Such deviations may affect the accuracy and reliability of the model. MGWR introduces heterogeneous bandwidths with different parameters based on GWR, further enhancing the model’s fitting ability and better handling multiple variables and different scales of variable influence. MGWR models have better performance in handling complex datasets, with an adjusted R-squared fit of 73.8%, indicating that MGWR has a better goodness of fit than OLS and GWR. Therefore, the regression results of the MGWR model are more accurate and reliable (Table 4).

3.3. Analysis of MGWR Results

The MGWR method was used to calculate the estimated coefficients and specific bandwidths for 12,924 sample data from 1260 residential communities around Qingdao Metro (Table 5). The significance test results of the model showed that the building area (99.13%), total floors (40%), green coverage rate (61.59%), property management fee (41.27%), distance metro (16.11%), hospital (37.14%), and park (9.44%) were significant variables. These eight variables demonstrated spatial heterogeneity and local significance. The results of the GWR model indicated that the optimal bandwidth was 99. Compared with the unique bandwidths of OLS and GWR, the MGWR model used in this study had an exclusive bandwidth for each housing price influencing variable, with a variation range of [44, 373]. The influence of the selected factors on housing prices exhibited spatial heterogeneity, and the scale of this heterogeneity varied. Variables with larger bandwidths could have an impact on housing prices over a wide range or even globally, while variables with smaller bandwidths were mainly confined to smaller or local areas. Among them, the bandwidth values of total building floors and the distance to the nearest hospital were within 100, indicating that the spatial heterogeneity of these two influencing factors was relatively strong, suggesting that the influence of this variable was highly localized [51,52]. The bandwidth values of other influencing factors ranged from [142, 373], and the spatial heterogeneity degree was at an intermediate level, exerting a moderate influence on housing prices.
The residuals of the MGWR model show no significant autocorrelation in spatial distribution, presenting a random pattern (Figure 2). This indicates that the residuals of the model do not have obvious spatial clustering or dispersion characteristics, and better explain the spatial effect. Moran’s I index: −0.002991; this value is extremely close to 0, suggesting that the spatial distribution of residuals has almost no directional trend, neither significantly aggregated nor significantly dispersed. Z-score: −0.110421; the absolute value is much smaller than 1.96 (the critical value at the 95% confidence level), indicating that the result is not significant, representing a spatially random distribution. P: 0.912075, much higher than the commonly used significance level, further supporting the conclusion that the spatial distribution is random.

3.3.1. Analysis of Influencing Factors on Housing Prices Along Urban Rail Transit Lines

According to the MGWR analysis, the influencing factors of housing prices showed varying degrees of spatial variations(Figure 3). Among the structural characteristics, there were differences in housing prices for houses of different floor heights. In most areas, the total floors factor had a negative correlation effect on housing prices; that is, the prices of multi-story residences were higher than those of high-rise residences. The reason is that multi-story residences have advantages such as smaller shared areas and larger floor areas. The total floor factor is significant within the range of 98 m and shows strong heterogeneity in space. The influence on housing prices was particularly obvious in the Shinan District and along the Line 13 metro. Due to the dense population and scarce land resources in Shinan District, as well as the long elevator waiting time and inconvenient escape, the prices of multi-story residences were higher than those of high-rise residences. The influence of the building area factor on housing prices was within the range of 188 m, and it had a positive correlation effect; that is, the increase in house area led to an increase in housing prices. The impact of the building area factor on housing prices was the strongest in the Shinan District and the weakest in Huangdao District. This is related to the high income level of the residents. This group is willing to invest in high-quality residences and housing prices. The green coverage rate had a medium impact on housing prices, with an influence scale of 258 m, matching the community scale. This factor shows significant positive and negative correlations with housing prices locally. A high green coverage rate will lead to an increase in housing prices. The correlation between residential green coverage rate and housing prices was most evident in Licang District; conversely, the influence of this factor on housing prices in the Shinan District and along Line 13 metro was comparatively negligible. This is because the housing market in Licang District has a higher recognition and demand for green coverage rates. However, in the old urban areas where land resources are relatively scarce, residents’ demand for green coverage rates is not high, and there may be a phenomenon of high green coverage rates but high housing prices. The regression coefficient of the property management fee factor was all positively correlated, and the influence scale was significant within 142 m, which led to an increase in housing prices. At the spatial distribution level, areas far from the city center had declined due to their location advantages, resulting in residents placing more emphasis on the environmental conditions and property services of the community. Generally, communities with higher property management fees can provide a better living experience, so home buyers tend to invest in such residential communities.
Among the neighborhood characteristic factors, the research found that the distance factor of the nearest tertiary hospital had a relatively strong impact on residential prices only within 44 m (Figure 4). The regression coefficients were all negative. The housing prices indicated that the closer the housing was to the tertiary hospital, the greater the increment effect on the housing prices. The interchange stations of Metro Line 1 and Line 13 and the areas along Metro Line 2 passing through Shinan District and the western part of Laoshan Mountain had relatively significant effects. The increasing attention paid by residents to health quality made medical resources an important consideration factor when purchasing houses. The medical convenience of the tertiary hospitals was more attractive to residents to purchase surrounding housing, indirectly leading to an increase in housing prices. The distance of the nearest park was positively or negatively correlated with the housing prices, and the spatial scale affected a radius of 349 m. Houses located closer to the park are more likely to attract home buyers. However, while parks provide a peaceful environment for residents, they also bring about negative impacts. Because houses close to the park are disturbed by the noise from activities within the park, there is a phenomenon in some areas where the number of parks is positively correlated with house prices.
Among the location characteristic factors, the significant influence scale of the distance to the nearest metro station on housing prices was concentrated within a radius of 373 m, and beyond this range, the effect decayed. The four metro stations of Haiyou Road, Haichuan Road, Hai’an Road, and Shilaoren Sea Bathing Beach on Line 2, as well as the transfer station Miaoling Road and the Convention Center station on Line 11, had a negative correlation effect on housing prices. That is, housing prices increased as the distance to the metro stations shortened. The influence of the distance to urban rail transit on other surrounding areas was not significant (Figure 3).

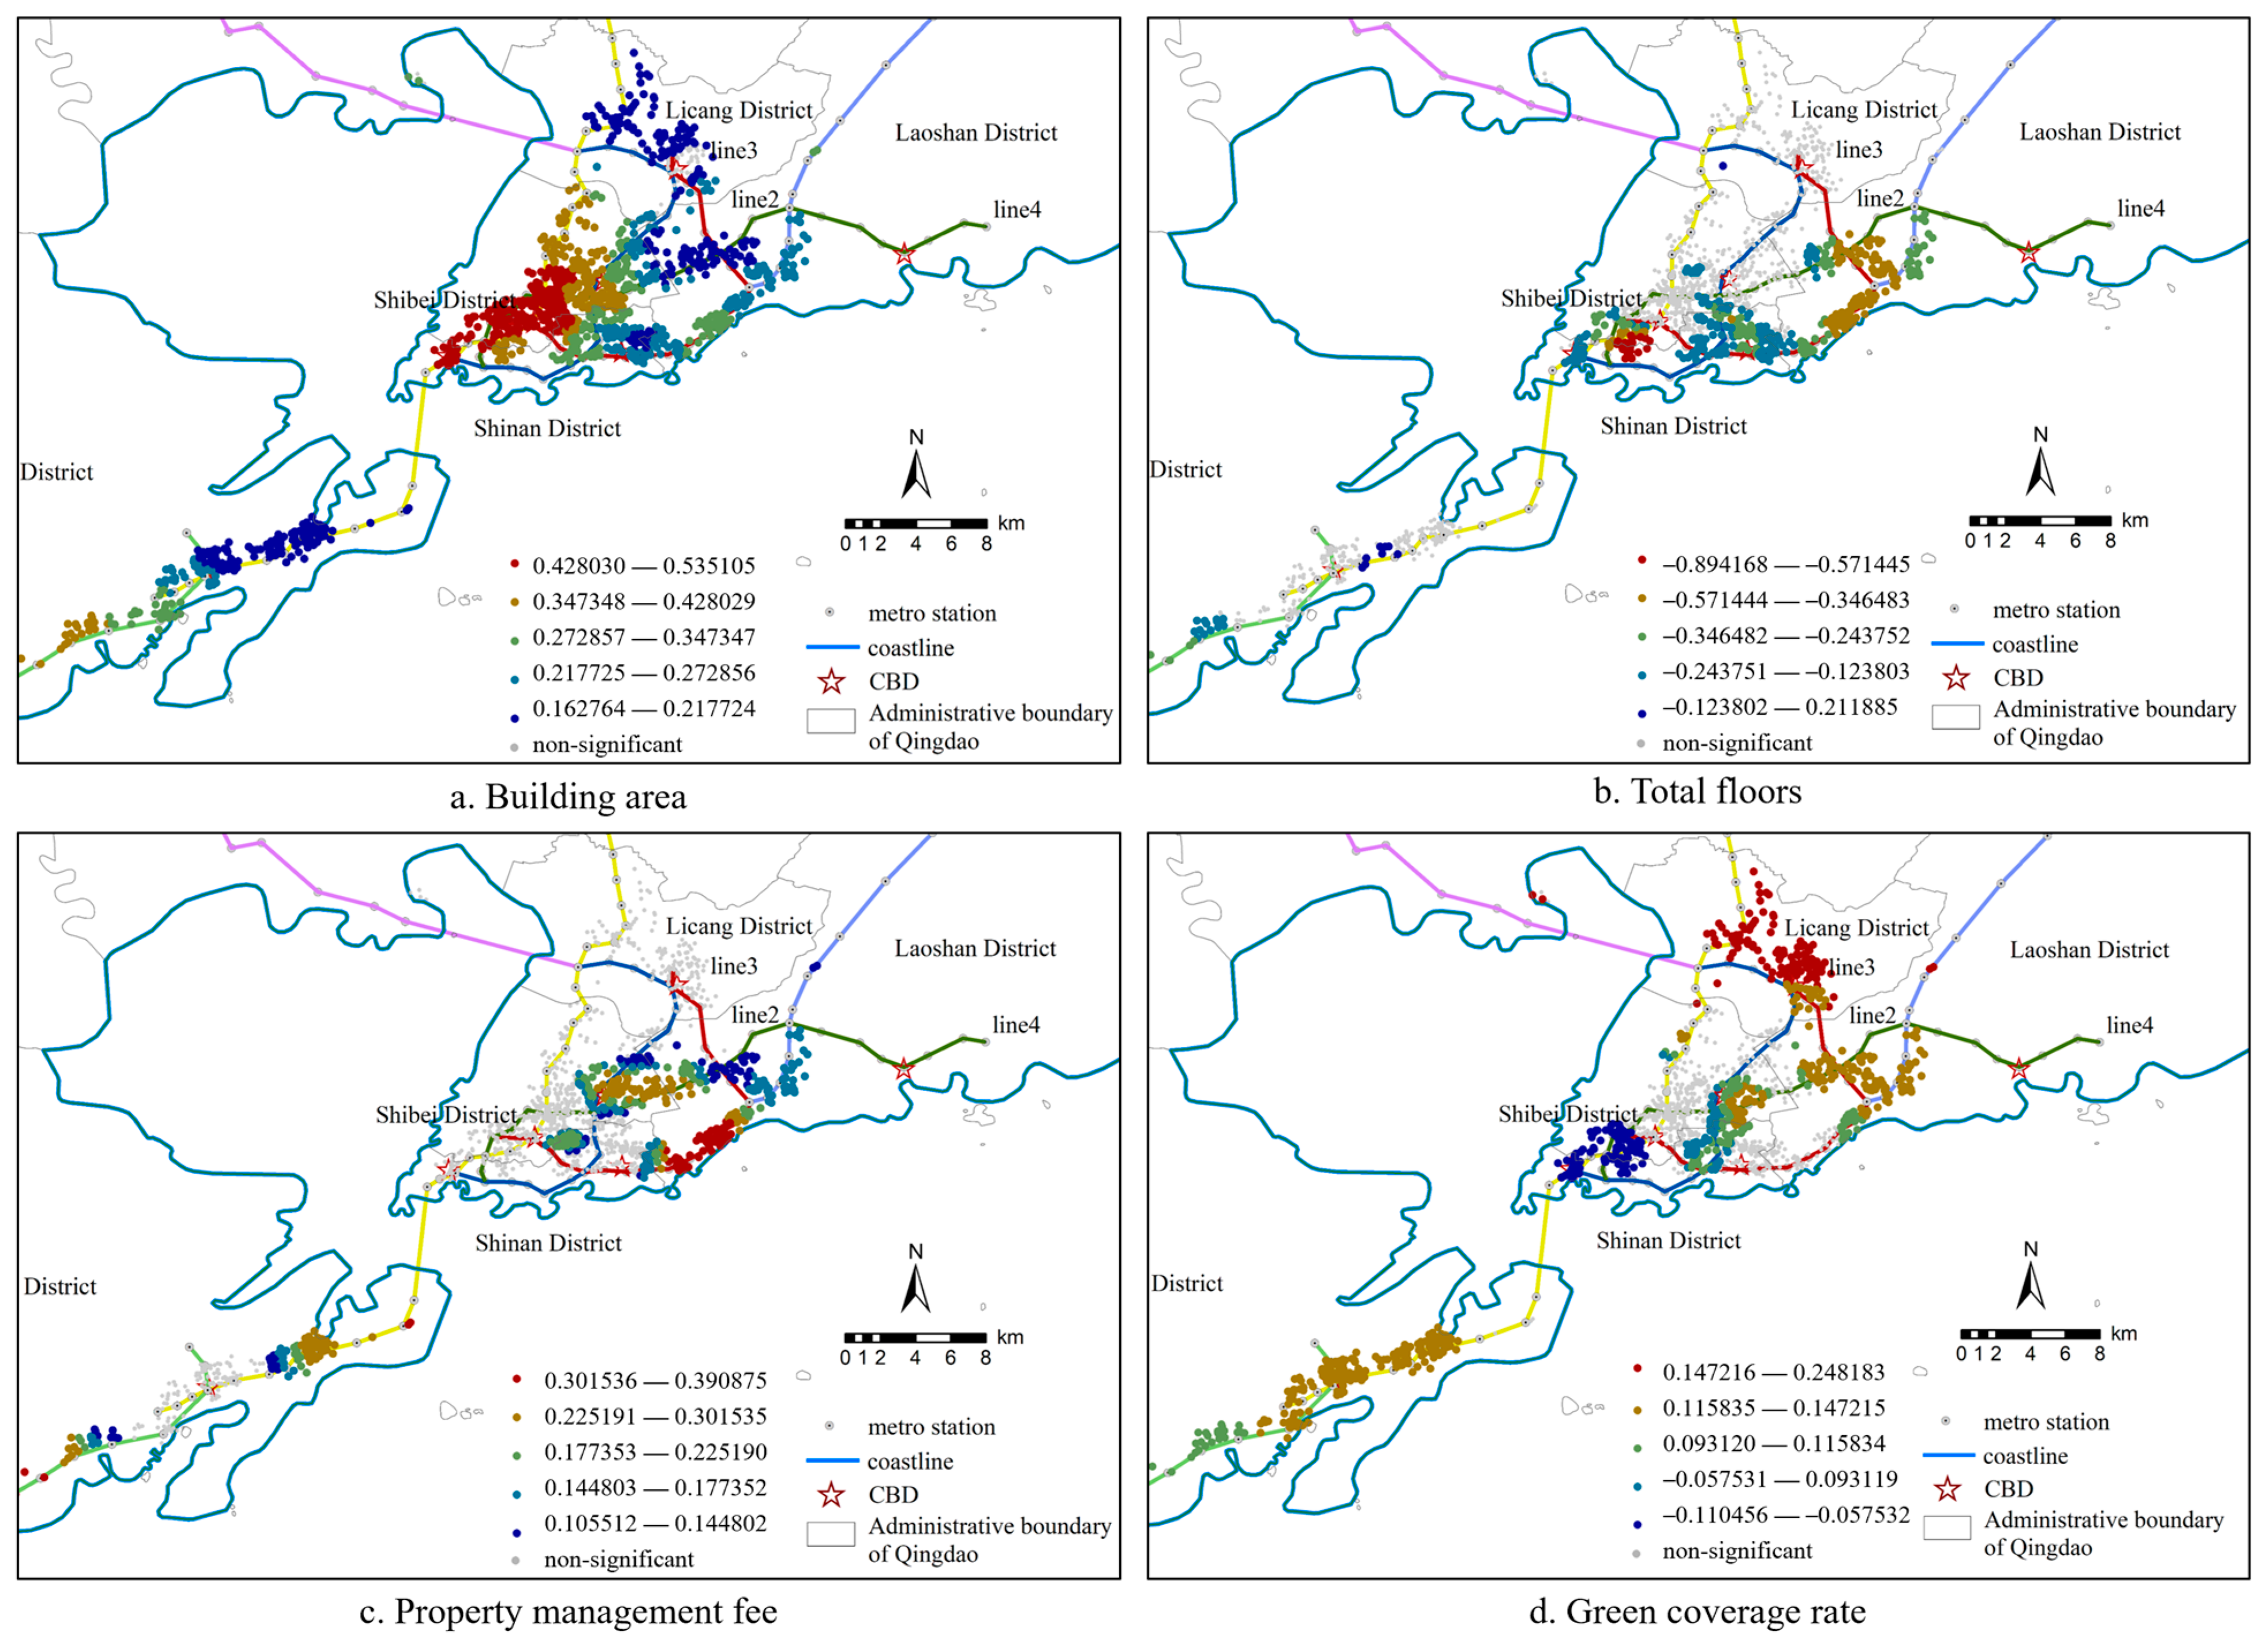
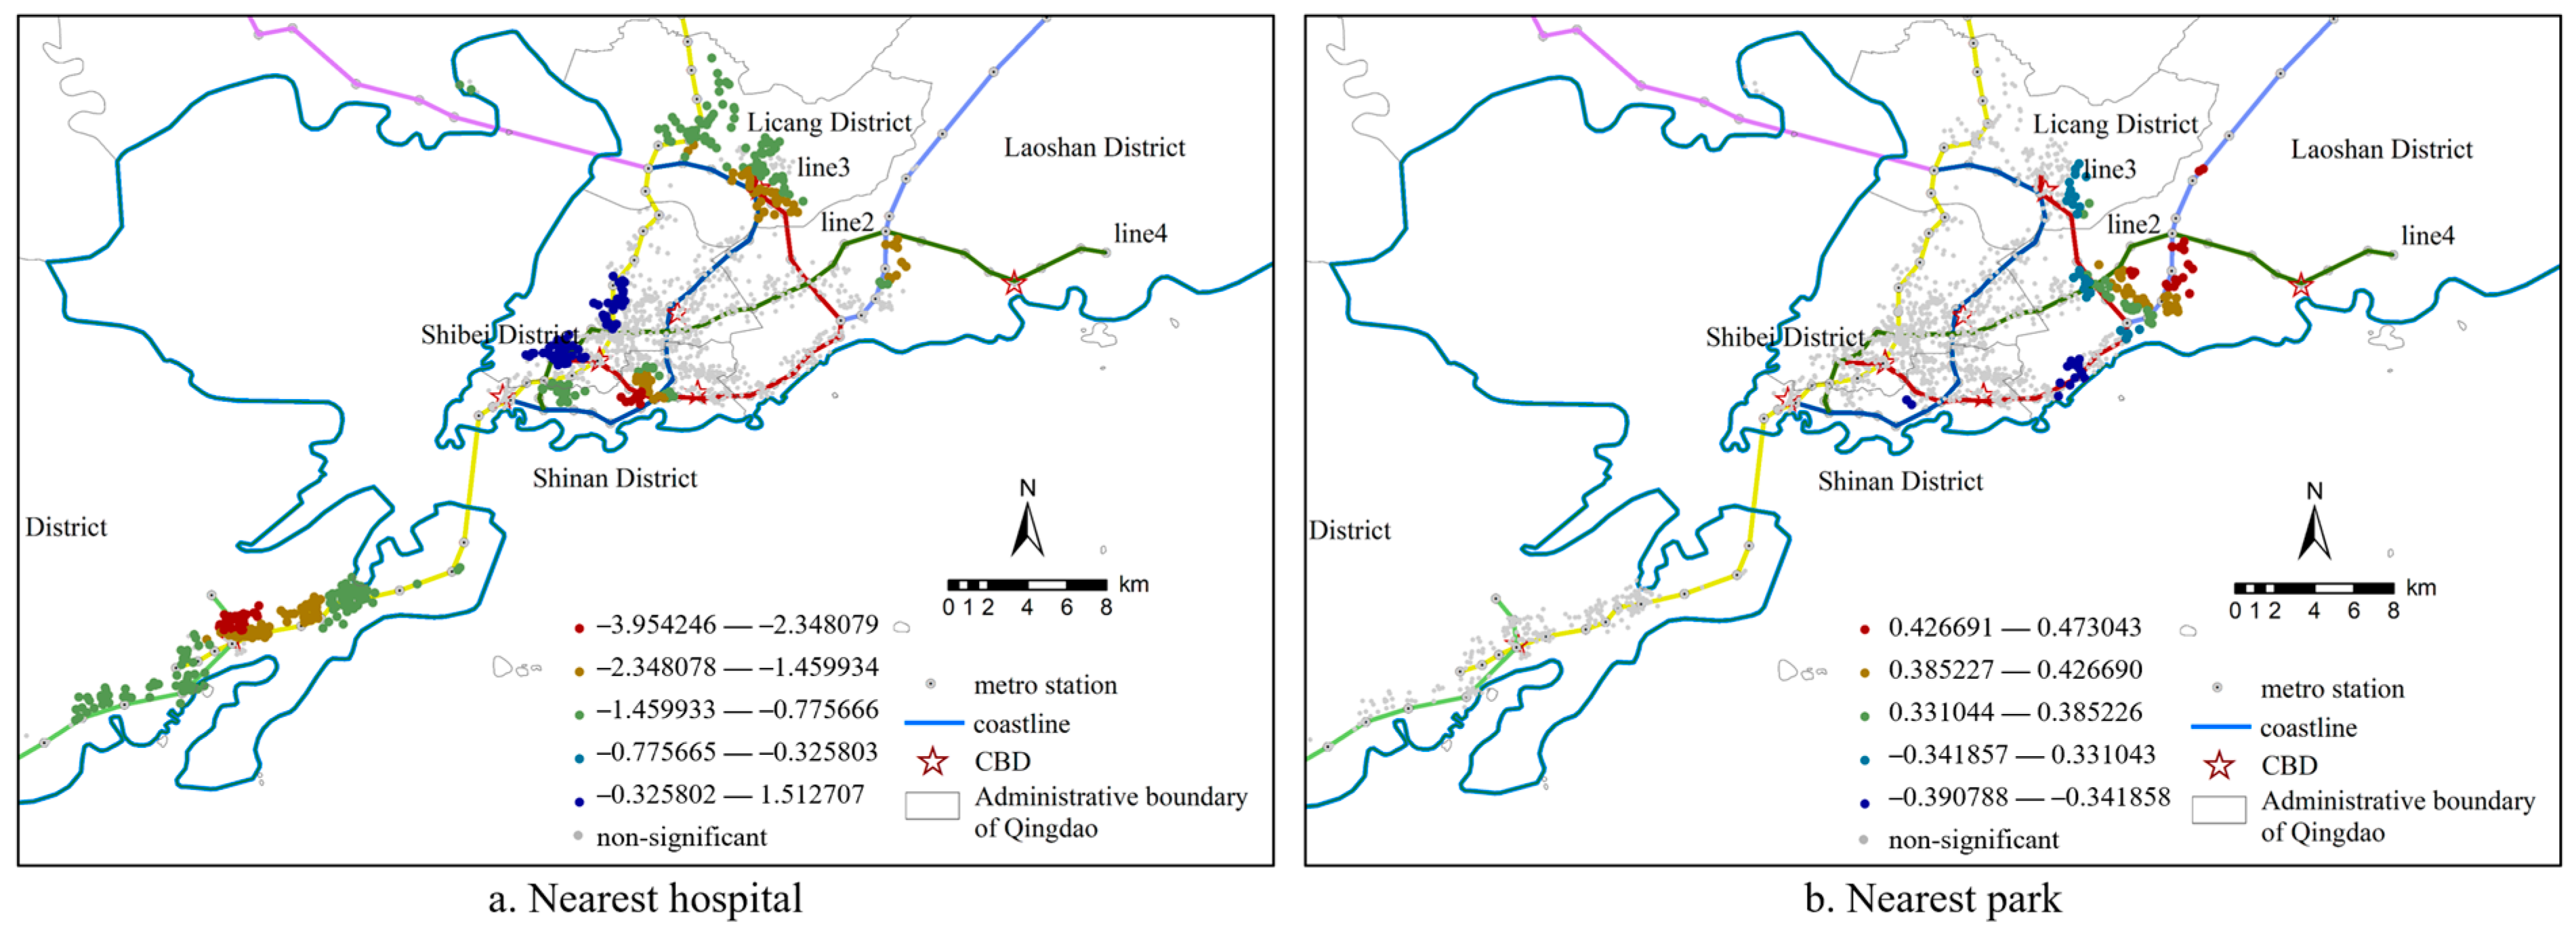
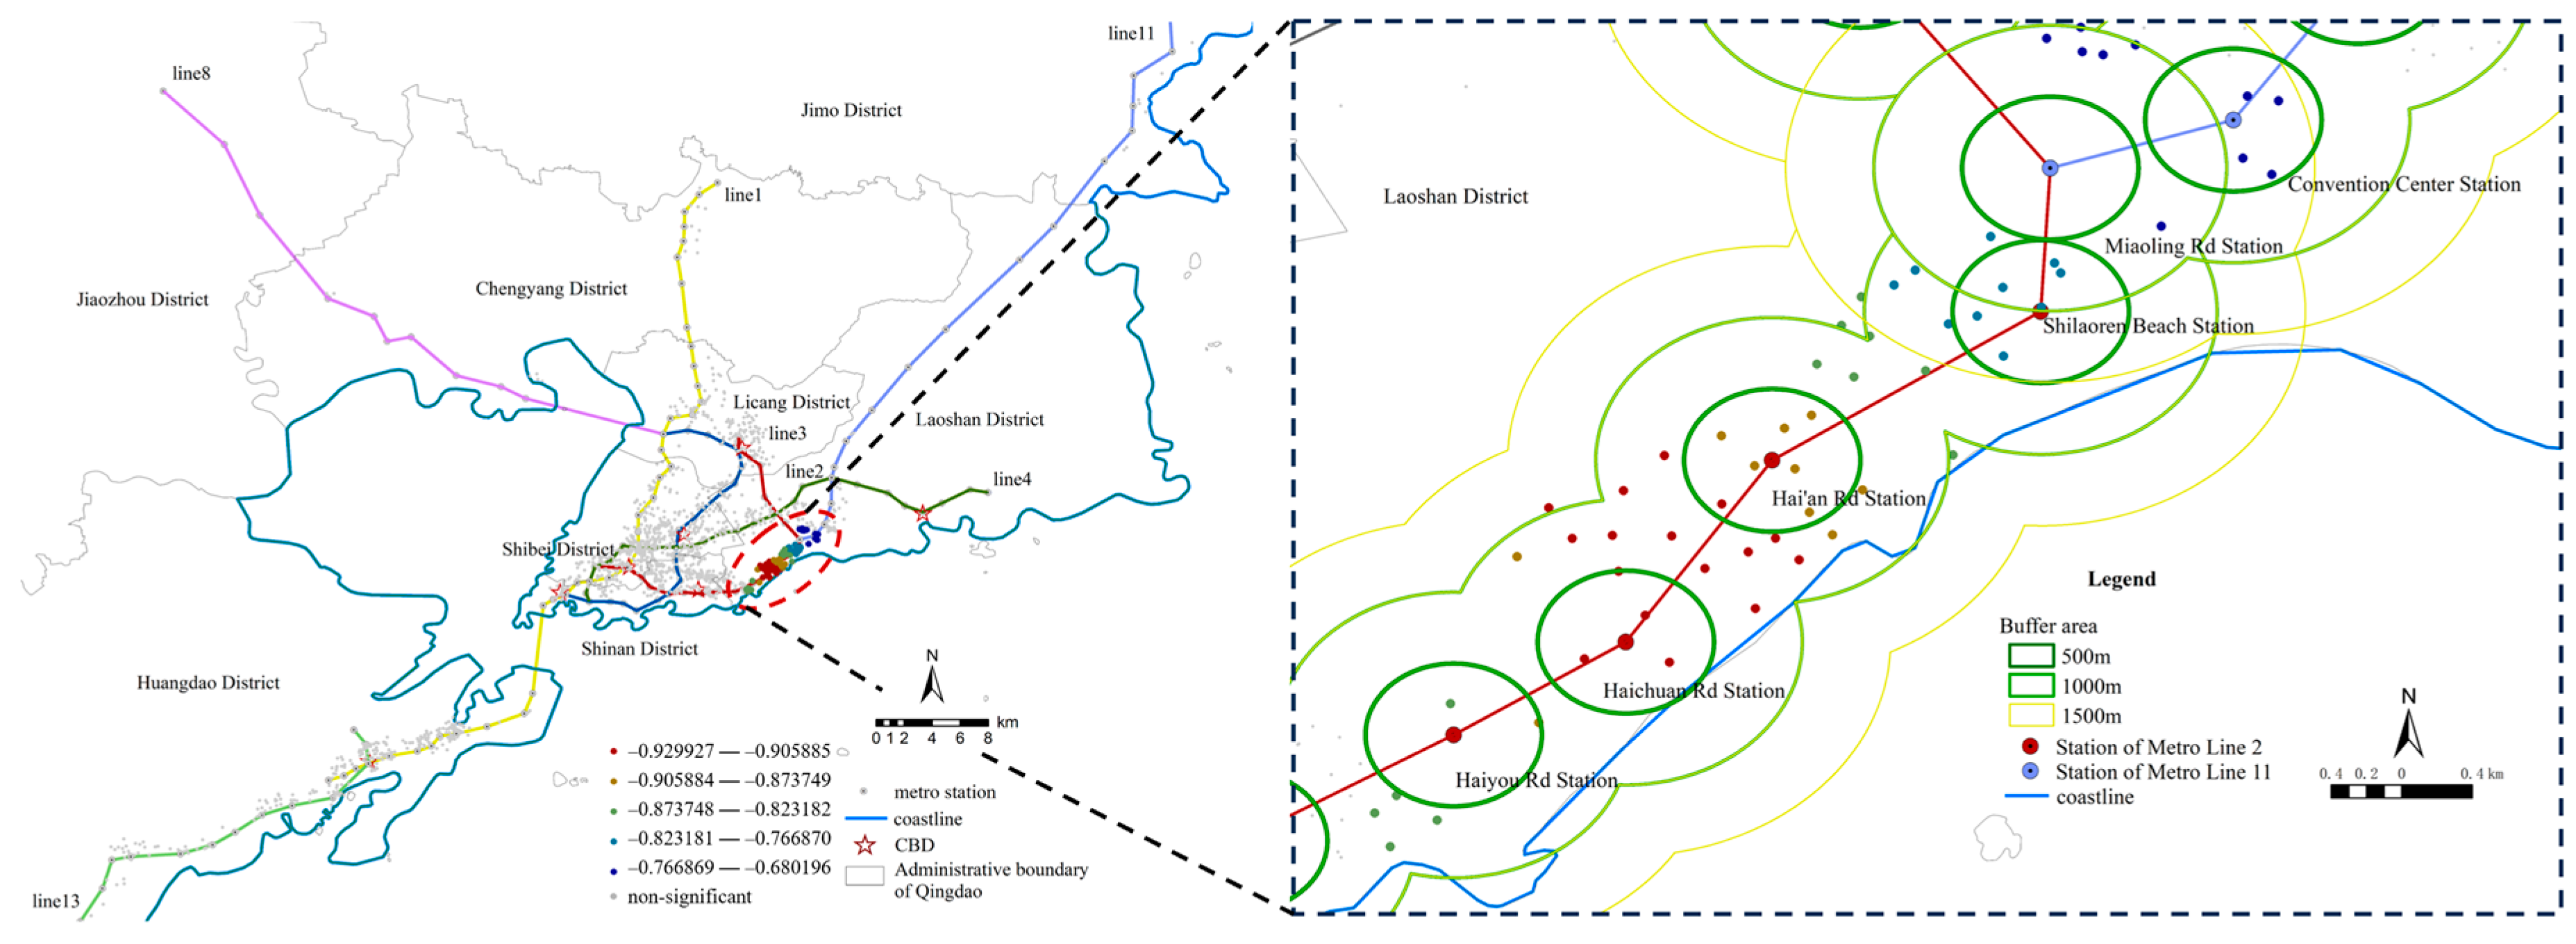
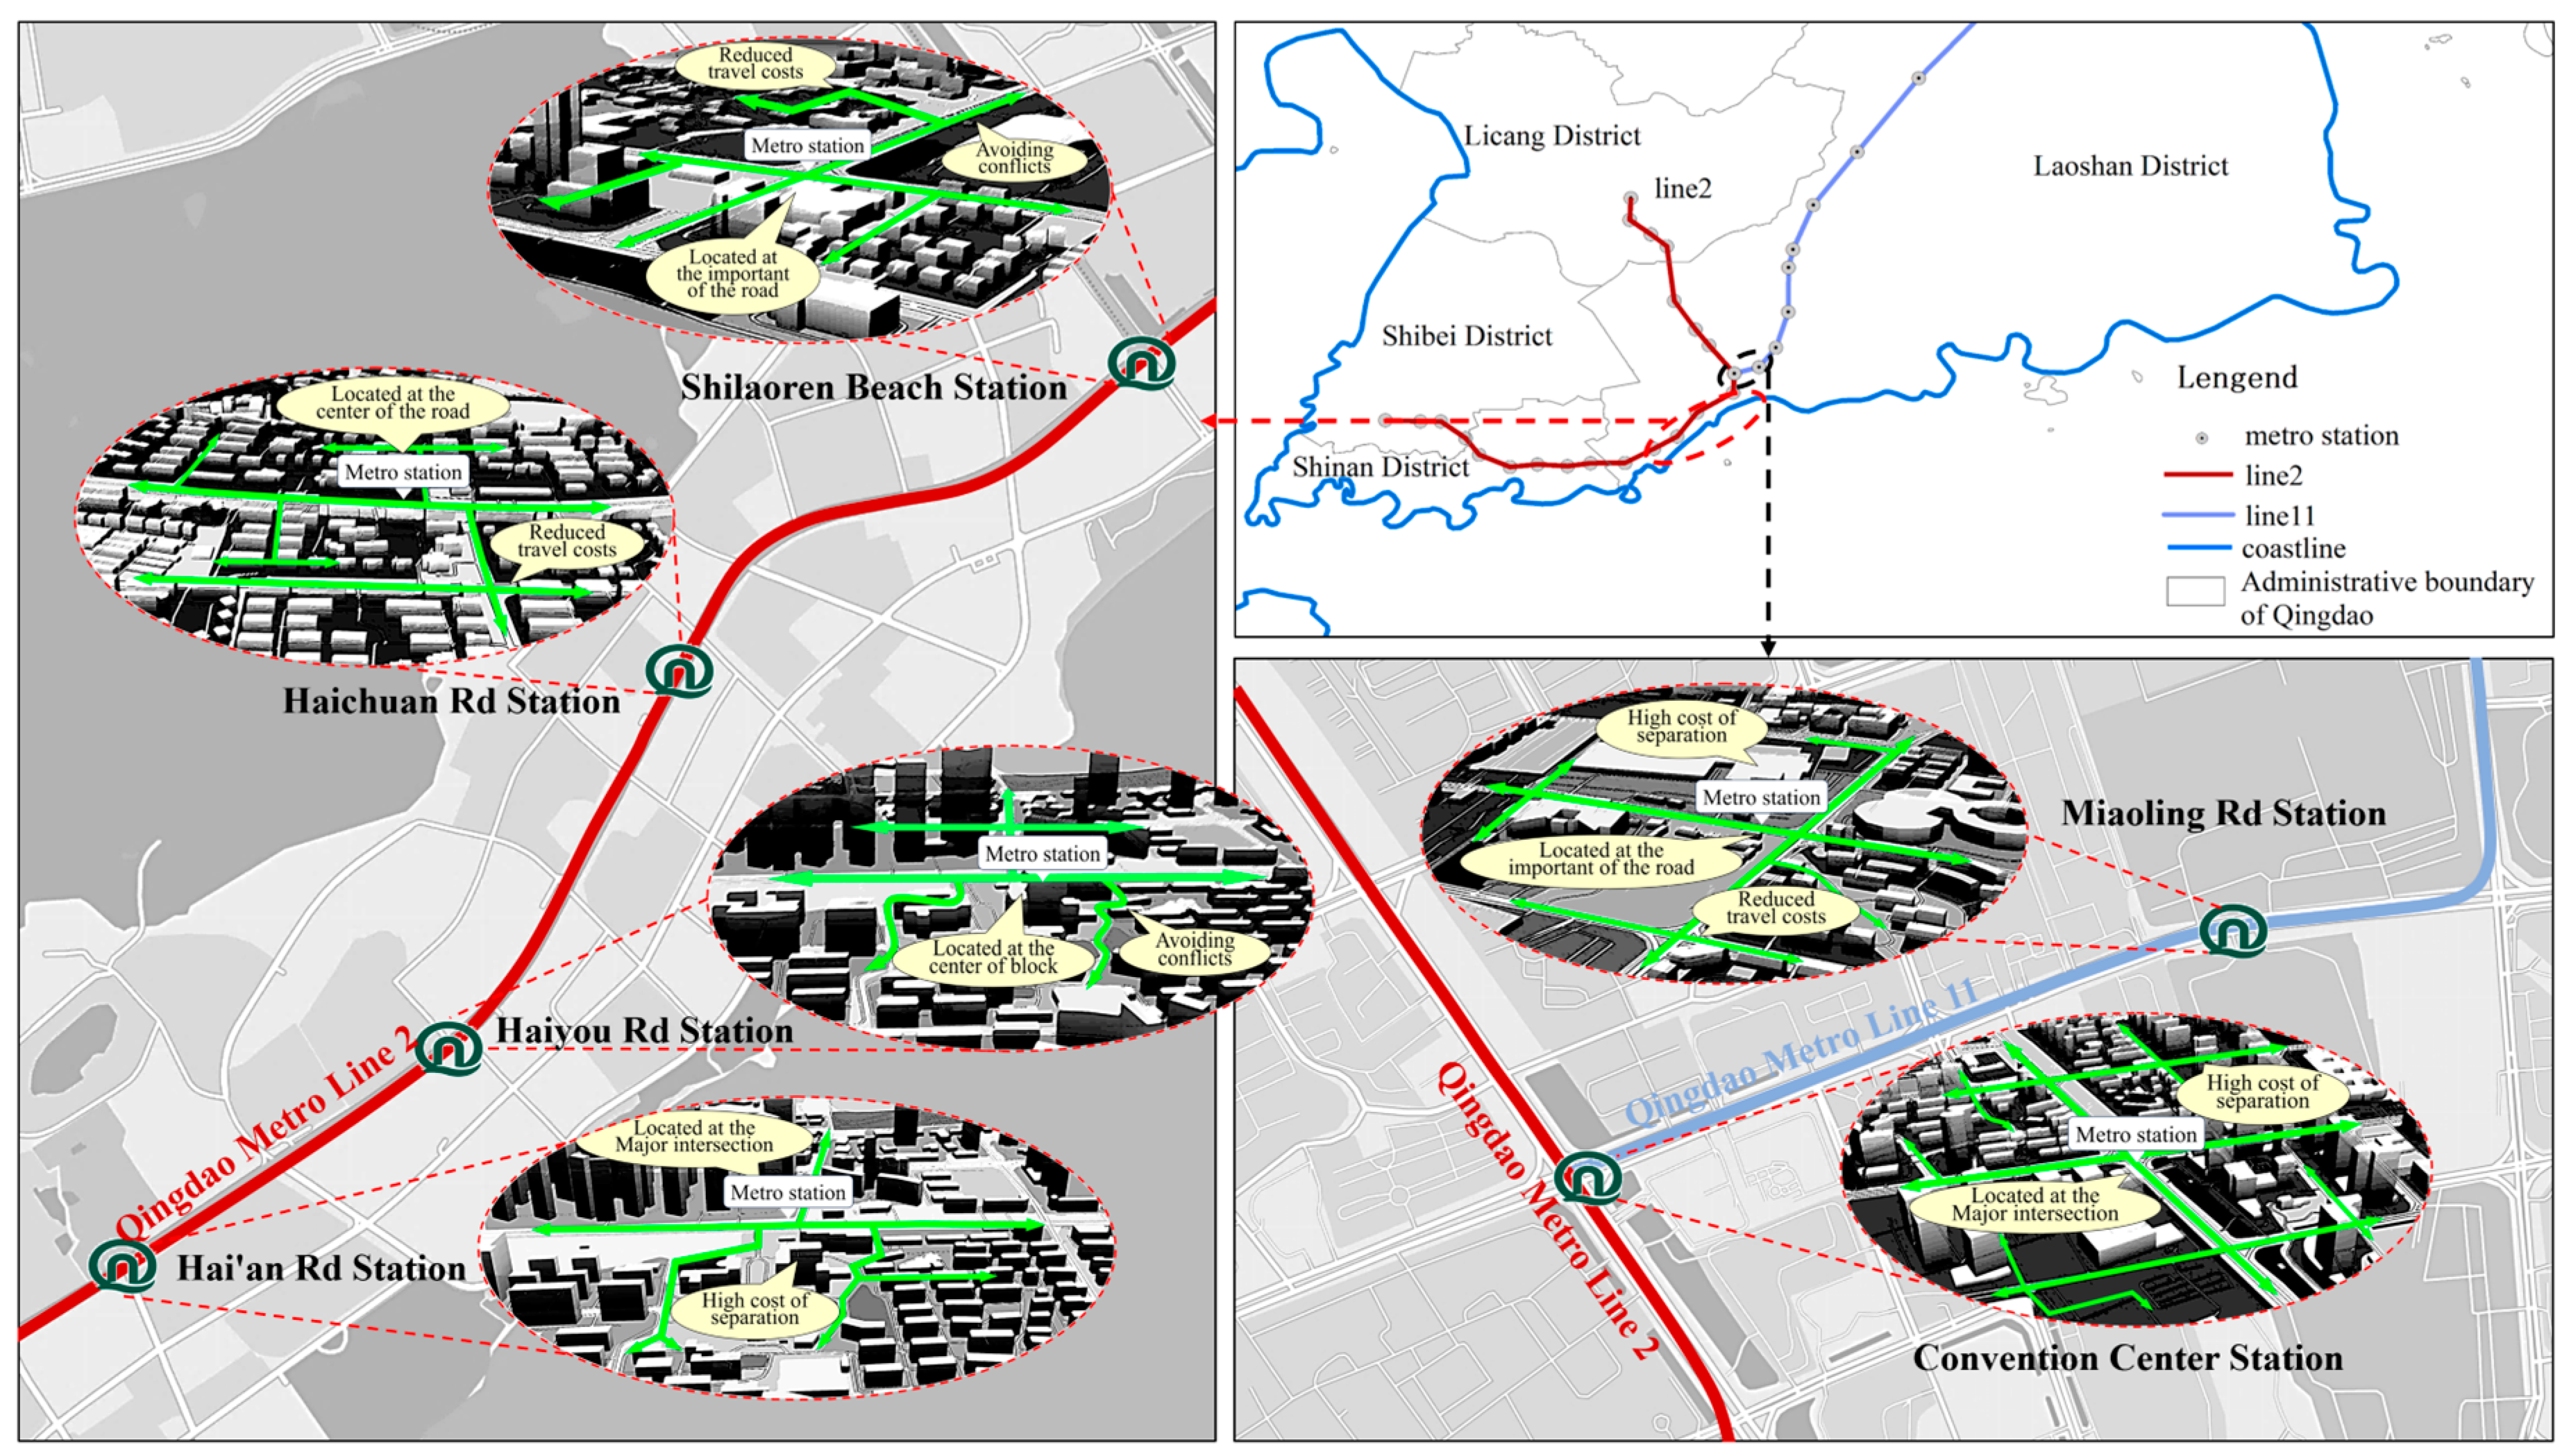
3.3.2. Analysis of Local Station Impact Areas by Urban Rail Transit

The current operational metro network layout of Qingdao City features a combination of “radial pattern and backbone lines”. Among them, Metro Line 3 serves as the structural main axis, running through the three core urban districts of Shinan, Shibei, and Licang, while Lines 1, 2, 4, 8, 11, and 13 extend in multiple directions radially. Based on the empirical research results of the urban rail transit lines that have been opened in Qingdao City, the lack of metro premium effect in other districts of Qingdao may be due to the structural contradiction between supply and demand of space. The non-core district stations are mostly located at the end of the lines, which makes it difficult for a single line to form a network effect. Some lines have not reached the break-even point. The land development intensity within 500 m of most lines’ stations is relatively weak. The lag in the promotion of Transit-Oriented Development (TOD) is caused by the constraints of the land development system. The current distribution of the increment revenue from rail transit in land sale proceeds is unbalanced.
The four stations of Qingdao Metro Line 2, namely Haiyou Road, Haichuan Road, Hai’an Road, and Shilaoren Beach Bathing Ground are surrounded by residential areas that have been affected by the combined effect of location value (Figure 5). Among them, the stations of Haiyou Road, Haichuan Road, and Hai’an Road are located in Laoshan District. The residential transaction data of this district shows that 72% of the properties priced above CNY 8 million are concentrated within a 1 km radius of the metro stations. The opening of urban rail transit has transformed the traditional coastal value into a dual location model of “sea view + rail transit”, which attracts high-income groups and tourists and reflects the housing appreciation effect of rail transit. The rail transit networked operation near Shilaoren Beach Bathing Ground Station has restructured the spatial accessibility. It not only alleviates the traffic congestion problem during the peak tourist season but also drives the economic development of the surrounding areas, thereby enhancing the overall image and competitiveness of the city. In addition, the innovative policy of land value recovery based on the land development strategy of rail transit-oriented development compensates for the funding gap of rail construction, further promoting the sustainable development of urban rail transit, and thereby significantly influencing and having a positive impact on the housing prices of this area in Qingdao.
The impact of the Miaoling Road Transfer Station on housing prices was greater than that of conventional stations, which is consistent with the research conclusions of scholars such as Fang Han and Varameth V [51,52]. The spatial value increment effect around the Miaoling Road station (Figure 6), which is the T-shaped transfer station of Metro Line 2 and Line 11, showed different characteristics in terms of the impact on housing prices compared to regular stations. Compared with the Convention Center station, the latter led to an increase in housing prices through the reconstruction of the transportation network and the concentration of urban functions. The “Measures for the Protection and Development of Land Resources along Metro Lines in Qingdao City” clearly includes the area around the Convention and Exhibition Center as a key development zone. Through policy tools such as floor area ratio transfer and public facility allocation rewards, it has achieved a balanced development of social and economic benefits. The housing prices around the Miaoling Road station and the Convention Center station showed a significant negative correlation. Essentially, this is the result of the synergy between the networked operation of the rail transit system and the reconfiguration of urban space. Through the polarizing effect of the transportation hub, the exhibition economy and financial business resources were activated. Based on the TOD model, the land was developed intensively, and through institutional innovation, a multi-party interest-sharing mechanism was constructed. This model provides an important reference value for the coordinated development of rail transit and housing in similar cities.

4. Discussion

Most scholars have utilized the MGWR model to analyze that urban rail transit is a significant cause of housing price fluctuations. However, all the studies have focused on urban housing prices and have not precisely analyzed the relationship between urban rail transit and housing prices along these lines. The innovation of this study lies in considering the marine resource factors in coastal areas and adding the variable of coastline distance. Based on the results of the impact of urban rail transit on housing prices, this study further analyzed the reasons and mechanisms behind this phenomenon from aspects such as social economy, history and culture, and urban planning. It compared with cities with similar rail transit development situations in Qingdao and provided practical implications. Moreover, it supplemented the relationship between the MGWR method and the HPM. The results of this study are basically consistent with those of Vichiensan V’s MGWR empirical research [53]. According to the research findings in Bangkok City, Thailand, the influence of urban rail transit and other factors on housing prices is local, while only the influence of the distance to shopping centers is global. The research results are related to Bangkok’s single central city structure. However, as Qingdao is a multi-centered city with a symbiotic relationship between mountains and sea, the research results of influencing factors are different from those of Bangkok. The influencing factors of housing prices in Qingdao all show local significance, and the urban rail transit factor only has a significant impact on residential prices in some areas.

4.1. Social and Economic Dimensions

From the perspective of social and economic dimensions, Laoshan District, as the core area on the eastern coast of Qingdao, exhibits spatial differentiation characteristics of the premium effect of urban rail transit. The housing prices around the stations of Haoyou Road, Haichuan Road, Hai’an Road, Shilaoren Beach Bathing Ground, Miaoling Road, and Convention and Exhibition Center are significantly more sensitive to urban rail transit than other areas. Laoshan District houses the International Convention and Exhibition Center with an annual passenger flow of 2 million people, a financial core area with a huge management asset scale, and 70% of the high-tech enterprises’ headquarters in the entire district. The employees and tourists in this area have significant characteristics of relying on rail transit, directly promoting the capitalization rate of housing prices around the stations. The monthly income of families in the significant areas of urban rail transit is generally higher than that in the northern part of Laoshan District, and the housing consumption of high-income groups is more sensitive to the quality of location.

4.2. Historical and Cultural Dimensions

From the perspective of historical and cultural analysis, the urban spatial structure of Qingdao has continued the characteristics of the German occupation period. There are 12 existing German-style historical buildings around Haiyou Road Station. The neoclassical architectural style of these buildings has been institutionalized through the “Planning for the Protection of Historical Urban Areas of Qingdao”. Colonial heritage has formed a unique location cultural capital, attracting high-income groups with cultural consumption preferences, and promoting the appreciation of housing prices around the station. The Shilaoren Beach Bathing Place relies on the national-level intangible cultural heritage. The height limit and floor area ratio control of the surrounding buildings have led to a scarcity premium for land, and the landscape premium effect has enhanced the accessibility of urban rail transit and thereby increased the housing value.

4.3. Urban Planning Dimension

From the perspective of urban planning, the commercial–office–residential land use around the Convention and Exhibition Center Station is arranged in a ring-shaped layout, which improves the balance between employment and residence for residents. The Miaoling Road Station, with its three-dimensional urban design, achieves a connection between underground commercial facilities and Jin Ding Square through a three-dimensional organization of space. This enables an improvement in the efficiency of capital circulation.
Regarding urban governance, Patrick Le Gales points out that metropolitan governance is not a linear process but rather a dynamic, incomplete, and highly diverse one [54]. The spatial differences identified through MGWR can not only be understood as the product of geographical location or structural factors, but also be regarded as a reflection of political fragmentation, planning ambiguity, and differentiated investment systems. The urban governance structure should shape urban order through policy coordination, public services, and infrastructure. The existing literature mostly focuses on the dynamics of social culture, but neglects the analysis of causes and mechanisms. Urban governance has a bidirectional relationship with inequality, and the existence of inequality in governance shaping the opportunity structure also affects policy implementation. Future research needs to construct an “ecology of governance” analytical framework, combining multi-level game, policy entrepreneur strategies with spatial political economy, and how to utilize planning ambiguity to achieve reallocation of interests or use social network analysis to quantify the power topology structure in policy coordination.

4.4. Suggestions

The empirical research conducted in Qingdao City indicates that the relationship between urban rail transit and housing prices is not merely a matter of traffic economics but also a test of urban governance capabilities. Transforming spatial premiums into sustainable development momentum holds significant reference value for spatial governance during China’s new urbanization process. The spatial heterogeneity phenomenon of the interaction between urban rail transit and housing prices in Qingdao City provides key ideas for other cities with similar urban rail transit systems, such as Ningbo, Dalian, and Xiamen in China, and cities like Busan in South Korea, Rio de Janeiro in Brazil, and Sydney in Australia. It also offers insights for addressing social spatial inequality issues caused by the polarization of housing values.
Risk-based regulation Borraz et al. revealed that the shaping of technological reputation not only depends on scientific authority but also requires active management of the cognitive expectations of complex audience networks [55,56]. Nyset et al. explored the concept of social innovation as a potential transformative factor in urban planning and local development. Compared with urban development models such as “Smart City” and “Creative City” that are oriented towards economy and technology, social innovation provides an alternative path. Its core lies in emphasizing the subjectivity of people and empowering local communities and citizens to actively participate in the transformation of urban environments. In response to today’s diverse urban problems, this multi-dimensional governance mechanism innovation not only concerns the realization of Qingdao’s goal of building a “modern international metropolis”, but also urgently requires the establishment of an institutional framework for the coordinated evolution of spatial planning, land finance, and public services to achieve the paradigm shift from “space production” to “space governance” in the development of rail transit [57]. Based on the above research theories, in order to achieve the mutual dependence and positive cycle of rail transit and urban sustainability, combined with the current situation of Qingdao, the following policy suggestions are proposed:
Firstly, based on international experience and in light of China’s actual situation, it is suggested that the government should establish a collaborative mechanism for multi-plan integration, deeply integrating urban rail transit planning with urban land use planning and industrial development planning. At the urban planning level, a “risk-space” dynamic mapping system should be established based on the topological structure of the rail transit network and land market data, constructing a “gentrification risk index” (GRI), incorporating core parameters such as housing affordability ratio, population replacement rate, and accessibility gradient of public services. During the urban rail transit planning stage, “social impact pre-assessment” (SIA) should be embedded, setting up early warning and intervention mechanisms, fully considering the characteristics and demands of each region and reasonably laying out public service facilities and transportation networks, designing counter-gentrification tools for the core area, spatial mismatch prevention tools for the periphery area, and cross-regional collaborative governance tools. In terms of housing development, by adjusting product positioning and development strategies in accordance with market demands and regional characteristics, we can leverage the locations of rail transit stations to create distinctive urban characteristic areas such as cultural districts, commercial centers, and ecological parks, aiming to enhance the attractiveness and competitiveness of the areas. We should focus on the areas surrounding rail transit hub stations. In terms of housing policies, differentiated housing supply policies should be implemented for different regions and different groups of home buyers. It is suggested to implement zoning regulation policies. In the areas with housing price gaps within the radiation range of rail transit, efforts should be made to increase the supply of small- and medium-sized housing units to meet the demand for housing purchase. In areas with high housing prices, land supply regulation and price-limiting policies should be adopted to stabilize market expectations. The purchase policies should be adjusted in a timely manner according to the operation of the housing market.
Secondly, we should vigorously promote the diversified development of the housing market and encourage the development of the rental housing market. By providing diverse rental housing products, we can further optimize the urban spatial structure and ensure the stable and healthy development of the housing market. This will also contribute to the realization of the goal of building a green and livable city. Policy makers and urban planners must comprehensively consider the transformation of communities around railway stations into social spaces in order to enhance the positive impacts and mitigate the possible negative externalities [58].
Finally, to establish a smart city governance system oriented towards urban rail transit, it is suggested to focus on promoting the technological integration of spatial planning and digital governance, as well as the synergy between government guidance and market mechanism operation. Specific measures include formulating guidelines for the classification and development of rail transit stations and implementing differentiated policies such as differential floor area ratio incentives and functional mix requirements. Developers are required to build no less than 15% affordable housing or contribute to the “social housing fund” at a rate proportional to the premium on high-priced land in core areas. The “community commercial protection zone” around rail transit stations is delineated, and rent control is implemented for traditional brands and convenience service industries.

5. Conclusions

This study takes the residential areas along the metro lines that have been opened in Qingdao City as the research object to explore the spatial effect of rail transit on housing prices and the key influencing factors. The empirical analysis results show the following: ① The housing prices in Qingdao City present a double-core distribution, with the peak values located in Shinan District and the western part of Laoshan District. The housing prices show a significant positive correlation in space, further confirming that the distribution of housing prices is significantly influenced by spatial factors. ② We selected the indicators of housing price influencing factors from three aspects: location, neighborhood, and structural characteristics, and innovatively added a new variable of coastline based on the regional characteristics of Qingdao. Comparing the fitting effects of three models, OLS, GWR, and MGWR, it was found that the MGWR model can more accurately capture the non-stationarity and heterogeneity of geographical spatial data, and has the best fitting degree, providing more reliable and precise analytical results. ③ The MGWR model reveals the differences in the impact of the same influencing factor on housing prices in different urban spaces. Total floors, building area, green coverage rate, property management fees, hospital, and park distances all have spatial heterogeneity and different spatial influence scales on housing prices. The urban rail transit factor only has significant effects on the housing prices in some areas and has strong spatial heterogeneity.
Although MGWR significantly improves the model accuracy by introducing the multi-dimensional deconstruction ability of spatial heterogeneity (such as adaptive adjustment of bandwidth parameters and variable-specific spatial scale identification), the HPM still has irreplaceable theoretical and practical value in analyzing the environmental mechanism of urban value formation. Barbot and Perico’s research on Milan shows that even with sparse and incomplete data, the HPM can reveal profound insights into the internal social structure, residential choices, and price differences in cities [59]. This study determines the driving factors of housing prices based on HPM and links it with the spatial effect of MGWR, thereby achieving a multi-level analysis of the influencing mechanism of housing prices.In the analysis of rail transit premium, the significant variables are first screened by the HPM, and then MGWR is used to reveal the spatial effect attenuation laws of these factors. This “theory-driven–data-validated” approach can avoid the overfitting risk of pure data-driven models and break through the limitations of traditional hedonic models in spatial homogeneity, providing a more resilient analytical tool for urban spatial governance. MGWR helps identify the local differences in policy effects by revealing regional heterogeneity, thereby enhancing the precision of policy formulation. It relies on the technical data science teams and computing resources of the government, but the institutions responsible for policy implementation lack the ability to interpret complex spatial models, which may lead to the simplification of results and the concealment of key existing problems. Traditional policy evaluation mainly relies on OLS global models, while MGWR requires decision-makers to accept the “one policy for one place” logic, which may encounter resistance from the bureaucratic system. The “multi-plan integration and coordination mechanism” in China can address the existing limitations and provide an institutional basis for spatial heterogeneity analysis. The core value of MGWR does not lie in the universal interpretation of policy effects, but in exposing the spatial heterogeneity forms of institutional constraints, and transforming the governance system towards precise governance. In the future, it is necessary to further develop institutional-spatial coupling models to capture the complex geographical interweaving of formal rules and informal conventions. This will make more persuasive contributions to discussions on issues such as bus-oriented development, spatial justice, and data-driven urban governance.
Due to the spatial heterogeneity of urban rail transit factors on housing prices, the appropriate timing for capturing their value should be considered comprehensively based on the degree and benefits of the impact. This study does not consider the long-term impact of urban rail transit on housing prices. In the future, we will further explore the specific impacts of the metro on housing prices in different historical periods (such as the planning period, construction period, and operation period of the metro) to provide a more scientific basis for the healthy development of urban rail transit planning and the housing market.

Author Contributions

Conceptualization, Y.W. (Yanjun Wang) and Z.L.; methodology, Z.L.; software, Z.L.; validation, P.D., Y.W. (Yanjun Wang) and Z.L.; formal analysis, Y.W. (Yanjun Wang); investigation, Y.W. (Yawen Wang); resources, Z.L.; data curation, Z.L.; writing—original draft preparation, Y.W. (Yanjun Wang) and Z.L.; writing—review and editing, P.D.; visualization, Z.L.; supervision, Y.W. (Yanjun Wang); funding acquisition, Y.W. (Yanjun Wang). All authors have read and agreed to the published version of the manuscript.

Funding

This research was funded by [The Qingdao Philosophy and Social Science Planning Project.] grant number [QDSKL2101111, QDSKL2401104].

Institutional Review Board Statement

Not applicable.

Informed Consent Statement

Not applicable.

Data Availability Statement

No new datasets were created for this study.

Conflicts of Interest

The authors declare no conflict of interest.

References

  1. Tang, W.; Xiao, Q.; Yan, H.; Chen, Y. Spatial Differentiation of Residential Rents along Urban Rail Transit: The Case of Metro Line 1, Line 2 and Line 4 in Changsha. Econ. Geogr. 2021, 41, 100–108. [Google Scholar]
  2. Bajic, V. The Effects of a New Subway Line on Housing Prices in Metropolitan Toronto. Urban Stud. 1983, 20, 147–158. [Google Scholar] [CrossRef]
  3. Pan, H.; Wei, C.; Shi, C. Difference Analysis of Rail Traffic Accessibility Effect Housing Price: Shanghai Center City Example. Planners 2016, 32, 203–208+214. [Google Scholar]
  4. Cui, X.; Yu, B.; Yang, L.; Fang, H. Spatio-temporal Characteristics and Non-linear Influencing Factors of Urban Rail Transit: The Case of Chengdu Using the Gradient Boosting Decision Tree. Econ. Geogr. 2021, 41, 61–72. [Google Scholar]
  5. Daluwatte, S.; Ando, A. Transportation and regional agglomeration in Japan: Through a long-term simulation model 1920–85. J. Adv. Transp. 1995, 29, 213–233. [Google Scholar] [CrossRef]
  6. Wang, X.; Zhu, D.; Zhang, M. Analysis of the influence of rail transit on the distribution layout of real estate prices: A case study of Beijing light rail line No.13. Urban Probl. 2004, 6, 39–42. [Google Scholar]
  7. Liu, G.; Peng, Y. An analysis on the impacts of urban rail traffic on real estate: Exemplified by Chongqing. Urban Probl. 2007, 1, 65–69. [Google Scholar]
  8. Cervero, R. Rail Transit and Joint Development: Land Market Impacts in Washington D.C. and Atlanta. J. Am. Plan. Assoc. 1994, 60, 83–94. [Google Scholar] [CrossRef]
  9. Guo, L.; Lin, S.; Zhang, G. Impact Mechanism of Shanghai Rail Transit on Housing Price and Planning Enlightenment. Urban Rail Transit Res. 2023, 26, 166–173. [Google Scholar]
  10. Welch, T.F.; Gehrke, S.R.; Wang, F. Long-term Impact of Network Access to Bike Facilities and Public Transit Stations on Housing Sales Prices in Portland, Oregon. J. Transp. Geogr. 2016, 54, 264–272. [Google Scholar] [CrossRef]
  11. Fan, Z.; Zhang, H.; Chen, J. The Spillover Effects and Siphon Effects of Public Transportation on Housing Market: A Case Study of Metro. China Ind. Econ. 2018, 5, 99–117. [Google Scholar]
  12. Henneberry, J. Transport Investment and House Prices. J. Prop. Valuat. Invest. 1998, 16, 144–158. [Google Scholar] [CrossRef]
  13. Lieske, S.N.; van den Nouwelant, R.; Han, J.H.; Pettit, C. A Novel Hedonic Price Modelling Approach for Estimating the Impact of Transportation Infrastructure on Property Prices. Urban Stud. 2019, 58, 182–202. [Google Scholar] [CrossRef]
  14. Pan, Q. The Impacts of an Urban Light Rail System on Residential Property Values: A Case Study of the Houston Metro Rail Transit Line. Transp. Plan. Technol. 2013, 36, 145–169. [Google Scholar] [CrossRef]
  15. Wagner, G.A.; Komarek, T.; Martin, J. Is the Light Rail “Tide” Lifting Property Values? Evidence from Hampton Roads, VA. Reg. Sci. Urban Econ. 2017, 65, 25–37. [Google Scholar] [CrossRef]
  16. Lee, R.; Sener, I.N. The Effect of Light Rail Transit on Land-use Development in a City Without Zoning. J. Transp. Land Use 2017, 10, 541–556. [Google Scholar] [CrossRef]
  17. Lee, D.B., Jr.; Averous, C.P. Land use and transportation: Basic theory. Environ. Plan. A 1973, 5, 491–502. [Google Scholar] [CrossRef]
  18. Nelson, A.C. Effects of elevated heavy-rail transit stations on house prices with respect to neighborhood income. Transp. Res. Rec. 1992, 1395, 127–132. [Google Scholar]
  19. Landis, J.; Guhathakurta, S.; Huang, W.; Zhang, M.; Fukuji, B. Rail Transit Investments, Real Estate Values, and Land Use Change: A Comparative Analysis of Five California Rail Transit Systems; University of California Transportation Center: Oakland, CA, USA, 1995. [Google Scholar]
  20. Ransom, M.R. The Effect of Light Rail Transit Service on Nearby Property Values: Quasi-experimental Evidence from Seattle. J. Transp. Land Use 2018, 11, 387–404. [Google Scholar] [CrossRef]
  21. Berawi, M.A.; Miraj, P.; Saroji, G.; Sari, M. Impact of Rail Transit Station Proximity to Commercial Property Prices: Utilizing Big Data in Urban Real Estate. J. Big Data 2020, 7, 71. [Google Scholar] [CrossRef]
  22. Lancaster, K.J. A New Approach to Consumer Theory. J. Political Econ. 1966, 74, 132–157. [Google Scholar] [CrossRef]
  23. Rosen, S. Hedonic Prices and Implicit Markets: Product Differentiation in Pure Competition. J. Political Econ. 1974, 82, 34–55. [Google Scholar] [CrossRef]
  24. Neto, E.S.V.; Pereira, R.H.M.; de Oliveira Trindade, A.G. Property Value Assessment in Rio de Janeiro: The Effects of Transport Investments; Fundação Getulio Vargas (FGV): Rio de Janeiro, Brazil; Institute for Applied Economic Research (IPEA): Brasília, Brazil, 2019. [Google Scholar]
  25. Cao, K.; Diao, M.; Wu, B. A Big Data-Based Geographically Weighted Regression Model for Public Housing Prices: A Case Study in Singapore. Ann. Am. Assoc. Geogr. 2019, 109, 173–186. [Google Scholar] [CrossRef]
  26. Oliveira, Y.R.A. Subway Station Effects on Housing Prices: Evidence From São Paulo; Fundação Getulio Vargas: Brasilia, Brazil, 2023. [Google Scholar]
  27. Dziauddin, M.F. Estimating land value uplift around light rail transit stations in Greater Kuala Lumpur: An empirical study based on geographically weighted regression (GWR). Res. Transp. Econ. 2019, 74, 10–20. [Google Scholar] [CrossRef]
  28. Malaitham, S.; Fukuda, A.; Vichiensan, V.; Wasuntarasook, V. Hedonic pricing model of assessed and market land values: A case study in Bangkok metropolitan area, Thailand. Case Stud. Transp. Policy 2020, 8, 153–162. [Google Scholar] [CrossRef]
  29. Vichiensan, V.; Miyamoto, K. Influence of Urban Rail Transit on House Value: Spatial Hedonic Analysis in Bangkok. East. Asia Soc. Transp. Stud. 2010, 8, 986–996. [Google Scholar]
  30. Brunsdon, C.; Fotheringham, A.S.; Charlton, M. Geographically Weighted Regression. J. R. Stat. Soc. Ser. D (Stat.) 1998, 47, 431–443. [Google Scholar] [CrossRef]
  31. McMillen, D.P. Geographically Weighted Regression: The Analysis of Spatially Varying Relationships. Am. J. Agric. Econ. 2004, 86, 554–556. [Google Scholar] [CrossRef]
  32. Fotheringham, A.S.; Yang, W.; Kang, W. Multiscale Geographically Weighted Regression (MGWR). Ann. Am. Assoc. Geogr. 2017, 107, 1247–1265. [Google Scholar] [CrossRef]
  33. Wu, C.; Ren, F.; Hu, W.; Du, Q. Multiscale Geographically and Temporally Weighted Regression: Exploring the Spatiotemporal Determinants of Housing Prices. Int. J. Geogr. Inf. Sci. 2019, 33, 489–511. [Google Scholar] [CrossRef]
  34. Shen, T.; Yu, H.; Zhou, L.; Gu, H.; He, H. On Hedonic Price of Second-Hand Houses in Beijing Based on Multiscale Geographically Weighted Regression: Scale Law of Spatial Heterogeneity. Econ. Geogr. 2020, 40, 75–83. [Google Scholar]
  35. Hong, I.; Yoo, C. Analyzing Spatial Variance of Airbnb Pricing Determinants Using Multiscale GWR Approach. Sustainability 2020, 12, 4710. [Google Scholar] [CrossRef]
  36. Jia, J.; Zhang, X.; Huang, C.; Luan, H. Multiscale Analysis of Human Social Sensing of Urban Appearance and its Effects on House Price Appreciation in Wuhan, China. Sustain. Cities Soc. 2022, 81, 103844. [Google Scholar] [CrossRef]
  37. Lu, B.; Ge, Y.; Shi, Y.; Zheng, J.; Harris, P. Uncovering Drivers of Community-level House Price Dynamics through Multiscale Geographically Weighted Regression: A Case Study of Wuhan, China. Spat. Stat. 2023, 53, 100723. [Google Scholar] [CrossRef]
  38. Wu, C.; Liu, P.; Nie, K. Analyzing Multiscale Spatial Relationships between Housing Prices and Influencing Factors in Nanjing. Mod. Urban Res. 2021, 4, 93–98. [Google Scholar]
  39. Peng, Y.; Yang, L. Nonlinear Relationship Between Metro and Housing Price from the Perspective of Residents’ Activity Space Remodeling. Trop. Geogr. 2024, 44, 951–960. [Google Scholar]
  40. Huang, C.; Wang, X.; Li, L. Temporal and Spatial Effects of Urban Rail Transit on Housing Prices along the Line: A Case Study of Fuzhou Metro Line 1. Geogr. Res. 2021, 40, 2808–2822. [Google Scholar]
  41. Gao, X.; Chu, H.; Mao, Y. Study on the Temporal and Spatial Effects of Rail Transit on Housing Prices: A Case Study of Nanjing Metro Line 3. Price Theory Pract. 2020, 10, 151–154. [Google Scholar]
  42. Qiang, H.; Wang, H.; Lei, S. Analysis on Spatial Differentiation Characteristics and Influencing Factors of Housing Prices in Metropolis Based on MGWR Model: A Case Study of the Main Urban Area of Nanjing. Mod. Urban Res. 2024, 4, 109–116. [Google Scholar]
  43. Wang, X.; Hu, J.; Qiu, B. The Impact of Public Service Facilities on Housing Prices from the Perspective of Spatiotemporal Accessibility: A Study Based on Multiscale Geographically Weighted Regression Model (MGWR). Mod. Urban Res. 2024, 10, 116–122. [Google Scholar]
  44. Mei, Z.; Xu, S.; Ouyang, J.; Liu, J. Temporal and Spatial Effects of Guangzhou Metro Line 3 on Surrounding Housing Prices. Sci. Geogr. 2011, 31, 836–842. [Google Scholar]
  45. Li, Y.; Dai, T.; Zhu, D.; Qi, Y. Study on the Impact of Metro Construction and Operation on Housing Price and Rent Differentiation along the Line: Taking Nanjing Metro Line S6 as an Example. Price Theory Pract. 2022, 10, 204–210. [Google Scholar]
  46. Jin, D.; Hoagland, P.; Au, D.K.; Qiu, J. Shoreline Change, Seawalls, and Coastal Property Values. Ocean Coast. Manag. 2015, 114, 185–193. [Google Scholar] [CrossRef]
  47. Ayoola, A.B.; Oladapo, A.R.; Ojo, B.; Oyetunji, A.K. Modelling Coastal Externalities Effects on Residential Housing Values. Int. J. Hous. Mark. Anal. 2022, 16, 1193–1210. [Google Scholar] [CrossRef]
  48. Kim, J.; Yoon, S.; Yang, E.; Thapa, B. Valuing Recreational Beaches: A Spatial Hedonic Pricing Approach. Coast. Manag. 2020, 48, 118–141. [Google Scholar] [CrossRef]
  49. Allmendinger, P.; Haughton, G.; Knieling, J.; Othengrafen, F. Soft Spaces in Europe: Re-Negotiating Governance, Boundaries and Borders; Routledge: Oxon, UK, 2015. [Google Scholar]
  50. Rui, J.; Othengrafen, F. Examining the role of innovative streets in enhancing urban mobility and livability for sustainable urban transition: A review. Sustainability 2023, 15, 5709. [Google Scholar] [CrossRef]
  51. Fang, H.; Shen, Z.; Yang, L.; Liang, Y. Impact of Different Types of Metro Stations on Housing Prices: A Case Study of Chengdu. J. West. Hum. Settl. Environ. 2022, 37, 117–124. [Google Scholar]
  52. Vichiensan, V.; Wasuntarasook, V.; Prakayaphun, T.; Kii, M.; Hayashi, Y. Influence of Urban Railway Network Centrality on Residential Property Values in Bangkok. Sustainability 2023, 15, 16013. [Google Scholar] [CrossRef]
  53. Vichiensan, V.; Wasuntarasook, V.; Hayashi, Y.; Kii, M.; Prakayaphun, T. Urban Rail Transit in Bangkok: Chronological Development Review and Impact on Residential Property Value. Sustainability 2022, 14, 284. [Google Scholar] [CrossRef]
  54. Le Galès, P.; Vitale, T. Governing the Large Metropolis. A Research Agenda; hal-01070523; Sciences Po.: Paris, France, 2013. [Google Scholar]
  55. Borraz, O.; Beaussier, A.L.; Wesseling, M.; Demeritt, D.; Rothstein, H.; Hermans, M.; Huber, M.; Paul, R. Why regulators assess risk differently: Regulatory style, business organization, and the varied practice of risk-based food safety inspections across the EU. Regul. Gov. 2022, 16, 274–292. [Google Scholar] [CrossRef]
  56. Demortain, D.; Borraz, O. Managing technical reputation: Regulatory agencies and evidential work in risk assessment. Public Adm. 2022, 100, 394–407. [Google Scholar] [CrossRef]
  57. Nyseth, T.; Hamdouch, A. The transformative power of social innovation in urban planning and local development. Urban Plan. 2019, 4, 1–6. [Google Scholar] [CrossRef]
  58. Wang, Y.; Yue, X.; Wang, M.; Huang, G. Identifying the spatial heterogeneity of housing financialization in China: Insights from a multiscale geographically weighted Regression. Heliyon 2024, 10, e27542. [Google Scholar] [CrossRef] [PubMed]
  59. Percoco, M.; Barbot, M. Real Estate Markets and Rental Contracts in the Modern Age: Milan, 1570–1670; European Real Estate Society (ERES): Amsterdam, The Netherlands, 2010. [Google Scholar]
Figure 1. Distribution of housing prices along the metro lines within the study area.
Sustainability 17 04203 g001
Figure 2. MGWR residual spatial autocorrelation report.
Sustainability 17 04203 g002
Figure 3. Spatial distribution of regression coefficients of influencing factors affecting model structure characteristics based on MGWR.
Sustainability 17 04203 g003
Figure 4. Spatial distribution of regression coefficients of influencing factors of neighborhood characteristics based on MGWR.
Sustainability 17 04203 g004
Figure 5. Spatial distribution of regression coefficients for distance factors of metro stations based on MGWR.
Sustainability 17 04203 g005
Figure 6. The regional analysis map of the significant areas of the regression coefficient for urban rail transit.
Sustainability 17 04203 g006
Table 1. Information on independent variables of the feature price model.
Variable TypeCategorical VariableMeaning of VariablesUnits of Variables
Location characteristicsDistance CBDDistance to the nearest CBDmeter
Distance metroDistance to the nearest metro stationmeter
Distance coastlineDistance to the nearest coastlinemeter
Neighborhood characteristicsNear hospitalThe distance to the nearest hospital (a tertiary-level hospital)meter
Near schoolThe distance to the nearest schoolmeter
Near shopThe distance to the nearest shopping mallmeter
Near parkThe distance to the nearest parkmeter
Structural characteristicsBuilding areaBuilding areasquare meter
DecorationDegree of decoration (whether it is fully furnished or not)1 or 0
Floor levelThe floor level (low, middle, and high floor)score
Total floorsTotal number of floors of the buildinglayer
YearsYear of initial establishmentyear
Green coverage rateGreen coverage ratepercentage
Plot ratioPlot ratiodecimal fraction
Property management feeProperty management feePer square meter
Table 2. Global Moran’s I results.
Moran’s I Index0.254544
Expected index−0.000794
Variance0.000392
Z-score12.892849
p-value0.000000
Table 3. Global coefficients of the OLS.
VariableEst.SEtp-ValueVIF
Intercept−0.000 −0.0001.000
Distance metro0.2460.0435.7180.0004.024
Near hospital−0.7610.044−17.3910.0004.169
Near park0.1350.0304.5590.0001.902
Building area0.4210.02317.9270.0001.203
Total floors−0.2370.025−9.3020.0001.416
Property management fee0.2070.0267.9710.0001.463
Green coverage rate0.0820.0223.7170.0001.071
Table 4. Comparison of results among OLS, GWR, and MGWR.
ModelOLSGWRMGWR
Residual sum of squares723.992286.847290.952
Log-likelihood−1438.788−855.515−864.465
AIC2893.5772151.4742033.694
AICc2895.7212245.2732075.935
R20.4250.7720.769
Adj.R20.4220.7240.738
Table 5. Summary table of bandwidth and local coefficients of MGWR.
VariablesMeanStandard DeviationMinimumMedianMaximumBandwidthp-Value ≤ 0.05 (%)
Intercept0.1500.225−0.2430.1790.61326811.59
Building area0.3100.1070.1230.2890.53518899.13
Total floors−0.1080.184−0.894−0.0880.2129840.00
Green coverage rate0.0830.065−0.1100.1010.24825861.59
Property management fee0.1170.109−0.1750.1090.39114241.27
Distance metro−0.2620.342−0.930−0.3240.31237316.11
Near hospital−0.3620.951−3.954−0.3031.5134437.14
Near park−0.0130.182−0.391−0.0190.4733499.44
Disclaimer/Publisher’s Note: The statements, opinions and data contained in all publications are solely those of the individual author(s) and contributor(s) and not of MDPI and/or the editor(s). MDPI and/or the editor(s) disclaim responsibility for any injury to people or property resulting from any ideas, methods, instructions or products referred to in the content.

