


Pursuing Ecological and Social Co-Benefits: Public Hierarchical Willingness for Biodiversity Conservation in Urban Parks


Abstract
:1. Introduction
2. Methods
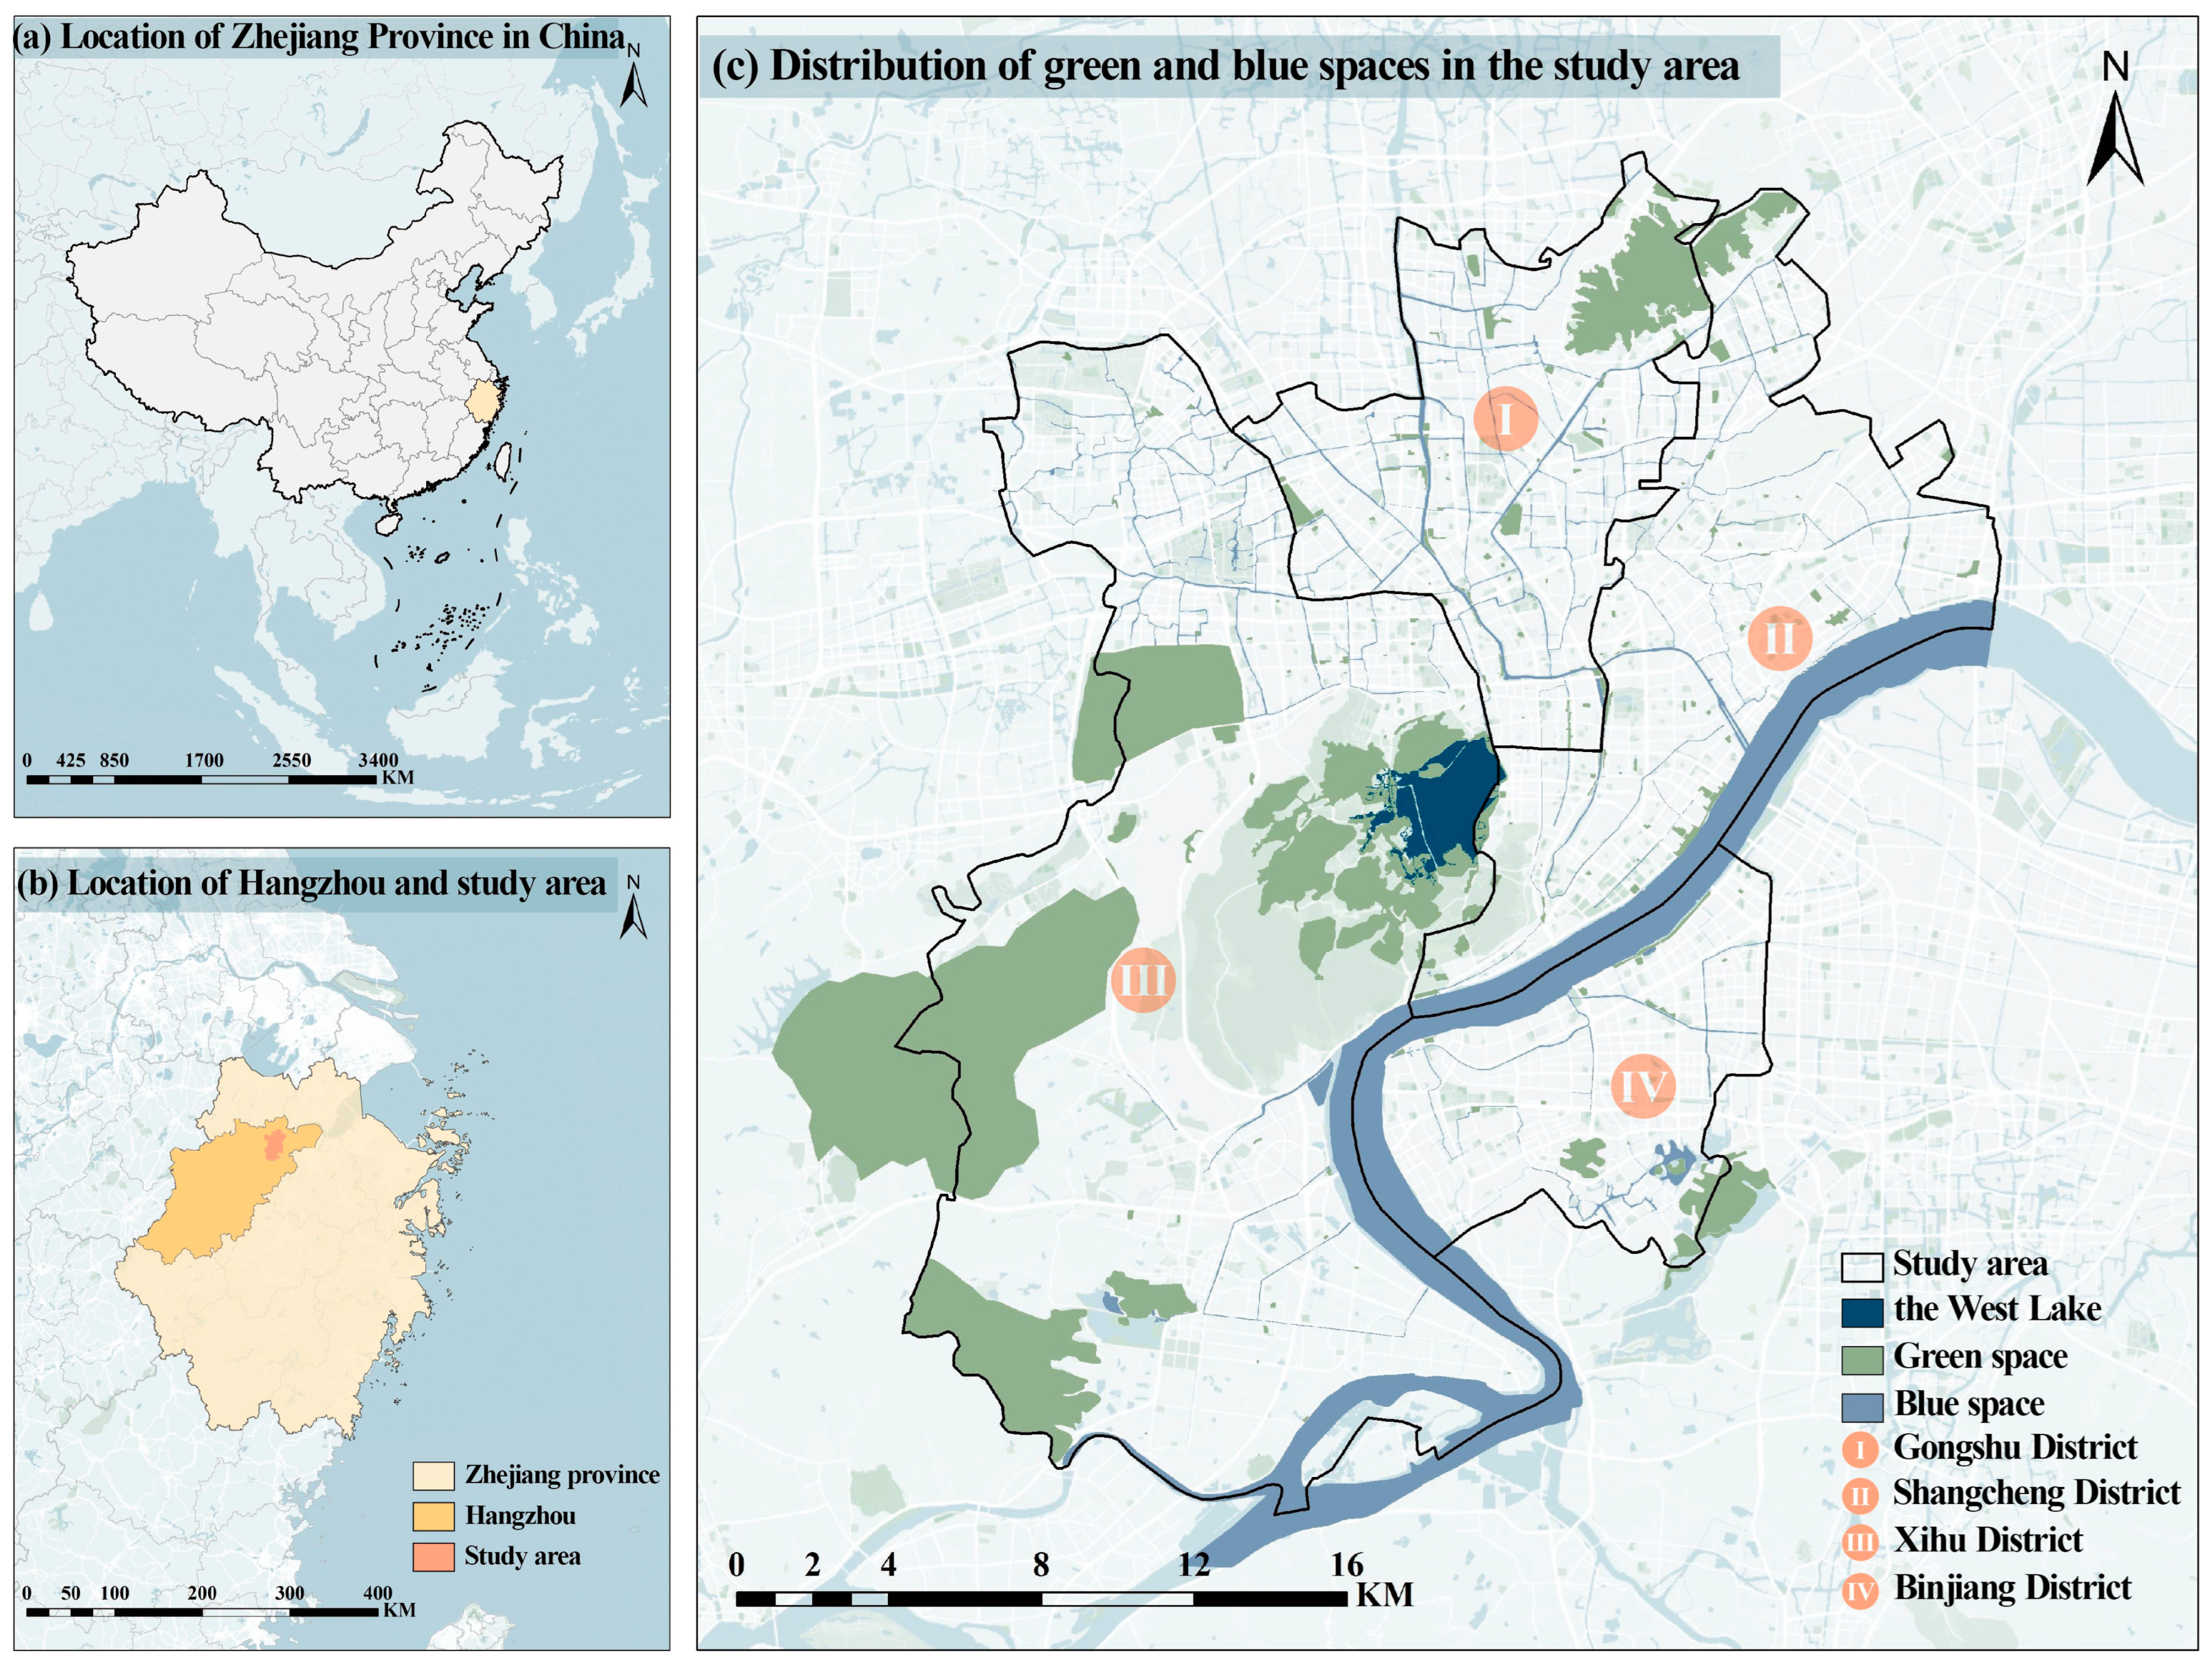
2.1. Study Area
2.2. Data Collection
2.3. Data Analysis
2.3.1. Analysis of Variance (ANOVA)
2.3.2. Generalized Linear Model (GLM) with Stepwise Regression Analysis
2.3.3. Non-Metric Multidimensional Scale (NMDS) Analysis
3. Results
3.1. Effects of the Respondent Characteristics
3.1.1. Descriptive Characteristics of the Respondents
3.1.2. Individual Effects of the Respondent Characteristics
- (1)
- Sex Effects
- (2)
- Age Effects
- (3)
- Influence of Education Level
3.1.3. Combined Effects of the Respondent Characteristics
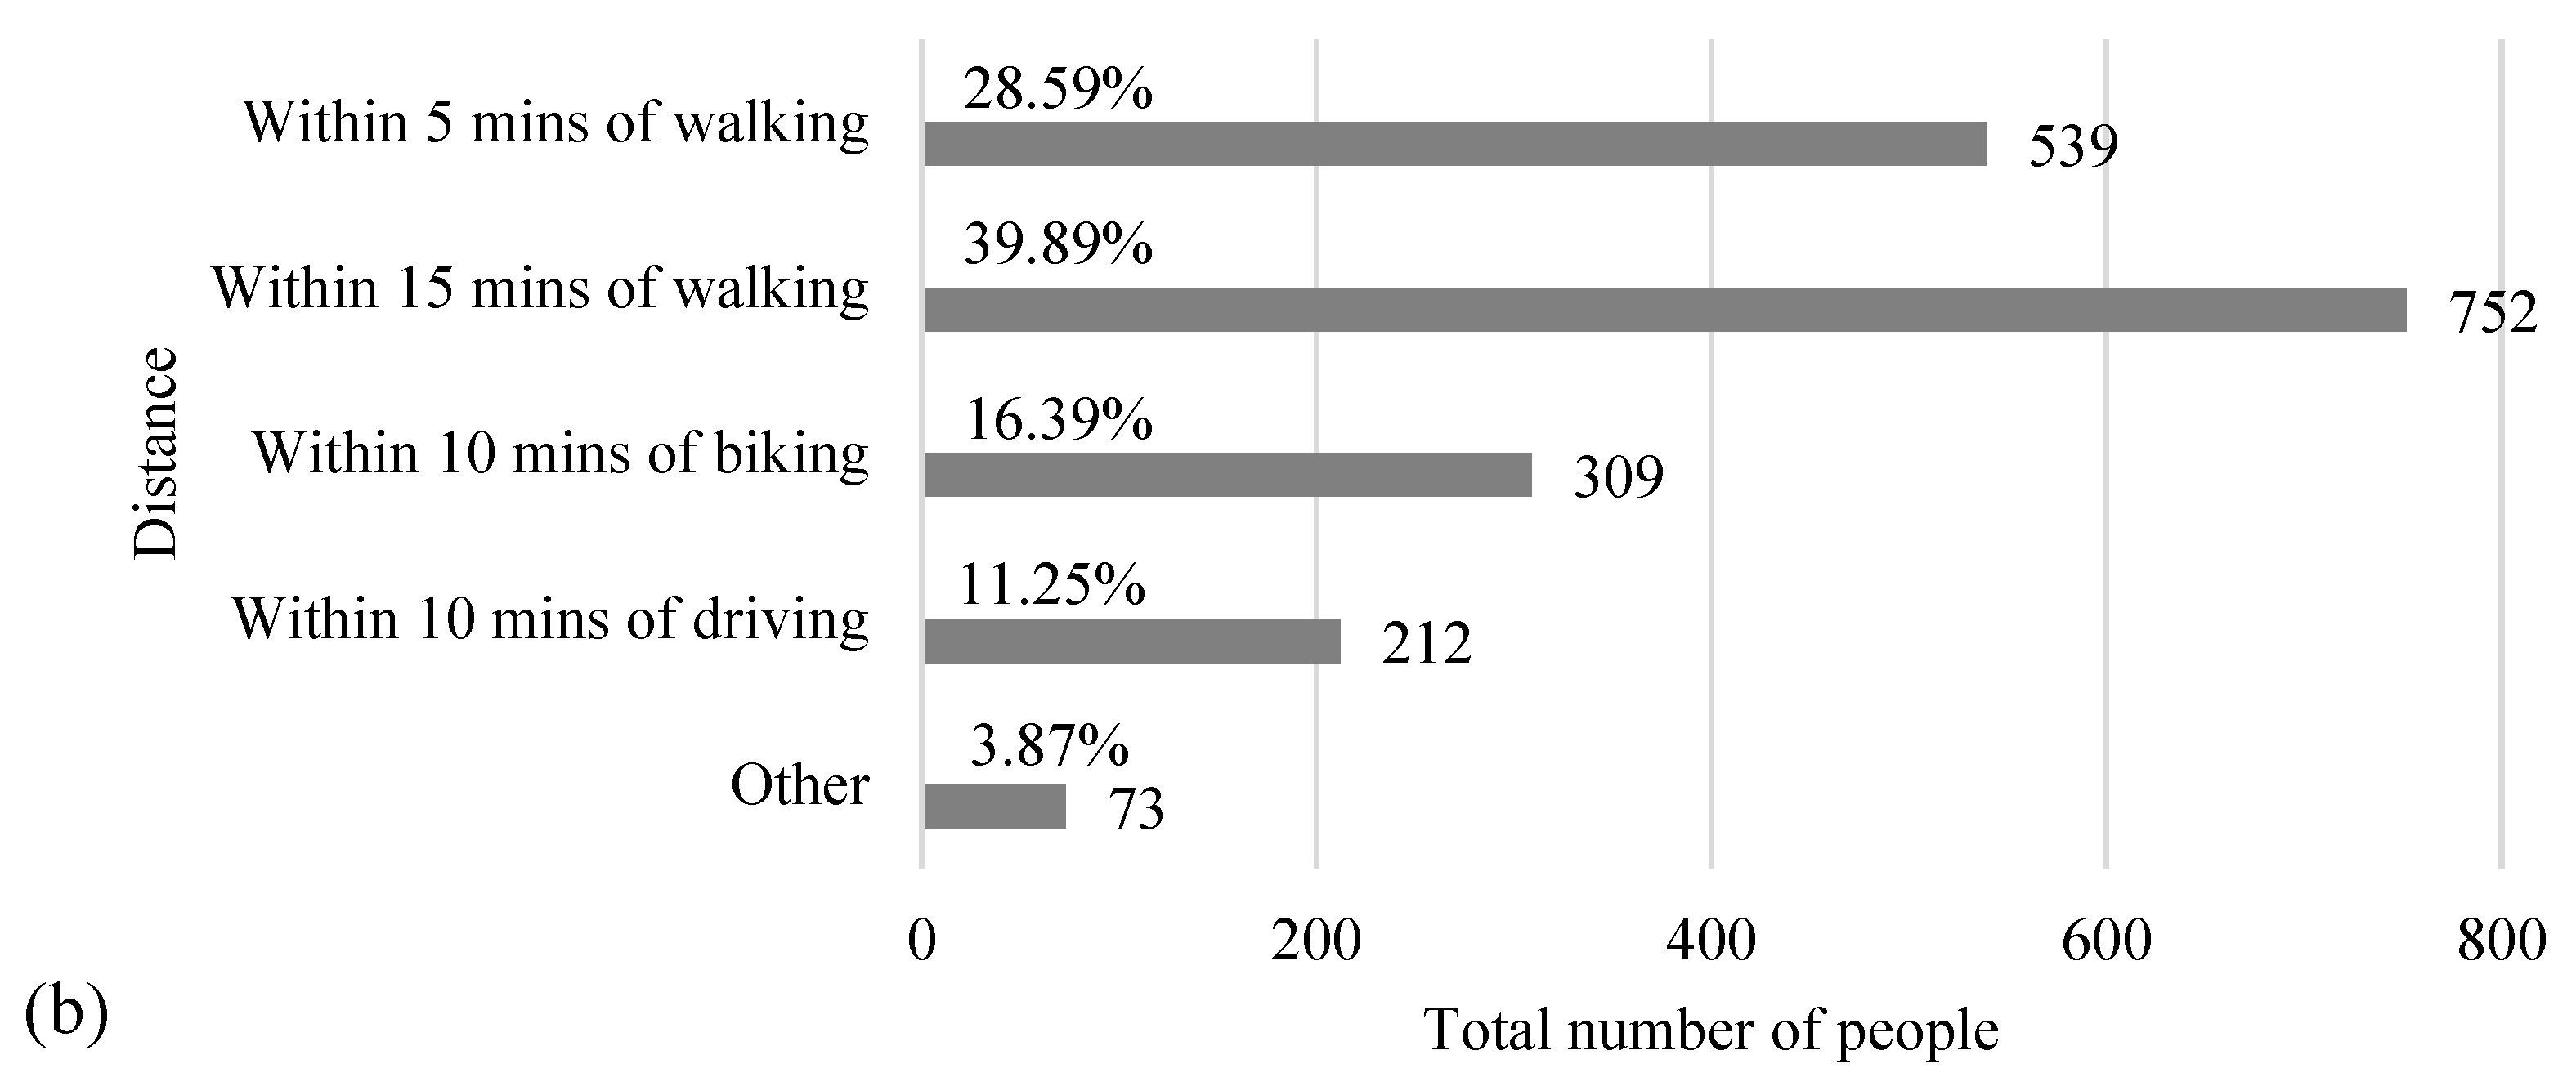
3.2. Effects of Visit Characteristics
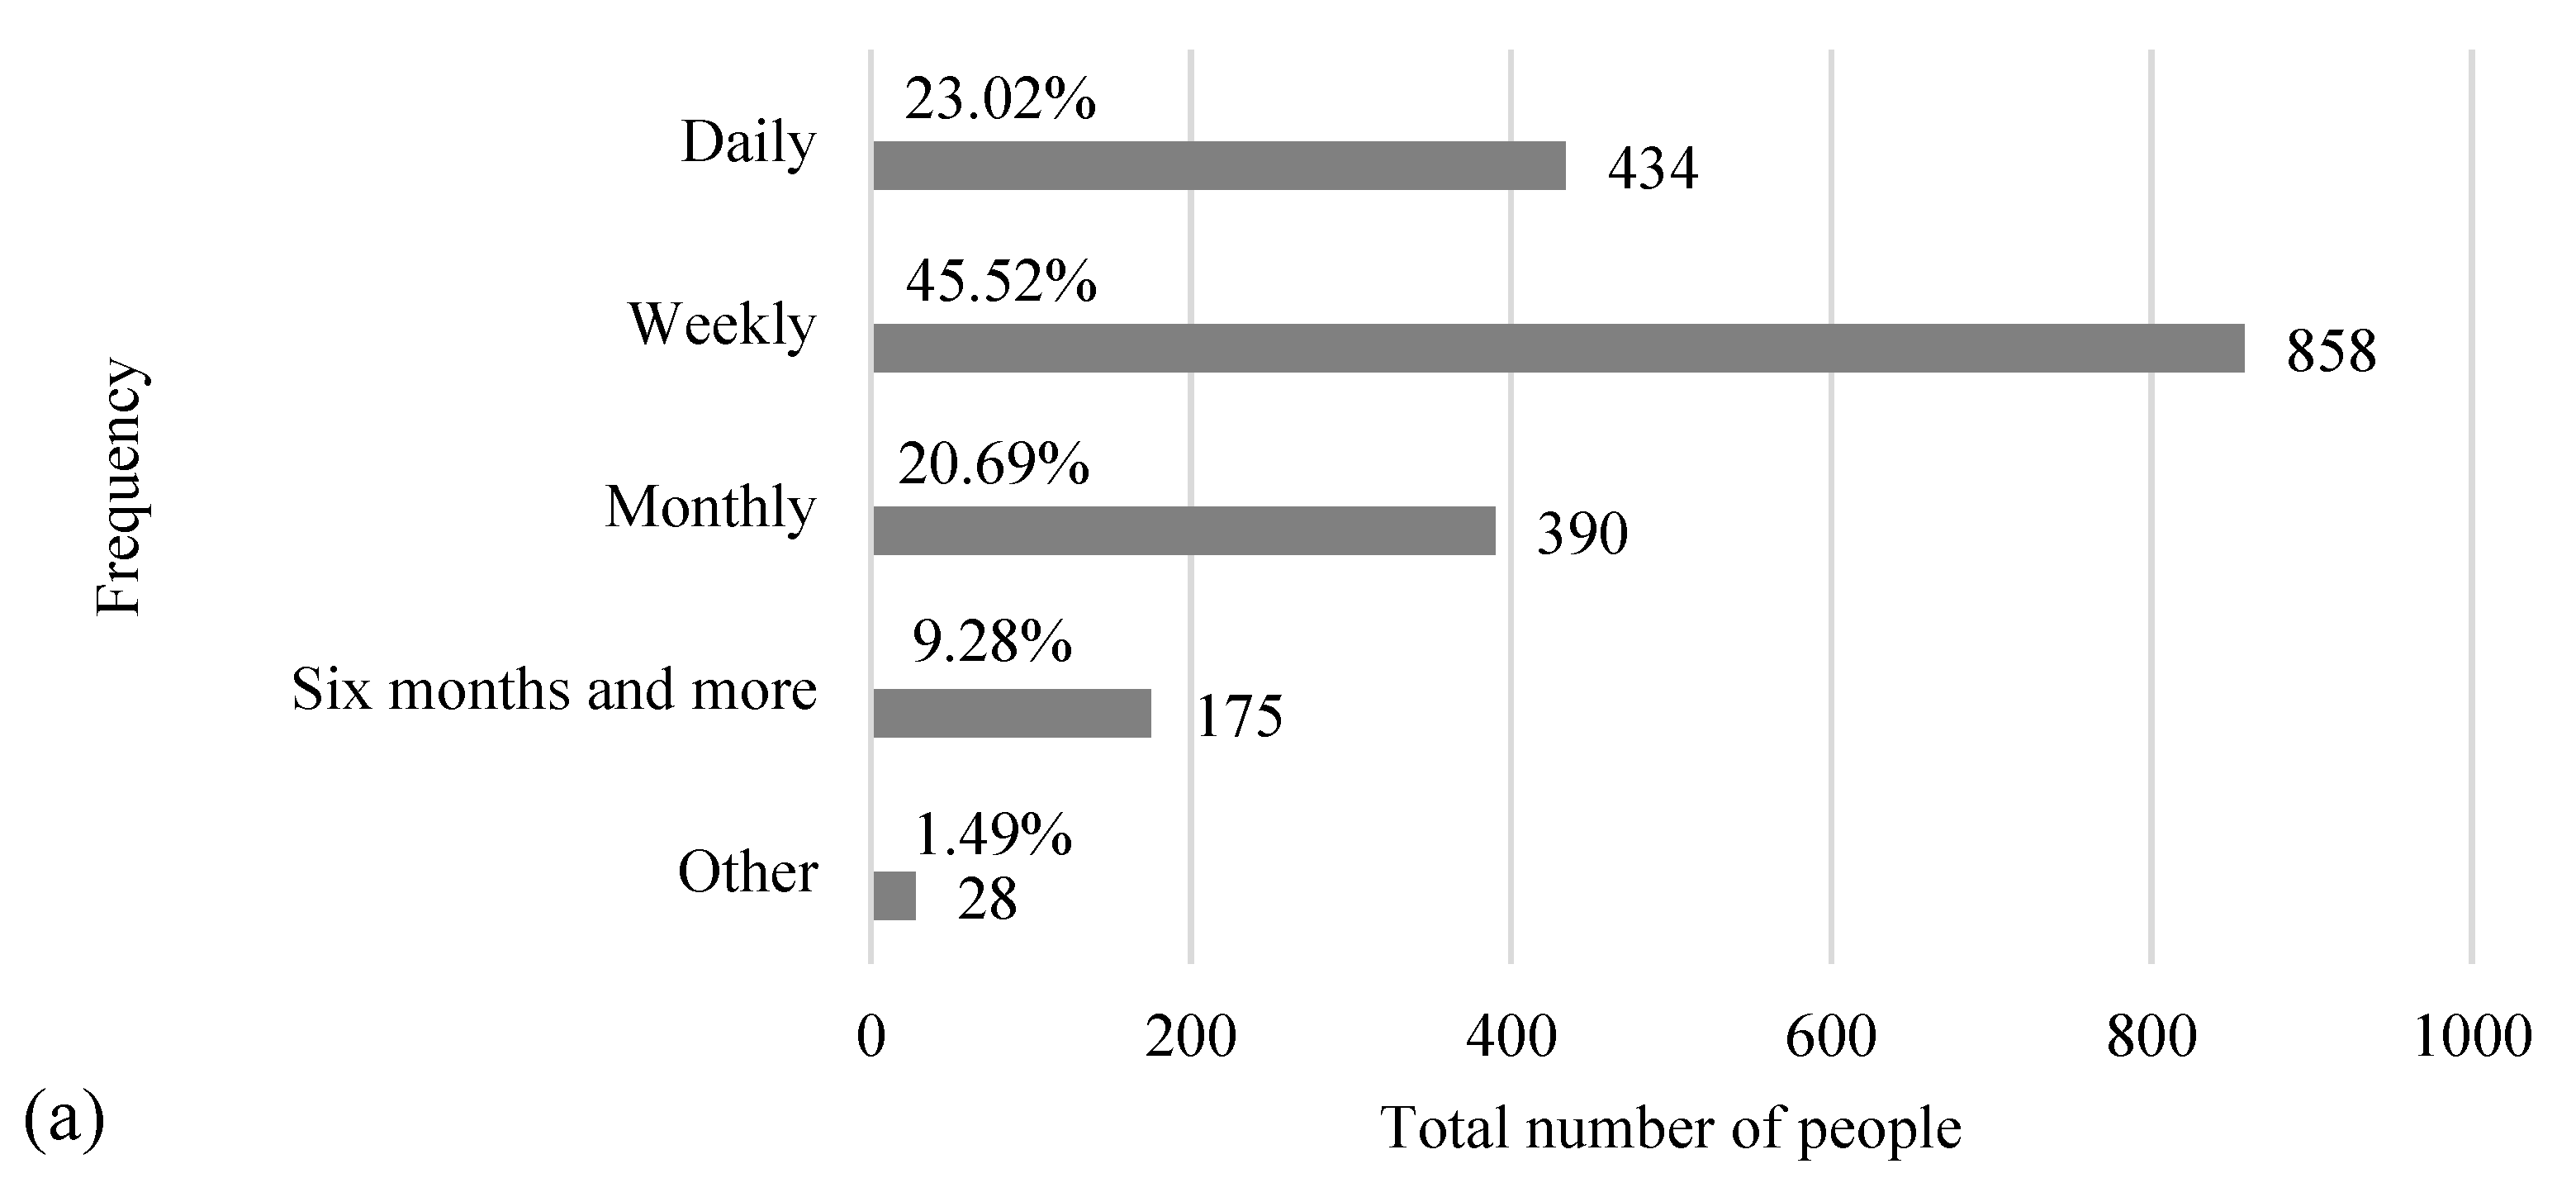
3.2.1. Characteristics of Respondent Visits to Parks and Green Spaces
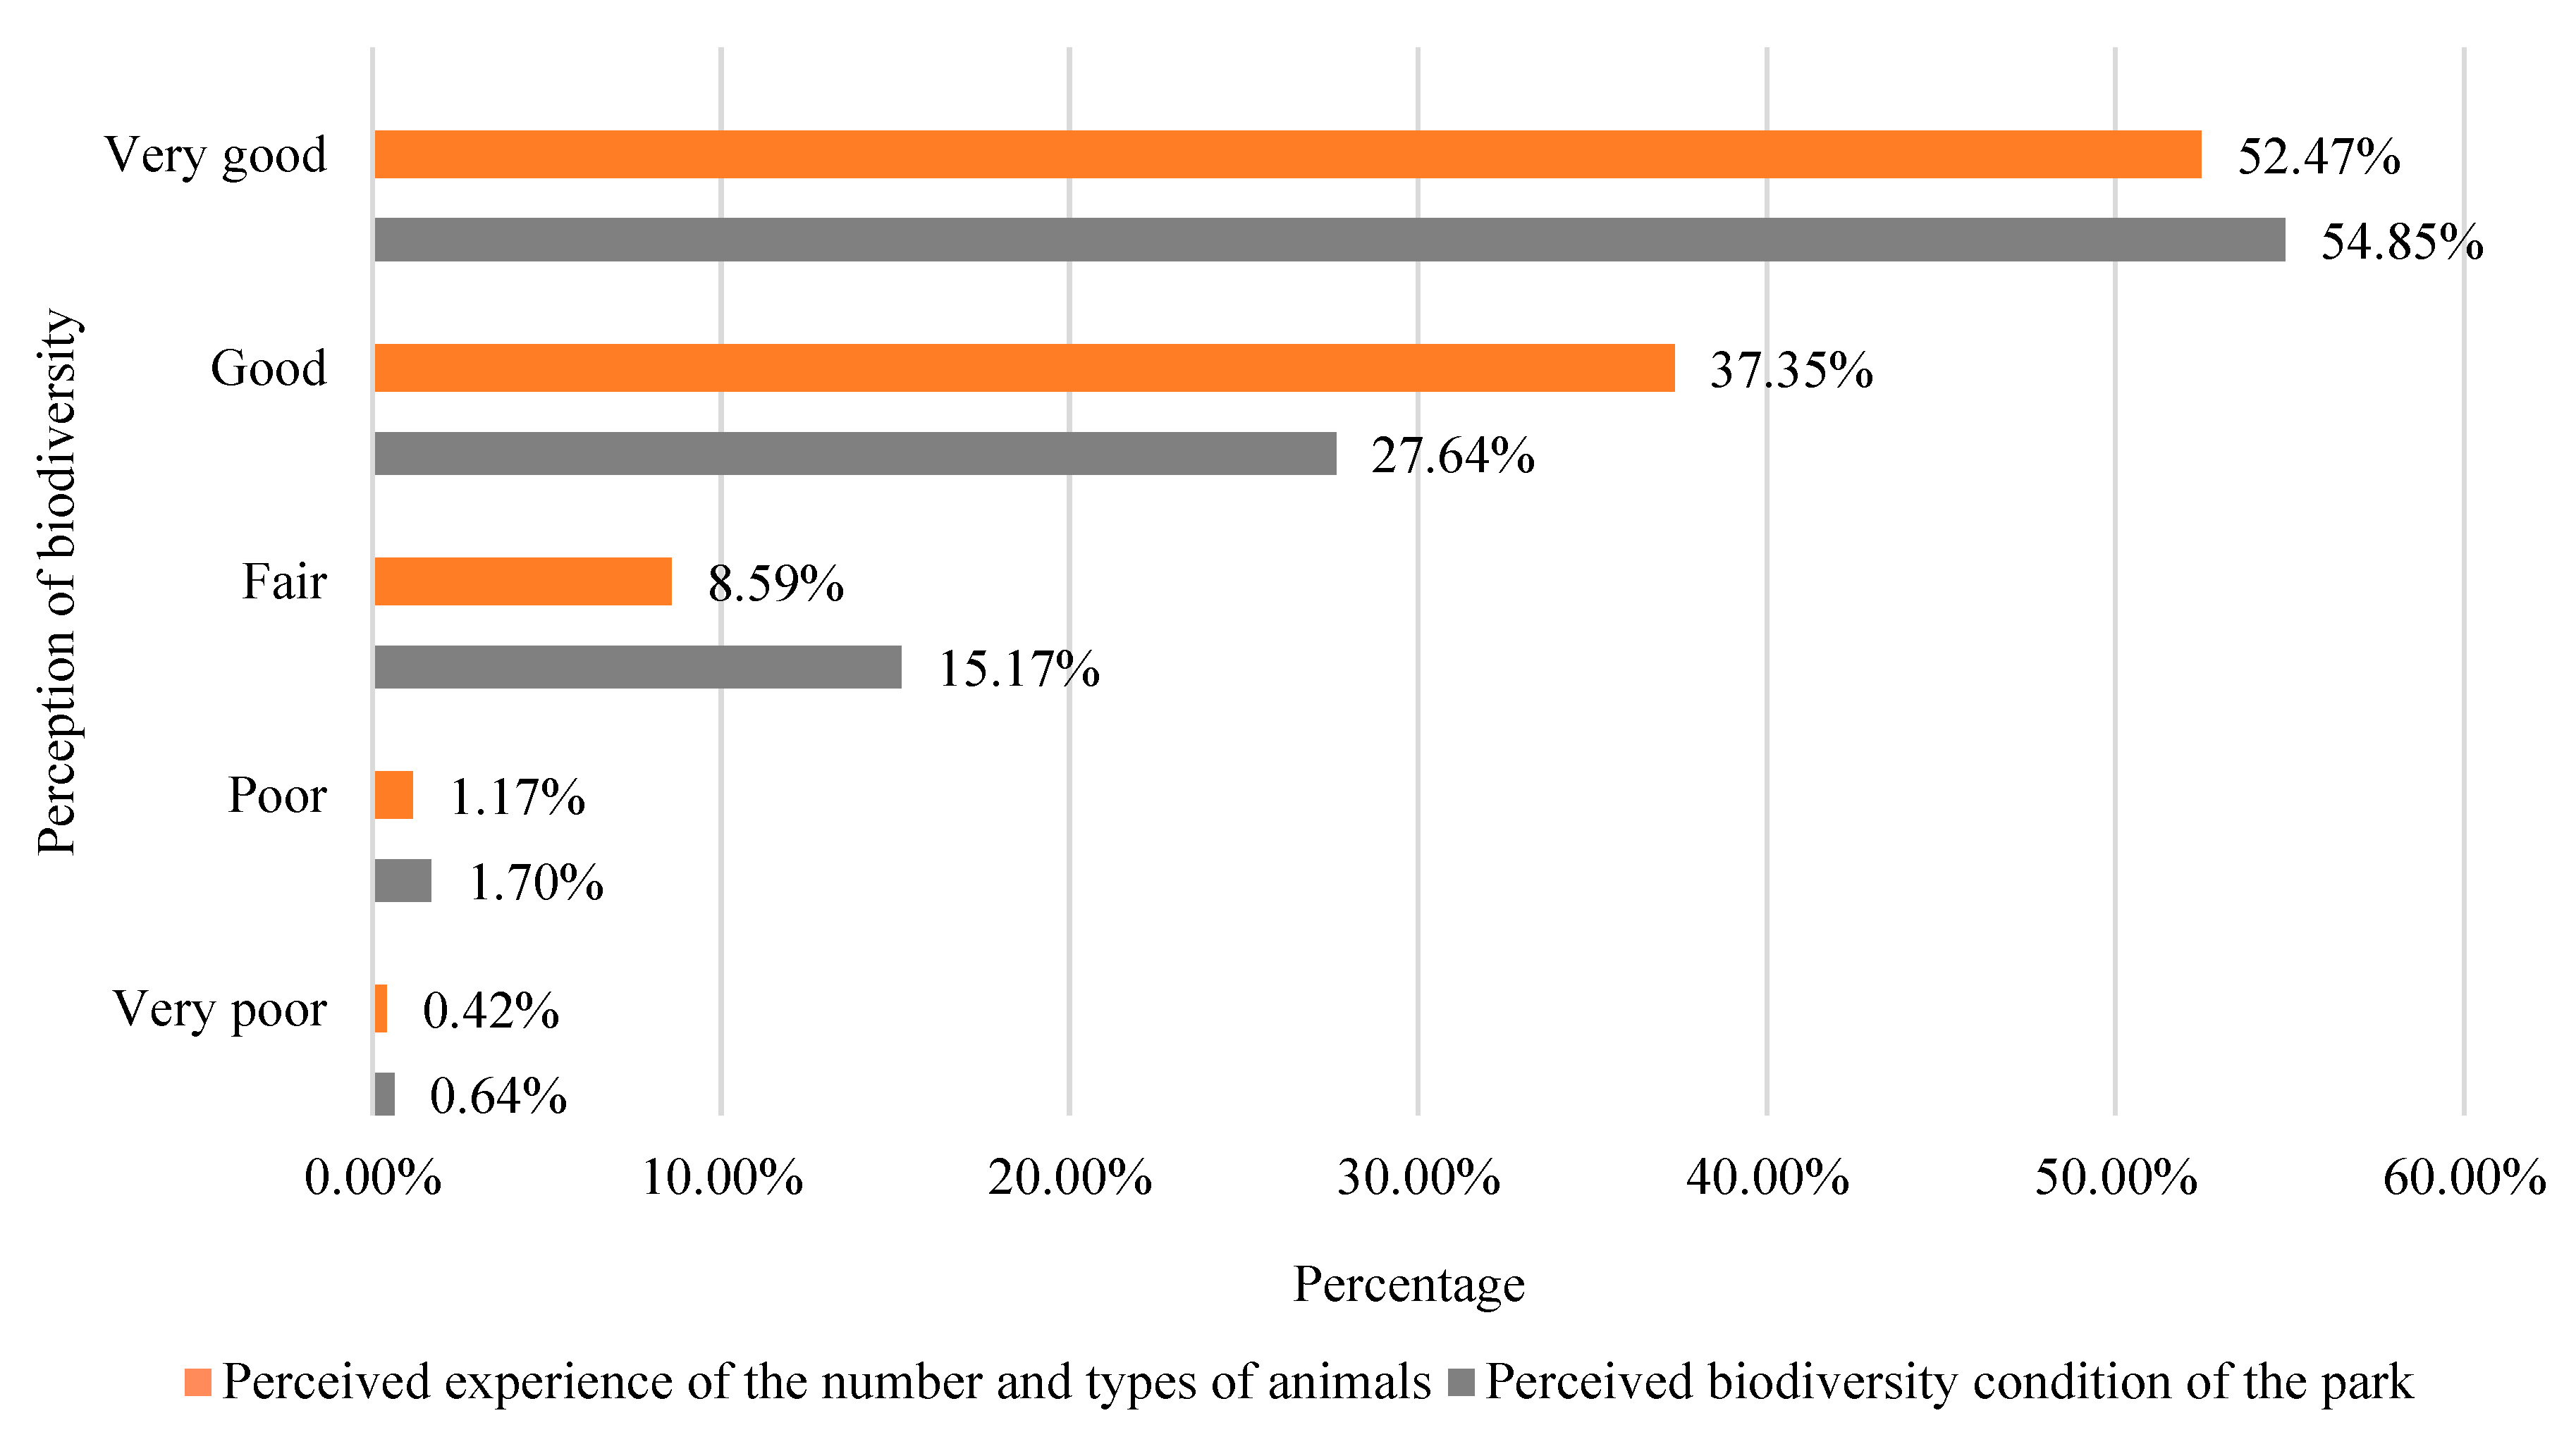
3.2.2. Respondent Perception of Urban Biodiversity
3.2.3. Respondent Preferences for Urban Biodiversity
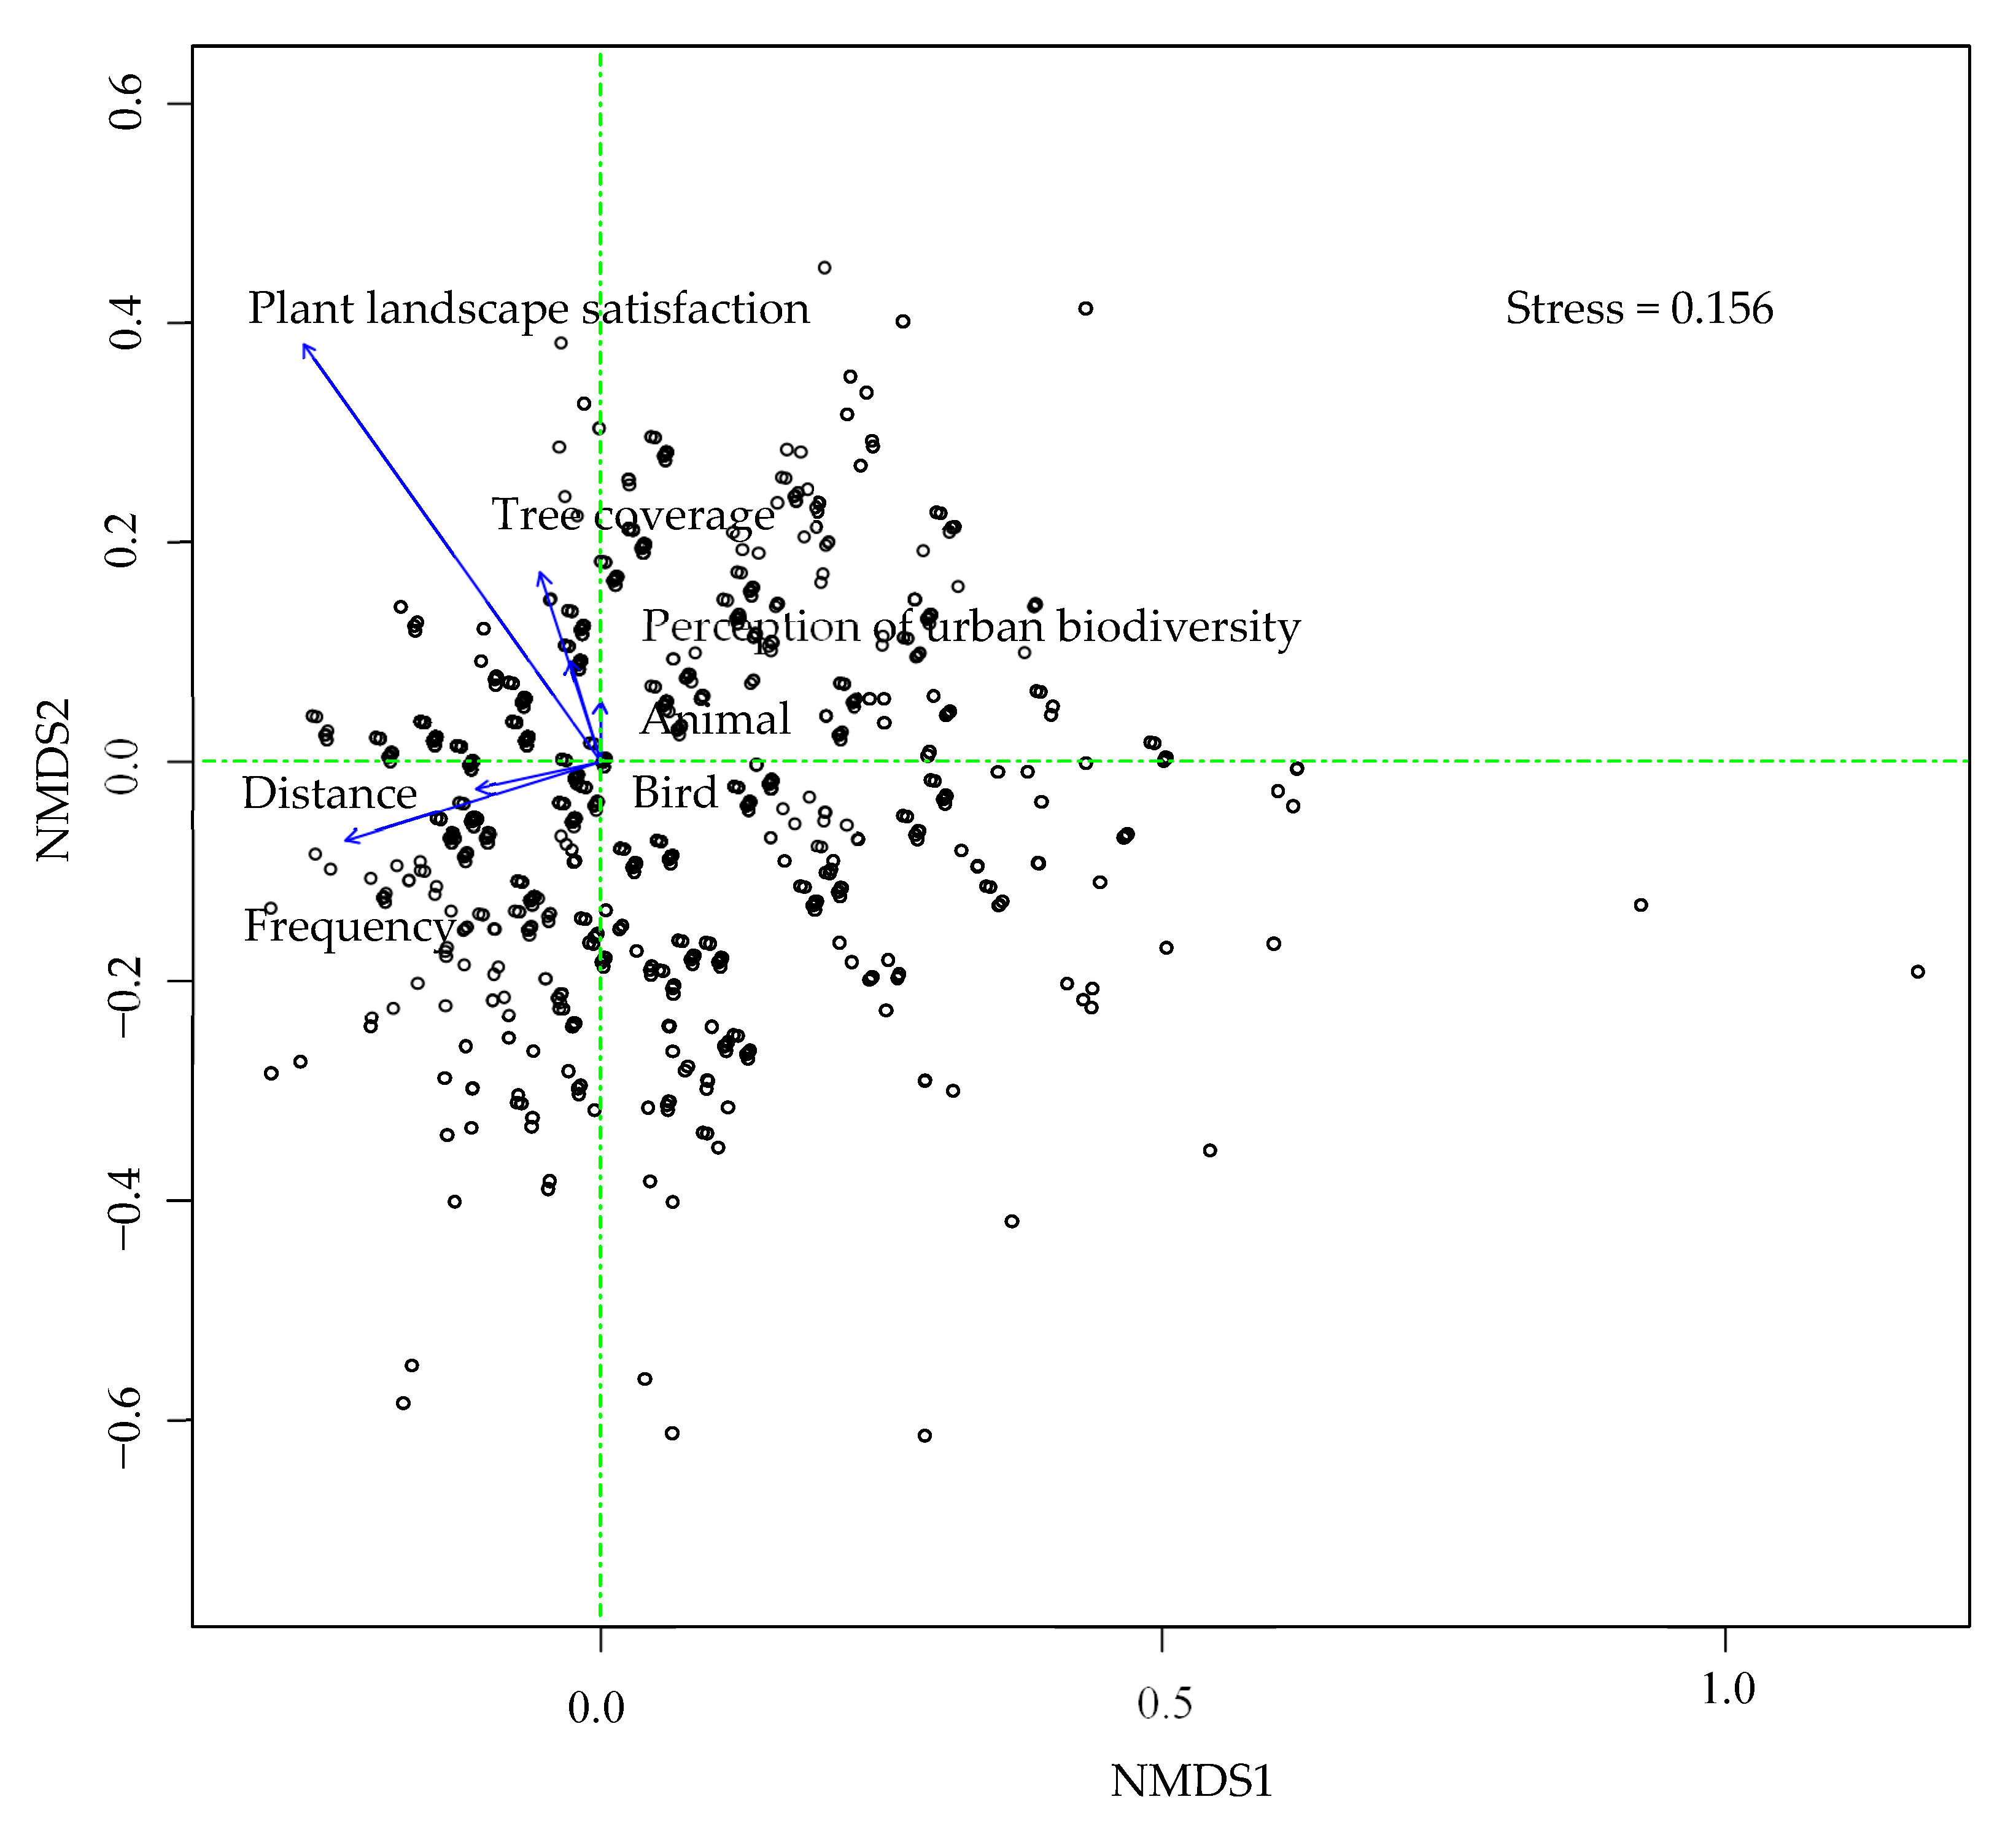
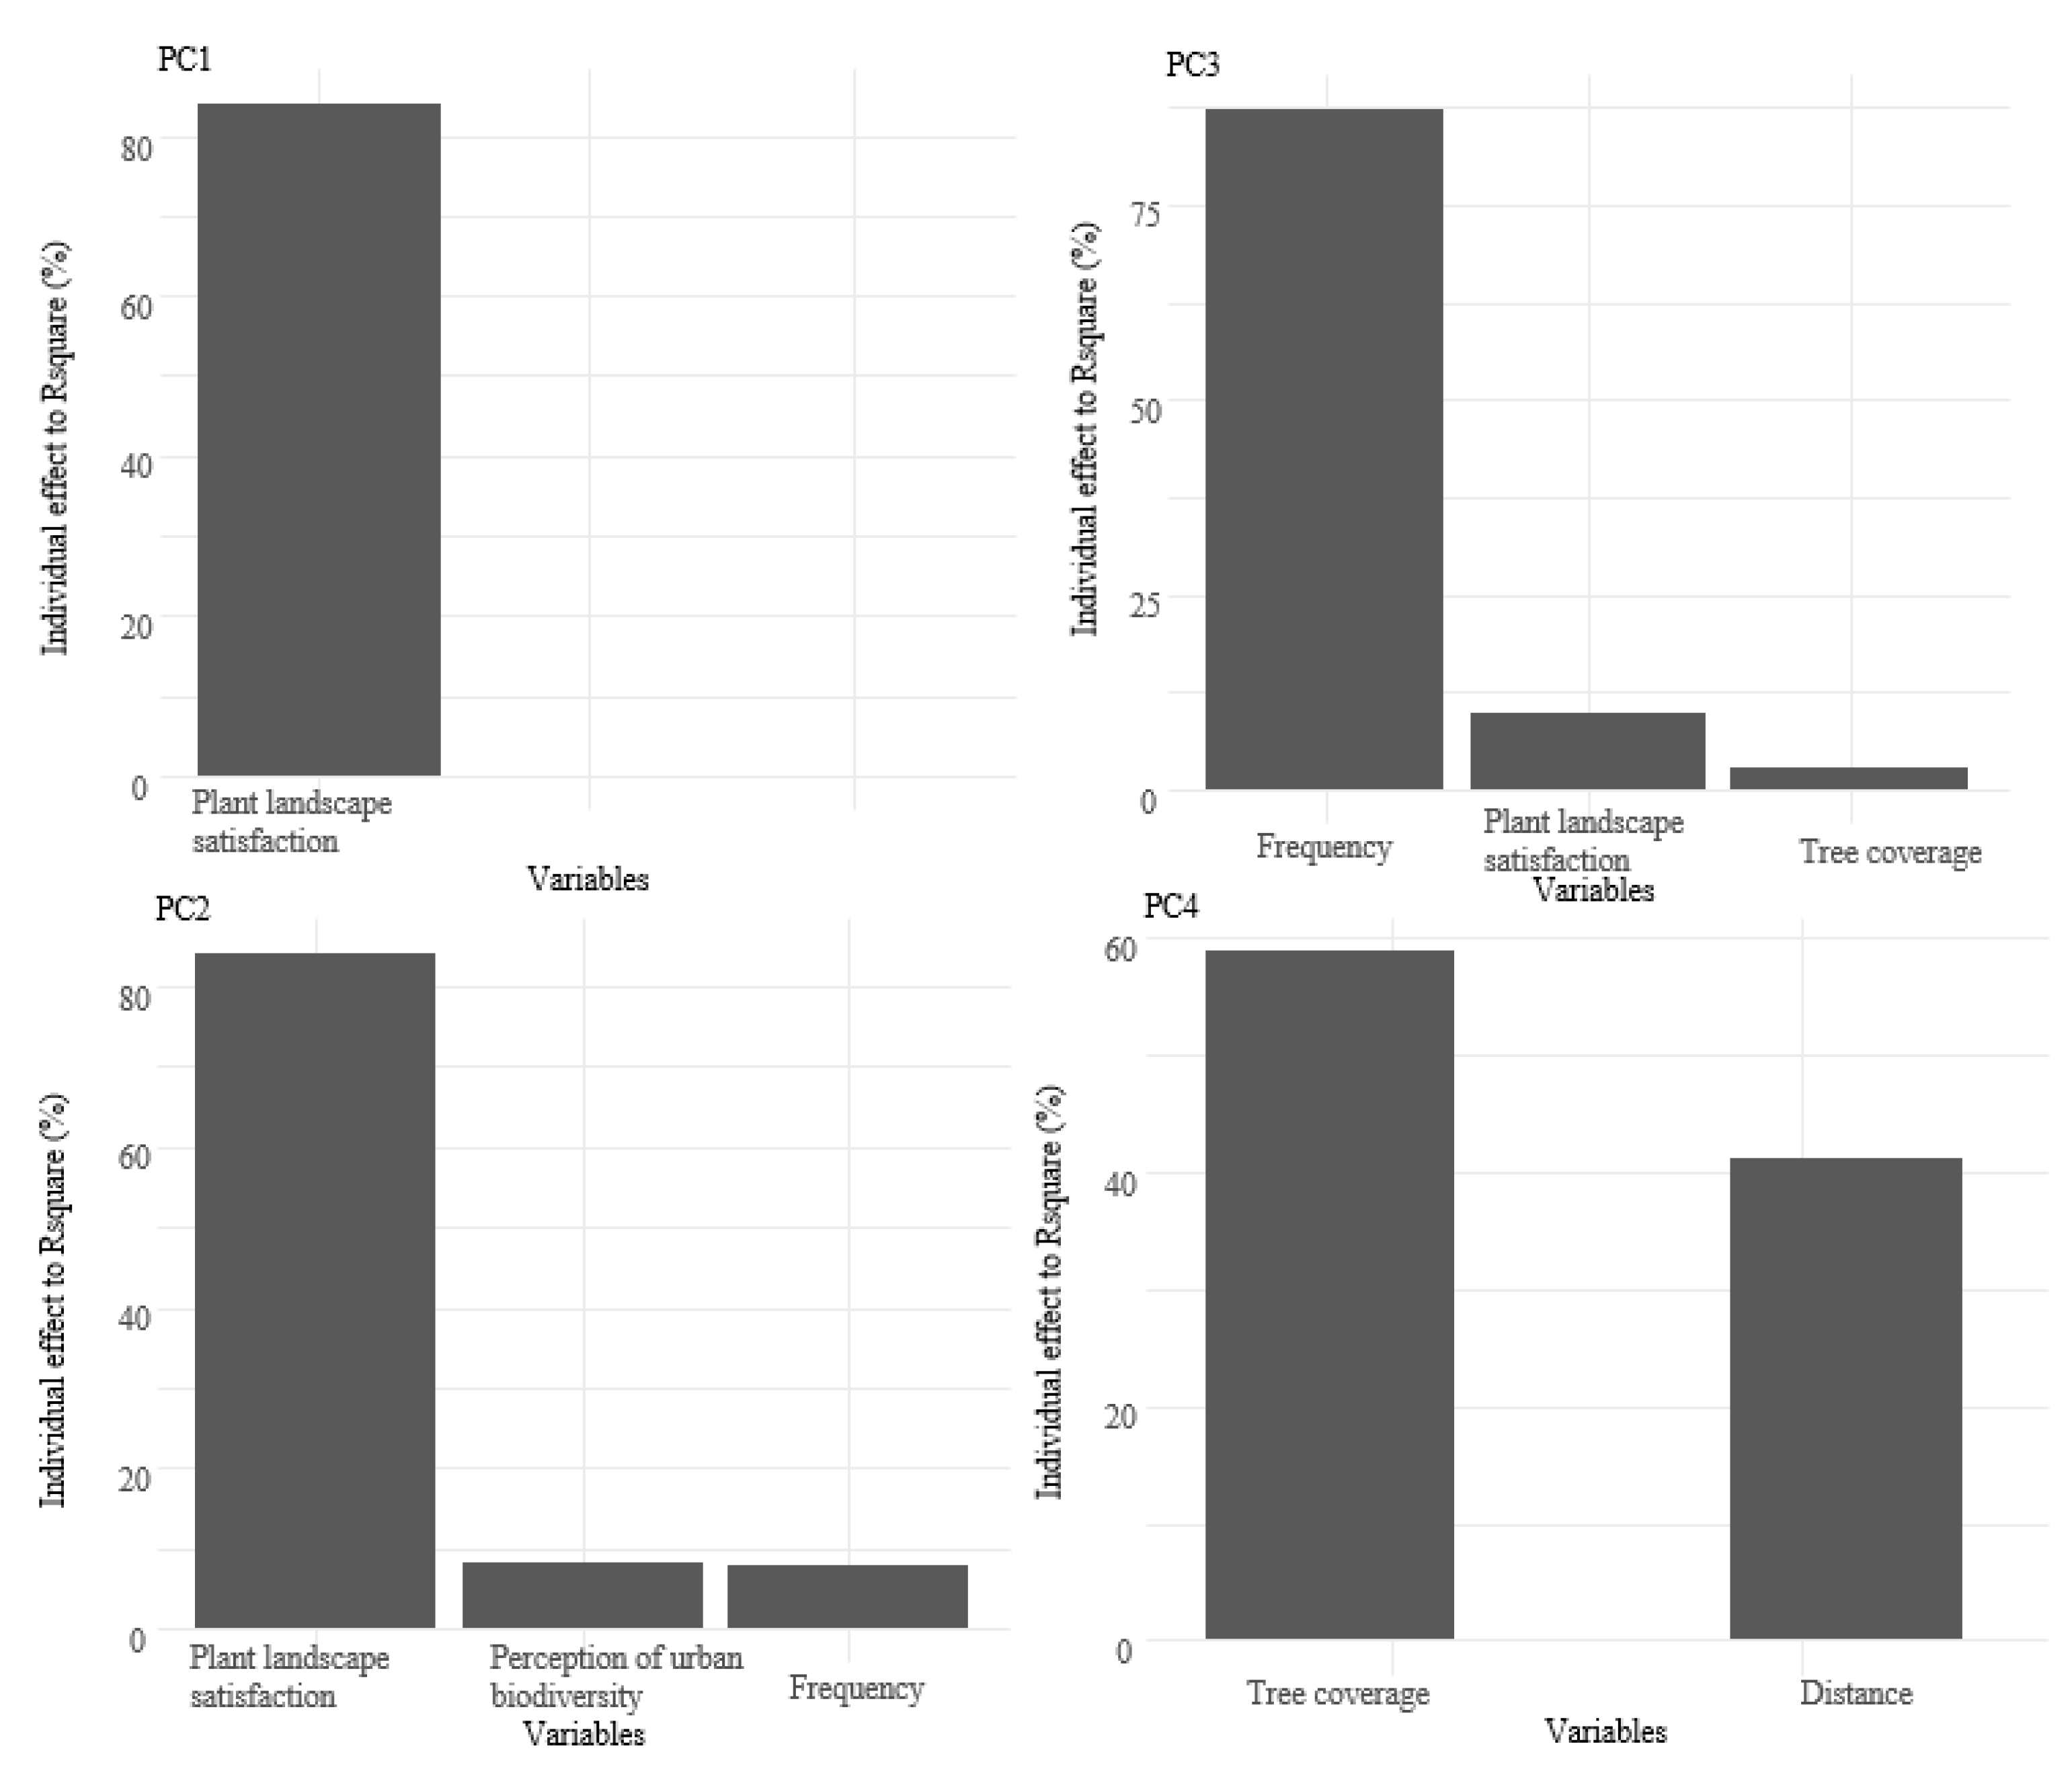
3.2.4. NMDS Analysis of Visit Characteristics
3.3. Willingness to Conserve Urban Biodiversity at Multiple Levels
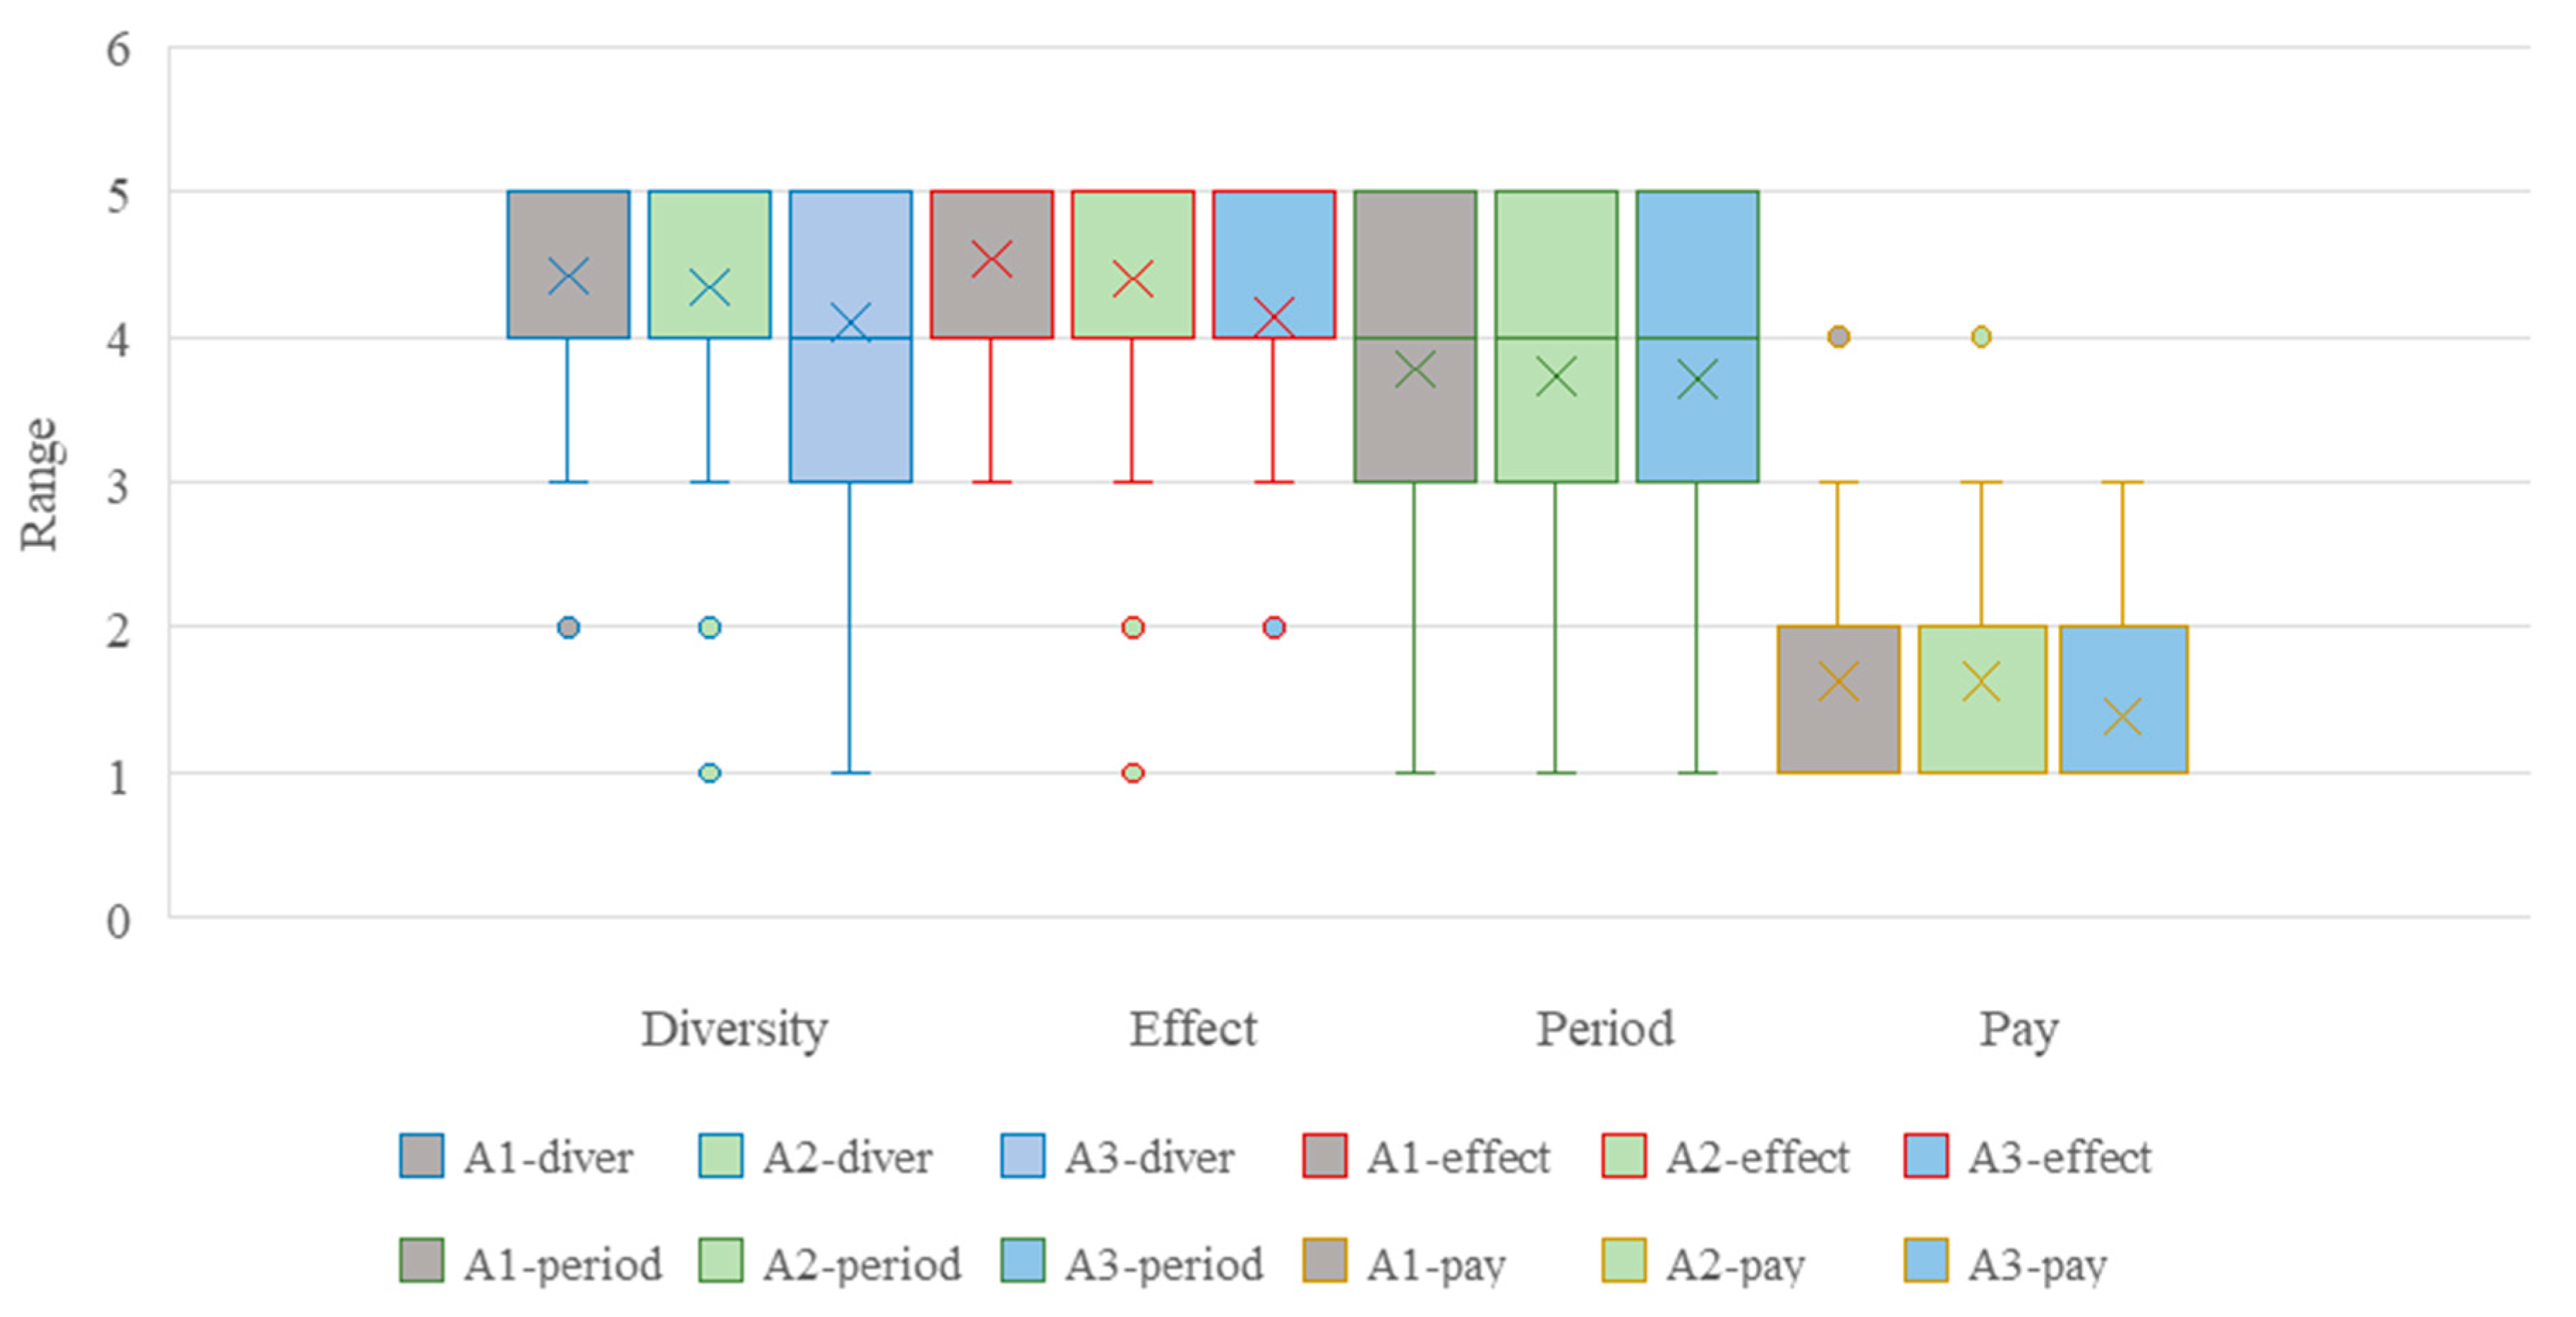
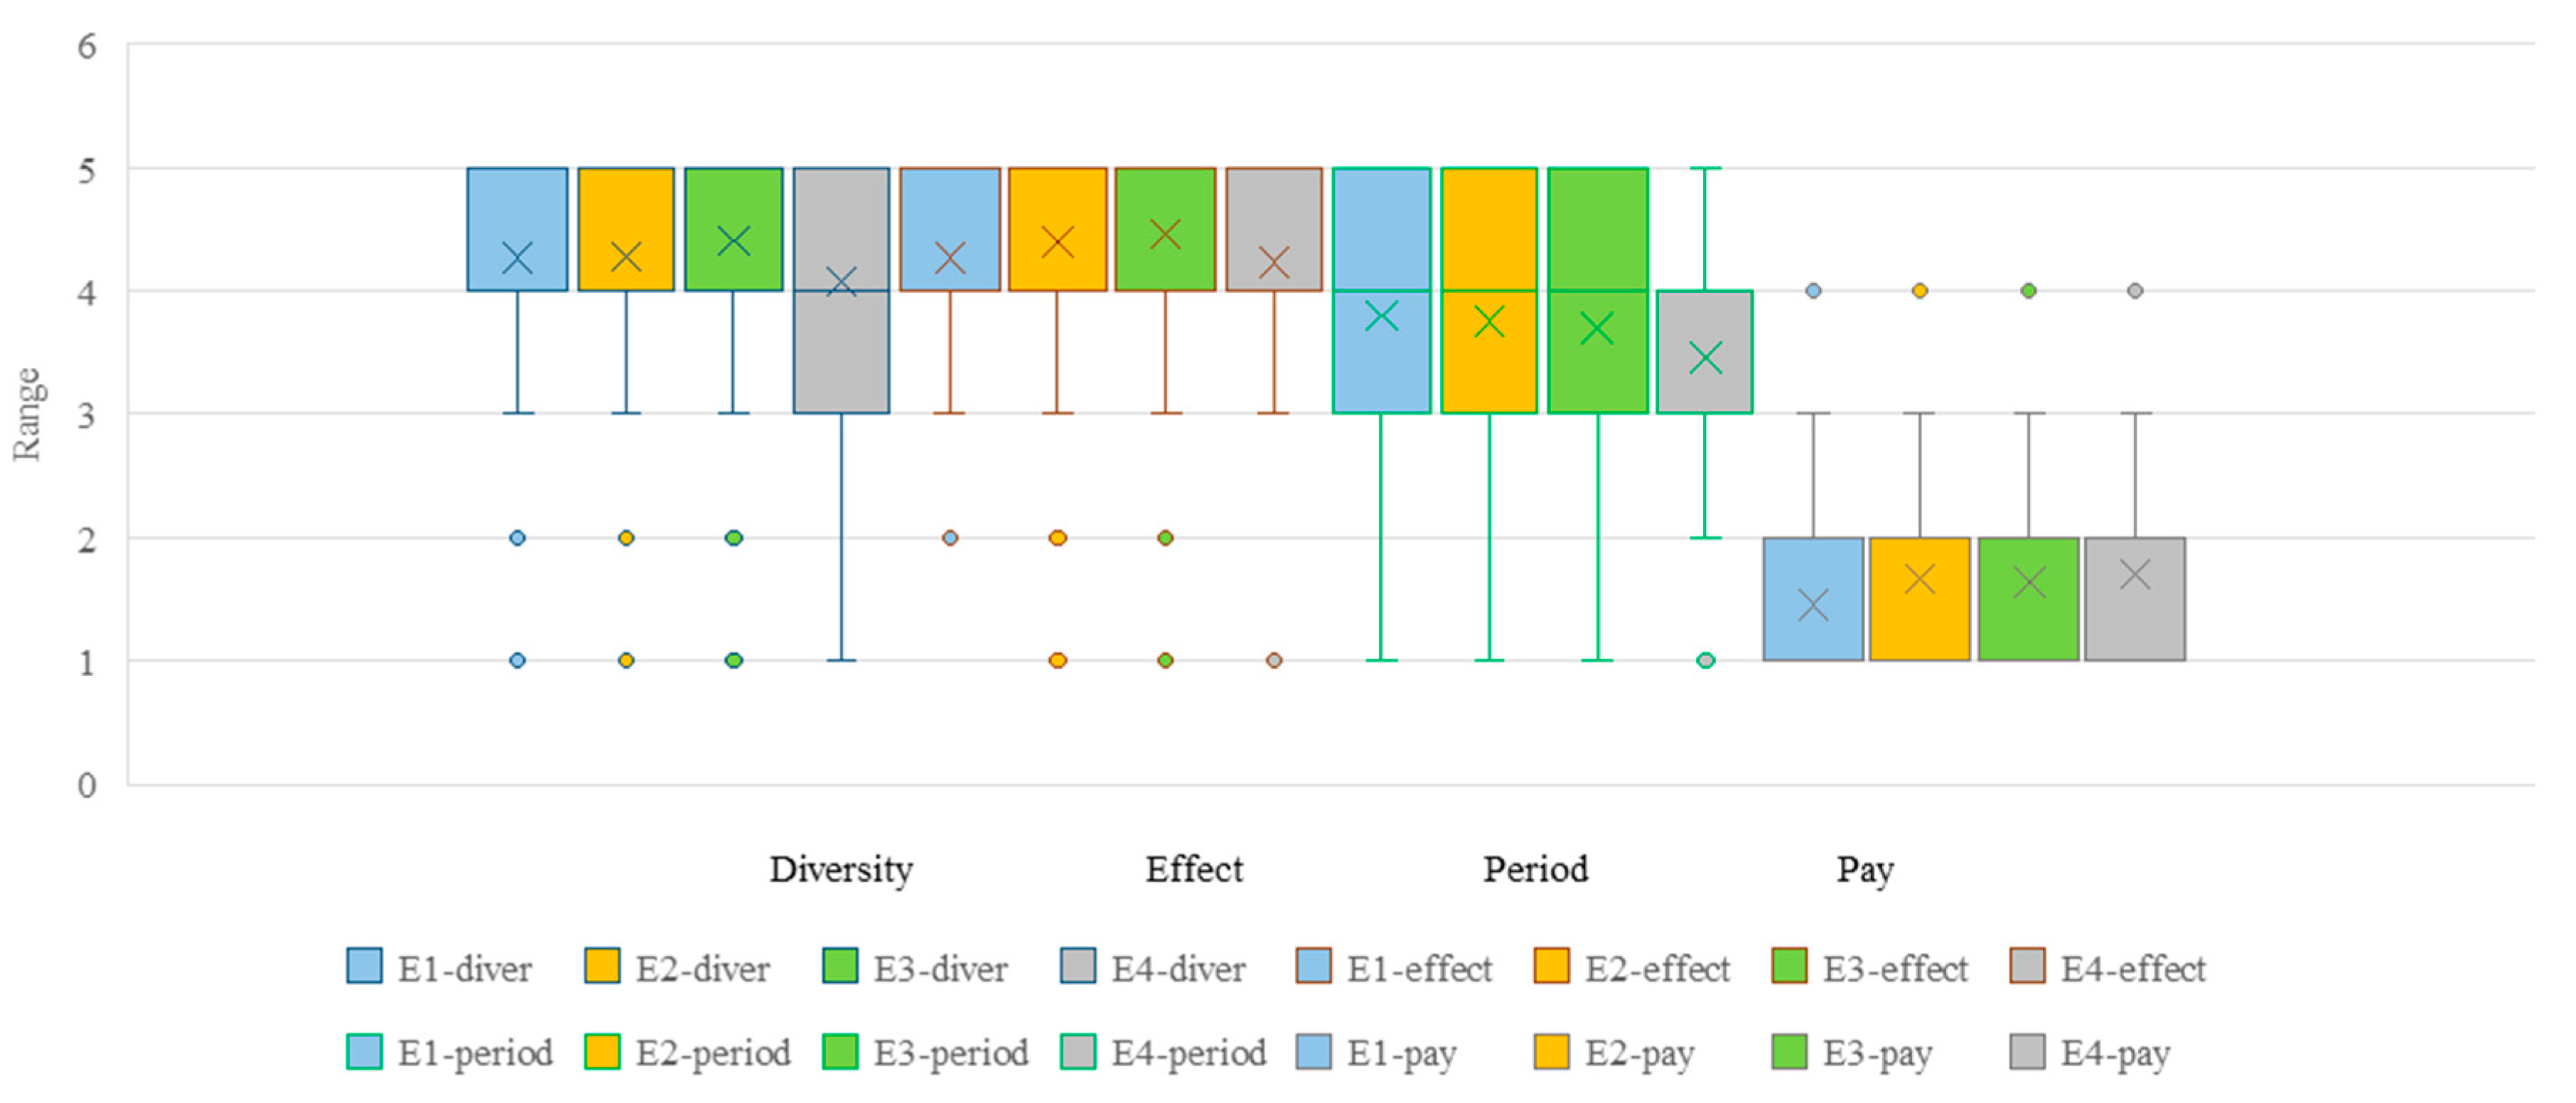
3.3.1. Meaning and Associated Factors of Each Level of Conservation Willingness
3.3.2. GLM and Stepwise Regression Analysis of the Willingness to Protect
4. Discussion
4.1. Differential Influence of Visitor Characteristics
4.2. Multidimensional Interaction Effects of Visit Characteristics
4.3. Driven by the Willingness to Protect and Co-Creation
4.4. Limitations and Prospects
Supplementary Materials
Author Contributions
Funding
Informed Consent Statement
Data Availability Statement
Acknowledgments
Conflicts of Interest
References
- White, H.J.; McKeon, C.M.; Pakeman, R.J.; Buckley, Y.M. The contribution of geographically common and rare species to the spatial distribution of biodiversity. Glob. Ecol. Biogeogr. 2023, 32, 1730–1747. [Google Scholar] [CrossRef]
- Borysiak, J.; Mizgajski, A.; Speak, A. Floral biodiversity of allotment gardens and its contribution to urban green infrastructure. Urban Ecosyst. 2017, 20, 323–335. [Google Scholar] [CrossRef]
- Venter, Z.S.; Figari, H.; Krange, O.; Gundersen, V. Environmental justice in a very green city: Spatial inequality in exposure to urban nature, air pollution and heat in Oslo, Norway. Sci. Total Environ. 2023, 858, 160193. [Google Scholar] [CrossRef]
- Klaus, V.H.; Kiehl, K. A conceptual framework for urban ecological restoration and rehabilitation. Basic Appl. Ecol. 2021, 52, 82–94. [Google Scholar] [CrossRef]
- Behm, J.E. Is biodiversity needed for sustainability? A spotlight on urban landscapes. Am. J. Bot. 2020, 107, 703–706. [Google Scholar] [CrossRef]
- Biella, P.; Bani, L.; Caprio, E.; Cochis, F.; Dondina, O.; Fiorilli, V.; Genre, A.; Gentili, R.; Orioli, V.; Ranalli, R.; et al. Biodiversity-friendly practices to support urban nature across ecosystem levels in green areas at different scales. Urban For. Urban Green. 2025, 105, 128682. [Google Scholar] [CrossRef]
- Hu, X.; Lima, M.F. The association between maintenance and biodiversity in urban green spaces: A review. Landsc. Urban Plan. 2024, 251, 105153. [Google Scholar] [CrossRef]
- Hung, S.-H. Does perceived biophilic design contribute to human well-being in urban green spaces? A study of perceived naturalness, biodiversity, perceived restorativeness, and subjective vitality. Urban For. Urban Green. 2025, 107, 128752. [Google Scholar] [CrossRef]
- Ranalli, R.; Galimberti, A.; Labra, M.; Biella, P. Forest spatial configuration and local management influence bee pollinator biodiversity in urban and rural landscapes. J. Environ. Manag. 2025, 377, 124672. [Google Scholar] [CrossRef]
- Hu, S.; Liu, J.; Su, X.; Li, B. Theoretical Foundation and Practical Prospect for Urban Rewilding. Landsc. Archit. 2024, 31, 12–21. [Google Scholar] [CrossRef]
- Hu, X.; Lima, M.F.; McLean, R.; Sun, Z. Exploring preferences for biodiversity and wild parks in Chinese cities: A conjoint analysis study in Hangzhou. Urban For. Urban Green. 2022, 73, 127595. [Google Scholar] [CrossRef]
- Melon, M.; Sikorski, P.; Archiciński, P.; Łaszkiewicz, E.; Hoppa, A.; Zaniewski, P.; Zaniewska, E.; Strużyński, W.; Sudnik-Wójcikowska, B.; Sikorska, D. Nature on our doorstep: How do residents perceive urban parks vs. biodiverse areas? Landsc Urban Plan. 2024, 247, 105059. [Google Scholar] [CrossRef]
- Dat, L.Q.; Chou, S.Y.; Tam, P.M.; Hue, N.T.; Thuy, P.T. Factors Influencing Residents’ Willingness to Pay for Mangrove Forest Environmental Services in Phu Long, Vietnam. SAGE Open 2024, 14, 21582440241264604. [Google Scholar] [CrossRef]
- Hörisch, J.; Petersen, L.; Jacobs, K. The impact of biodiversity information on willingness to pay. J. Ind. Ecol. 2024, 28, 1641–1656. [Google Scholar] [CrossRef]
- Aiman, A.; Aziz, N.A.A.; Saadun, N.; Lin, E.L.A.; Lechner, A.M.; Azhar, B. Attitudes and willingness of local communities towards natural urban forest conservation in a rapidly developing Southeast Asia city. Cities 2022, 129, 103832. [Google Scholar] [CrossRef]
- Sattout, E.; Talhouk, S.; Caligari, P. Economic value of cedar relics in Lebanon: An application of contingent valuation method for conservation. Ecol. Econ. 2007, 61, 315–322. [Google Scholar] [CrossRef]
- Zhang, Y.; Hou, M.L.; Chen, C.Q.; Liao, Z.-Y.; Guan, Y.-F.; Yuan, Y.-L.; Zhang, Y.; Zhao, M.-Y.; Tang, T.-T. Attitude and willingness of biodiversity conservation in Chinese university students: Associated factors and the mediation of social support. PLoS ONE 2024, 19, 9. [Google Scholar] [CrossRef]
- Sardana, K. Tourists’ Willingness to Pay for Restoration of Traditional Agro-forest Ecosystems Providing Biodiversity: Evidence from India. Ecol. Econ. 2019, 159, 362–372. [Google Scholar] [CrossRef]
- Yang, J.; Su, K.; Zhou, Z.; Huang, Y.; Hou, Y.; Wen, Y. The impact of tourist cognition on willing to pay for rare species conservation: Base on the questionnaire survey in protected areas of the Qinling region in China. Glob. Ecol. Conserv. 2022, 33, e01952. [Google Scholar] [CrossRef]
- Vásquez, W.F.; Beaudin, L.; Murray, T.J.; Pedlowski, M.A.; de Rezende, C.E. Preferences for sea level rise adaptation: A contingent valuation study in Rio de Janeiro State, Brazil. Ocean. Coast. Manag. 2022, 218, 106020. [Google Scholar] [CrossRef]
- Ren, Y.; Ding, C.; Zhang, Y.; Qing, B.; Duan, W. Public attitudes and willingness to pay toward the conservation of Crested Ibis: Insights for management. J. Nat. Conserv. 2022, 66, 126118. [Google Scholar] [CrossRef]
- Malinauskaite, L.; Cook, D.; Davíðsdóttir, B.; Ögmundardóttir, H.; Roman, J. Willingness to pay for expansion of the whale sanctuary in Faxaflói Bay, Iceland: A contingent valuation study. Ocean. Coast. Manag. 2020, 183, 105026. [Google Scholar] [CrossRef]
- Torres-Miralles, M.; Grammatikopoulou, I.; Rescia, A.J. Employing contingent and inferred valuation methods to evaluate the conservation of olive groves and associated ecosystem services in Andalusia (Spain). Ecosyst. Serv. 2017, 26, 258–269. [Google Scholar] [CrossRef]
- O’Connor, E.; Hynes, S.; Chen, W. Estimating the non-market benefit value of deep-sea ecosystem restoration: Evidence from a contingent valuation study of the Dohrn Canyon in the Bay of Naples. J. Environ. Manag. 2020, 275, 111180. [Google Scholar] [CrossRef]
- Bronnmann, J.; Liebelt, V.; Marder, F.; Jasper, M.; Quaas, M. The Value of Naturalness of Urban Green Spaces: Evidence from a Discrete Choice Experiment. Land Econ. 2023, 99, 528–542. [Google Scholar] [CrossRef]
- Uchiyama, C.; Ichikawa, K.; Saito, O. Exploring Landscape Values and Willingness to Pay for Perceived Ecosystem Services: The Case of Malampaya Sound, a Socio-Ecological Production Landscape and Seascape. Sustainability 2024, 16, 3210. [Google Scholar] [CrossRef]
- Campbell, M.L.; Le, C.T.; Hewitt, C.L. Critical coastal values impacted by marine bioinvasions: What the public value about marine and coastal areas and what is at stake? Environ. Sci. Policy 2024, 157, 13. [Google Scholar] [CrossRef]
- Chen, W.Y.; Jim, C.Y. Resident Motivations and Willingness-to-Pay for Urban Biodiversity Conservation in Guangzhou (China). Environ. Manag. 2010, 45, 1052–1064. [Google Scholar] [CrossRef]
- Lee, F.Y.S.; Ma, A.T.H.; Cheung, L.T.O. Resident Perception and Willingness to Pay for the Restoration and Revitalization of Urban Rivers. Water 2021, 13, 2649. [Google Scholar] [CrossRef]
- Liu, X.Y.; Chen, C.D.; Bi, L.L.; Wang, R.B.; Dong, J.W.; Zheng, Y.L.; Zeng, X.Y. A study on plant diversity and its value in urban old residential areas: Based on the willingness to pay method. Acta Ecologica Sinica 2025, 45, 1–10. [Google Scholar] [CrossRef]
- Hao, J.; Gao, T.; Qiu, L. Biodiversity Perception, preference and recovery benefits in different green spaces. Chin. Landsc. Archit. 2024, 40, 117–123. [Google Scholar] [CrossRef]
- Eylering, A.; Borghorst, J.; Neufeld, K.; Szczepanski, L.; van Valkengoed, A.M.; Fiebelkorn, F. People’s perception of biodiversity loss: Validation of a scale in Germany. J. Nat. Conserv. 2025, 84, 126854. [Google Scholar] [CrossRef]
- Lu, C.; Tanaka, K.; Shen, Q. Residents’ Preferences on Green Infrastructure in Wuhan, China. Sustainability 2024, 16, 10303. [Google Scholar] [CrossRef]
- Egerer, M.; Ordóñez, C.; Lin, B.B.; Kendal, D. Multicultural gardeners and park users benefit from and attach diverse values to urban nature spaces. Urban For. Urban Green 2019, 16, 126445. [Google Scholar] [CrossRef]
- Tokuoka, Y.; Katayama, N.; Okubo, S. Japanese consumer’s visual marketing preferences and willingness to pay for rice produced by biodiversity-friendly farming. Conserv. Sci. Pract. 2024, 6, e13091. [Google Scholar] [CrossRef]
- Jana, P.; Pandey, R.; Semeraro, T.; Alatalo, J.M.; Areteno, R.; Todaria, N.P.; Tripathi, R. Community perspectives on conservation of water sources in Tarkeshwar sacred groves, Himalaya, India. Water Supply 2021, 21, 4343–4354. [Google Scholar] [CrossRef]
- Schebella, M.F.; Weber, D.; Schultz, L.; Weinstein, P. In Pursuit of Urban Sustainability: Predicting Public Perceptions of Park Biodiversity Using Simple Assessment Tools. Int. J. Environ. Res. 2019, 13, 707–720. [Google Scholar] [CrossRef]
- Hangzhou Municipal Government. Demographic Overview of Hangzhou. Available online: https://www.hangzhou.gov.cn/col/col805739/index.html (accessed on 10 March 2025).
- Pulido-González, N.; García-Rodríguez, S.; Campo, M.; Rams, J.; Torres, B. Application of DOE and ANOVA in Optimization of HVOF Spraying Parameters in the Development of New Ti Coatings. J. Therm. Spray Tech. 2020, 29, 384–399. [Google Scholar] [CrossRef]
- Nelder, J.A.; Verrall, R.J. Credibility theory and generalized linear models. Astin Bull. 1997, 27, 71–82. [Google Scholar] [CrossRef]
- Ohlsson, E. Combining generalized linear models and credibility models in practice. Scand. Actuar. J. 2008, 2008, 301–314. [Google Scholar] [CrossRef]
- Finos, L.; Brombin, C.; Salmaso, L. Adjusting Stepwise p-Values in Generalized Linear Models. Commun. Stat. Theory Methods 2010, 39, 1832–1846. [Google Scholar] [CrossRef]
- Gu, Y.-G.; Jiang, S.-J.; Jordan, R.W.; Huang, H.-H.; Wu, F.-X. Nonmetric multidimensional scaling and probabilistic ecological risk assessment of trace metals in surface sediments of Daya Bay (China) using diffusive gradients in thin films. Sci. Total Environ. 2023, 867, 161433. [Google Scholar] [CrossRef]
- Halkos, G.; Aslanidis, S.P.; Landis, C.; Papadaki, L.; Koundouri, P. A review of primary and cascading hazards by exploring individuals’ willingness-to-pay for urban sustainability policies. City Environ. Interact. 2024, 24, 100178. [Google Scholar] [CrossRef]
- Archana, B.; Ujwala, C. Public Perception of Biodiversity: A Literature Review of Its Role in Urban Green Spaces. J. Landsc. Ecol. 2021, 14, 1–28. [Google Scholar] [CrossRef]
- Datta, R. Sustainability: Through cross-cultural community garden activities. Local Environ. 2019, 24, 762–776. [Google Scholar] [CrossRef]


| Research Dimension | Keywords |
|---|---|
| Policy tools | Eco-compensation mechanism [32], government-led [33], market incentives [19,20,21], digital payment [23] |
| Behavioral drivers | Community participation [16], traditional culture [36], individual utility maximization [34], carbon footprint [37] |
| Technical approach | Questionnaire survey [15], structural equation modeling [13,14], discrete choice experiments [25], machine learning algorithms [3] |
| Controversies | Regional fairness [31], payment standards [29,30], moral license [34], payment instruments [35] |
| Category | Variable | Definition and Value |
|---|---|---|
| Basic information | Sex | 1 = “Male”, 2 = “Female” |
| Age | 1 = “18–40”, 2 = “40–60”, 3 = “≥60” | |
| Education level | 1 = “Junior high school and below”, 2 = “High School or technical school”, 3 = “Bachelor or junior college”, 4 = “Master or above” | |
| Perception of urban biodiversity | 1 = “Species”, 2 = “Quantity”, 3 = “Genetic information”, 4 = “Culture and folklore”, 5 = “Other” | |
| Visit characteristics | Frequency | 1 = “Other”, 2 = “Six months and more”, 3 = “Monthly”, 4 = “Weekly”, 5 = “Daily” |
| Distance | 1 = “Other”, 2 = “Within 10 min of driving”, 3 = “Within 10 min of biking”, 4 = “Within 15 min of walking”, 5 = “Within 5 min of walking” | |
| Biodiversity concerns | Birds | 1 = “1 species”, 2 = “2 species”, 3 = “3 species”, 4 = “4 species”, 5 = “5 species”, 6 = “6 species”, 7 = “7 species” |
| Other animals | 0 = “None”, 1 = “Worms, Abandoned pets”, 2 = “Other”, 3 = “Amphibians, Reptiles”, 4 = “Fish”, 5 = “Mammals” | |
| Environmental characteristics of parks | Tree coverage | 1 = “Very low”, 2 = “Dense”, 3 = “Low”, 4 = “High”, 5 = “Medium” |
| Plant landscape satisfaction | 1 = “Very dissatisfied”, 2 = “Dissatisfied”, 3 = “Average”, 4 = “Satisfied”, 5 = “Very satisfied” | |
| Willingness to protect biodiversity | Diversity | 1 = “Very poor”, 2 = “Poor”, 3 = “Fair”, 4 = “Good”, 5 = “Very good” |
| Effect | 1 = “Lower”, 2 = “Low”, 3 = “Average”, 4 = “High”, 5 = “Higher” | |
| Period | 1 = “No participation”, 2 = “Half a year or more”, 3 = “Once a season”, 4 = “Once a month”, 5 = “Once a week” | |
| Pay | 1 = “Within 50 yuan”, 2 = “50–500 yuan”, 3 = “500–2000 yuan”, 4 = “more than 2000 yuan” |
| Variable | Sample Size | Percentage | |
|---|---|---|---|
| Sex | Male | 811 | 43.02% |
| Female | 1074 | 56.98% | |
| Age | 18–40 | 985 | 52.25% |
| 40–60 | 733 | 38.89% | |
| ≥60 | 167 | 8.86% | |
| Education level | Junior high school and below | 380 | 20.16% |
| High school or technical school | 352 | 18.67% | |
| Bachelor or junior college | 1083 | 57.45% | |
| Master or above | 70 | 3.71% | |
| Occupation | Student | 29 | 1.54% |
| Government agent/officer/civil servant | 94 | 4.99% | |
| Business manager | 66 | 3.50% | |
| Company employee | 328 | 17.40% | |
| Professional | 22 | 1.17% | |
| Manual laborer | 59 | 3.13% | |
| Commercial employee | 196 | 10.40% | |
| Self-employed | 33 | 1.75% | |
| Freelancer | 114 | 6.05% | |
| Agriculture, forestry, fishery worker | 4 | 0.21% | |
| Retired | 152 | 8.06% | |
| Unemployed | 11 | 0.58% | |
| Other | 777 | 41.22% | |
| Variable | Df | Sum of Squares | Mean Squares | F Model | r2 | p-Value (>F) |
|---|---|---|---|---|---|---|
| Age | 3 | 0.1841 | 0.046034 | 4.1998 | 0.00868 | 0.001 *** |
| Sex | 1 | 0.0980 | 0.098022 | 8.9428 | 0.00462 | 0.001 *** |
| Education level | 3 | 0.1274 | 0.042483 | 3.8758 | 0.00601 | 0.004 ** |
| Residuals | 1877 | 20.7930 | 0.010961 | 0.98068 | ||
| Total | 1885 | 21.2026 | 1.00000 |
| Variable | NMDS1 | NMDS2 | r2 | p-Value (>r) |
|---|---|---|---|---|
| Perception of urban biodiversity | –0.29093 | 0.95675 | 0.0139 | 0.001 *** |
| Frequency | –0.95420 | –0.29916 | 0.0849 | 0.001 *** |
| Distance | –0.97560 | –0.21954 | 0.0194 | 0.001 *** |
| Birds | –0.00358 | 0.99999 | 0.0045 | 0.009 ** |
| Other animals | –0.00358 | 0.99999 | 0.0045 | 0.009 ** |
| Tree coverage | –0.29925 | 0.95417 | 0.0492 | 0.001 *** |
| Plant landscape satisfaction | –0.56994 | 0.82169 | 0.3242 | 0.001 *** |
Disclaimer/Publisher’s Note: The statements, opinions and data contained in all publications are solely those of the individual author(s) and contributor(s) and not of MDPI and/or the editor(s). MDPI and/or the editor(s) disclaim responsibility for any injury to people or property resulting from any ideas, methods, instructions or products referred to in the content. |
© 2025 by the authors. Licensee MDPI, Basel, Switzerland. This article is an open access article distributed under the terms and conditions of the Creative Commons Attribution (CC BY) license (https://creativecommons.org/licenses/by/4.0/).
Share and Cite
Jin, M.; Hu, L.; Hu, G.; Guo, J. Pursuing Ecological and Social Co-Benefits: Public Hierarchical Willingness for Biodiversity Conservation in Urban Parks. Sustainability 2025, 17, 4201. https://doi.org/10.3390/su17094201
Jin M, Hu L, Hu G, Guo J. Pursuing Ecological and Social Co-Benefits: Public Hierarchical Willingness for Biodiversity Conservation in Urban Parks. Sustainability. 2025; 17(9):4201. https://doi.org/10.3390/su17094201
Chicago/Turabian StyleJin, Minli, Lihui Hu, Guang Hu, and Jing Guo. 2025. "Pursuing Ecological and Social Co-Benefits: Public Hierarchical Willingness for Biodiversity Conservation in Urban Parks" Sustainability 17, no. 9: 4201. https://doi.org/10.3390/su17094201
APA StyleJin, M., Hu, L., Hu, G., & Guo, J. (2025). Pursuing Ecological and Social Co-Benefits: Public Hierarchical Willingness for Biodiversity Conservation in Urban Parks. Sustainability, 17(9), 4201. https://doi.org/10.3390/su17094201