
Integrating Cross-Regional Ecological Networks in Blue–Green Spaces: A Spatial Planning Approach for the Yangtze River Delta Demonstration Area


Abstract
1. Introduction
2. Materials and Methods
2.1. Study Area and Date
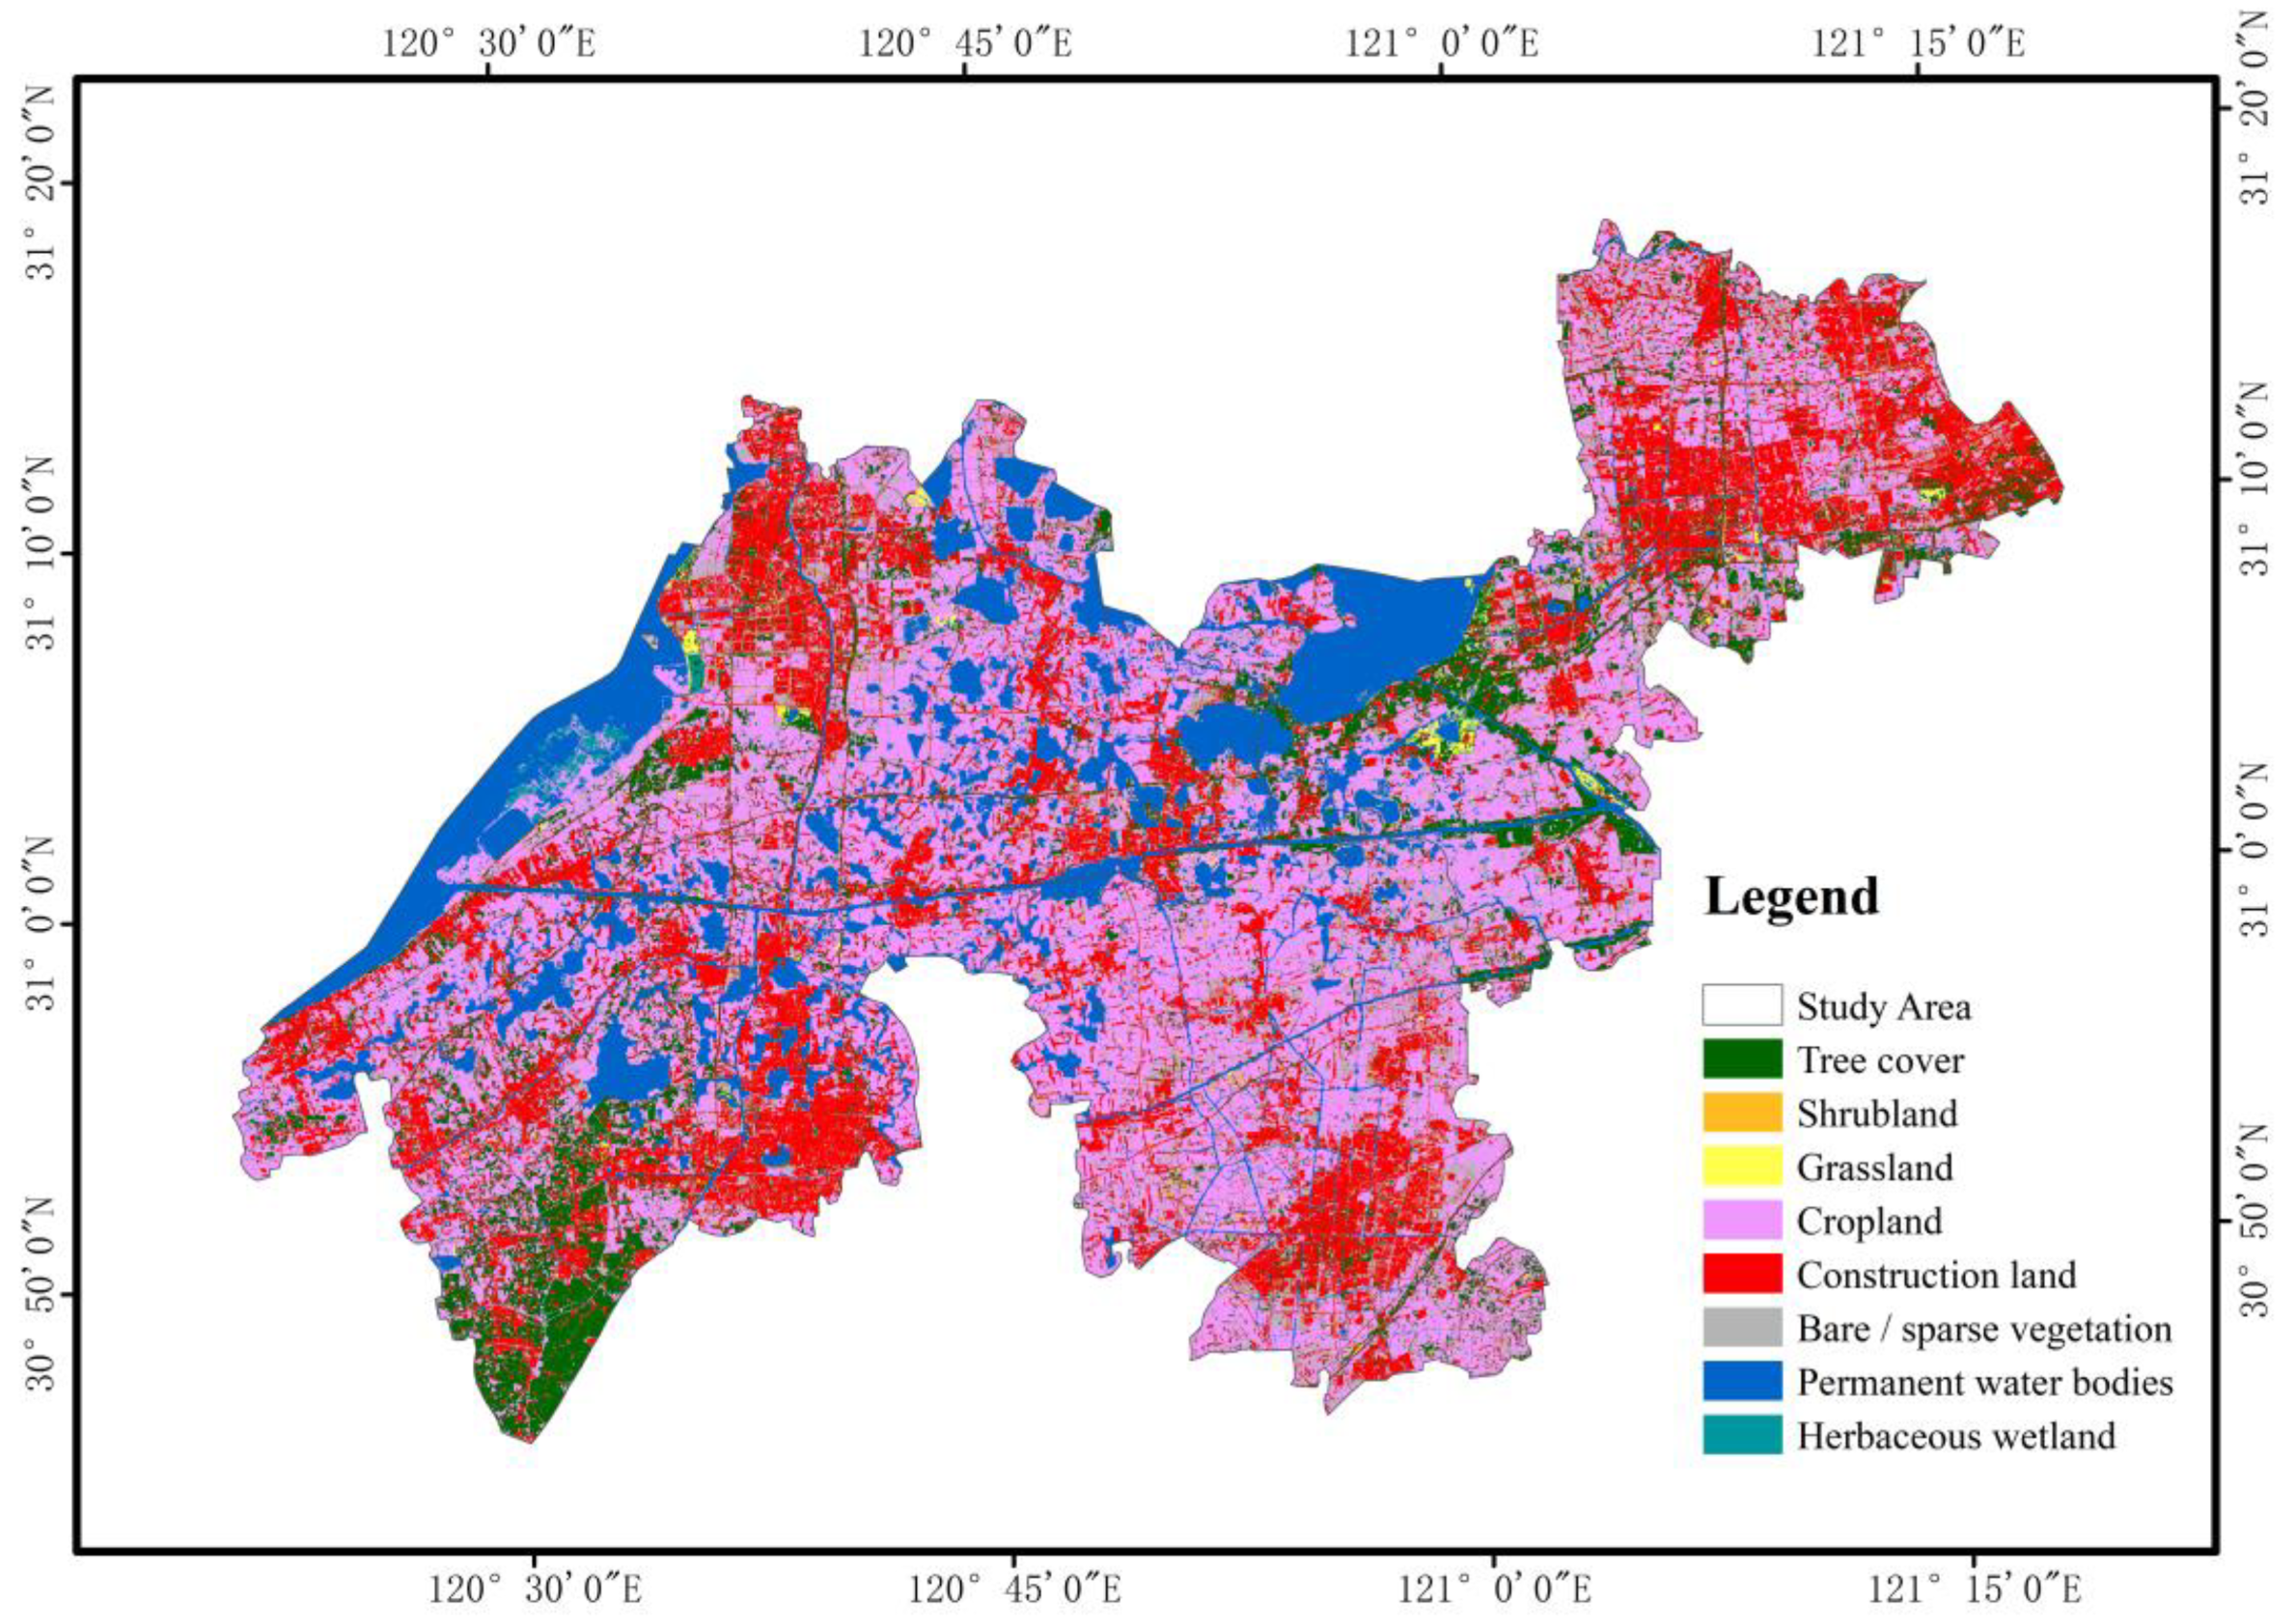
2.1.1. Study Area
2.1.2. Data Source
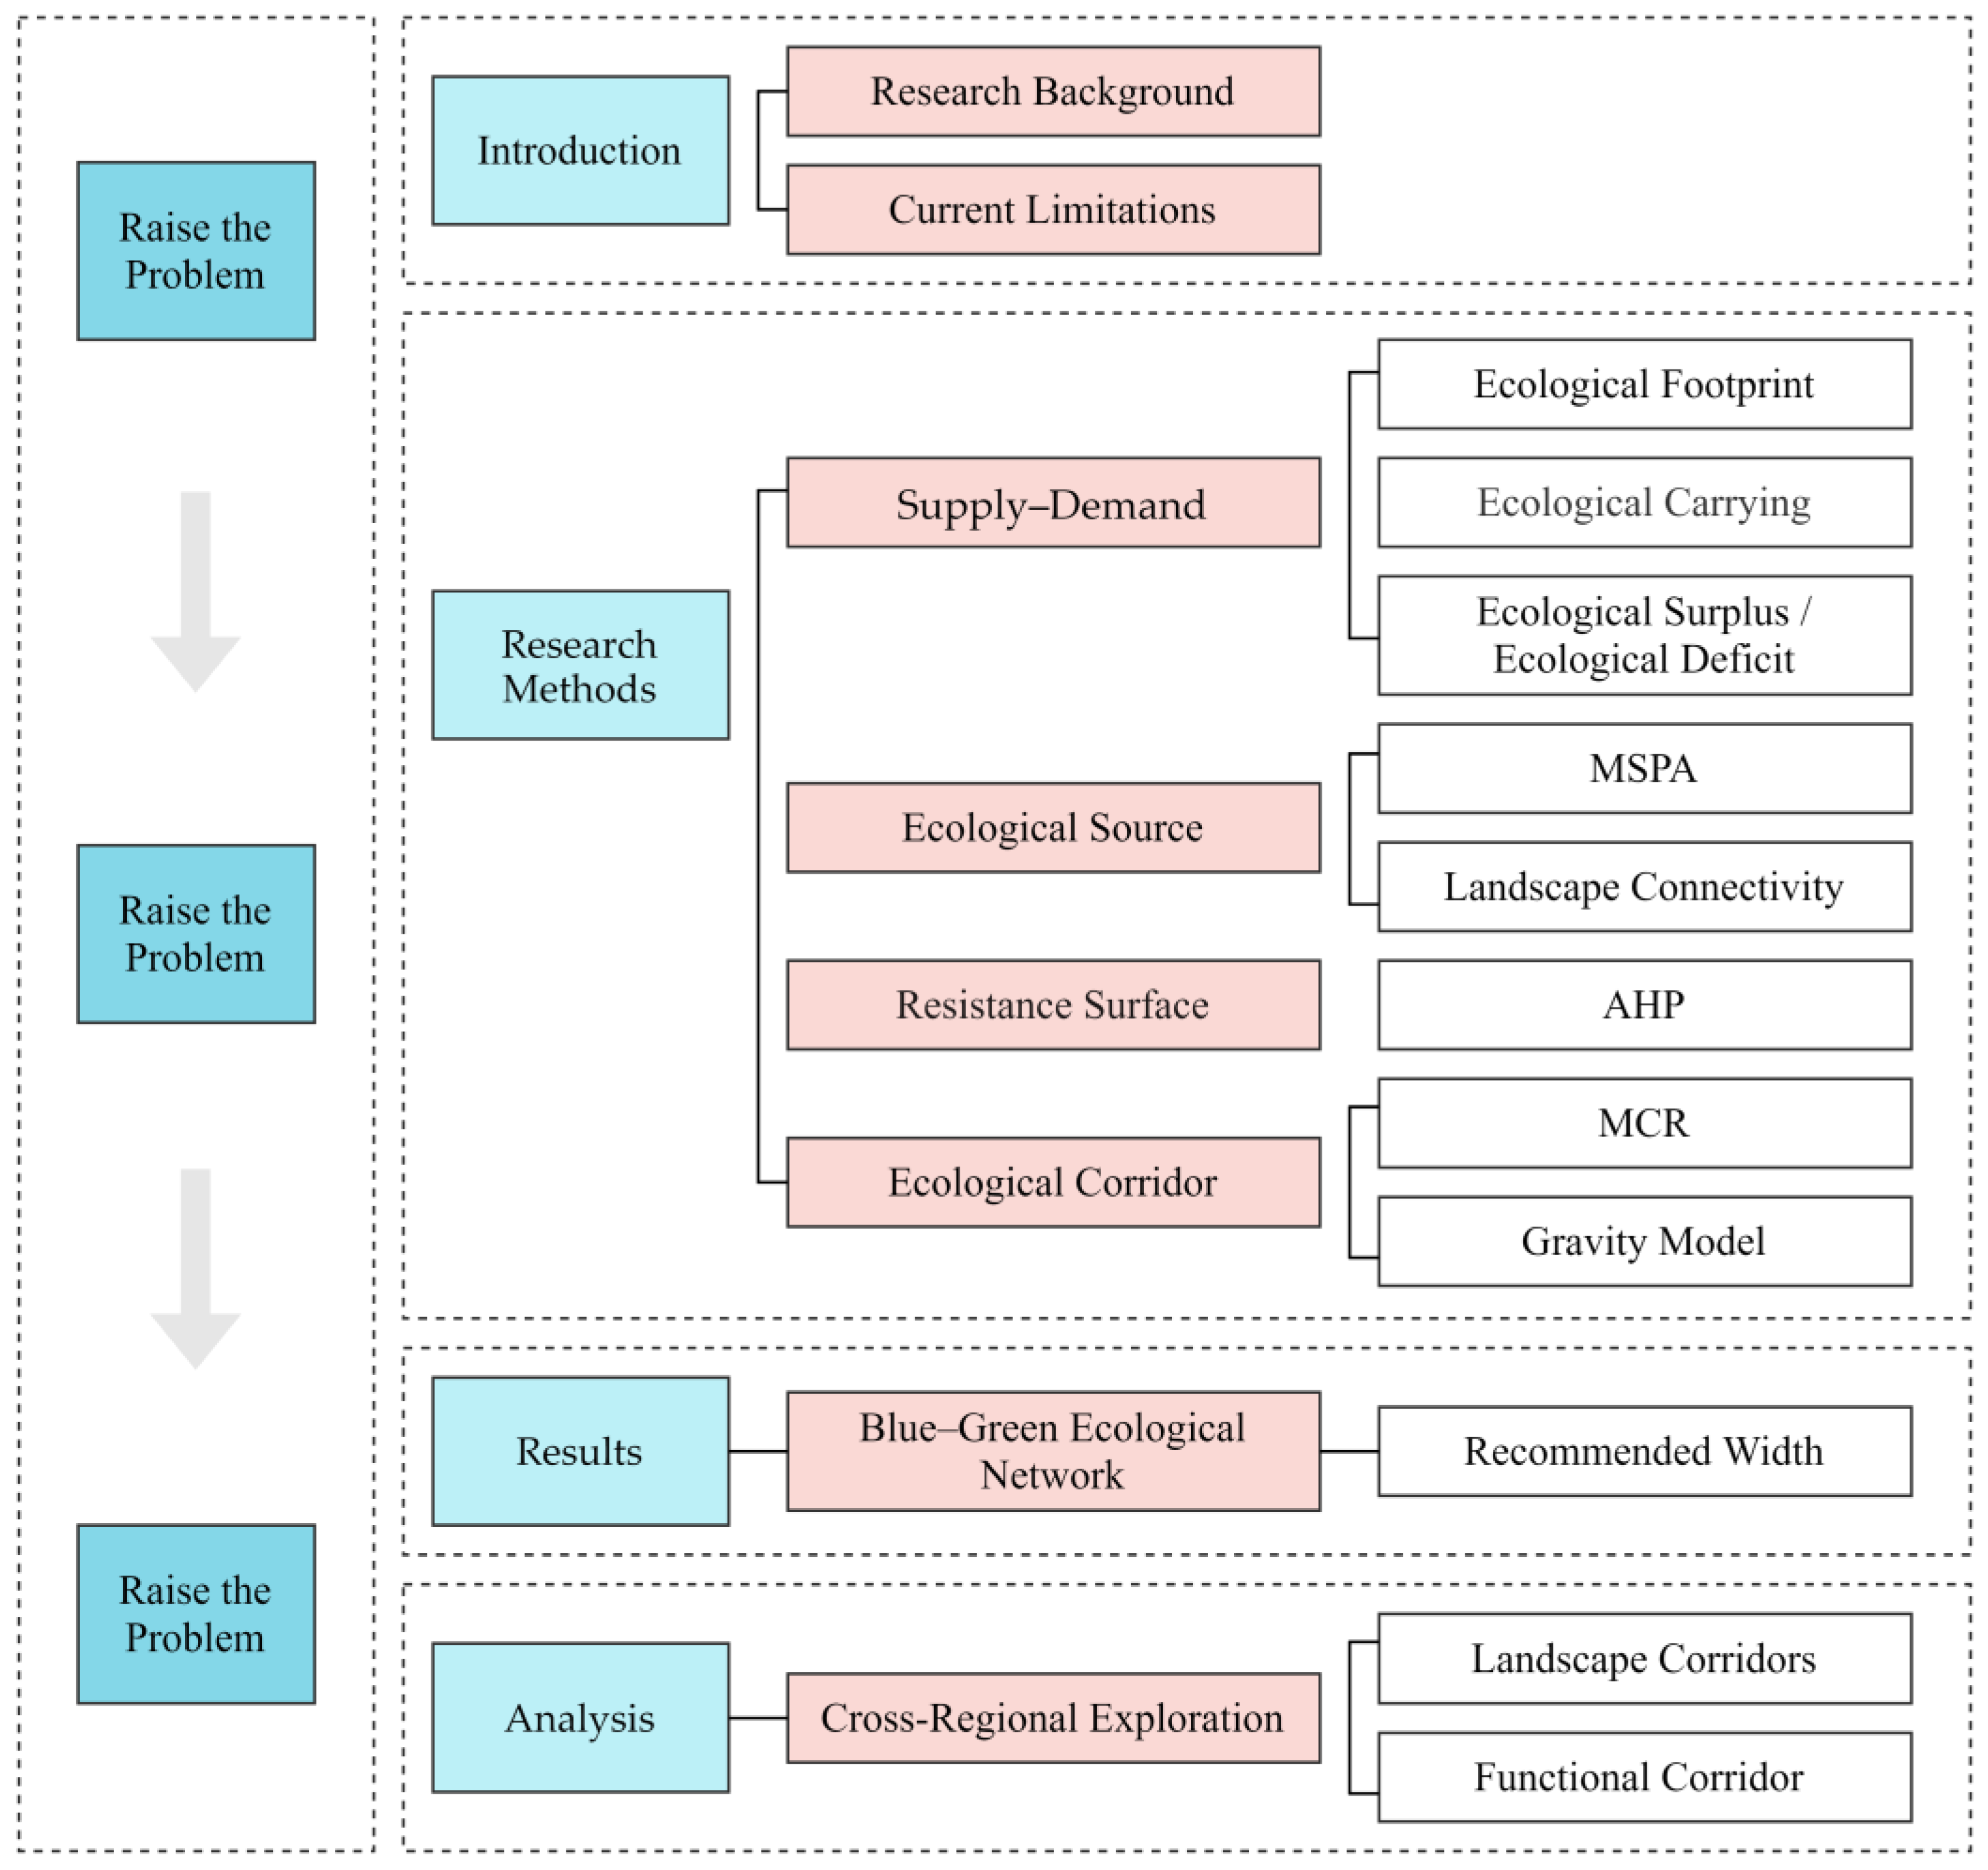
2.2. Research Methods
2.2.1. Ecological Footprint Supply–Demand Analysis Method
2.2.2. Method for Identifying Ecological Sources Based on MSPA and Landscape Connectivity
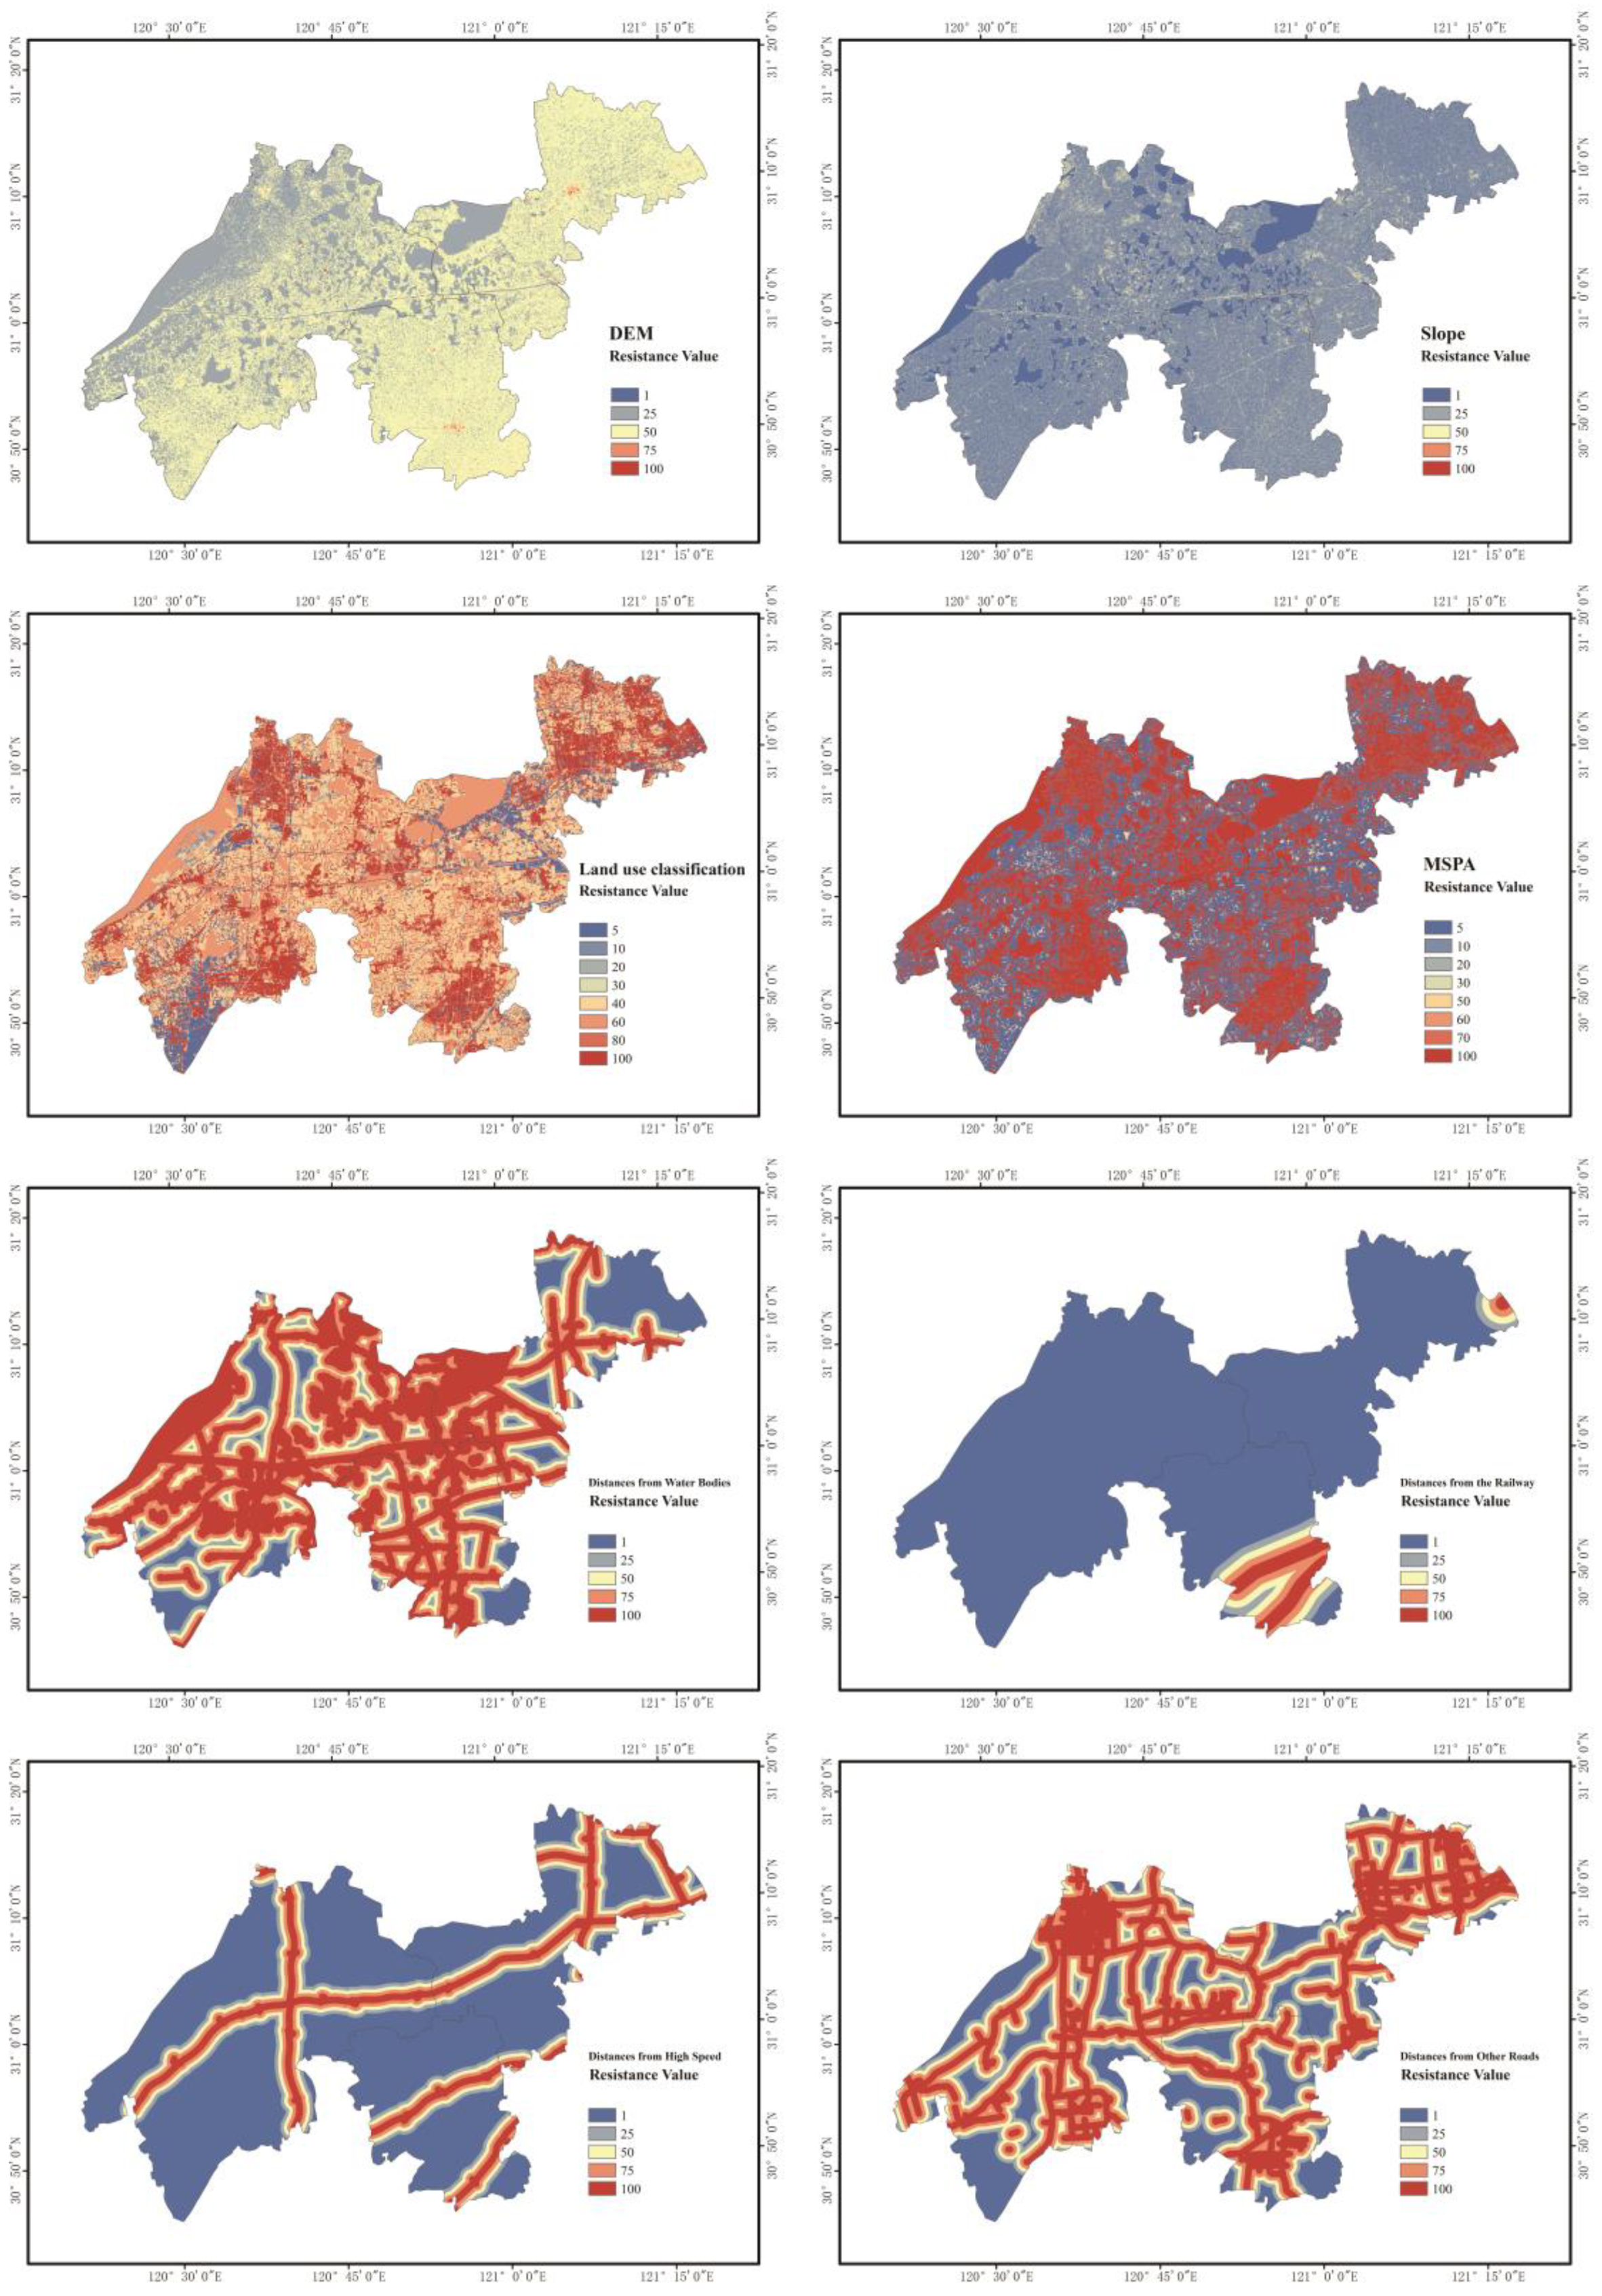
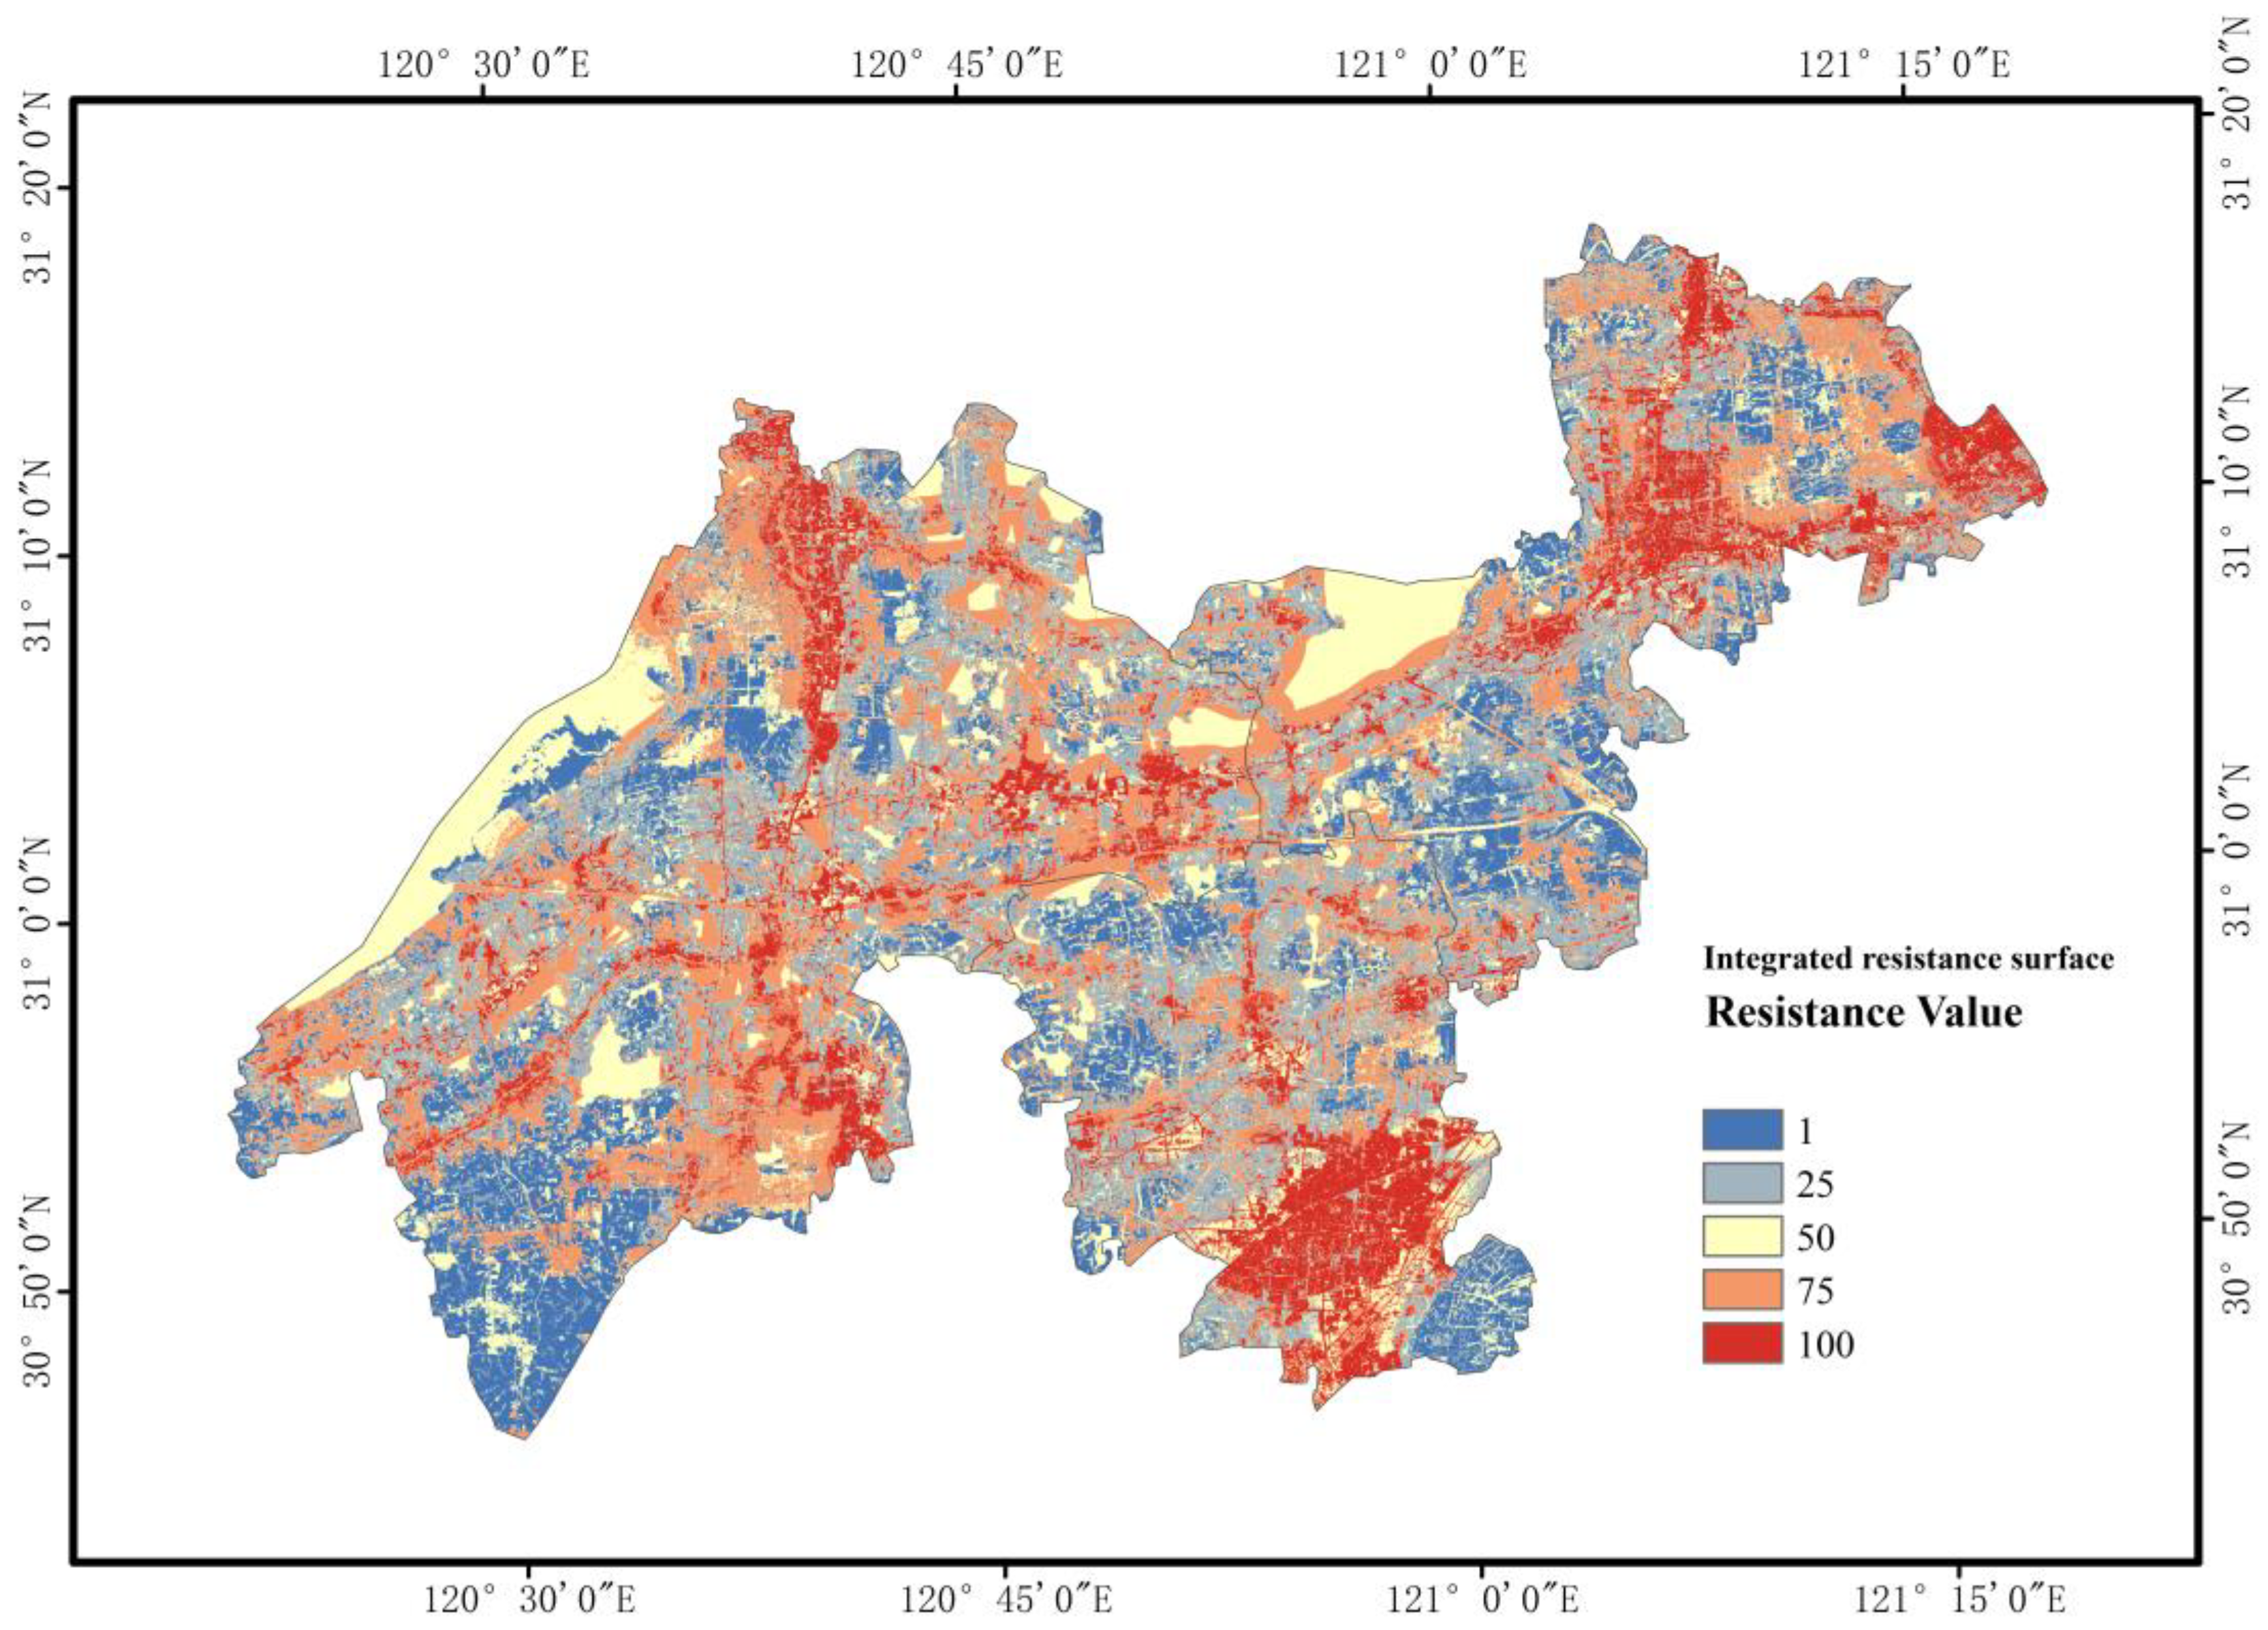
2.2.3. Resistance Surface Construction Method Based on AHP
2.2.4. Ecological Corridor Construction Method Based on MCR and Gravity Models
3. Results
3.1. Land Use Status Analysis of Demonstration Area
3.2. Results of Supply–Demand Relationship Analysis Based on Ecological Footprint
3.2.1. Supply and Demand Results Based on Ecological Footprint and Ecological Carrying Capacity
3.2.2. Evaluation Results of Supply–Demand Relationship Based on ED
3.3. Results of Ecological Source Identification Based on MSPA and Landscape Connectivity
3.3.1. Results of Ecological Source Identification Based on MSPA
3.3.2. Results of Ecological Source Selection Based on Landscape Connectivity
3.4. Ecological Network Construction and Analysis
3.4.1. Results of Resistance Surface Construction Based on AHP
3.4.2. Ecological Corridors Identified Using MCR and Gravity Models
3.4.3. Results of Blue–Green Ecological Network in Demonstration Area
3.5. Cross-Regional Exploration of the Demonstration Area from the Perspective of Territorial Spatial Planning
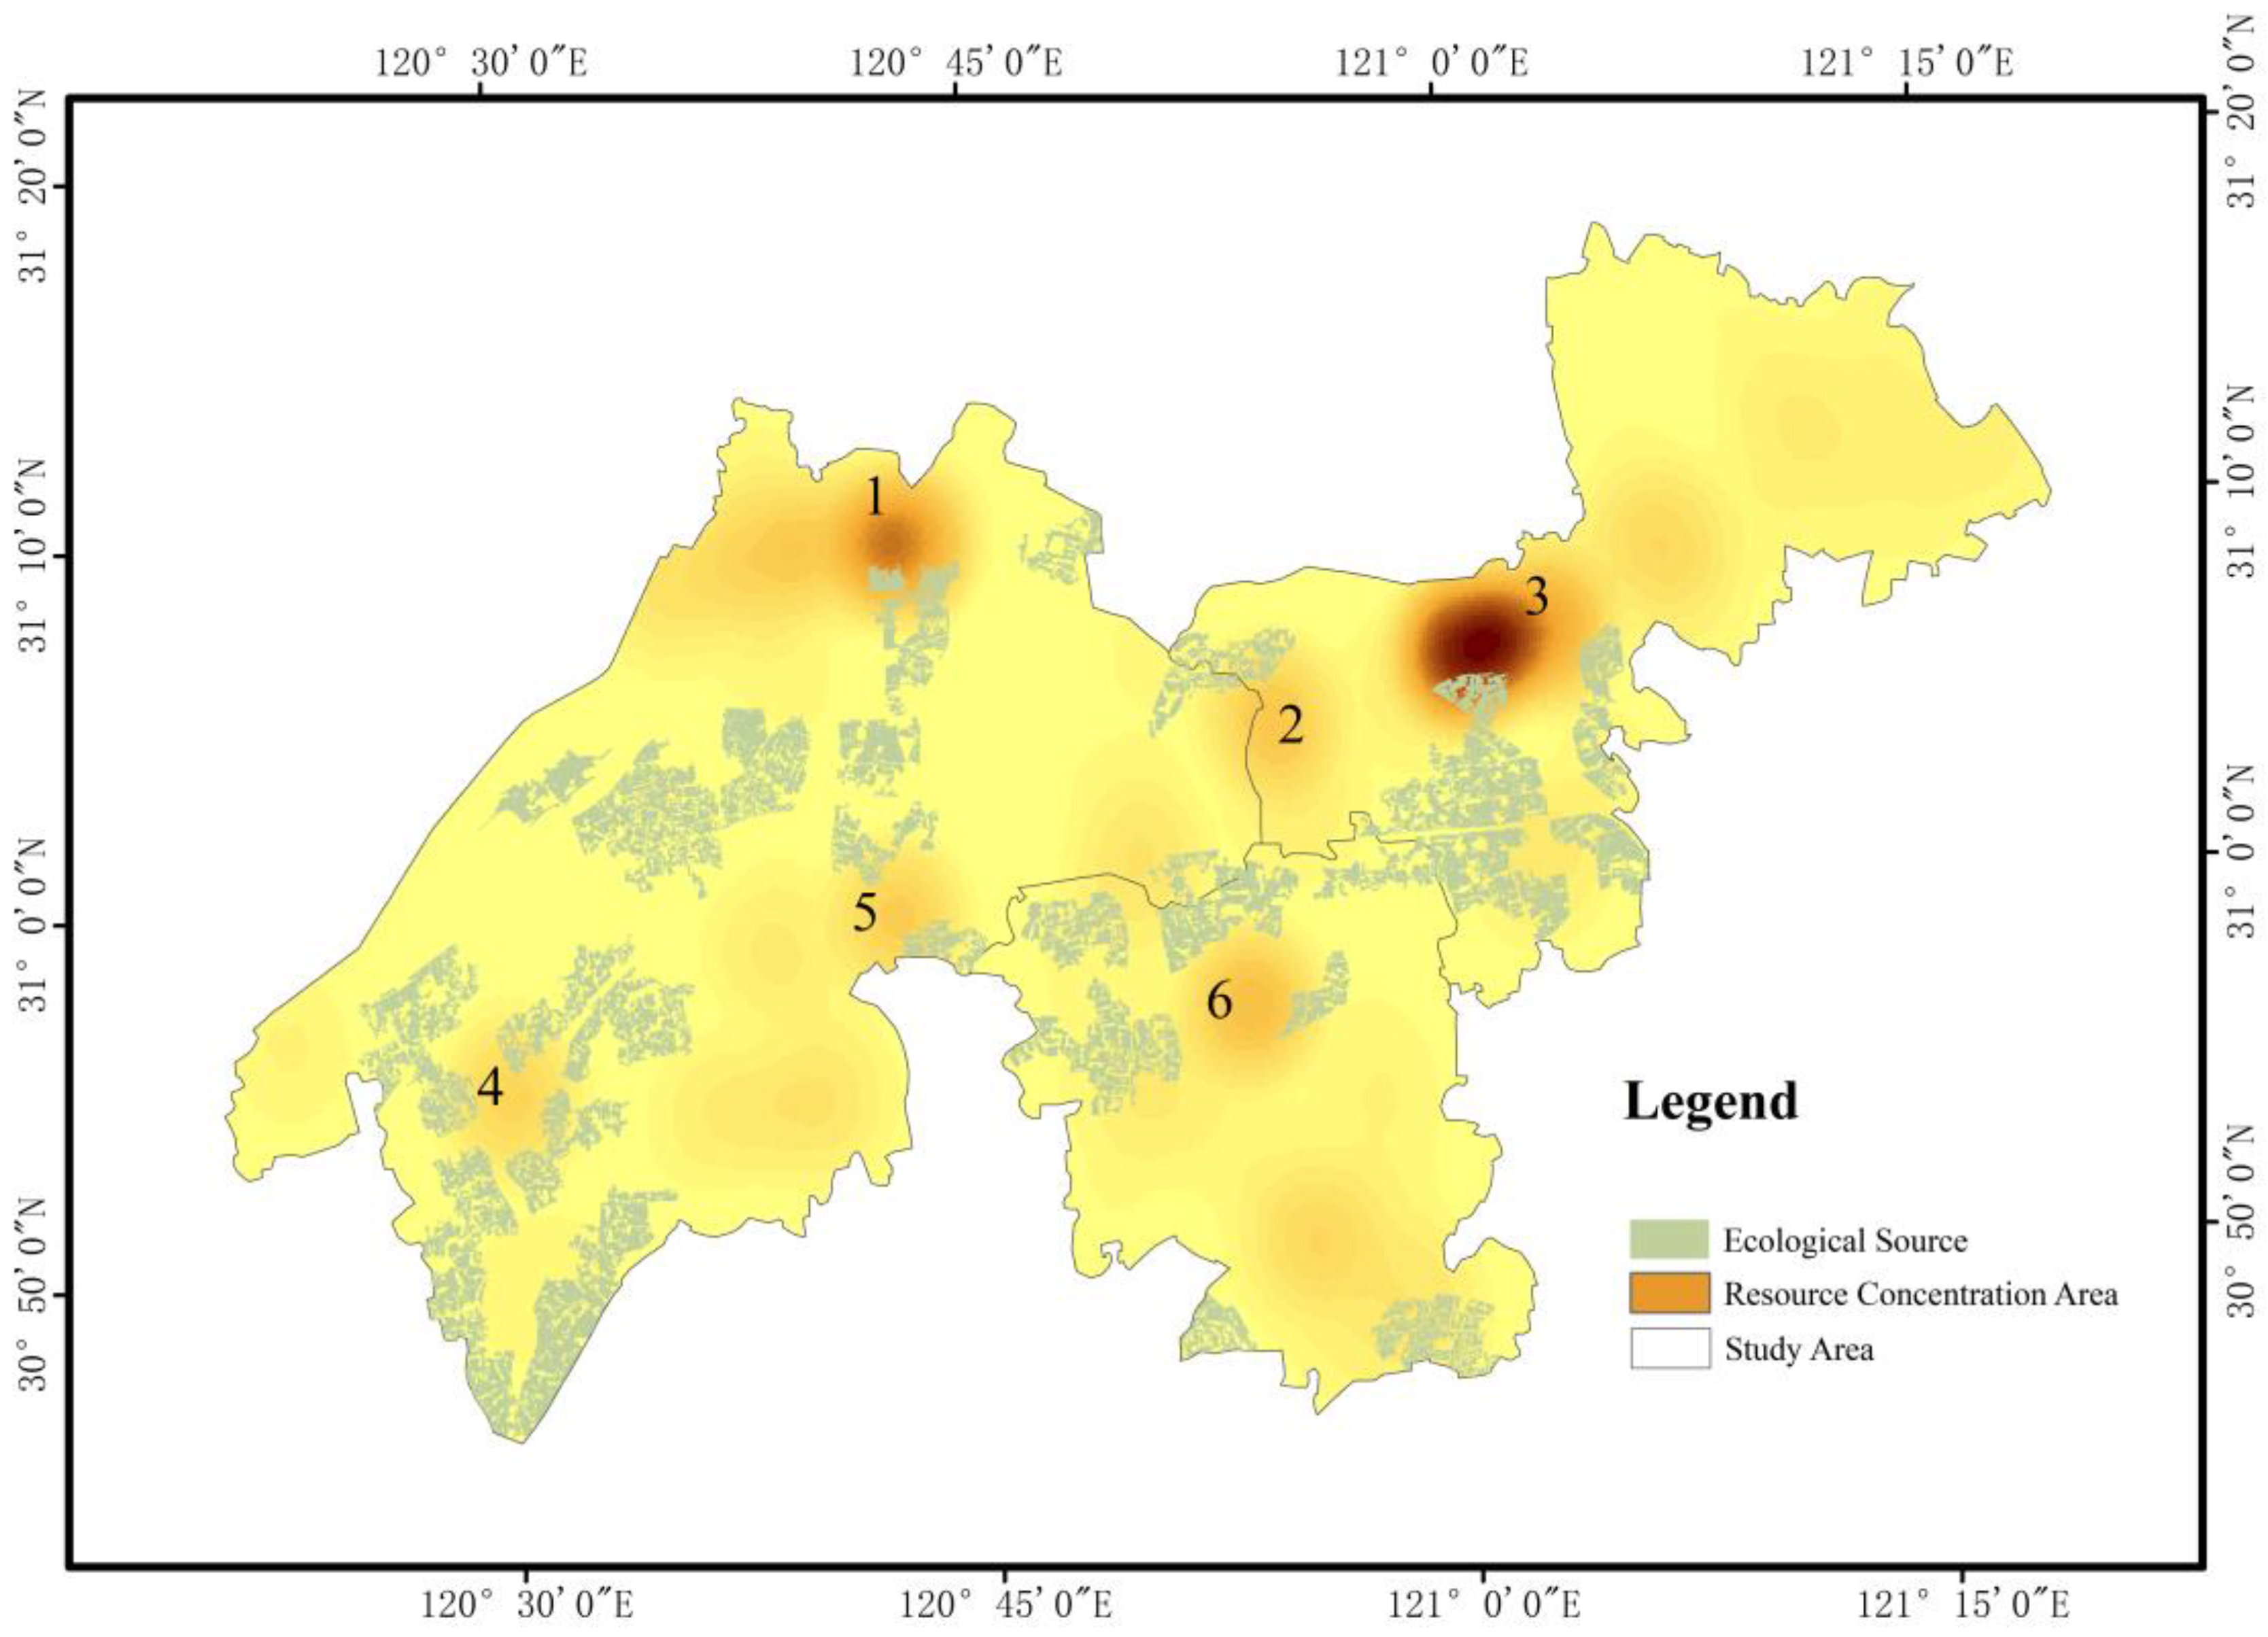
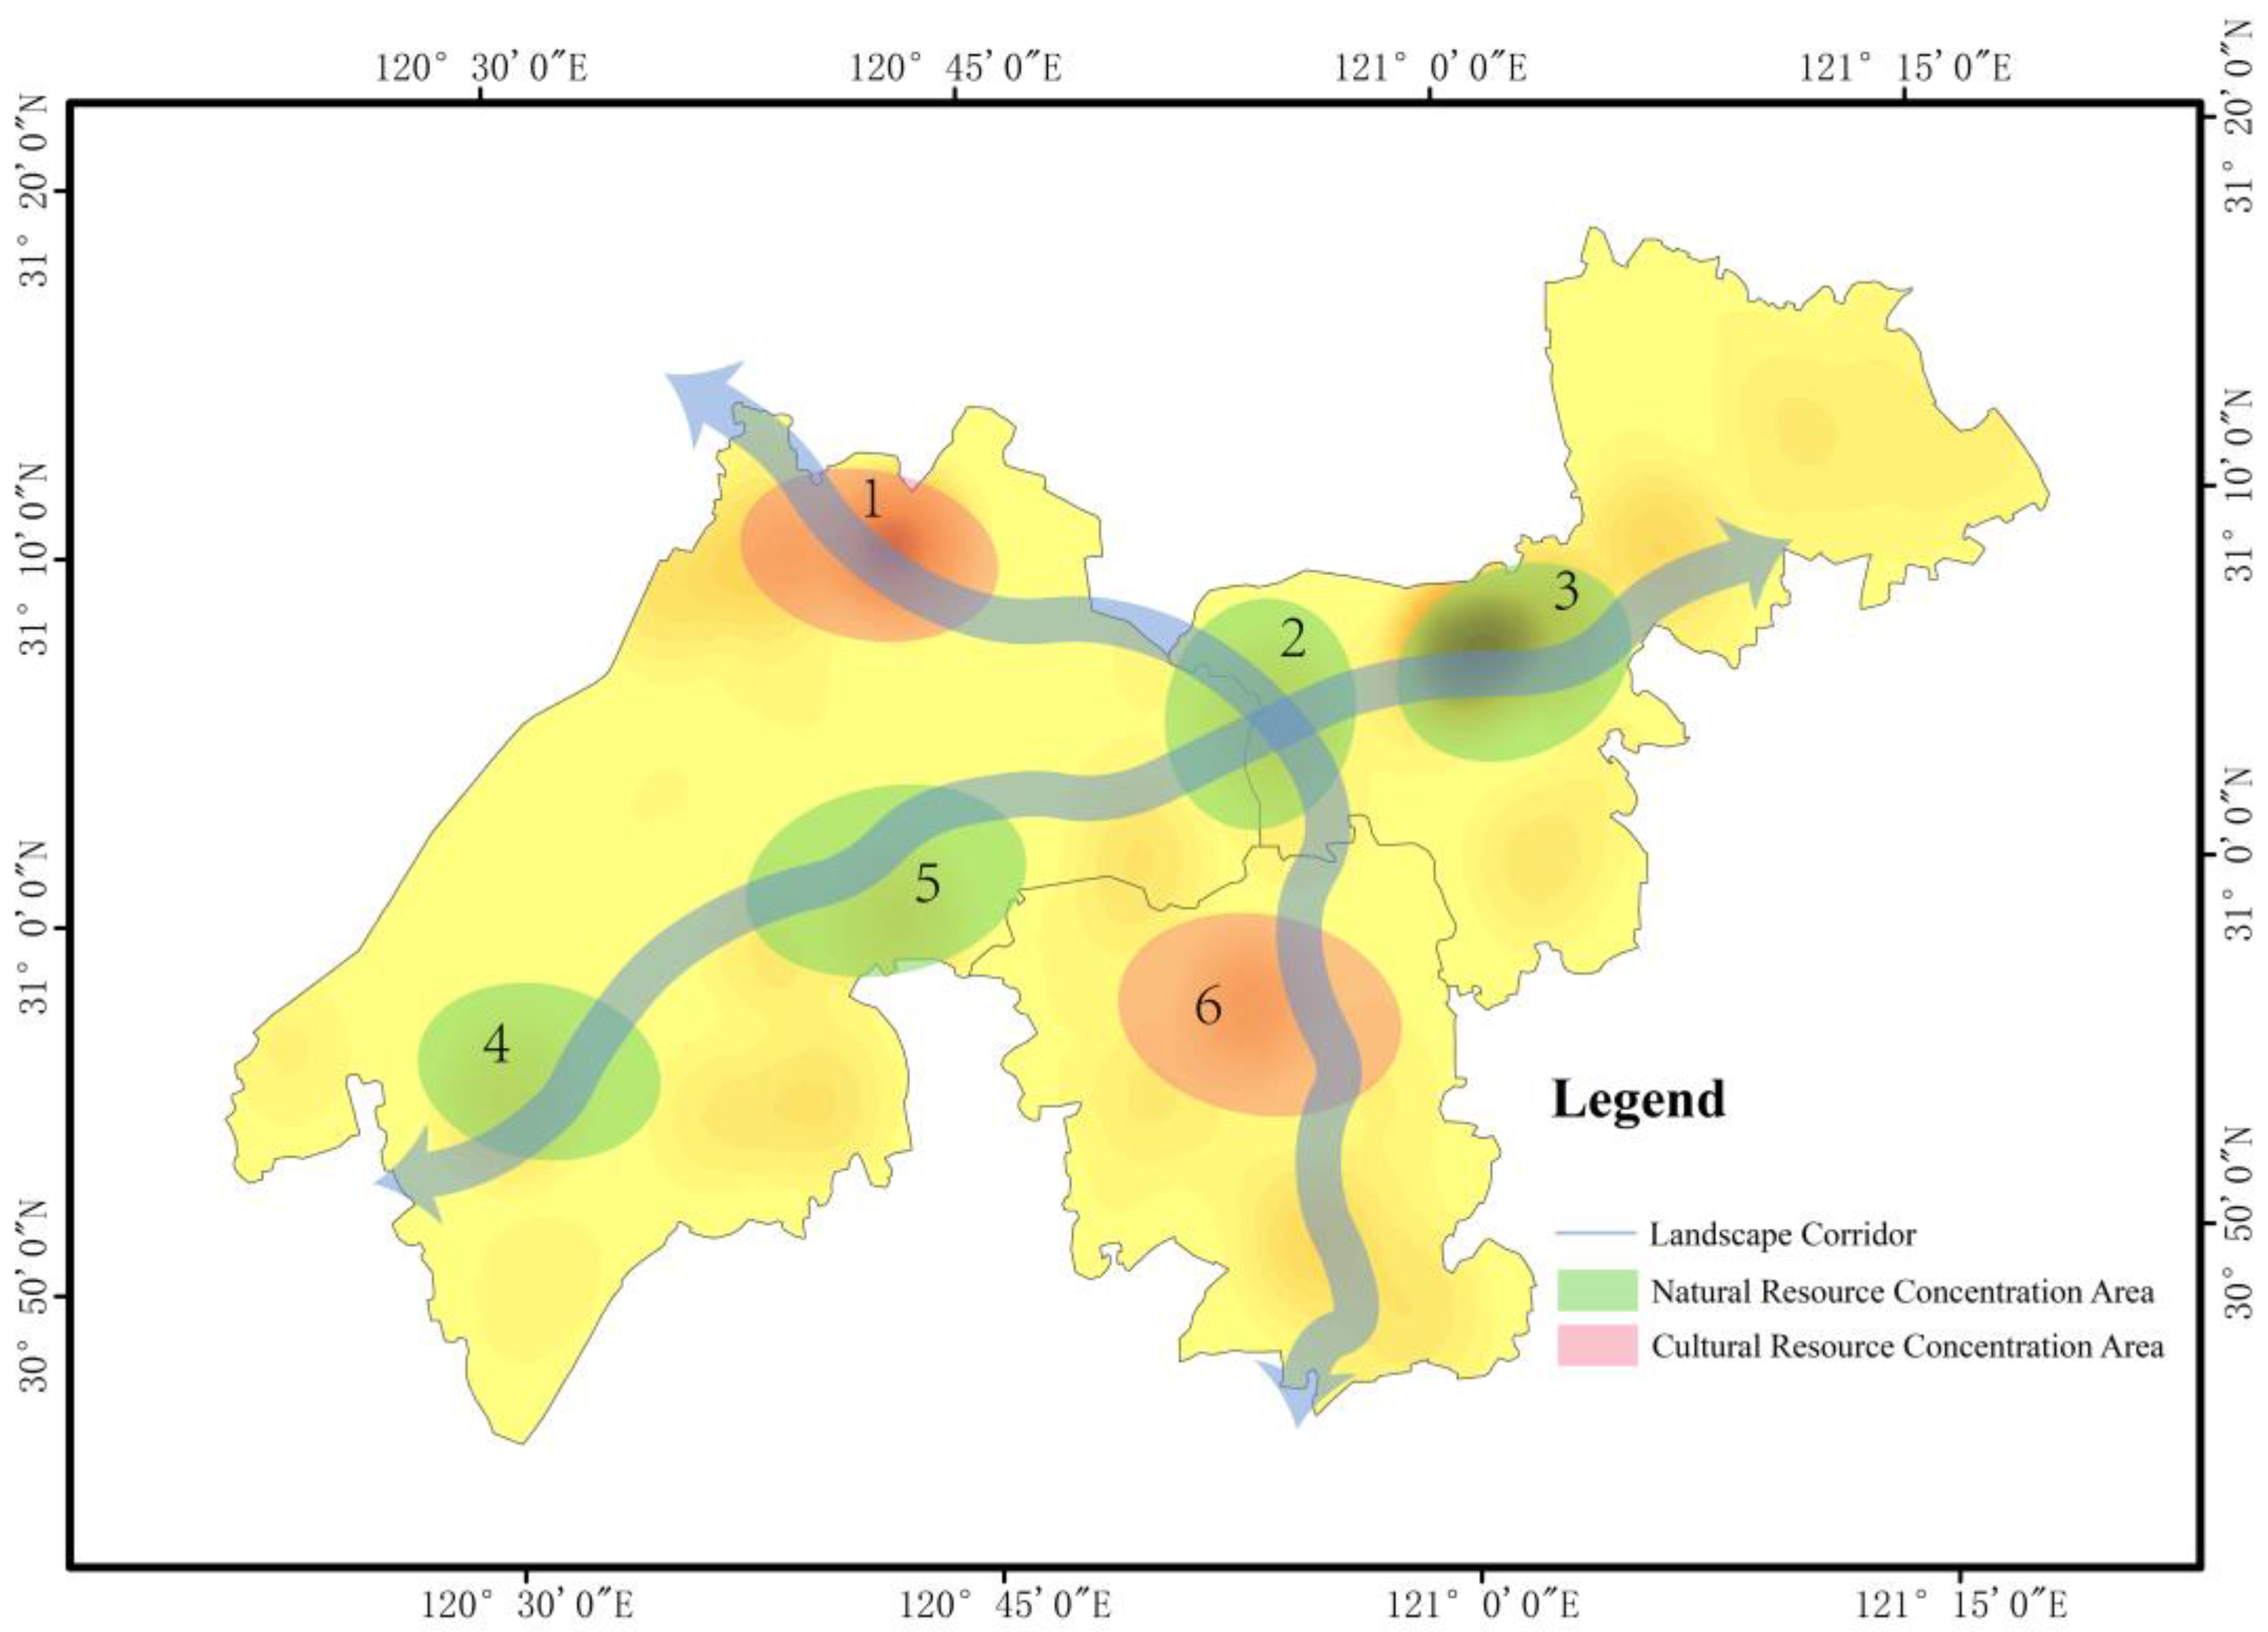
3.5.1. Analysis of Landscape Corridors Based on Natural and Cultural Resources
3.5.2. Corridor Analysis Based on Current Functional Characteristics of Ecological Source Areas
4. Discussion
4.1. Discussion of Research Results
4.2. Shortcomings and Limitations of Research Contributions
5. Conclusions
Author Contributions
Funding
Data Availability Statement
Conflicts of Interest
References
- Wang, R.; Wang, L.; Cao, Q.; Niu, Z. Spatio-temporal variation of ecosystem health and its driving factors analysis in Yangtze River Basin. Resour. Environ. Yangtze Basin 2024, 1–23. [Google Scholar]
- Xia, J.; Li, Z.; Zeng, S.; Zou, L.; She, D.; Cheng, D. Perspectives on eco-water security and sustainable development in the Yangtze River Basin. Geosci. Lett. 2021, 8, 18. [Google Scholar] [CrossRef]
- Du, X.; Lyu, F.; Wang, C.; Yu, Z. Construction od ecological network based on MSPA-Conefor-MCR at the county scale:A case study in Yanqing District, Beijing, China. Chin. J. Appl. Ecol. 2023, 34, 1073–1082. [Google Scholar] [CrossRef]
- Peng, J.; Zhao, H.; Liu, Y.; Wu, J. Research progress and prospect on regional ecological security pattern construction. Geogr. Res. 2017, 36, 407–419. [Google Scholar]
- Long, J. Construction of the Blue and Green Ecological Network of Linli County Based on GIS. Master’s Thesis, Central South University of Forestry and Technology, Changsha, China, 2022. [Google Scholar]
- Liu, Z.; Wu, W.; Liu, W.; Shen, L. Study on construction land reduction based on "Source-Corridor" ecological security pattern paradigm. Acta Ecol. Sin. 2020, 40, 8230–8238. [Google Scholar]
- Li, L.; Fu, M.; Zhu, Y.; Kang, H.; Wen, H. The current situation and trend of land ecological security evaluation from the perspective of global change. Ecol. Indic. 2024, 167, 112608. [Google Scholar] [CrossRef]
- Yu, Y.; Li, J.; Han, L.; Zhang, S. Research on ecological compensation based on the supply and demand of ecosystem services in the Qinling-Daba Mountains. Ecol. Indic. 2023, 154, 110687. [Google Scholar] [CrossRef]
- Qi, F.; Liu, J.; Gao, H.; Fu, T.; Wang, F. Characteristics and spatial–temporal patterns of supply and demand of ecosystem services in the Taihang Mountains. Ecol. Indic. 2023, 147, 109932. [Google Scholar] [CrossRef]
- Liang, k.; Jin, X.; Zhang, X.; Song, J.; Li, Q.; Ying, S.; Qi, Z.; Zhou, Y. Construction of ecological security patterns coupling supply and demand of ecosystem services: A case study of Southern Jiangsu Province. Acta Ecol. Sin. 2024, 44, 3880–3896. [Google Scholar]
- Gao, X.; Song, Z.; Li, C.; Tang, H. Landscape Pattern Optimization in Baiyangdian Basin Based on Landscape Ecological Risk Assessment. J. Ecol. Rural. Environ. 2023, 39, 174–183. [Google Scholar]
- Ma, Y.; Zheng, M.; Zheng, X.; Guo, W.; Liu, M.; Li, J.; Zhu, B. Prediction and spatiotemporal evolution analysis of green infrastructure based on CA–Markov and MSPA: A case study of Beijing–Tianjin–Hebei urban agglomeration. Acta Ecol. Sin. 2023, 43, 6785–6797. [Google Scholar]
- Liu, X.; Li, X.; Li, Y.; Zhao, S.; Dai, Z.; Duan, M. Construction and optimization of ecological network in rapidly urbanized area: A case study of Daxing District, Beijing. Acta Ecol. Sin. 2023, 43, 8321–8331. [Google Scholar]
- Yu, K. Ecologically Strategic Points in Landscape and Surface Model. Acta Geogr. Sin. 1998, 53, 11–20. [Google Scholar]
- Zhang, L.; Yue, W.; Chen, Y. Construction of urban ecological security pattern based on of patch composite characteristics: A case study of Hangzhou. Acta Ecol. Sin. 2021, 41, 4632–4640. [Google Scholar]
- Yao, C.; He, Y.; Cheng, J.; Zhang, T.; Pan, H.; Ma, H. Evaluation of ecological security pattern and optimization suggestions in Minjiang River Basin based on MCR model and gravity model. Acta Ecol. Sin. 2023, 43, 7083–7096. [Google Scholar] [CrossRef]
- Li, Q.; Tang, L.; Qiu, Q.; Li, S.; Xu, Y. Construction of urban ecological security pattern based on MSPA and MCR Model: A case study of Xiamen. Acta Ecol. Sin. 2024, 44, 2284–2294. [Google Scholar] [CrossRef]
- Wang, Y.; Jin, X.; Shen, C.; Bao, G.; Liu, J.; Zhou, Y. Establishment of an ecological security pattern in the eastern developed regions:A case study of Sunan District. Acta Ecol. Sin. 2019, 39, 2298–2310. [Google Scholar]
- Shen, Q.; Lin, M.; Mo, H.; Huang, Y.; Hu, X.; Wei, L.; Zheng, Y.; Lu, D. Ecological network construction and optimization in Foshan City, China. Chin. J. Appl. Ecol. 2021, 32, 3288–3298. [Google Scholar]
- Yang, X.; Xiao, H.; Wang, Y. Construction, Optimization and Synergistic Governance of the Ecological Network of Urban Agglomeration in the Middle Reaches of the Yangtze River. J. Soil Water Conserv. 2024, 38, 300–309. [Google Scholar] [CrossRef]
- Chen, Q. Resilient design of blue-green spaces in urban road green systems: A case study of Pan Yuan Road on Changxing Island, Shanghai. Hous. Real Estate Res. 2023, 29, 95–97. [Google Scholar]
- Bao, Y. Research on the Resource and Environment Carrying Capacity Based on the Three-Dimensional Footprint Family. Master’s Thesis, Shanghai Normal University, Shanghai, China, 2021. [Google Scholar]
- Zhu, Q.; Yu, K.; Li, D. The width of ecological corridor in landscape planning. Chin. J. Ecol. 2005, 25, 2406–2412. [Google Scholar]
- Rees, W.E. Ecological footprints and appropriated carrying capacity: What urban economics leaves out. Environ. Urban. 1992, 4, 121–130. [Google Scholar] [CrossRef]
- Rees, W.; Wackernagel, M. Urban ecological footprints: Why cities cannot be sustainable—And why they are a key to sustainability. Environ. Impact Assess. Rev. 1996, 16, 223–248. [Google Scholar] [CrossRef]
- Wei, L.; Li, L.; Lin, Y.; Wu, Y.; Qi, X. Evaluation of the ecological security of Urban Agglomeration on Min Delta based on ecological footprint. Acta Ecol. Sin. 2018, 38, 4317–4326. [Google Scholar]
- Zhao, L.; Yang, F.; Wang, N.; Lu, X.; Li, H.; Wang, L. Research on Sustainable Development and Its Influencing Factors of Renhuai City Based on Ecological Footprint Model. J. Ecol. Rural. Environ. 2021, 37, 870–876. [Google Scholar] [CrossRef]
- Shang, Q.; Yin, K.; Fan, X.; Mi, W. Research on the Sustainable Development of Ecological Economy in Yinchuan. Ecol. Econ. 2021, 37, 86–91. [Google Scholar]
- Mao, Y.; Xu, F.; Gao, Y.; Huang, K.; Li, X.; Hu, H. Construction and planning application of blue-green ecological network in Ruzhou City based on morphological spatial pattern analysis (MSPA). Chin. J. Appl. Ecol. 2023, 34, 2226–2236. [Google Scholar] [CrossRef]
- Guan, D.; Jiang, Y.; Yan, L.; Zhou, J.; He, X.; Yin, B.; Zhou, L. Calculation of ecological compensation amount Yangtze River Basin based on ecological footprint. Acta Ecol. Sin. 2022, 42, 8169–8183. [Google Scholar]
- Zhou, Y. Ecological Security Assessment of Taihu Lake Basin Based on Improved Ecological Footprint Model. Master’s Thesis, Suzhou University of Science and Technology, Suzhou, China, 2022. [Google Scholar]
- Yu, Y.; Yin, H.; Kong, F.; Wang, J.; Xu, W. Analysis of the temporal and spatial pattern of the green infrastructure network in Nanjing, based on MSPA. Chin. J. Appl. Ecol. 2016, 35, 1608–1616. [Google Scholar]
- Wang, Y.; Lin, J. The Transformation of Planning Ideas and the Exploration of Planning Methods of Urban Green Space Ecological Network Based on MSPA. Chin. Landsc. Archit. 2017, 33, 68–73. [Google Scholar]
- Huang, H.; Yu, K.; Gao, Y.; Liu, J. Building Green Infrastructure Network of Fuzhou Using MSPA. Chin. Landsc. Archit. 2019, 35, 70–75. [Google Scholar] [CrossRef]
- Taylor, P.D.; Fahrig, L.; Henein, K.; Merriam, G. Connectivity is a vital element of landscape structure. Oikos 1993, 68, 571–573. [Google Scholar] [CrossRef]
- Wu, C.; Zhou, Z.; Wang, P.; Xiao, W.; Teng, M. The concept and measurem of landscape connectivity and its applications. Acta Ecol. Sin. 2010, 30, 1903–1910. [Google Scholar]
- Bentrup, G. Conservation Buffers Design Guidelines for Buffers, Corridors, and Greenways. U.S. Department of Agriculture, Forest Service, Southern Research Station: Asheville, NC, USA, 2008. [Google Scholar]
- Vogt, P.; Ferrari, J.R.; Lookingbill, T.R.; Gardner, R.H.; Riitters, K.H.; Ostapowicz, K. Mapping functional connectivity. Ecol. Indic. 2009, 9, 64–71. [Google Scholar] [CrossRef]
- Saaty, T.L. A Scaling Method for Priorities in Hierarchical Structures. J. Math. Psychol. 1977, 15, 234–281. [Google Scholar] [CrossRef]
- Wu, D.; Jiang, Q.; Gu, Z.; Zhang, S.; Fu, C. Evaluation of Eco-Geological Environment Quality in Strait Coastal Areas Based on AHP: Taking Southwest Coastal Areas of Malaysia on the North Coast of the Malacca Strait as an Example. J. Jilin Univ. (Earth Sci. Ed.) 2024, 54, 519–632. [Google Scholar]
- Huang, C.; Yin, X.; Huang, G.; Yuan, S.; Wang, J.; Lai, Y. Construction of Ecological Security Pattern of Tong’an District, Xiamen City. Trop. Geogr. 2018, 38, 874–883. [Google Scholar] [CrossRef]
- Hu, Y. Study on the Construction of Ecological Security Pattern in Lichuan City Based on the Minimum Cumulative Resistance Model. Master’s Thesis, Hubei Minzu University, Enshi, China, 2023. [Google Scholar]
- Li, Q.; Jin, X.; Zhang, X.; Han, B.; Li, H.; Zhou, Y. Comparison and evaluation of the ecological network construction method based on principles of landscape ecology. Acta Ecol. Sin. 2023, 43, 1461–1473. [Google Scholar]
- Li, J.; Meng, J.; Mao, X. MCR Based Model for Developing Land Use Ecological Security Pattern in Farming-Pastoral Zone:A Case Study of Jungar Banner, Ordos. Acta Sci. Nat. Univ. Pekin. 2013, 49, 707–715. [Google Scholar] [CrossRef]
- Yang, X.; Ye, X.; Zhao, X.; Nie, B.; Rao, J. Study on Construction and Optimization of Ecological CorridorBased on MSPA and MCR: A Case Study of Xinjian District in Nanchang City. Areal Res. Dev. 2023, 42, 85–91. [Google Scholar]
- Qi, S.; Luo, Z.; Chen, Y.; Zhao, J.; Lin, X. Construction and optimization of Ecological Network in Yuanzhou District Based on MSPA and the Least-Cost Path Method. Res. Agric. Mod. 2020, 41, 351–360. [Google Scholar] [CrossRef]
- Bai, Y. Ecosystem Quality Evaluation and Ecological Network Construction and Restoration in Chang’an District of Xi’an City. Northwest A&F University, Xi’an, China, 2024 (Conservation Buffers Design Guidelines for Buffers, Corridors, and Greenways is the U.S. Department of Agriculture, For-est Service, Southern Research Station, and its location is Asheville, NC, USA).
- Gong, L. Study on the Optimization Method of Green Ecological Network in Central Urban Area of Beijing Based on Habitat Quality Evaluation; Beijing Forestry University: Beijing, China, 2021. [Google Scholar]
- Guo, S.; Zhang, Q.; Cui, Y. Spatio-temporal Evolution and Optimization of Ecological Networks in the Rapidly Urbanized Area of Nanning. Chin. Landsc. Archit. 2024, 40, 1–23. [Google Scholar]
- He, J.; Huang, M.; Zhao, H.; Chen, F. The Process of Urban Networked Spatial Growth and Its Impact on RegionalEcosystem: A Case Study of Urban Agglomeration in the Middle Reaches of the Yangtze River. Geomat. Inf. Sci. Wuhan Univ. 2024, 68, 1–21. [Google Scholar] [CrossRef]
- Shi, J.; Shi, P.; Wang, Z.; Wan, Y.; Cheng, F.; Wang, L. Ecological network optimization of Jiuquan City, Gansu, China based on complex network theory and circuit model. Chin. J. Appl. Ecol. 2024, 35, 237–246. [Google Scholar]
- Zhang, S.; Li, C.; Zhao, K. Green Space Landscape Layout Optimization of Guiyang Based on Ecological Network Construction. Chin. Landsc. Archit. 2022, 38, 68–73. [Google Scholar] [CrossRef]
- Hu, L.; Rao, M.; Luo, Z.; Feng, X. Construction of Territorial Spatial Ecological Network in Ganzhou City Based on Supply and Demand of Ecosystem Service. Acta Agric. Univ. Jiangxiensis 2023, 45, 1038–1050. [Google Scholar] [CrossRef]


| Data Type | Year | Source |
|---|---|---|
| Land use data | 2020 | European Space Agency, WorldCover dataset (https://esa-worldcover.org/en accessed on 1 July 2023) |
| Digital elevation model | 2019 | European Space Agency, Copernicus DEM, GLO-30 (https://dataspace.copernicus.eu/ accessed on 1 July 2023) |
| Road and river shapefiles | 2020 | OpenStreetMap (https://openstreetmap.org/ accessed on 1 July 2023) |
| Administrative boundaries | 2024 | National Geomatics Center of China, Map Review No. GS(2024)0650 (https://cloudcenter.tianditu.gov.cn/dataSource accessed on 1 July 2023) |
| Point of Interest (POI) | 2020 | Amap (https://lbs.amap.com/ accessed on 1 July 2023) |
| Land Type | Equivalence Factor |
|---|---|
| Tree cover | 1.299 |
| Grassland | 1.074 |
| Cropland | 1.081 |
| Water bodies | 0.760 |
| Construction land | 1.081 |
| Land Type | Qingpu District | Wujiang District | Jiashan County |
|---|---|---|---|
| Tree cover | 0.311 | 0.574 | 1.167 |
| Grassland | 0.067 | 0.695 | 20.054 |
| Cropland | 6.848 | 7.943 | 12.512 |
| Water bodies | 1.690 | 3.350 | 6.700 |
| Construction land | 6.848 | 7.943 | 12.512 |
| Index Type | Equation | Interpretation |
|---|---|---|
| IIC | n represents the number of ecological core areas; and denote the areas of core areas ; indicates the number of connections between core areas and ; and is the total area of the study region. A higher IIC value indicates greater overall landscape connectivity. | |
| PC | represents the maximum product of probabilities among all possible connecting paths between core areas i and . PC represents the potential connectivity among all patches. Higher PC values suggest better landscape connectivity. | |
| dPC | This measures the reduction in connectivity when a specific patch is removed. A higher dPC value indicates that the patch is more important for maintaining landscape connectivity. |
| Indicator | Grading | Resistance Value | Weights |
|---|---|---|---|
| Elevation | 0–6 | 1 | 0.09 |
| 6–12 | 25 | ||
| 12–18 | 50 | ||
| 18–24 | 75 | ||
| 24–73 | 100 | ||
| Slope | ≤2° | 1 | 0.07 |
| 2–6° | 25 | ||
| 6–15° | 50 | ||
| 15–25° | 75 | ||
| ≥25° | 100 | ||
| Land use type | 10 | 5 | 0.17 |
| 20 | 20 | ||
| 30 | 30 | ||
| 40 | 40 | ||
| 50 | 100 | ||
| 60 | 80 | ||
| 80 | 60 | ||
| 90 | 10 | ||
| MSPA | Core | 5 | 0.23 |
| Bridge | 10 | ||
| Loop | 20 | ||
| Branch | 30 | ||
| Islet | 50 | ||
| Edge | 60 | ||
| Perforation | 70 | ||
| Background | 100 | ||
| Distance from water bodies | 0–500 | 100 | 0.11 |
| 500–1000 | 75 | ||
| 1000–1500 | 50 | ||
| 1500–2000 | 25 | ||
| ≥2000 | 1 | ||
| Distance from railway | ≤1000 | 100 | 0.15 |
| 1000–1500 | 75 | ||
| 1500–2000 | 50 | ||
| 2000–2500 | 25 | ||
| ≥2500 | 1 | ||
| Distance from high speed | 0–500 | 100 | 0.10 |
| 500–1000 | 75 | ||
| 1000–1500 | 50 | ||
| 1500–2000 | 25 | ||
| ≥2000 | 1 | ||
| Distance from other roads | ≤500 | 100 | 0.08 |
| 500–1000 | 75 | ||
| 1000–1500 | 50 | ||
| 1500–2000 | 20 | ||
| ≥2000 | 1 |
| Land Type | Area (km2) | Proportion (%) |
|---|---|---|
| Forestland | 270.46 | 11.26 |
| Shrubland | 4.42 | 0.18 |
| Grassland | 25.93 | 1.08 |
| Cropland | 909.95 | 37.87 |
| Construction land | 574.51 | 23.91 |
| Bare/sparse vegetation | 248.42 | 10.34 |
| Permanent water bodies | 357.95 | 14.90 |
| Herbaceous wetland | 11.07 | 0.46 |
| Province City | Forestland (hm2) | Grassland (hm2) | Cropland (hm2) | Water Body (hm2) | Construction Land (hm2) | Total Population (Thousand) | Ecological Footprint Per Capita (hm2) | Ecological Carrying Capacity Per Capita (hm2) |
|---|---|---|---|---|---|---|---|---|
| Qingpu District | 4180 | 980 | 24590 | 16310 | 20910 | 127.140 | 0.054 | 0.283 |
| Wujiang District | 13788 | 2803 | 21388 | 33407 | 41325 | 87.470 | 0.130 | 0.725 |
| Jiashan County | 3872 | 142 | 19329 | 9481 | 17778 | 40.980 | 0.128 | 1.364 |
| Region | Value |
|---|---|
| Qingpu District | 0.23 |
| Wujiang District | 0.60 |
| Jiashan County | 1.24 |
| Demonstration area (Average) | 0.69 |
| Land Type | Area (km2) | Foreground Coverage (%) |
|---|---|---|
| Core | 929.72 | 73.96 |
| Bridge | 11.07 | 0.88 |
| Loop | 10.25 | 0.82 |
| Branch | 28.24 | 2.25 |
| Islet | 59.61 | 4.74 |
| Edge | 14.41 | 1.15 |
| Perforation | 203.79 | 16.21 |
| Background | 1163.53 | - |
| Corridor Type | Tree Cover | Shrubland | Grassland | Crop Land | Construction Land | Bare Land | Water Bodies | Wetland | Total (km2) |
|---|---|---|---|---|---|---|---|---|---|
| Primary corridor | 36.34 | 0.44 | 0.93 | 74.08 | 12.82 | 11.13 | 5.01 | 1.15 | 141.91 |
| 25.61% | 0.31% | 0.66% | 52.2% | 9.03% | 7.84% | 3.53% | 0.81% | ||
| Secondary corridor | 4.54 | 0.18 | 0.19 | 17.95 | 1.60 | 1.69 | 0.61 | 0.06 | 26.83 |
| 16.92% | 0.69% | 0.72% | 66.92% | 5.96% | 6.29% | 2.28% | 0.22% | ||
| Tertiary corridor | 10.25 | 0.25 | 0.20 | 20.00 | 1.44 | 1.29 | 1.07 | 0.31 | 44.80 |
| 22.87% | 0.56% | 0.44% | 66.95% | 3.23% | 2.87% | 2.40% | 0.69% |
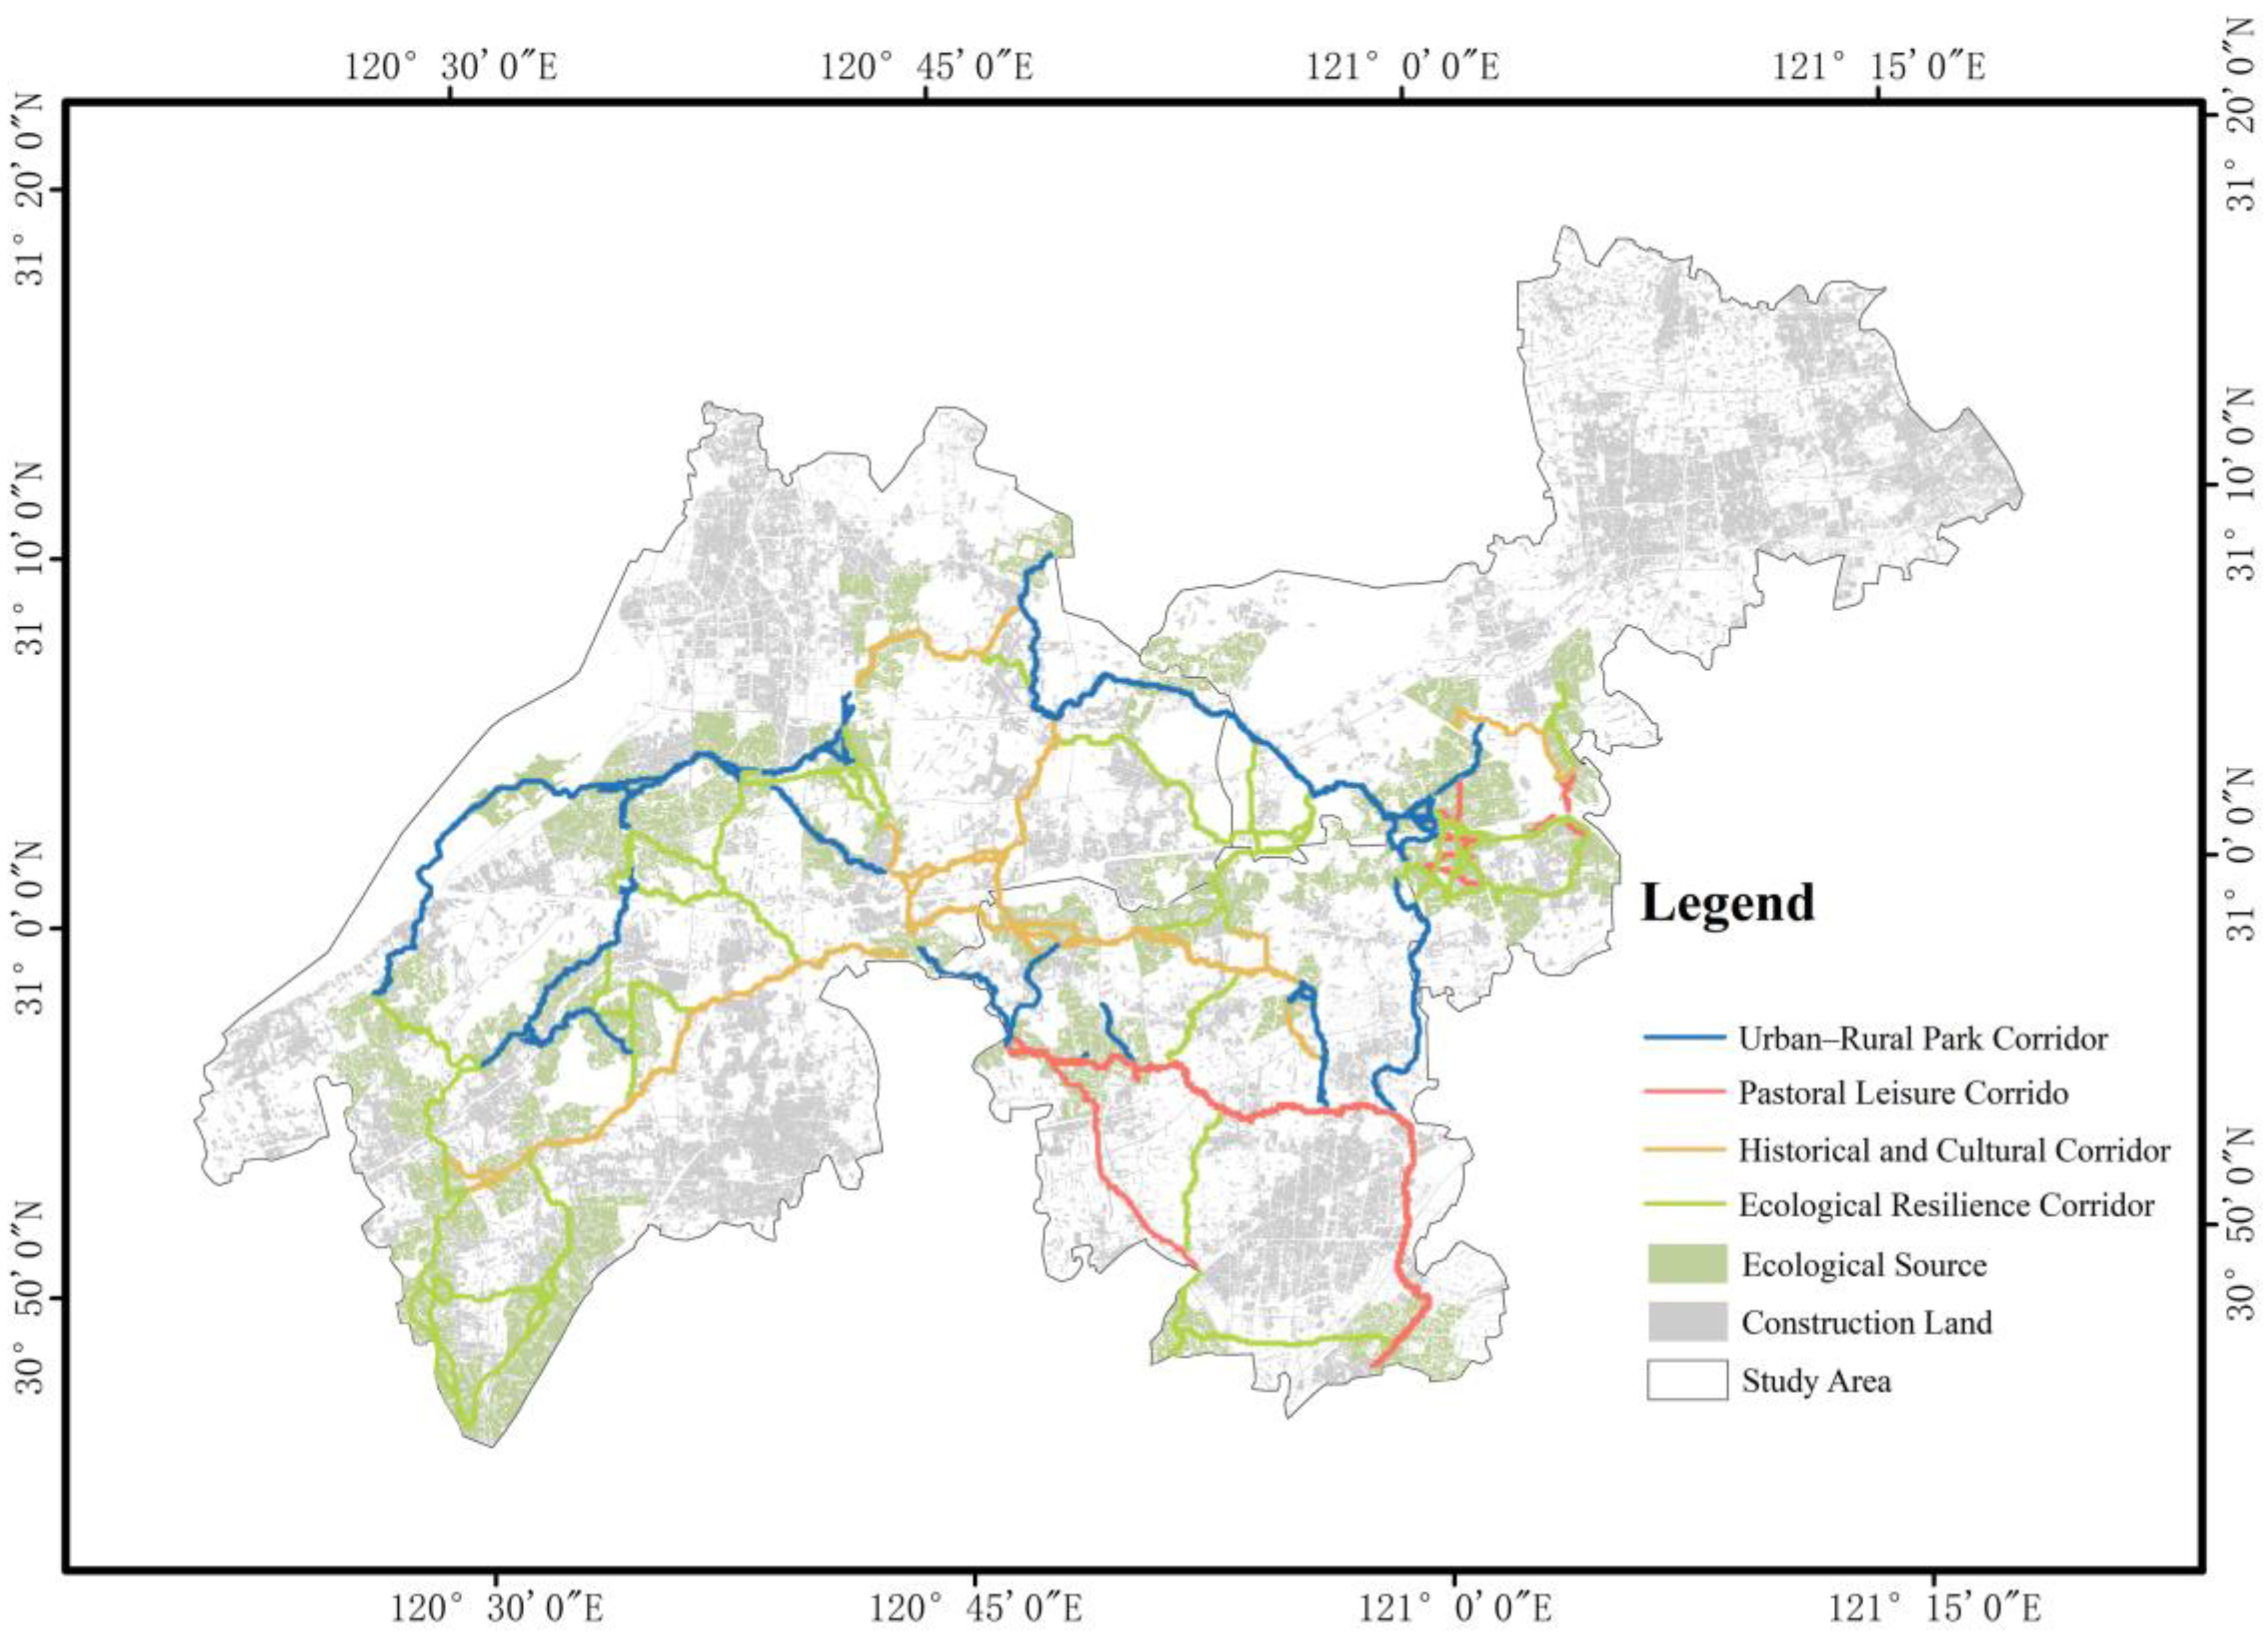
| Corridor Type | Strategies |
|---|---|
| Urban–rural park corridors | The majority of these corridors are designated as secondary routes. Residents regularly utilize them for daily and weekend leisure activities, as they link urban and rural parks at both termini. These corridors improve accessibility and communication between parks, while preserving biological integrity. Infrastructure enhancements are scheduled along the corridors, encompassing essential public services, athletic and fitness facilities, and cultural and recreational amenities. Activities including camping, marathons, cycling, and water sports are anticipated to enhance public participation and encourage healthy lifestyles. |
| Pastoral recreation corridors | These corridors predominantly link rural regions focused on cultural tourism and agricultural sectors. Consequently, they are essential in advancing nature education and recreation rooted in an agrarian legacy. Rural cultural tourism projects are actively created in accordance with local rural features to promote rural rejuvenation and economic growth, while conserving the extent of permanent basic farming. Examples encompass sericulture-oriented cultural experiences, agritourism, and low-altitude economic endeavors, including drone services and aerial sightseeing. |
| Historical and cultural corridors | This corridor connects various notable old towns within the demonstration region, highlighting the particular cultural landscape of Jiangnan water towns. It functions as a favored locale for brief vacations among local inhabitants. A tourism route linking these ancient towns was designed based on the area’s ecological carrying capacity. Initiatives like Yangtze River Delta ancient town tours and immersive cultural experiences seek to enhance integrated tourism and facilitate the synergistic advancement of the regional economy. |
| Ecological resilience corridors | The planning strategy emphasizes ecological protection and optimization, as the ecological sources linked by this corridor predominantly comprise forests and farmed areas. The major purpose is ecological construction, with economic operations severely restricted. Human activities are oriented towards the external buffer zones to reduce disruption. Woodland habitats are favored within the corridor to strengthen internal ecological community structures, improve ecological resilience, and foster species diversity. These actions preserve the integrity of the regional ecological framework. |
Disclaimer/Publisher’s Note: The statements, opinions and data contained in all publications are solely those of the individual author(s) and contributor(s) and not of MDPI and/or the editor(s). MDPI and/or the editor(s) disclaim responsibility for any injury to people or property resulting from any ideas, methods, instructions or products referred to in the content. |
© 2025 by the authors. Licensee MDPI, Basel, Switzerland. This article is an open access article distributed under the terms and conditions of the Creative Commons Attribution (CC BY) license (https://creativecommons.org/licenses/by/4.0/).
Share and Cite
Feng, L.; Gong, Y.; Liang, Z. Integrating Cross-Regional Ecological Networks in Blue–Green Spaces: A Spatial Planning Approach for the Yangtze River Delta Demonstration Area. Sustainability 2025, 17, 4193. https://doi.org/10.3390/su17094193
Feng L, Gong Y, Liang Z. Integrating Cross-Regional Ecological Networks in Blue–Green Spaces: A Spatial Planning Approach for the Yangtze River Delta Demonstration Area. Sustainability. 2025; 17(9):4193. https://doi.org/10.3390/su17094193
Chicago/Turabian StyleFeng, Lu, Yan Gong, and Zhiyuan Liang. 2025. "Integrating Cross-Regional Ecological Networks in Blue–Green Spaces: A Spatial Planning Approach for the Yangtze River Delta Demonstration Area" Sustainability 17, no. 9: 4193. https://doi.org/10.3390/su17094193
APA StyleFeng, L., Gong, Y., & Liang, Z. (2025). Integrating Cross-Regional Ecological Networks in Blue–Green Spaces: A Spatial Planning Approach for the Yangtze River Delta Demonstration Area. Sustainability, 17(9), 4193. https://doi.org/10.3390/su17094193