
Efficient Pollutant Removal and Low-Carbon Emission Mechanisms in Constructed Wetlands Synergistically Driven by Low COD/N Ratio and Coastal Location

 , , ,
, , ,  ,
, 
Abstract
1. Introduction
2. Materials and Methods
2.1. Description of Experimental Wetlands
2.2. Sample Collection and Analysis
2.2.1. Liquid and Soil Sample Collection
2.2.2. GHG Collection
2.2.3. Gas Detection and Analysis
2.2.4. The Calculation of Greenhouse Gas Flux
2.3. Global Warming Potential (GWP) in the Wetlands
2.4. Statistical Analysis
3. Results
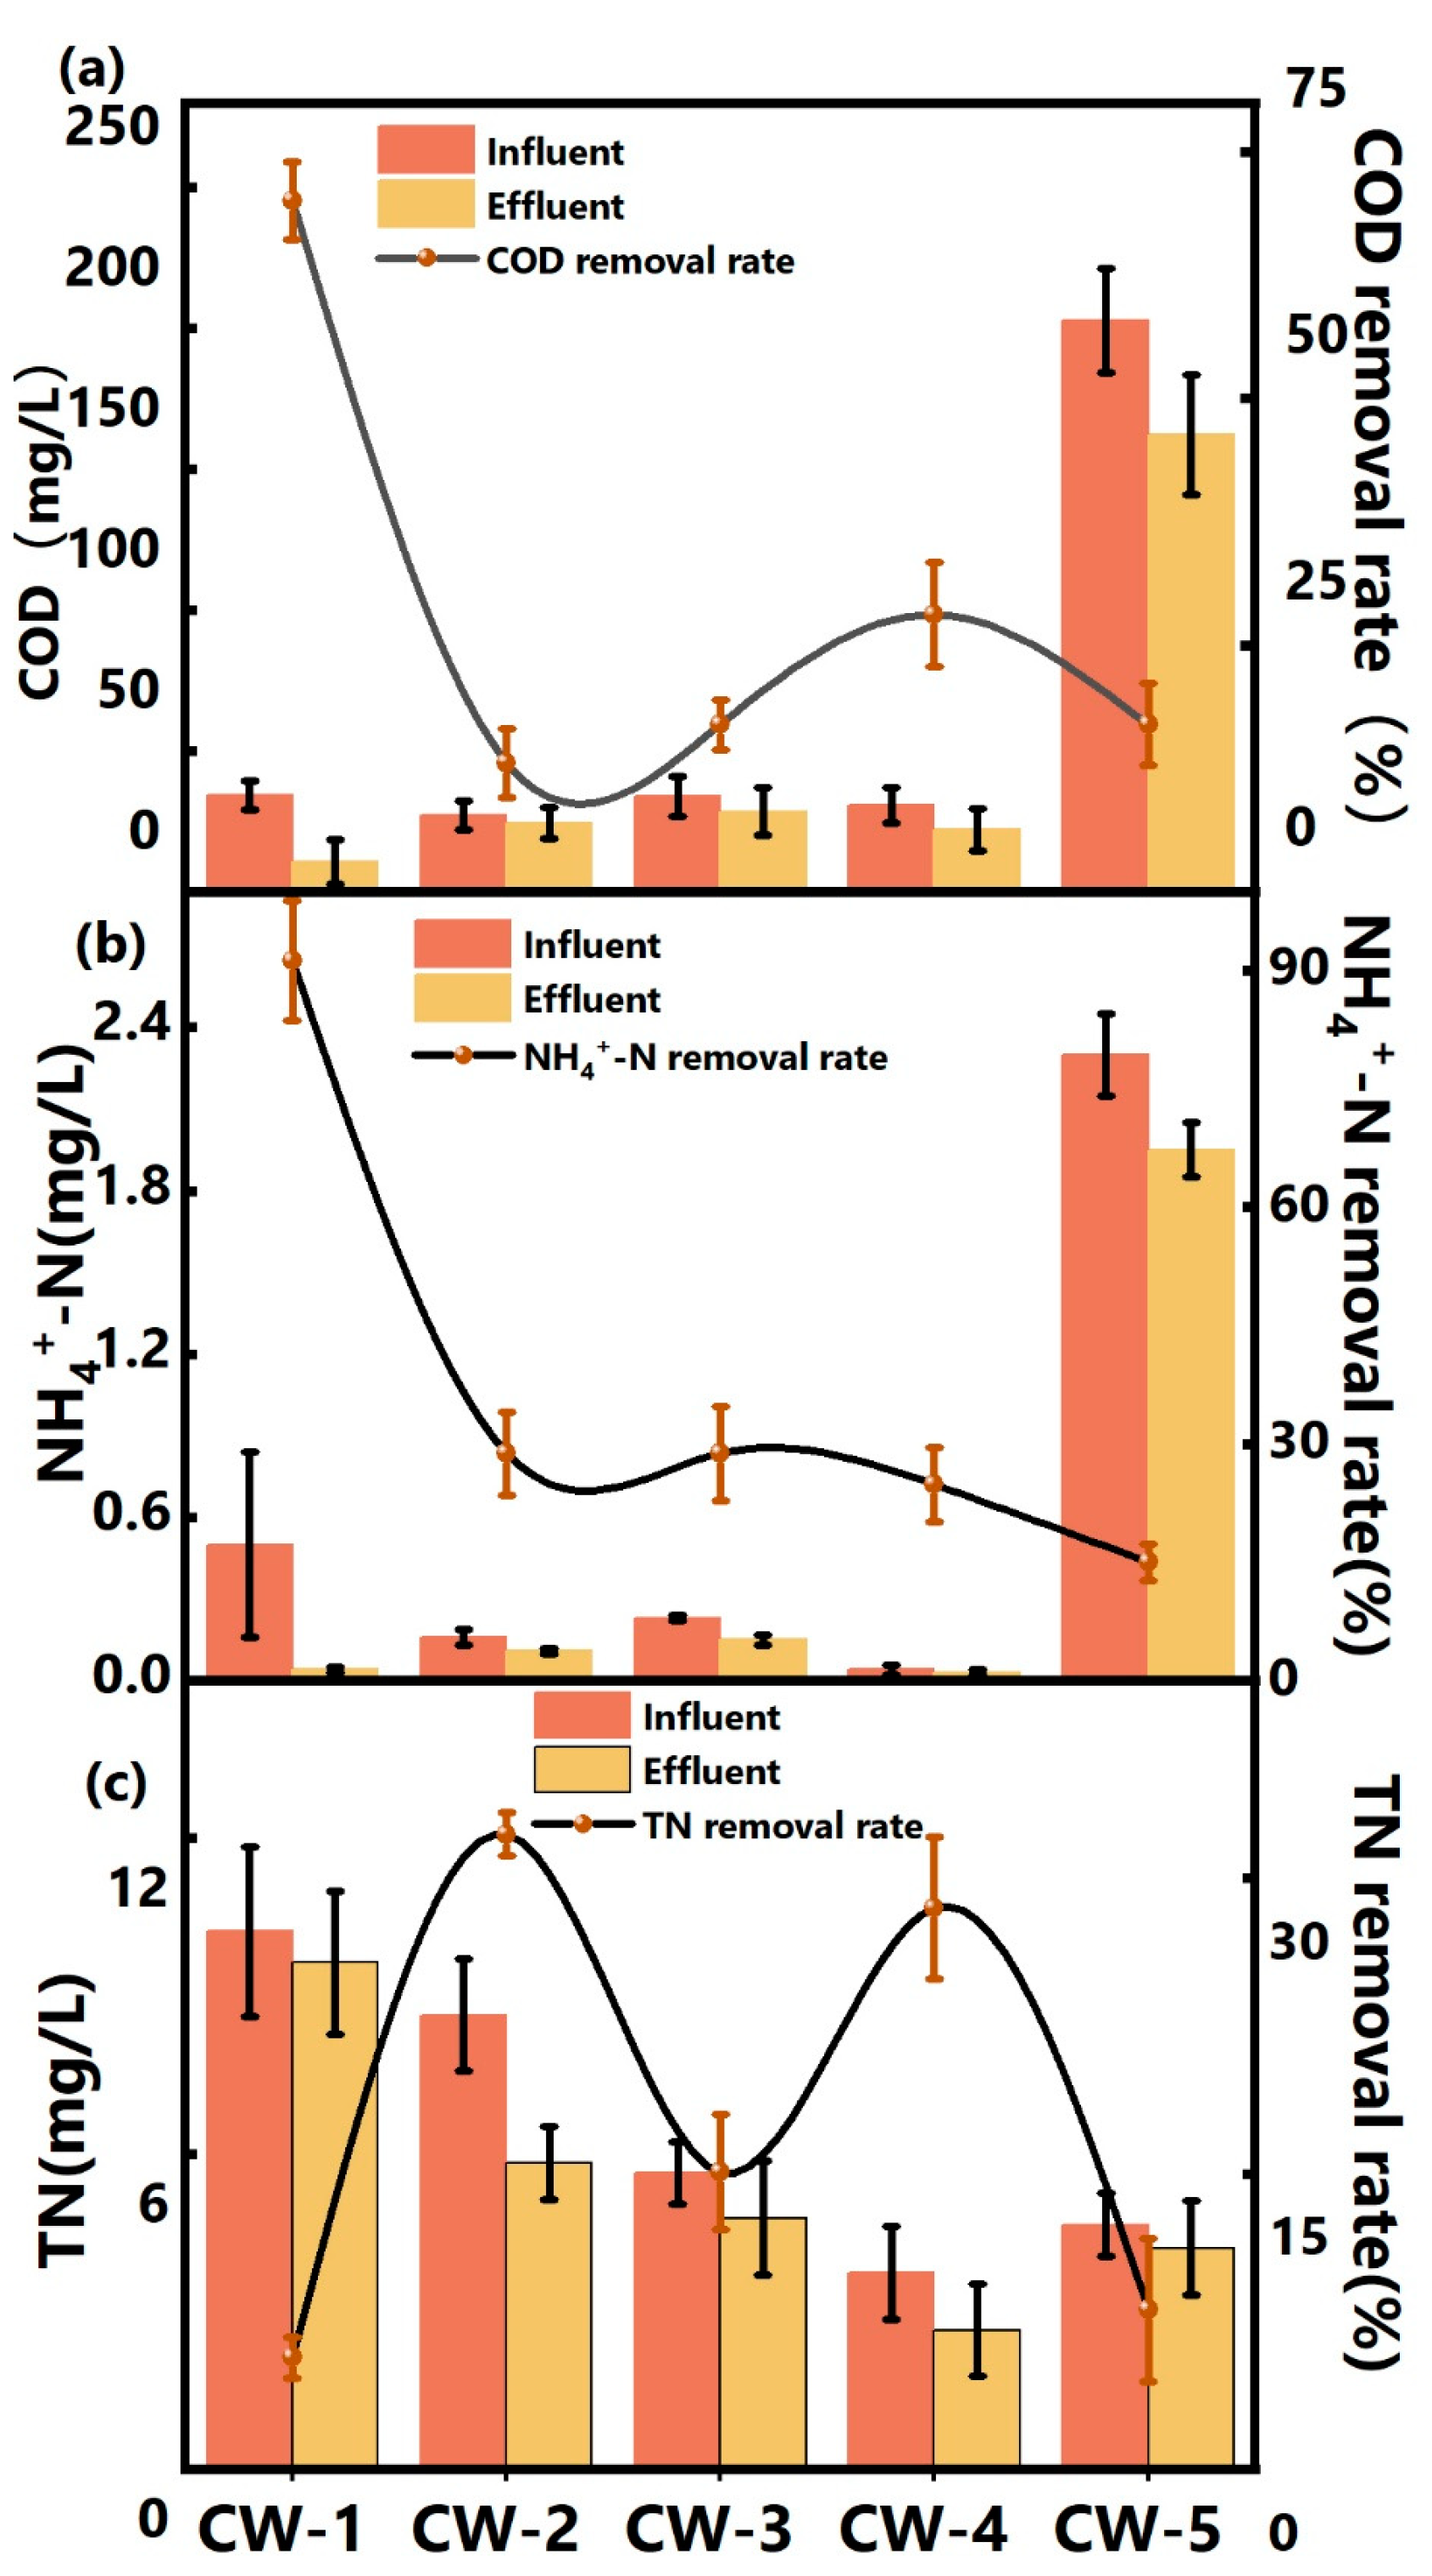
3.1. Pollutant Removal
3.1.1. COD Removal
3.1.2. TN Removal
3.1.3. NH4+-N Removal
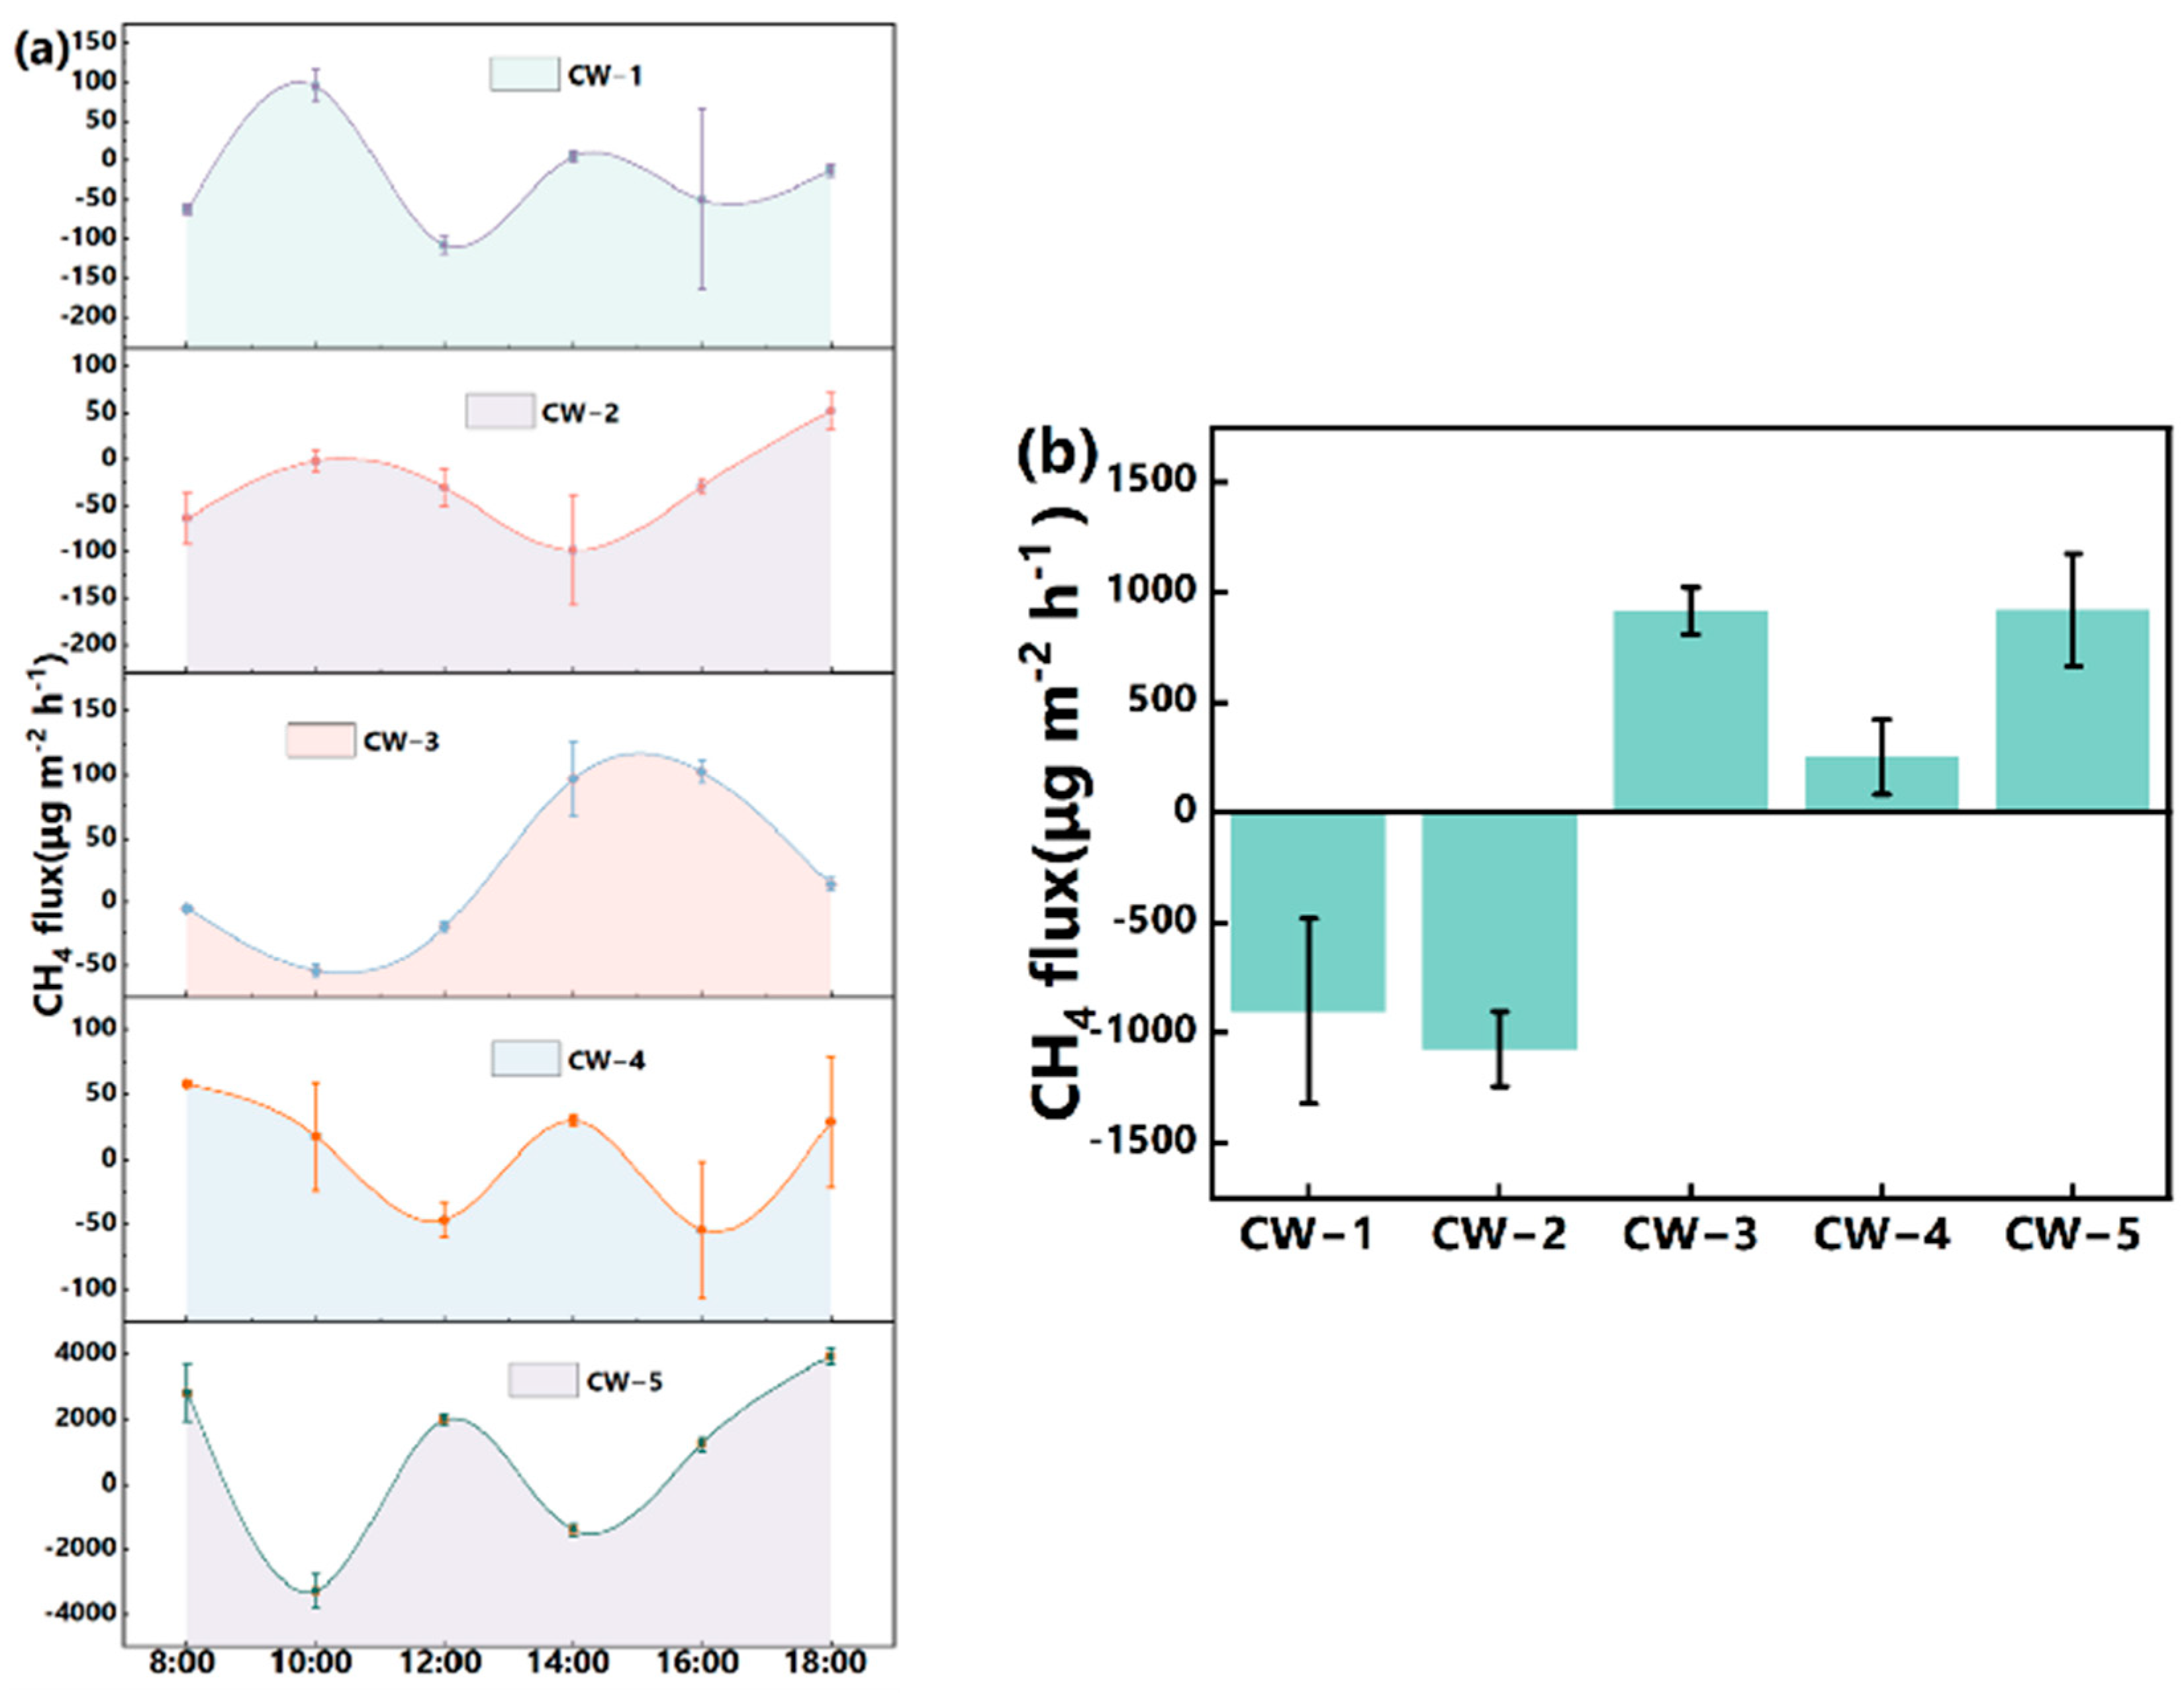
3.2. CH4 Flux
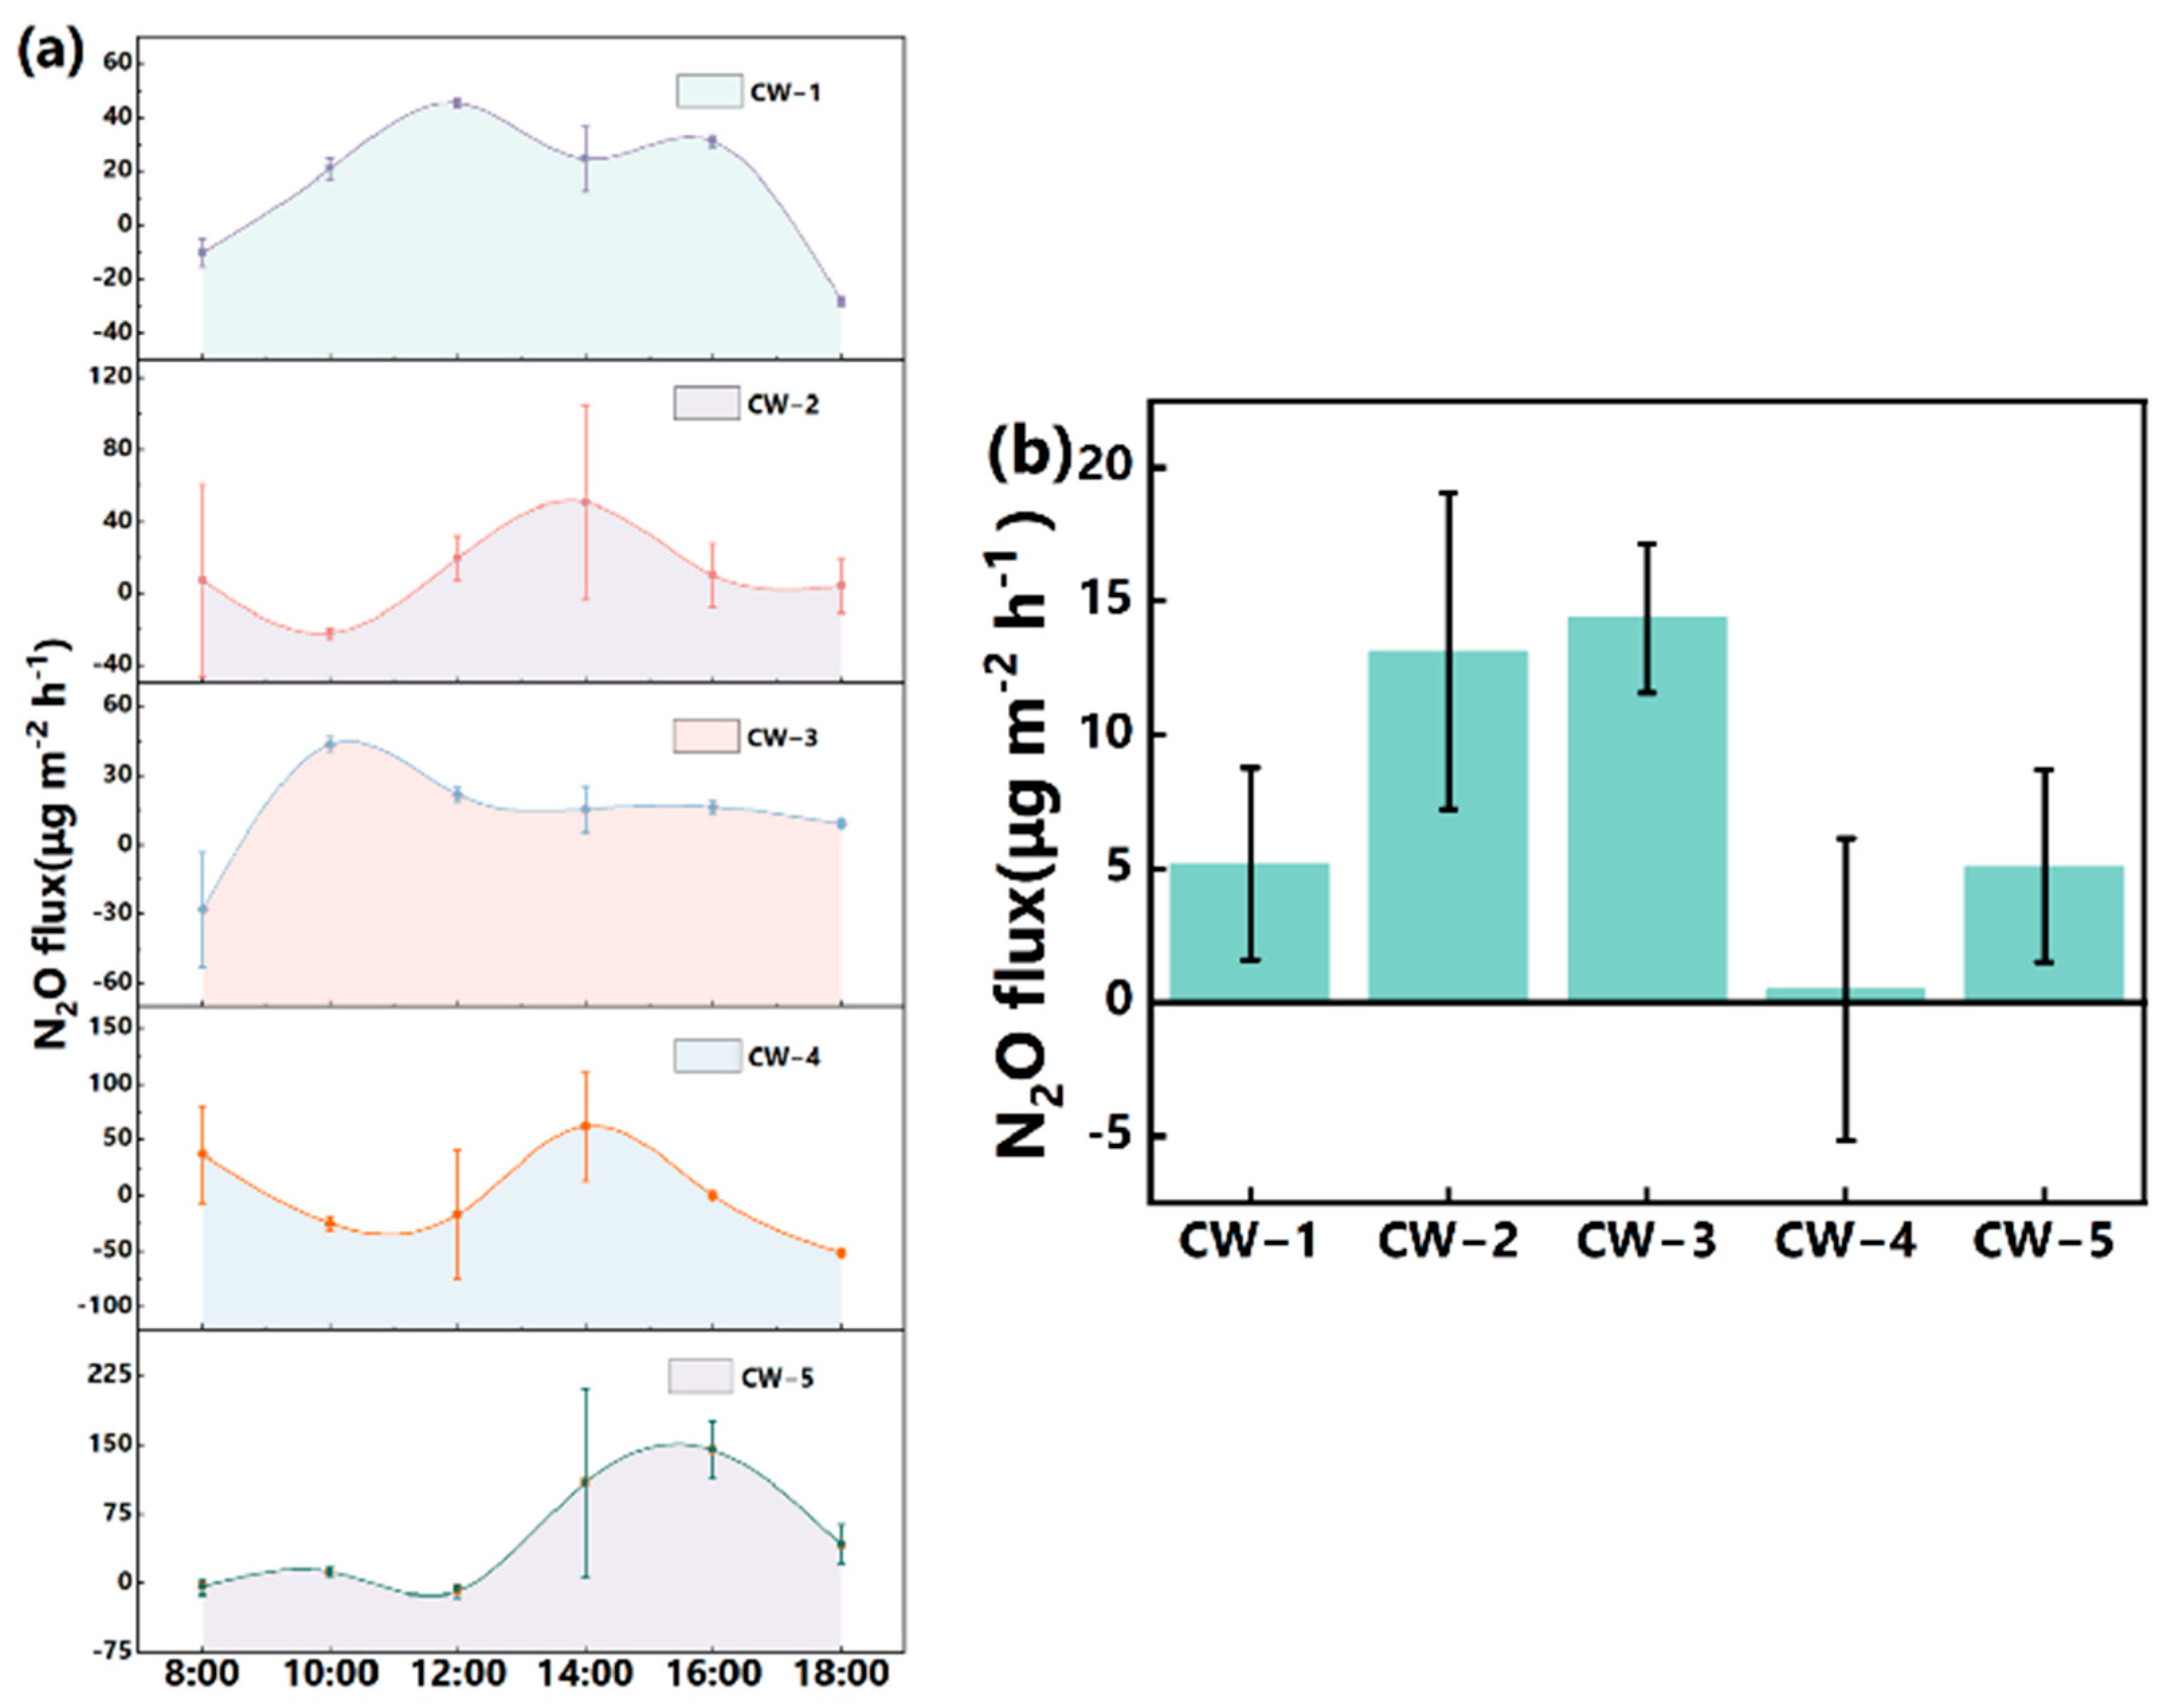
3.3. N2O Flux
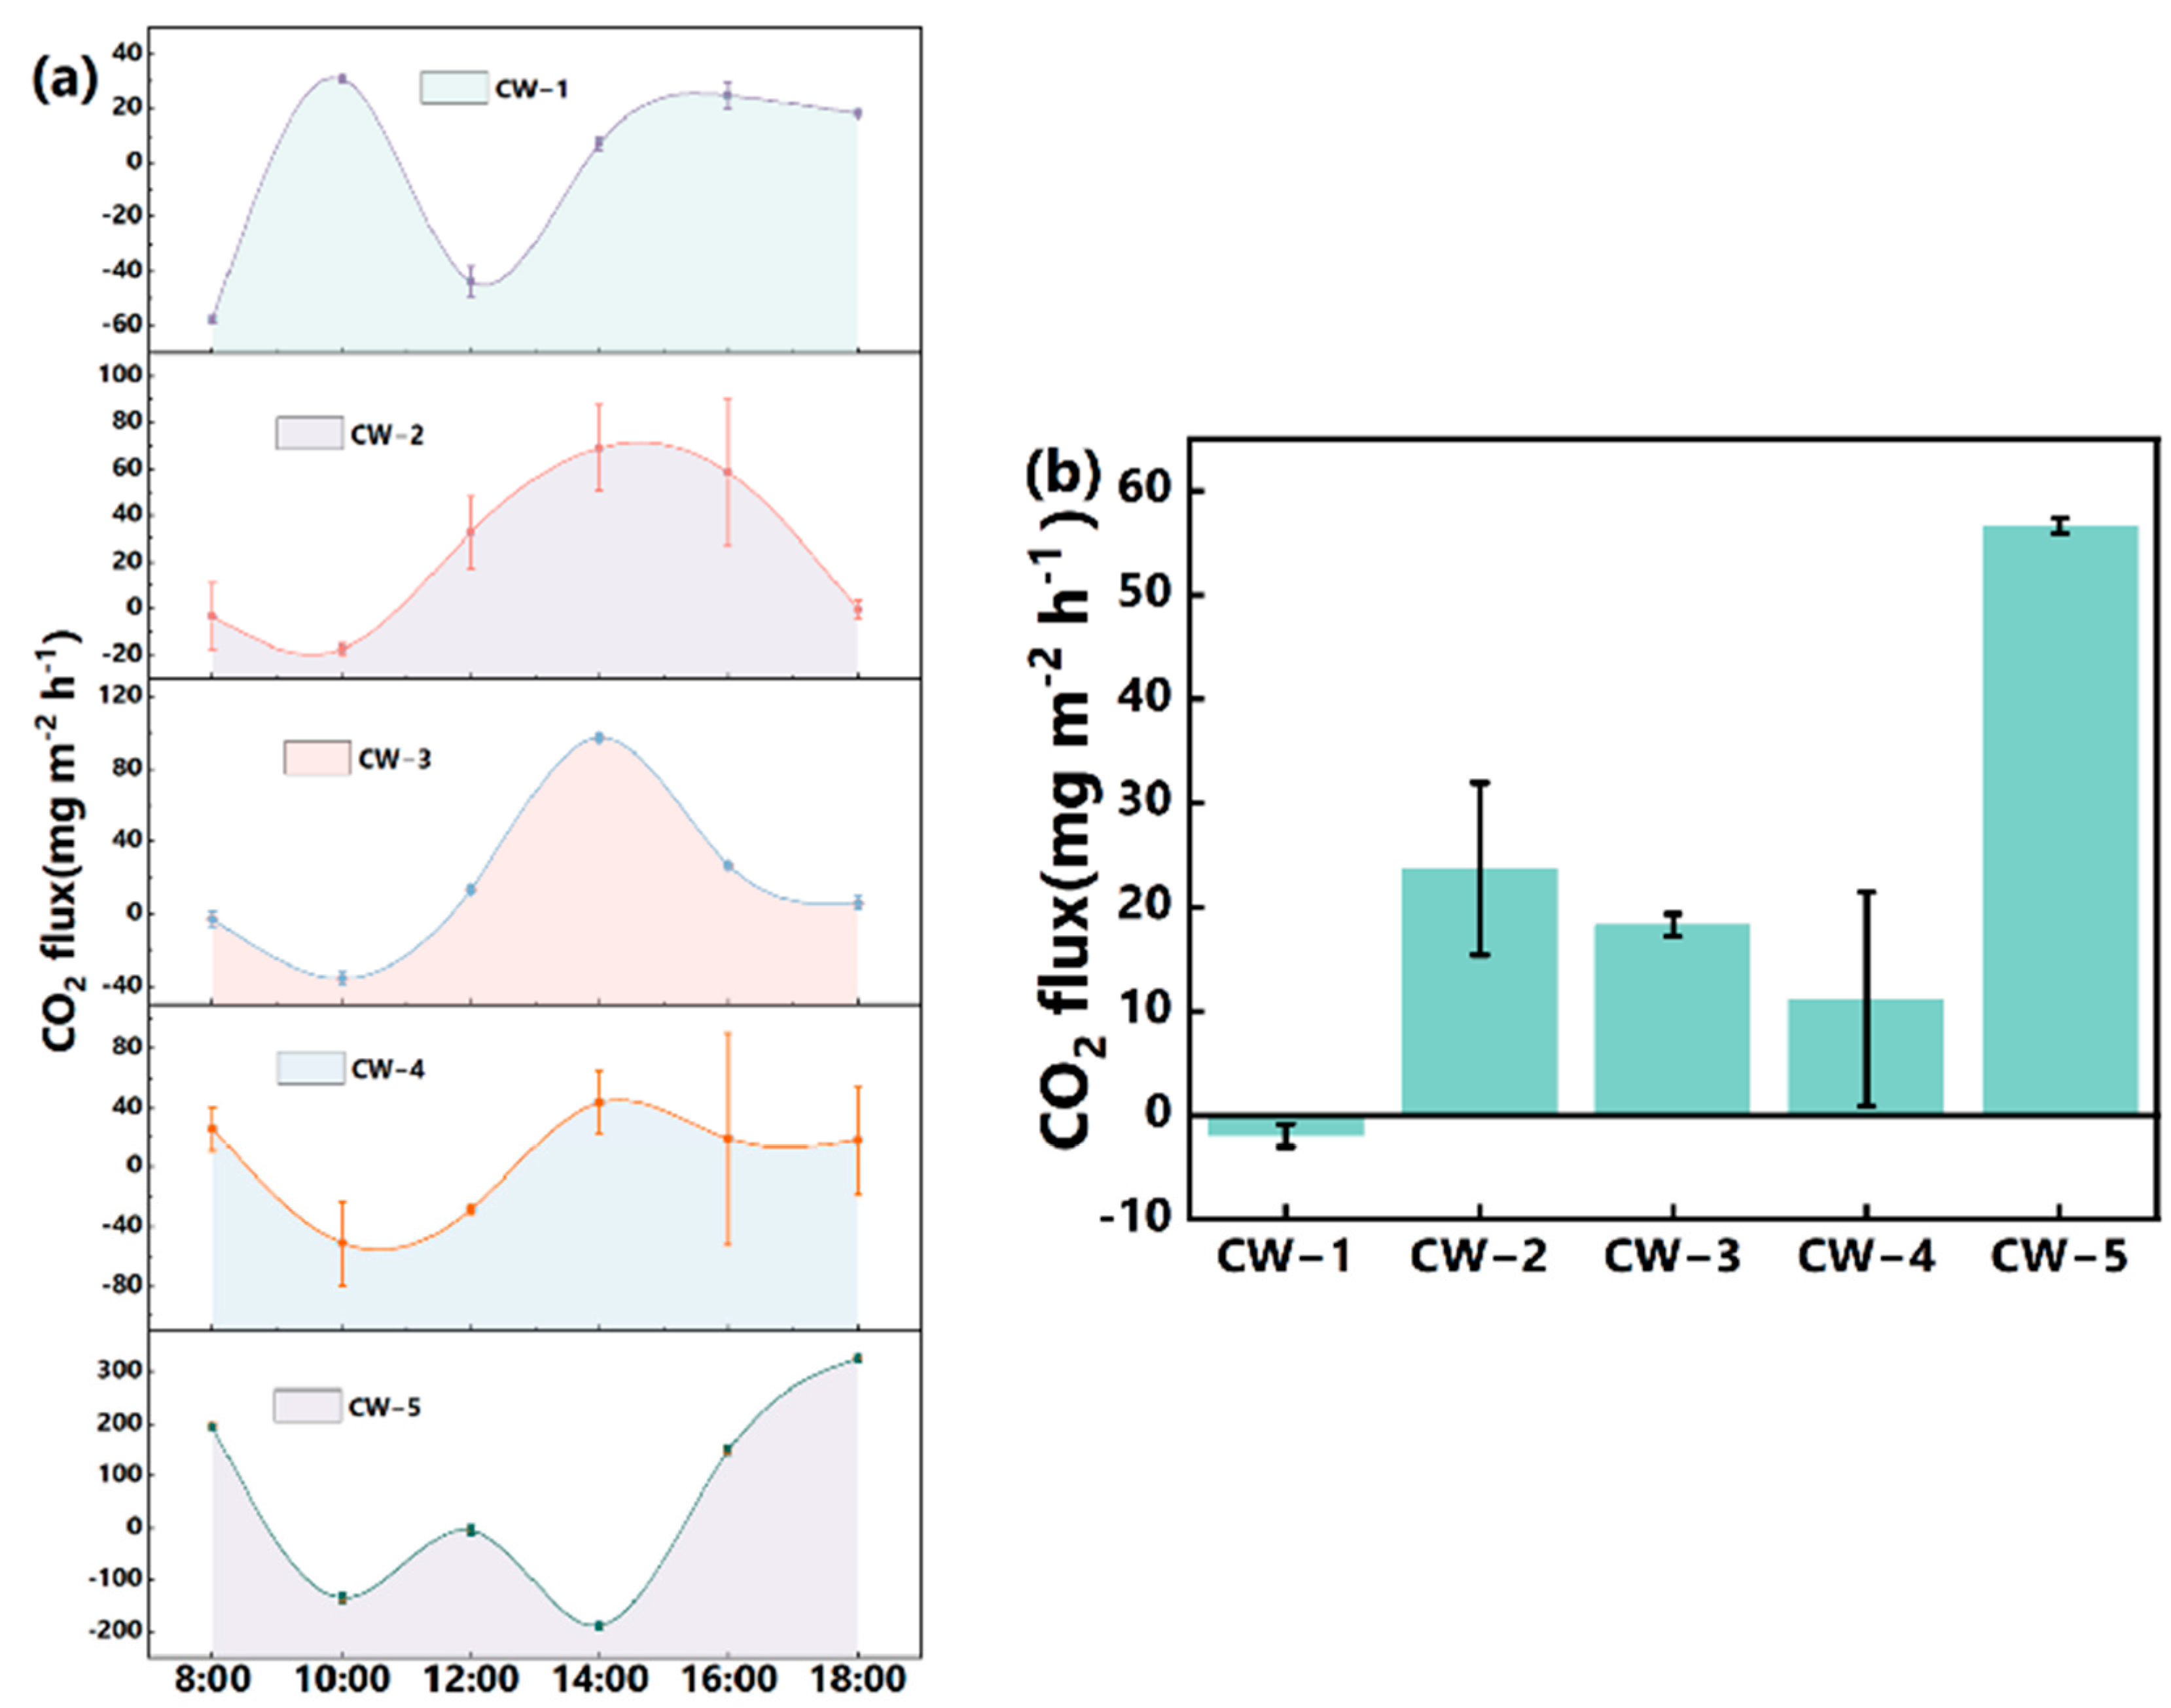
3.4. CO2 Flux
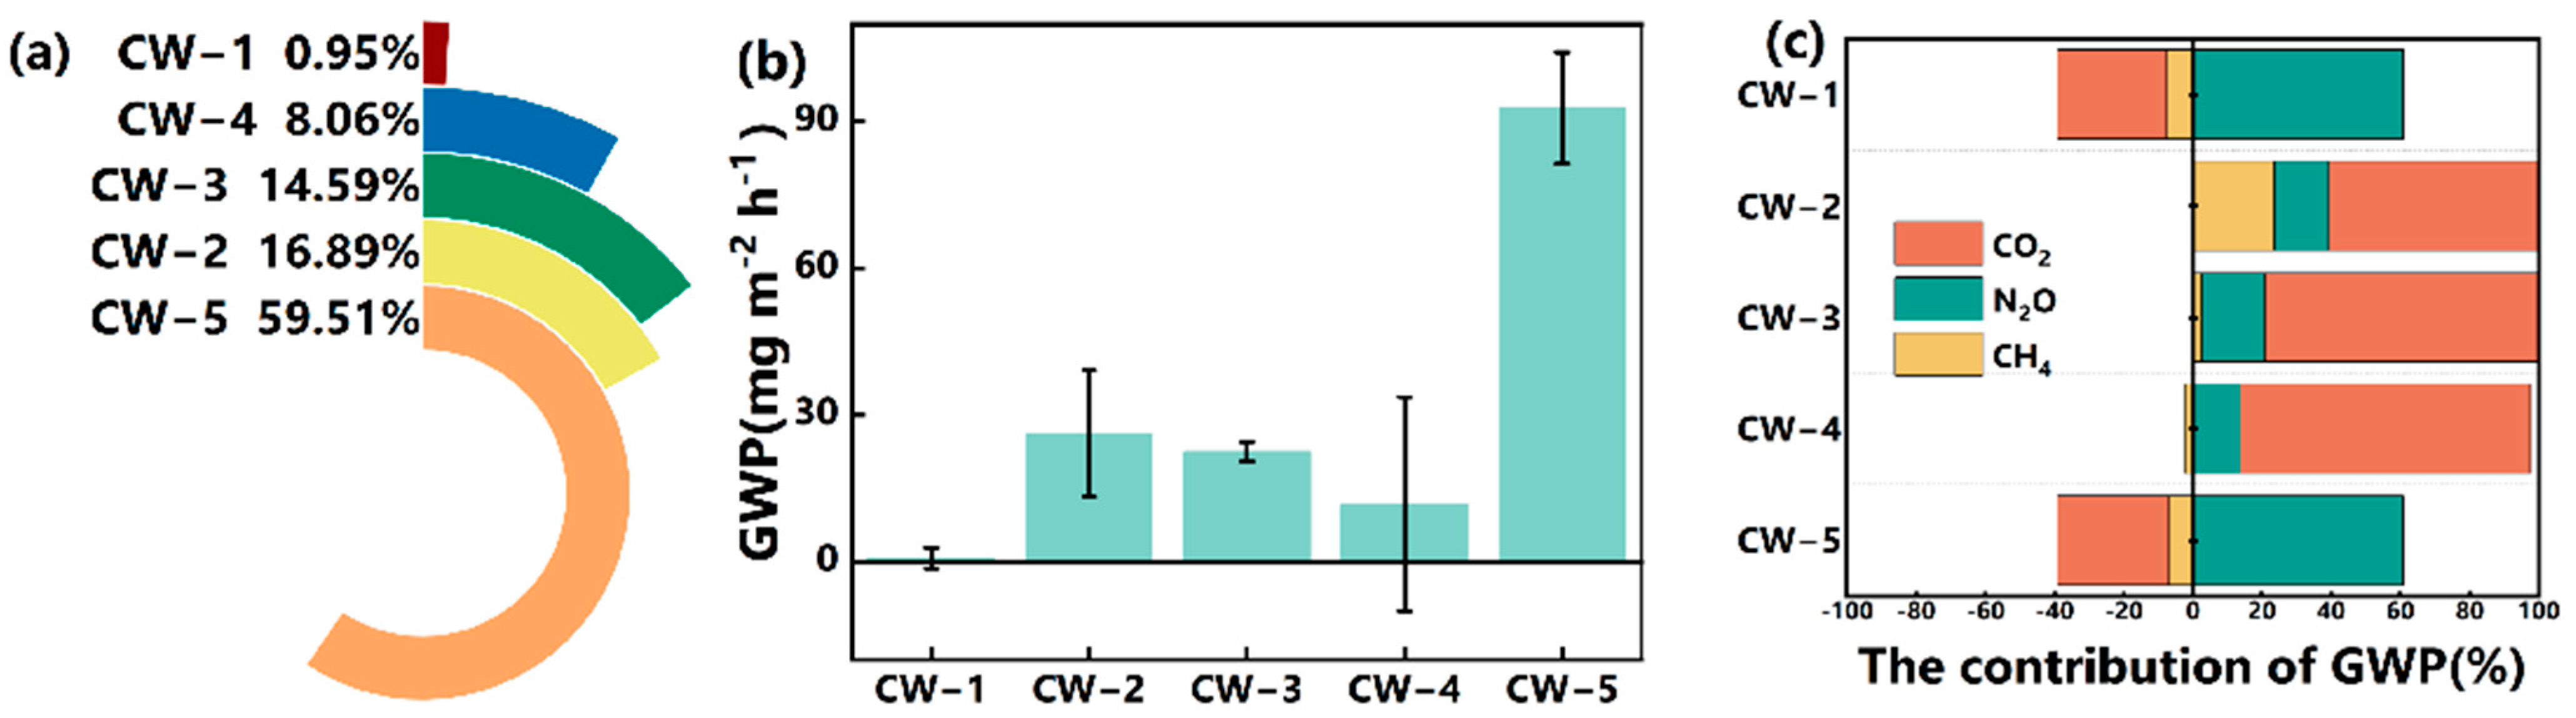
3.5. Global Warming Potential (GWP) from Different Wetlands
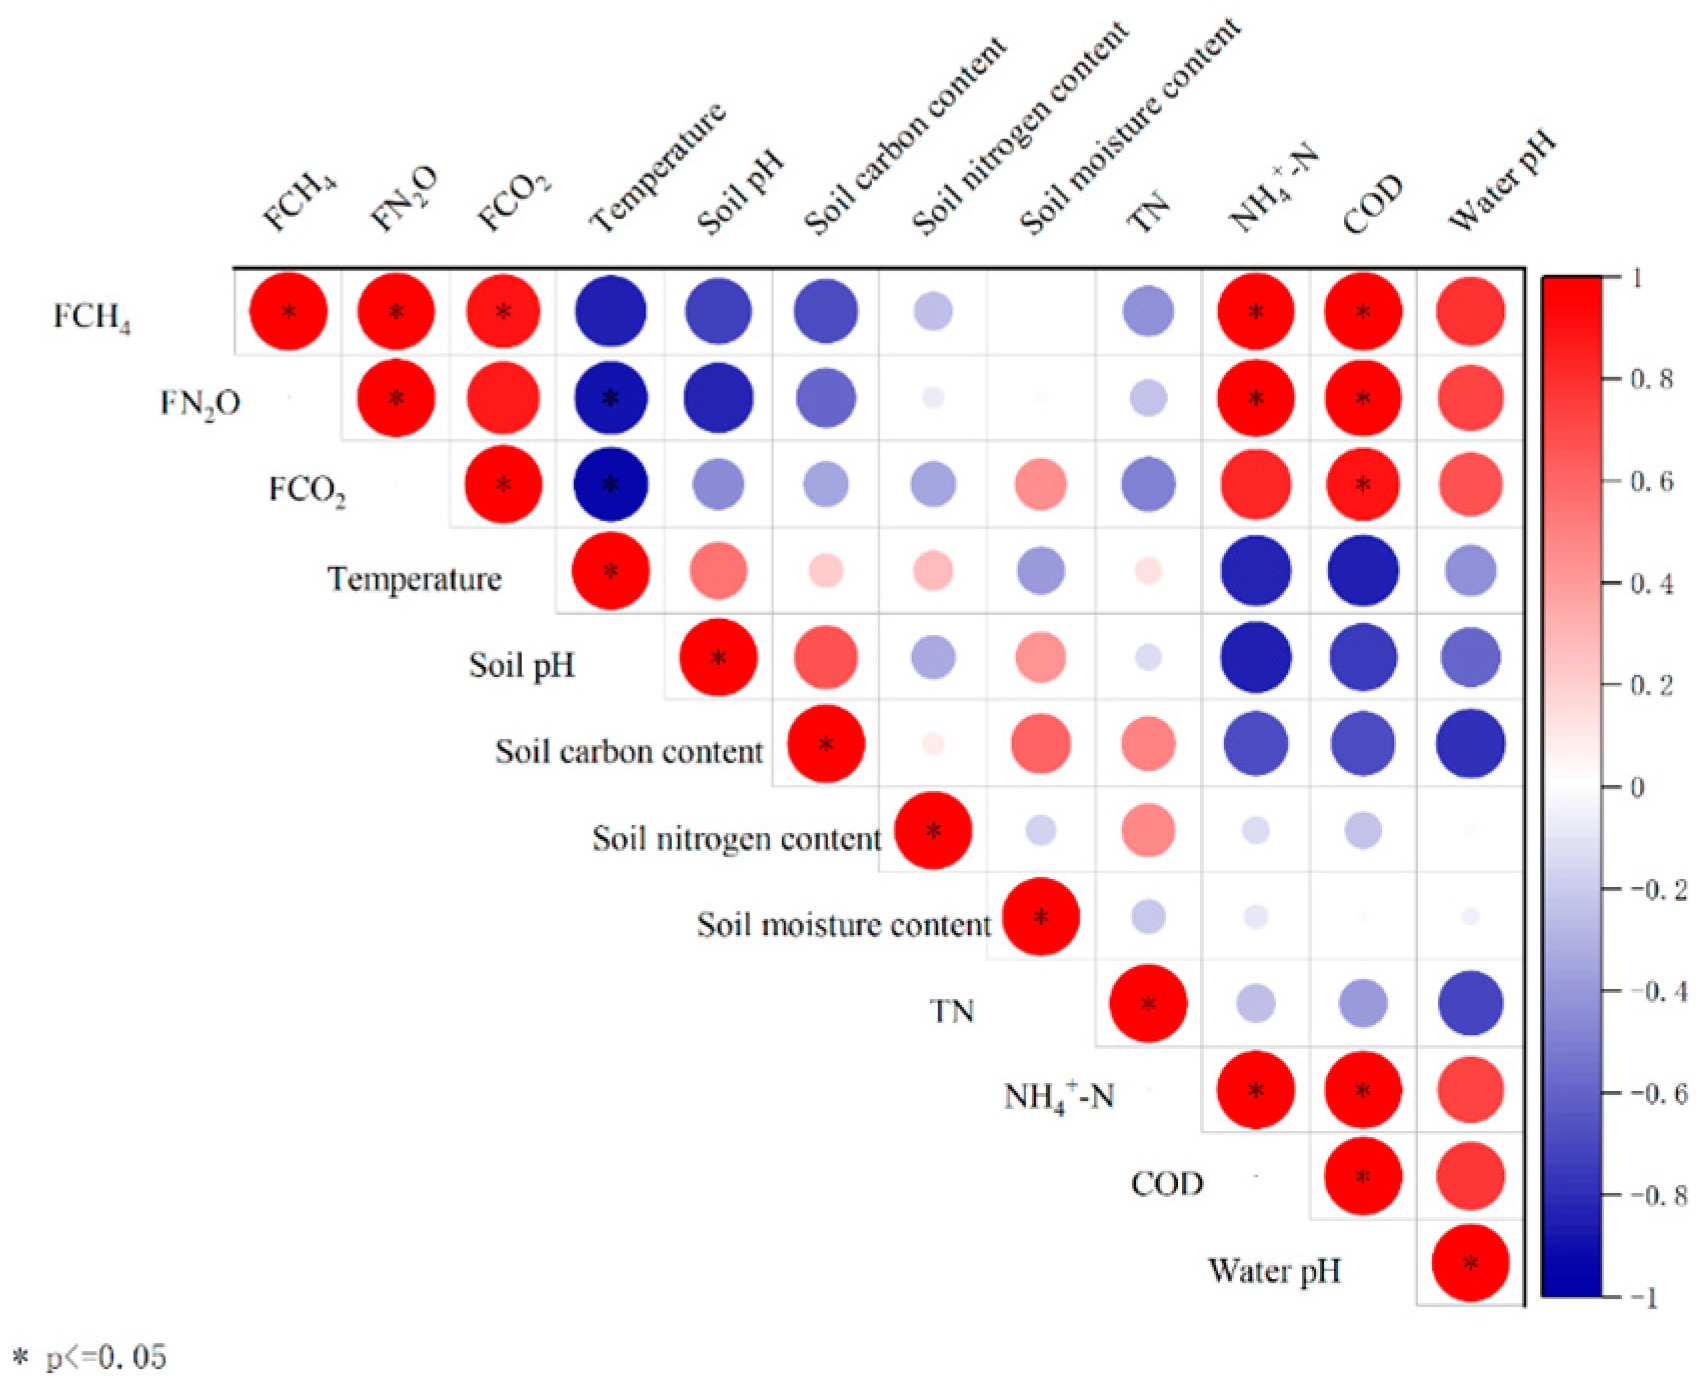
3.6. The Correlation of GHG with the Environmental Factors in Constructed Wetlands
4. Discussion
4.1. Pollutant Removal Efficiency
4.2. Effect of Influent COD/N Ratio on GHG Emissions
4.2.1. CH4 Flux
4.2.2. N2O Flux
4.2.3. CO2 Flux
4.2.4. GWP
5. Conclusions
Author Contributions
Funding
Institutional Review Board Statement
Informed Consent Statement
Data Availability Statement
Conflicts of Interest
Abbreviations
| CWs | Constructed wetlands |
| GHGs | Greenhouse gases |
| COD/N | Chemical oxygen demand to nitrogen |
| GWP | Global warming potential |
| TC | Total carbon |
| TN | Total nitrogen |
| NH4+-N | Ammonia nitrogen |
| CO2-eq | Carbon dioxide equivalent |
References
- Vymazal, J. Removal of nutrients in various types of constructed wetlands. Sci. Total Environ. 2007, 380, 48–65. [Google Scholar] [CrossRef]
- Wu, H.; Zhang, J.; Li, P.; Zhang, J.; Xie, H.; Zhang, B. Nutrient removal in constructed microcosm wetlands for treating polluted river water in northern China. Ecol. Eng. 2011, 37, 560–568. [Google Scholar] [CrossRef]
- Mishra, V.K.; Shukla, R.; Sharma, N.K. Application of constructed wetland; A natural treatment system for environmentally sustainable domestic sewage treatment. In Sustainable Environmental Clean-Up; Elsevier: Amsterdam, The Netherlands, 2021; pp. 105–129. [Google Scholar]
- Zhu, H.; Yan, B.; Xu, Y.; Guan, J.; Liu, S. Removal of nitrogen and COD in horizontal subsurface flow constructed wetlands under different influent C/N ratios. Ecol. Eng. 2014, 63, 58–63. [Google Scholar] [CrossRef]
- Du, Y.; Pan, K.; Yu, C.; Luo, B.; Gu, W.; Sun, H.; Min, Y.; Liu, D.; Geng, Y.; Han, W.; et al. Plant diversity decreases net global warming potential integrating multiple functions in microcosms of constructed wetlands. J. Clean. Prod. 2018, 184, 718–726. [Google Scholar] [CrossRef]
- IPCC Mitigation of Climate Change. Contribution of Working Group III to the Fifth Assessment Report of the Intergovernmental Panel on Climate Change; Cambridge University Press: Cambridge, UK; New York, NY, USA, 2014. [Google Scholar]
- IPCC Synthesis report (contribution of working groups I, II and III to the fifth assessment report of the intergovernmental panel on climate change). In Core Writing Team; Pachauri, R.K., Meyer, L.A., Eds.; IPCC: Geneva, Switzerland, 2014. [Google Scholar]
- Fan, J.; Wang, W.; Zhang, B.; Guo, Y.; Ngo, H.H.; Guo, W.; Zhang, J.; Wu, H. Nitrogen removal in intermittently aerated vertical flow constructed wetlands: Impact of influent COD/N ratios. Bioresour. Technol. 2013, 143, 461–466. [Google Scholar] [CrossRef] [PubMed]
- Wu, H.; Zhang, J.; Ngo, H.H.; Guo, W.; Hu, Z.; Liang, S.; Fan, J.; Liu, H. A review on the sustainability of constructed wetlands for wastewater treatment: Design and operation. Bioresour. Technol. 2015, 175, 594–601. [Google Scholar] [CrossRef]
- Yan, C.; Zhang, H.; Li, B.; Wang, D.; Zhao, Y.; Zheng, Z. Effects of influent C/N ratios on CO2 and CH4 emissions from vertical subsurface flow constructed wetlands treating synthetic municipal wastewater. J. Hazard. Mater. 2012, 203–204, 188–194. [Google Scholar] [CrossRef]
- Zhao, Y.J.; Liu, B.; Zhang, W.G.; Ouyang, Y.; An, S.Q. Performance of pilot-scale vertical-flow constructed wetlands in responding to variation in influent C/N ratios of simulated urban sewage. Bioresour. Technol. 2010, 101, 1693–1700. [Google Scholar] [CrossRef]
- Zhi, W.; Ji, G. Quantitative response relationships between nitrogen transformation rates and nitrogen functional genes in a tidal flow constructed wetland under C/N ratio constraints. Water Res. 2014, 64, 32–41. [Google Scholar] [CrossRef]
- Guo, F.; Zhang, J.; Yang, X.; He, Q.; Ao, L.; Chen, Y. Impact of biochar on greenhouse gas emissions from constructed wetlands under various influent chemical oxygen demand to nitrogen ratios. Bioresour. Technol. 2020, 303, 122908. [Google Scholar] [CrossRef]
- Ministry of Ecology and Environment of the People’s Republic of China. HJ 828-2017 Water Quality Termination of the Chemical Oxygen Demand Dichromate Method; China Environment Press: Beijing, China, 2017.
- Ma, W.; Alhassan, A.-R.M.; Wang, Y.; Li, G.; Wang, H.; Zhao, J. Greenhouse gas emissions as influenced by wetland vegetation degradation along a moisture gradient on the eastern Qinghai-Tibet Plateau of North-West China. Nutr. Cycl. Agroecosyst. 2018, 112, 335–354. [Google Scholar] [CrossRef]
- Bateganya, N.L.; Mentler, A.; Langergraber, G.; Busulwa, H.; Hein, T. Carbon and nitrogen gaseous fluxes from subsurface flow wetland buffer strips at mesocosm scale in East Africa. Ecol. Eng. 2015, 85, 173–184. [Google Scholar] [CrossRef]
- Mander, Ü.; Dotro, G.; Ebie, Y.; Towprayoon, S.; Chiemchaisri, C.; Nogueira, S.F.; Jamsranjav, B.; Kasak, K.; Truu, J.; Tournebize, J.; et al. Greenhouse gas emission in constructed wetlands for wastewater treatment: A review. Ecol. Eng. 2014, 66, 19–35. [Google Scholar] [CrossRef]
- Xu, G.M.; Li, Y.; Wang, J.R.; Yang, W.Z.; Wang, S.; Kong, F.L. Effects of substrate combinations on greenhouse gas emissions and wastewater treatment performance in vertical subsurface flow constructed wetlands. Ecol. Indic. 2021, 121, 107189. [Google Scholar] [CrossRef]
- Chen, X.; Zhu, H.; Yan, B.; Shutes, B.; Tian, L.; Wen, H. Optimal influent COD/N ratio for obtaining low GHG emissions and high pollutant removal efficiency in constructed wetlands. J. Clean. Prod. 2020, 267, 122003. [Google Scholar] [CrossRef]
- Zhou, X.; Wu, S.; Wang, R.; Wu, H. Nitrogen removal in response to the varying C/N ratios in subsurface flow constructed wetland microcosms with biochar addition. Environ. Sci. Pollut. Res. 2019, 26, 3382–3391. [Google Scholar] [CrossRef]
- Picek, T.; Čížková, H.; Dušek, J. Greenhouse gas emissions from a constructed wetland—Plants as important sources of carbon. Ecol. Eng. 2007, 31, 98–106. [Google Scholar] [CrossRef]
- Christensen, T.R.; Ekberg, A.; Ström, L.; Mastepanov, M.; Panikov, N.; Öquist, M.; Svensson, B.H.; Nykänen, H.; Martikainen, P.J.; Oskarsson, H. Factors controlling large scale variations in methane emissions from wetlands. Geophys. Res. Lett. 2003, 30. [Google Scholar] [CrossRef]
- Hu, M.; Sardans, J.; Yang, X.; Penuelas, J.; Tong, C. Patterns and environmental drivers of greenhouse gas fluxes in the coastal wetlands of China: A systematic review and synthesis. Environ. Res. 2020, 186, 109576. [Google Scholar] [CrossRef]
- Zhang, K.; Wang, J.; Liu, X.; Fu, X.; Luo, H.; Li, M.; Jiang, B.; Chen, J.; Chen, W.; Huang, B.; et al. Methane emissions and methanogenic community investigation from constructed wetlands in Chengdu City. Urban Clim. 2021, 39, 100956. [Google Scholar] [CrossRef]
- Xu, G.; Li, Y.; Hou, W.; Wang, S.; Kong, F. Effects of substrate type on enhancing pollutant removal performance and reducing greenhouse gas emission in vertical subsurface flow constructed wetland. J. Environ. Manag. 2021, 280, 111674. [Google Scholar] [CrossRef]
- Huttunen, J.T.; Alm, J.; Liikanen, A.; Juutinen, S.; Larmola, T.; Hammar, T.; Silvola, J.; Martikainen, P.J. Fluxes of methane, carbon dioxide and nitrous oxide in boreal lakes and potential anthropogenic effects on the aquatic greenhouse gas emissions. Chemosphere 2003, 52, 609–621. [Google Scholar] [CrossRef] [PubMed]
- Chen, X.; Zhu, H.; Yan, B.; Shutes, B.; Xing, D.; Banuelos, G.; Cheng, R.; Wang, X. Greenhouse gas emissions and wastewater treatment performance by three plant species in subsurface flow constructed wetland mesocosms. Chemosphere 2020, 239, 124795. [Google Scholar] [CrossRef] [PubMed]
- Maltais-Landry, G.; Maranger, R.; Brisson, J.; Chazarenc, F. Greenhouse gas production and efficiency of planted and artificially aerated constructed wetlands. Environ. Pollut. 2009, 157, 748–754. [Google Scholar] [CrossRef] [PubMed]
- Fey, A.; Benckiser, G.; Ottow, J.C.G. Emissions of nitrous oxide from a constructed wetland using a groundfilter and macrophytes in waste-water purification of a dairy farm. Biol. Fertil. Soils 1999, 29, 354–359. [Google Scholar] [CrossRef]
- Faulwetter, J.L.; Gagnon, V.; Sundberg, C.; Chazarenc, F.; Burr, M.D.; Brisson, J.; Camper, A.K.; Stein, O.R. Microbial processes influencing performance of treatment wetlands: A review. Ecol. Eng. 2009, 35, 987–1004. [Google Scholar] [CrossRef]
- Huang, L.; Gao, X.; Guo, J.; Ma, X.; Liu, M. A review on the mechanism and affecting factors of nitrous oxide emission in constructed wetlands. Environ. Earth Sci. 2012, 68, 2171–2180. [Google Scholar] [CrossRef]
- Maucieri, C.; Barbera, A.C.; Vymazal, J.; Borin, M. A review on the main affecting factors of greenhouse gases emission in constructed wetlands. Agric. For. Meteorol. 2017, 236, 175–193. [Google Scholar] [CrossRef]
- Li, M.; Wu, H.; Zhang, J.; Ngo, H.H.; Guo, W.; Kong, Q. Nitrogen removal and nitrous oxide emission in surface flow constructed wetlands for treating sewage treatment plant effluent: Effect of C/N ratios. Bioresour. Technol. 2017, 240, 157–164. [Google Scholar] [CrossRef]
- Lyu, W.; Huang, L.; Xiao, G.; Chen, Y. Effects of carbon sources and COD/N ratio on N2O emissions in subsurface flow constructed wetlands. Bioresour. Technol. 2017, 245, 171–181. [Google Scholar] [CrossRef]
- Zhou, X.; Jia, L.; Liang, C.; Feng, L.; Wang, R.; Wu, H. Simultaneous enhancement of nitrogen removal and nitrous oxide reduction by a saturated biochar-based intermittent aeration vertical flow constructed wetland: Effects of influent strength. Chem. Eng. J. 2018, 334, 1842–1850. [Google Scholar] [CrossRef]
- Winton, R.S.; Richardson, C.J. The Effects of Organic Matter Amendments on Greenhouse Gas Emissions from a Mitigation Wetland in Virginia’s Coastal Plain. Wetlands 2015, 35, 969–979. [Google Scholar] [CrossRef]
- He, G.; Li, K.; Liu, X.; Gong, Y.; Hu, Y. Fluxes of methane, carbon dioxide and nitrous oxide in an alpine wetland and an alpine grassland of the Tianshan Mountains, China. J. Arid Land 2014, 6, 717–724. [Google Scholar] [CrossRef]
- Yang, L.; Yuan, C.S. Analysis of carbon sink effects for saline constructed wetlands vegetated with mangroves to treat mariculture wastewater and sewage. Water Sci. Technol. 2019, 79, 1474–1483. [Google Scholar] [CrossRef] [PubMed]
- Chen, X.; Zhu, H.; Bañuelos, G.; Shutes, B.; Yan, B.; Cheng, R. Biochar reduces nitrous oxide but increases methane emissions in batch wetland mesocosms. Chem. Eng. J. 2020, 392, 124842. [Google Scholar] [CrossRef]
- Ji, B.; Chen, J.; Li, W.; Mei, J.; Yang, Y.; Chang, J. Greenhouse gas emissions from constructed wetlands are mitigated by biochar substrates and distinctly affected by tidal flow and intermittent aeration modes. Environ. Pollut. 2021, 271, 116328. [Google Scholar] [CrossRef]
- Pan, T.; Zhu, X.-D.; Ye, Y.-P. Estimate of life-cycle greenhouse gas emissions from a vertical subsurface flow constructed wetland and conventional wastewater treatment plants: A case study in China. Ecol. Eng. 2011, 37, 248–254. [Google Scholar] [CrossRef]
- Fortuniak, K.; Pawlak, W.; Siedlecki, M.; Chambers, S.; Bednorz, L. Temperate mire fluctuations from carbon sink to carbon source following changes in water table. Sci. Total Environ. 2021, 756, 144071. [Google Scholar] [CrossRef]
- Huang, C.M.; Yuan, C.S.; Yang, W.B.; Yang, L. Temporal variations of greenhouse gas emissions and carbon sequestration and stock from a tidal constructed mangrove wetland. Mar. Pollut. Bull. 2019, 149, 110568. [Google Scholar] [CrossRef]
- Smyth, A.R.; Loecke, T.D.; Franz, T.E.; Burgin, A.J. Using high-frequency soil oxygen sensors to predict greenhouse gas emissions from wetlands. Soil Biol. Biochem. 2019, 128, 182–192. [Google Scholar] [CrossRef]
- D’Acunha, B.; Johnson, M.S. Water quality and greenhouse gas fluxes for stormwater detained in a constructed wetland. J. Environ. Manag. 2019, 231, 1232–1240. [Google Scholar] [CrossRef] [PubMed]

| Soil pH | Soil Moisture Content (%) | Soil Carbon Content (%) | Soil Nitrogen Content (%) | |
|---|---|---|---|---|
| CW-1 | 6.71 ± 0.64 | 5.14 ± 1.14 | 0.69 ± 0.38 | 0.11 ± 0.06 |
| CW-2 | 7.69 ± 0.19 | 25.84 ± 9.84 | 1.43 ± 0.31 | 0.07 ± 0.03 |
| CW-3 | 7.28 ± 0.11 | 20.78 ± 6.04 | 0.89 ± 0.19 | 0.12 ± 0.03 |
| CW-4 | 7.80 ± 0.09 | 8.19 ± 2.38 | 0.64 ± 0.01 | 0.05 ± 0.01 |
| CW-5 | 6.32 ± 0.23 | 16.23 ± 2.17 | 0.28 ± 0.02 | 0.07 ± 0.01 |
| Average Temperature (°C) | COD/N | Influent COD (mg/L) | Influent NH4+-N (mg/L) | Influent TN (mg/L) | |
|---|---|---|---|---|---|
| CW-1 | 26.8 | 3 | 34.28 | 0.50 | 10.23 |
| CW-2 | 20.3 | 3 | 26.97 | 0.16 | 8.64 |
| CW-3 | 25.8 | 6 | 33.77 | 0.23 | 5.64 |
| CW-4 | 28.2 | 8 | 30.62 | 0.04 | 3.74 |
| CW-5 | 14.0 | >40 | 202.79 | 2.30 | 4.65 |
Disclaimer/Publisher’s Note: The statements, opinions and data contained in all publications are solely those of the individual author(s) and contributor(s) and not of MDPI and/or the editor(s). MDPI and/or the editor(s) disclaim responsibility for any injury to people or property resulting from any ideas, methods, instructions or products referred to in the content. |
© 2025 by the authors. Licensee MDPI, Basel, Switzerland. This article is an open access article distributed under the terms and conditions of the Creative Commons Attribution (CC BY) license (https://creativecommons.org/licenses/by/4.0/).
Share and Cite
Wu, W.; Mairemu, M.; Zheng, X.; Xiong, Y.; Xu, S.; Jiang, C.; Zhang, X.; Wang, J.; Liu, X.; Zhuang, X. Efficient Pollutant Removal and Low-Carbon Emission Mechanisms in Constructed Wetlands Synergistically Driven by Low COD/N Ratio and Coastal Location. Sustainability 2025, 17, 4168. https://doi.org/10.3390/su17094168
Wu W, Mairemu M, Zheng X, Xiong Y, Xu S, Jiang C, Zhang X, Wang J, Liu X, Zhuang X. Efficient Pollutant Removal and Low-Carbon Emission Mechanisms in Constructed Wetlands Synergistically Driven by Low COD/N Ratio and Coastal Location. Sustainability. 2025; 17(9):4168. https://doi.org/10.3390/su17094168
Chicago/Turabian StyleWu, Wenzheng, Maihaiti Mairemu, Xiaoxu Zheng, Yanghui Xiong, Shengjun Xu, Cancan Jiang, Xupo Zhang, Jinglin Wang, Xiaoxuan Liu, and Xuliang Zhuang. 2025. "Efficient Pollutant Removal and Low-Carbon Emission Mechanisms in Constructed Wetlands Synergistically Driven by Low COD/N Ratio and Coastal Location" Sustainability 17, no. 9: 4168. https://doi.org/10.3390/su17094168
APA StyleWu, W., Mairemu, M., Zheng, X., Xiong, Y., Xu, S., Jiang, C., Zhang, X., Wang, J., Liu, X., & Zhuang, X. (2025). Efficient Pollutant Removal and Low-Carbon Emission Mechanisms in Constructed Wetlands Synergistically Driven by Low COD/N Ratio and Coastal Location. Sustainability, 17(9), 4168. https://doi.org/10.3390/su17094168