Article

Microplastics in Surface Water in the Yangtze River, China: Basin-Wide Observation, Multiple Ecological Risk Assessment and Sustainability

State Key Laboratory of Simulation and Regulation of Water Cycle in River Basin, China Institute of Water Resources and Hydropower Research, Beijing 100038, China
*
Author to whom correspondence should be addressed.
Sustainability 2025, 17(9), 4162; https://doi.org/10.3390/su17094162
Submission received: 25 March 2025 / Revised: 25 April 2025 / Accepted: 28 April 2025 / Published: 5 May 2025

Abstract

:
The Yangtze River Basin (YRB) is an important source of marine microplastics (MPs). However, unscientific research methods in previous studies have led to inaccurate estimates of the occurrence and ecologic risk of MPs. This study aimed to comprehensively assess the distribution and ecological risks of MPs in the YRB, through investigating the occurrence of full-size MPs in the surface waters of the YRB over 3 years. The Size Effect was developed based on the impact of size and MP-carried pollutants on human health, and combined with multiple methods to evaluate the potential risks of MPs. The average MP abundance in the YRB was 8797 ± 12,281 items/m3, dominated by polypropylene and fragments. The small MPs (<0.3 mm; 92.52%) were the driving factor of the MP spatial heterogeneity. Interestingly, the Three Gorges Dam significantly altered the MP distribution and weakened the MP transportation. Agricultural activities, wastewater treatment plants, and atmospheric deposition were the main sources of MPs in the YRB. Multiple ecological risk assessment indicated that the MP risk in the YRB was at the middle–low level. This study addresses the occurrence of <0.05 mm MPs in the YRB, provides insights for MP risk assessment, and serves as a reference for sustainable management.

Graphical Abstract

1. Introduction

Microplastics (MPs), which are plastic particles smaller than 5 mm in diameter, have emerged as serious environmental contaminants because of their widespread distribution and persistence in various ecosystems [1]. These small particles originate from the fragmentation of large plastic debris in the natural environment or are intentionally manufactured for use in consumer products. Research on MPs has intensified over the past decade, focusing on their sources, transport pathways, and ecological impacts [2]. Notably, MPs are derived from a variety of sources, including personal care products, industrial uses, plastic waste, textiles, and tire wear [3,4], and their migration path involves multiple links, including land transport [5,6], river transport [7], ocean circulation [2] and atmospheric deposition [8]. These diverse sources increase the complexity of MP pollution, and the potential harm to ecosystems and human health cannot be ignored.
In recent years, MP pollution of the water environment in China has attracted increasing attention [9]. Initial research focused on coastal and estuarine environments, where MPs are abundant [10]. Recognition of the importance of studying MPs in freshwater systems, particularly in major river basins such as the Yangtze River, has grown [7]. In recent years, studies on MPs in the Yangtze River have gradually expanded from regional to watershed scales. Methodological differences among studies, including sampling methods, sample processing procedures, and analytical techniques, hinder the direct comparison of results [11,12]. Previous studies have mainly adopted a quantitative method based on the random selection of suspected particles, in which several or a certain proportion of plastic-like items were randomly selected from the particles of each sample for identification, followed by the calculation of MP abundance and characteristic proportion to represent the overall results of the sample [12,13,14]. However, brighter and larger plastic-like particles are more likely to attract the attention of researchers during selection [15], which may result in a subjective misjudgment of the feature ratio. Moreover, compared with Fourier transform infrared spectroscopy [16], micro-Raman spectroscopy has a higher spatial resolution of up to 1 μm [17]. However, due to the limitations of sampling technology and detection means, previous studies on MP size in the Yangtze River Basin (YRB) have mainly focused on particles in the >0.05 mm or >0.3 mm size ranges, and studies on small MPs (SMPs, <0.3 mm) in a wider size range are relatively insufficient (Table S1). However, SMPs may comprise the majority of MPs in the environment [18]. Thus, neglecting SMPs in research implies an underestimation of environmental abundance and a misjudgment of the proportion of MPs with different features, such as shape and polymer type, which in turn hinders the effective assessment of potential environmental and health risks.
Risk assessment of MPs is the basis for environmental management and policy development. To address growing global concern about MP pollution, assessing the risks posed by MPs to freshwater ecosystems is particularly urgent. Current risk assessment methods for MPs, such as the Pollution Load Index (PLI), H score, and Environmental Status Index (ESI), mainly focus on their chemical and physical effects [15,19,20,21]. And the predicted non-effect concentration (PNEC) obtained from the Species Sensitivity Distribution (SSD) was used as the background abundance value of the PLI to evaluate the MP pollution load of freshwater sediment organisms [22]. However, these assessment methods ignore the size characteristics of MPs and the effects of chemicals associated with MPs on human health. Chowdhury, et al. [23] proposed the Threshold Microplastics Concentration (TMC) to assess the potential health risks caused by contaminants retained on waterborne MPs. However, the TMC is a theoretical framework and has not been applied to actual cases. Due to the differences in drinking water standards and MP treatment efficiencies among drinking water treatment plants (DWTPs) across countries or regions [24,25], the application of this concept needs to be adjusted according to the situation in different regions. In addition, a single evaluation method may overestimate or underestimate watershed risk. Studies that comprehensively consider MP abundance, polymer type, morphology, size, and impact on biological and human health are scarce.
Therefore, the objectives of this study were to (i) systematically conduct field monitoring of MPs in the surface waters of the YRB for 3 years; (ii) investigate the full-size distribution (0.01–5 mm), stability, and sources of MPs; and (iii) develop a new risk assessment indicator, considering the Size Effect (SE) of MPs and their impact on human health. This study comprehensively assessed the current situation of MPs in the YRB by combining multiple risk assessment methods. Our results revealed the spatial distribution characteristics of MPs in the YRB, providing an important reference for studies on the fate, transport, and potential impacts of MPs in river ecosystems.

2. Materials and Methods

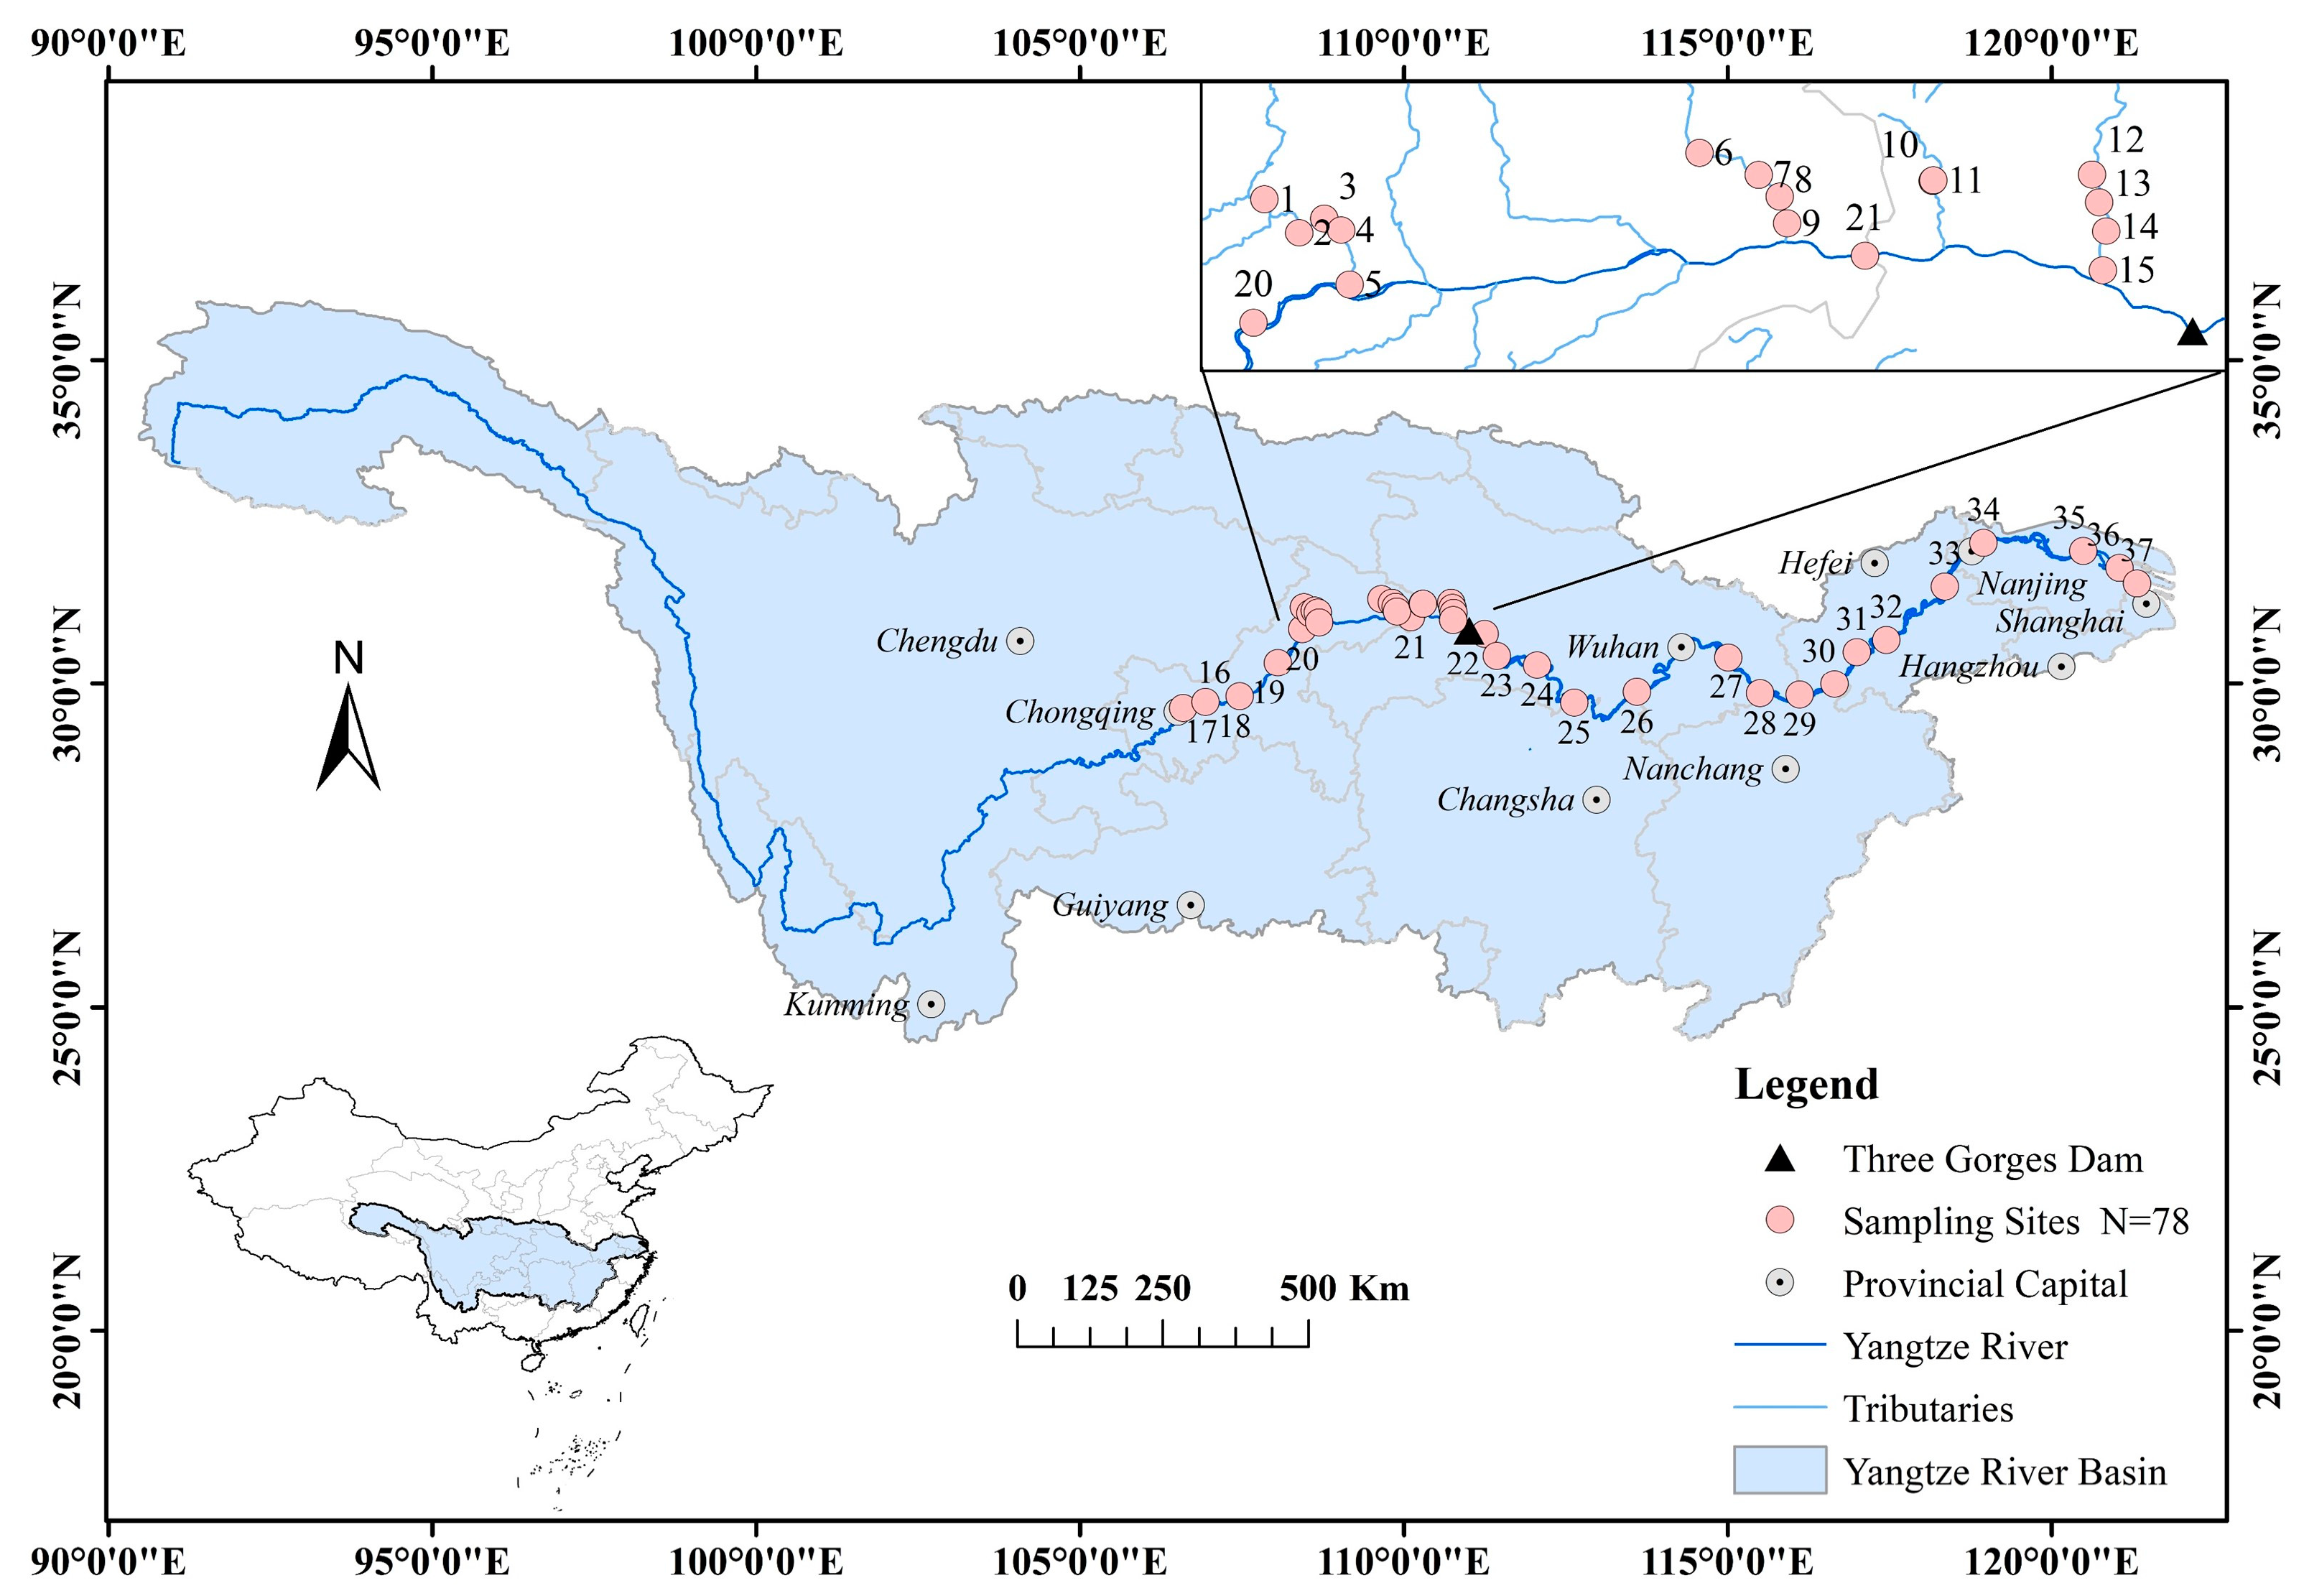
2.1. Survey Area and Sample Collection

The Yangtze River, which runs through the central part of China from west to east, has hundreds of tributaries that spread out in the north and south. From September 2021 to November 2023, 78 surface water samples were uniformly collected at 37 riverine sites along the Yangtze River (Table S2, Figure S1). The distribution of the sampling sites is shown in Figure 1. For each sampling, approximately 10 L of surface water was collected using a stainless-steel barrel. All samples were preserved using built-in ice packs and transported to the laboratory for further analysis.

2.2. Sample Pretreatment and MP Identification

First, MPs were separated from the water samples according to the method described by Xu, et al. [15]. Subsequently, all samples were observed and photographed using a high-definition microscope (SC-III, Shanghai, China). Finally, all suspected MP particles on the filter membrane were examined under a DXR2 Raman microscope (Thermo Fisher Scientific, Waltham, MA, USA), and the number, polymer type, size, and morphology of particles identified as MPs (match exceeded 60%) were recorded (Figure S2). The minimum size that could be detected in this study was 10 μm.

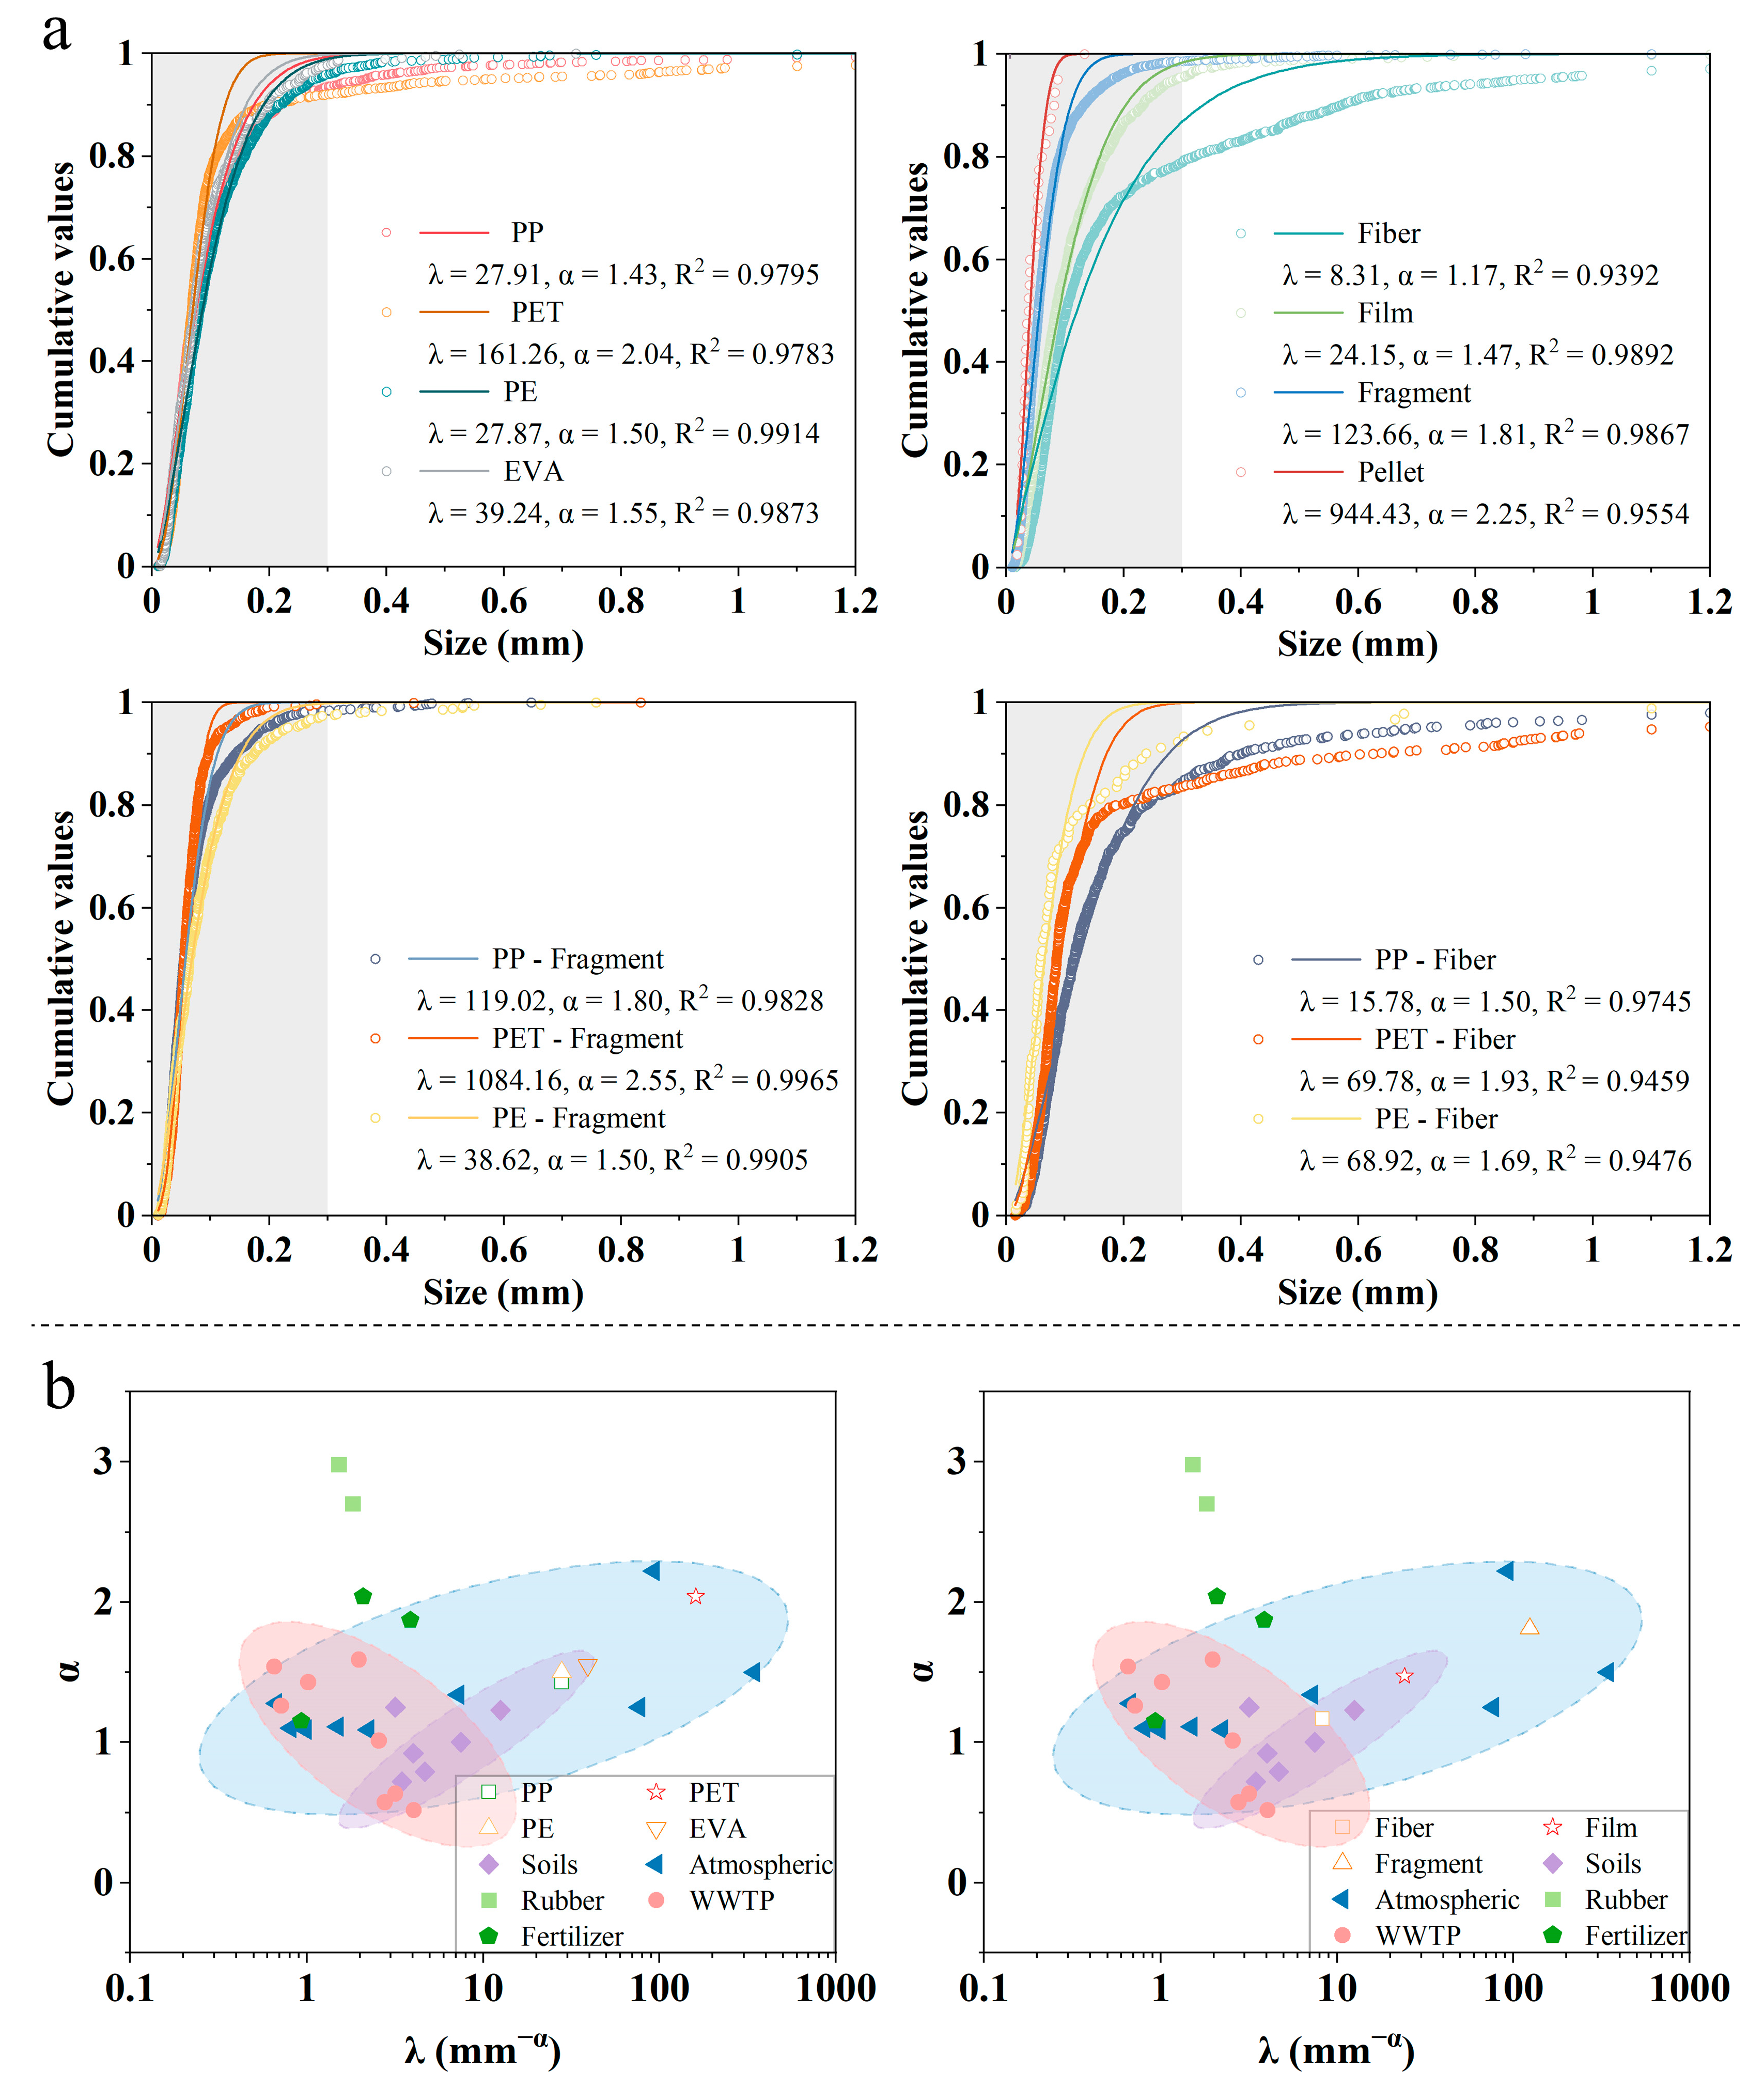
2.3. Fragmentation and Stability Analysis

Wang, et al. [25] proposed a Conditional Fragmentation Model (CFM) based on conditional probability to explain the size distribution of MPs subjected to conditional aging in the environment. The CFM has been proven to be an effective method for understanding the fragmentation, stability, and traceability of MPs [15,26]. This study used the CFM to understand the fragmentation and stability of MPs of different morphologies and polymer types in the YRB. The cumulative distribution function of MPs was expressed as follows:
F ( x ) = 1 e λ x α   ( x     0 )
where λ denotes the size range of MPs, with a higher value of λ indicating a smaller size range and a higher degree of fragmentation; and α represents the stability of MPs. The higher the α value, the more stable the MP, indicating that further fragmentation is limited. When α > 1, larger MPs are more likely to be broken than smaller MPs [26]. MPs from different environmental samples had different values of λ and α (Table S3), whereas close values of λ and α indicate that MPs have a similar origin. In this study, the λ and α values of MPs with different morphologies and polymer types were calculated, and a more in-depth analysis was performed to determine the sources of MPs.

2.4. Pollution Risk Assessment

2.4.1. PLI, H Score, and ESI

The PLI, H and ESI are described in Text S1. The PLI of MPs [15], which is based on their abundance, was used to evaluate the pollution levels in the YRB. In this study, an SSD based on MP exposure to fresh water was constructed for species types in the YRB, and the PNEC values derived in the SSD method were used as background values of the PLI, as detailed in the Supplementary Materials (Text S2). Based on the chemical toxicity risk score of the MP polymers provided by Lithner, et al. [27], the toxicity index of the different polymers was calculated to obtain the H score. The ESI was based on the analysis of MP shape and the evaluation of the effects of MPs on the health of organisms [21].

2.4.2. Size Effect

For the SE method, this study used the TMC model to determine the safe concentrations of different MP size ranges for the YRB to assess the impact of water environmental MPs on human health. The TMC model was developed by Chowdhury, et al. [23] to assess whether the concentration of MPs in water is likely to lead to the adsorption of chemical contaminants to drinking water health standards, as detailed in the Supplementary Materials (Text S3).
Within a specific size range, if the sample MP abundance exceeded the TMC, the MPs in this size range were considered to have potential effects on human health. The SE was calculated as follows:
SE i = j m C j TMC j
SE area = SE 1 × SE 2 × × SE i × × SE n n
where i is the sample; j represents the classification of size groups; m is the number of MP size groups; Cj is the abundance of MPs in group j; TMCj is the corresponding TMC threshold in group j, which is the threshold of MP abundance in raw water (Table S4); SEi represents the sum of the MP size risk indices in sample i; and SEarea represents the regional MP size risk. The SE risk was divided into five levels (I–V, Table S5).

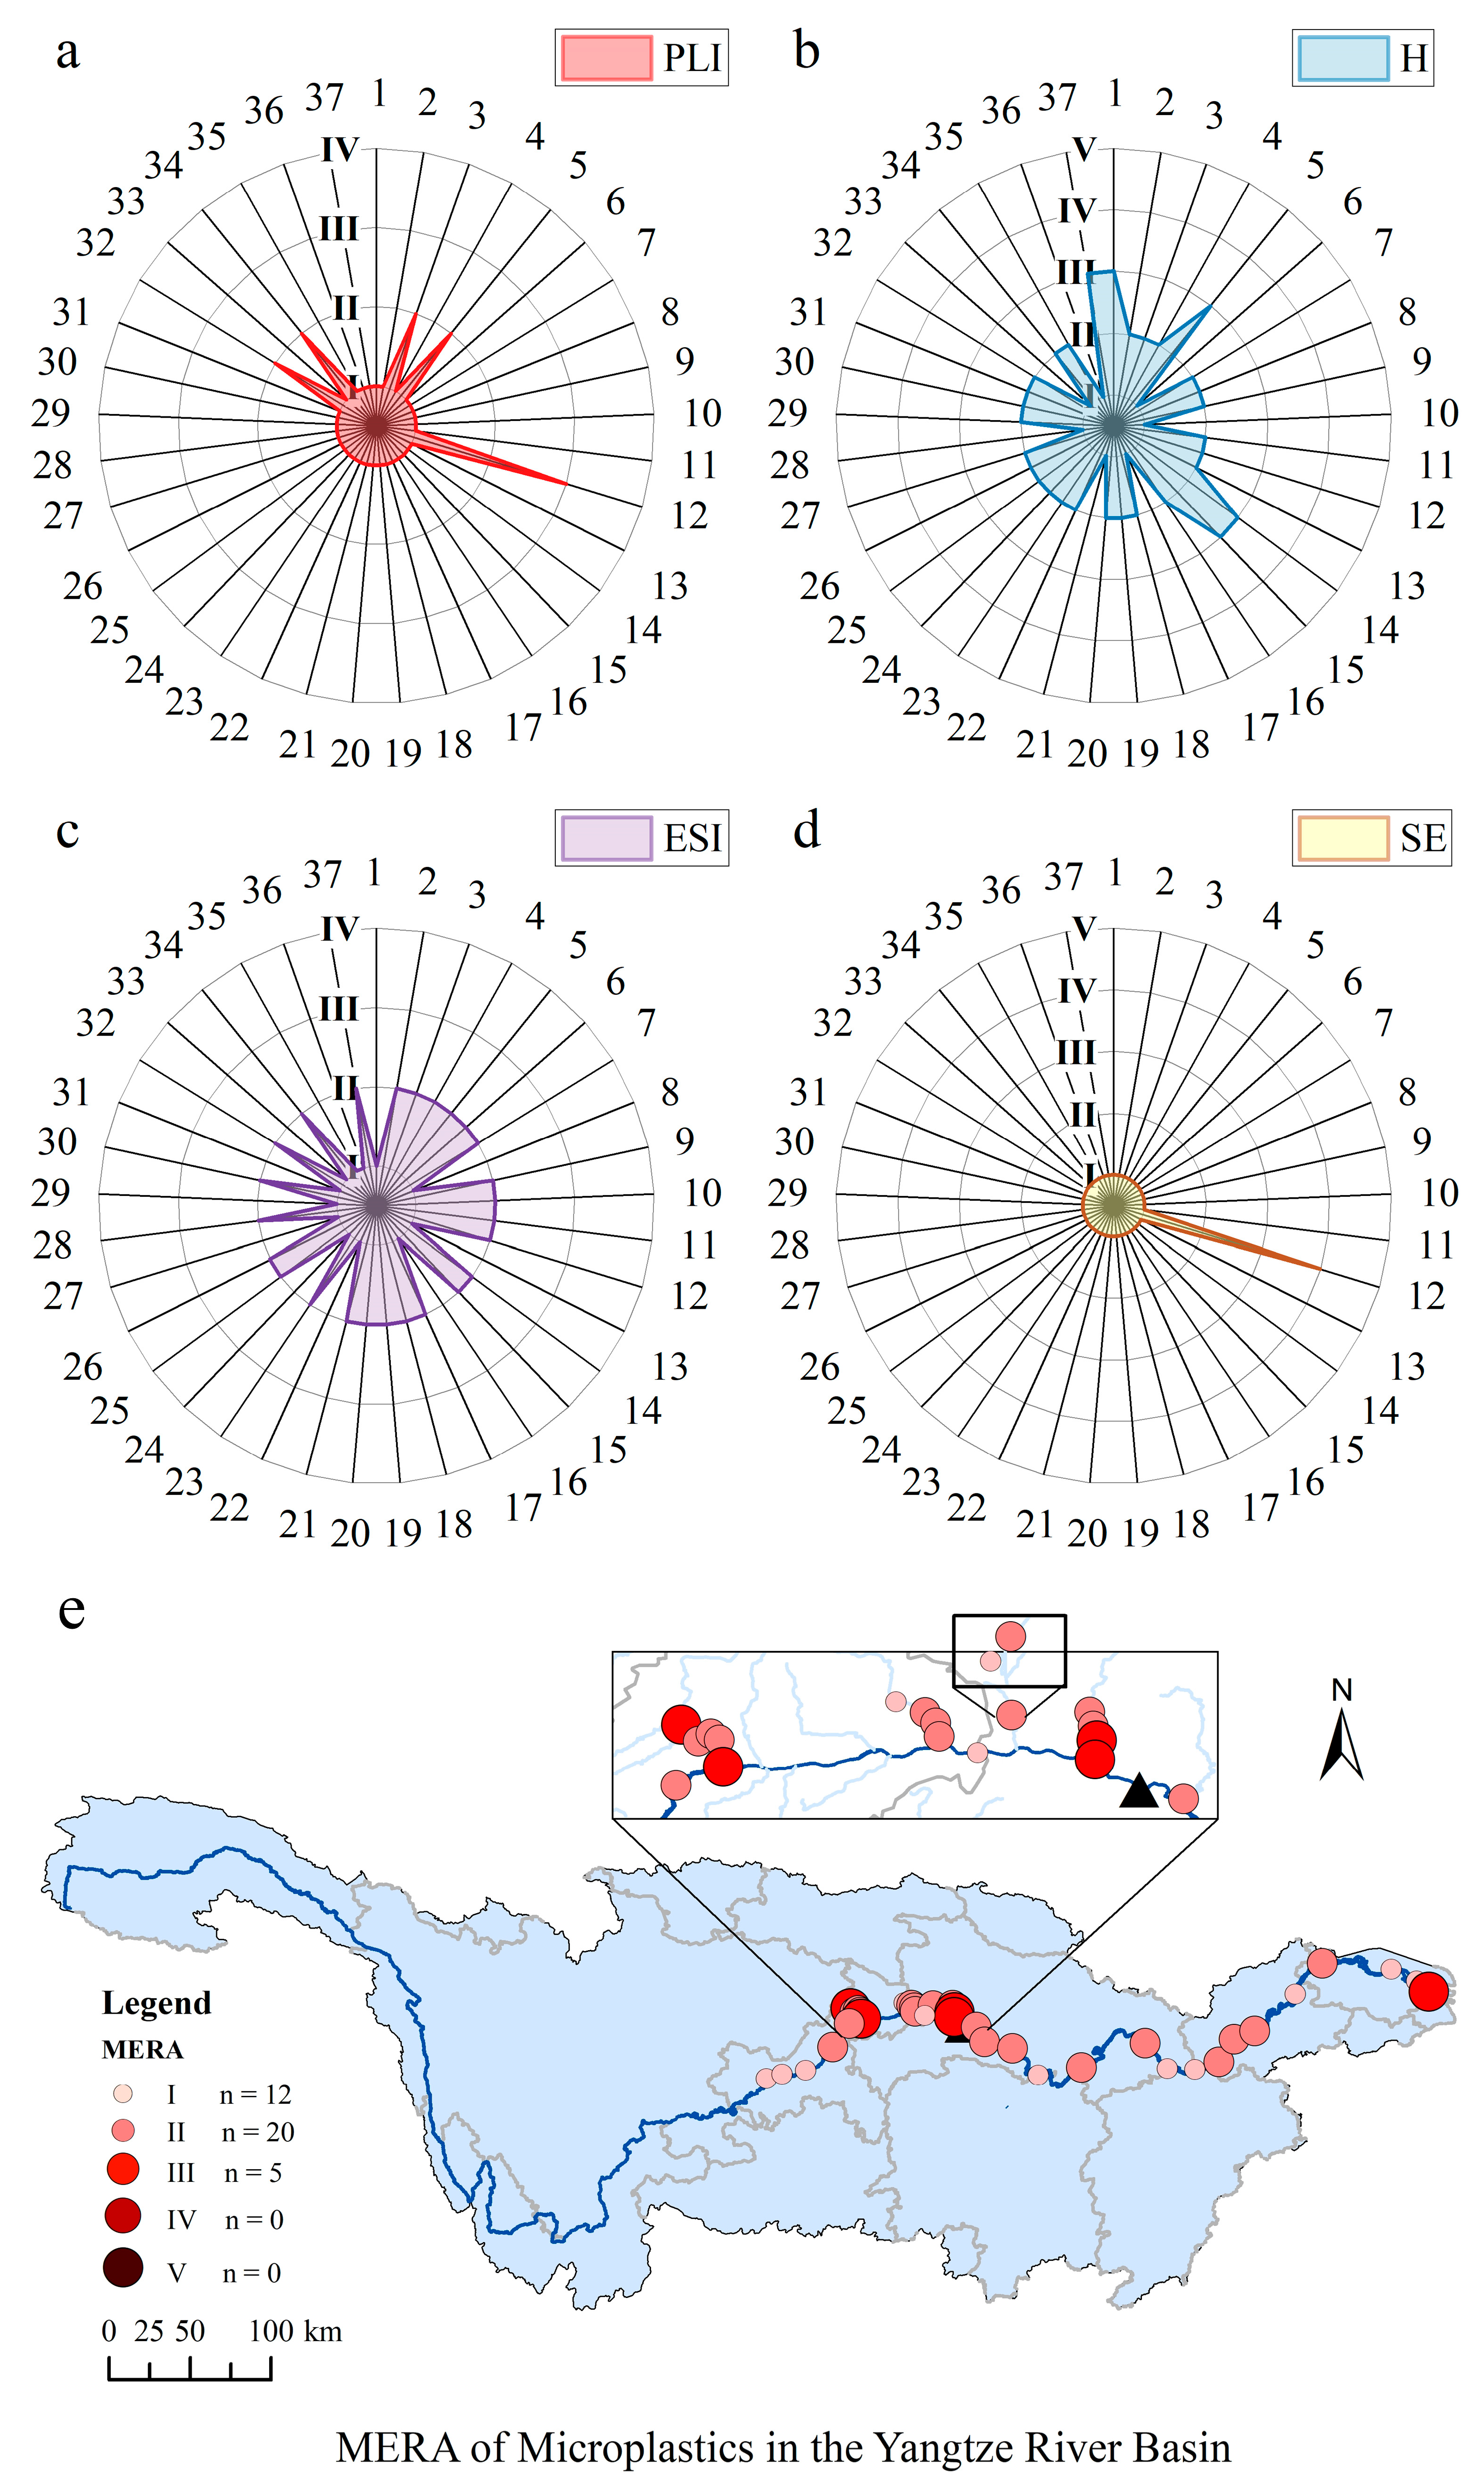
2.4.3. Multiple Ecological Risk Assessment

Based on the concept of β coefficient in the financial field, the BMPCm of BetaMP (Text S1) was first applied in the field of MP environmental risk by Huang, et al. [19] to evaluate the contribution and obtain the weight coefficients of risk assessment methods (PLI, H, ESI, and SE). The weight of each risk index was multiplied by its corresponding risk score (Table S6). The multiple ecological risk assessment (MERA) value was obtained by summing the scores of each index for each samples [20] as follows:
MERA i = m i × BMPC m
MERA area = MERA 1 × MERA 2 × × MERA i × × MERA n n
where mi is the score of each MP risk index in sample i; BMPCm represents the weight coefficient of each risk index; MERAi represents the MP comprehensive risk value in sample i; and MERAarea represents the final MP comprehensive risk value in the region. The MERA risk levels ranged from I to V (Table S5).

2.5. Quality Control and Data Analysis

All the experimental instruments and tools were thoroughly washed with ultrapure water before use. The samples and instruments were sealed with aluminum foil and metal lids to prevent airborne MP contamination. Nitrile gloves and cotton clothing were worn during the sampling and experiments. The same pretreatment procedure was used for the blank test with ultrapure water. This study detected 0–2 plastics in the blank sample, confirming that contamination was negligible. The principal component analysis and Spearman correlation analysis of the size characteristics of MPs were plotted by Origin 2021. The Mann–Whitney U test was applied to determine significant differences using Origin 2021 (significance level, p < 0.05, 0.01, and 0.001). Sampling and MERA maps were constructed using ArcGIS 10.7. The CFM was developed using Excel 2016 and Origin 2021. All other figures were generated using Origin 2021.

3. Results and Discussion

3.1. Occurrence and Composition of MPs in the YRB

3.1.1. Abundance of MPs

A total of 6862 particles were identified as MPs, which were widespread in varying amounts in the surface water across all sites of the Yangtze River. The average abundance was 8797 ± 12,281 items/m3 and ranged from 600 items/m3 to 95,300 items/m3. The highest abundance occurred in the tributary of Xiangxi River (XXR, S12-1), and the lowest value occurred in the main stream of Liu Zuo (S29-1) (Figure S1). The MP abundance in the YRB had a high coefficient of variation (CV = 140%), showing distinct spatial heterogeneity. Further research is required to examine possible reasons for this spatial heterogeneity. Therefore, the long-term monitoring of MPs in the YRB is necessary.
This study recorded average MP abundances that were 5.4, 6.9, 3.6, and 1.7 times those reported in the basin-wide field studies of He, et al. [12] (1635 items/m3), Yuan, et al. [13] (1270 ± 830 items/m3), Chen, et al. [28] (2437 ± 2468 items/m3), and Xia, et al. [14] (5130 ± 5230 items/m3), respectively. One of the reasons for this large discrepancy is that the MP abundance at sample sites in the tributary of XXR (S12-1, 95,300 items/m3) and in the main stream (S34-1, 46,100 items/m3) increased greatly, which may have been caused by point source discharge. The mean value was 7168 ± 5816 particles/m3 when these two maxima were removed. The detected size distribution is also an important reason for these differences. The detected size distribution is also an important reason for these differences. Compared with previous basin-wide studies, this study considered smaller screen sizes and a wider size distribution of MPs, with the minimum particle size detected being 0.01 mm (Figure S3). However, MPs in the <0.05 mm size range accounted for 31.59% of the total MPs in this study (Figure 2a), confirming those studies that detected MPs with >0.5 mm size range seriously underestimated the MP abundance.

3.1.2. Size of MPs

The size classification of MPs is presented in Figure 2a. Notably, SMPs (<0.3 mm) accounted for the largest proportion, at 92.52%, of which particles in the ranges of 0.01–0.05 mm, 0.05–0.1 mm, and 0.1–0.3 mm accounted for 34.15%, 40.81%, and 25.04%, respectively. This was followed by normal MPs (NMPs, 0.3–1 mm; 6.24%) and large MPs (LMPs, 1–5 mm; 1.24%). The abundance of floating plastics generally increased with an increase in particles in the <0.05 mm size range and decreased with an increase in particles in the 0.05–5 mm range (Figure 2b). Most studies have reported that SMPs are predominant [15,29]. The minimum size of the MPs, determined by the sampling method [30] and the accuracy of the analytical instrument, can generally be divided into 0.02, 0.05, 0.112, and 0.333 mm. However, previous studies in the YRB were mainly conducted using a mesh size of 0.05 or 0.3 mm (Figure S3). Sampling methods with mesh sizes of 0.112 or 0.333 mm generally involve trawling (Table S1), which has been shown to result in much higher omissions of SMPs than water filtration methods [12]. The large proportion of MPs in the <0.05 mm size range in this study also suggests that studies using 0.05 mm aperture sieves might substantially underestimate the abundance of MPs.
The principal component analysis results (Figure S4a) indicated that the size characteristics of MPs can explain 56.4% of the distribution of different areas. MPs in the size range of 0.01–0.05 mm, 0.05–0.1 mm, 0.1–0.3 mm, and 0.3–0.5 mm had high contributions to the first principal component vector (PC1), which indicated that they had a great impact on the data variation. Moreover, the correlation analysis results (Figure S4b) showed that the MP abundance in the 0.01–0.05 mm, 0.05–0.1 mm, and 0.1–0.3 mm size ranges had significantly strong positive correlation with the abundance of the full-size MPs (R > 0.8, p < 0.001). This suggests that SMPs were the main factors affecting sample abundance and were a driver of the high spatial heterogeneity of MPs in the YRB. The detection limitations of high-tech instruments and time restrictions were the main reasons for setting a larger minimum size. However, the absence of SMPs (especially neglected were particles < 0.05 mm) not only leads to underestimates of the MP abundance but also to misrepresentation of the proportions of MPs with different morphologies and polymer types in general.

3.1.3. Polymer Types of MPs

Thirty-five polymer types were identified (Figure 2a). Polypropylene (PP, 33.20%) was predominant and present in samples from all sites in the YRB, followed by polyethylene terephthalate (PET, 24.25%), polyethylene (PE, 18.87%), ethylene-vinyl acetate copolymer (EVA, 6.97%), styrene/butyl methacrylate (3.29%), polystyrene (2.87%), poly(3-hydroxybutyrate acid-co-3-hydroxyvalerate acid) (PHBV, 2.52%), nylon (2.36%), polyamide (1.09%), polyvinyl chloride (PVC, 0.99%), and others jointly accounting for 3.58%. Notably, PP, PE, and PET have often been reported as the main polymer types in the YRB (Table S1), mainly dominated by SMPs (Figure 2b). In this study, PP and PE were the most widely distributed, and they are the two most widely produced and used plastics worldwide [31]. Meanwhile, PP and PET are found even in remote areas worldwide [32,33,34]. As MPs of different polymer types are related to their applications, the diversity of polymers can be used to reflect the complexity of MP sources [13]. Compared with the Yellow River [35] and Pearl River [36,37], the Yangtze River has a wider variety of polymers because the YRB contributes to more than 1/3 of China’s GDP, carries nearly 1/3 of its population [38], and has diverse industries.

3.1.4. Morphology of MPs

The MPs were categorized into four morphologies: fibers, fragments, films, and pellets. Fragments (53.48%) were dominant in the surface water, followed by fibers (27.99%), films (17.94%), and pellets (0.58%) (Figure 2a). Except for that at the site in the XXR (S12-1), the proportion of fragments exceeded 30% at all samples, and this was the dominant morphology at nearly all samples. This finding contrasts with previous reports that fibers were the main component in the Yangtze River (Table S1). This discrepancy may be caused in the following respects. On the one hand, most of the previous studies identified MPs by randomly selecting suspected particles, and large particles were more likely to be selected [15]. However, fibers tend to have a larger size distribution than fragments [39]. In this study, the MPs in the >0.1 mm size range were dominated by fibers, while those in the size range of <0.1 mm were mainly fragments. Therefore, the method of randomly selecting suspected particles may lead to an increase in the proportion of fibers. On the other hand, the proportion of fragments (74.72%) was much higher than that of fibers (10.62%) in the size range of <0.05 mm (Figure 2a), indicating that studies that did not consider MPs with a size smaller than 0.05 mm underestimated the proportion of fragments.

3.2. Regional Distribution and Characteristics of MPs in the YRB

The average abundance of MPs upstream from the Three Gorges Dam (TGD, 10,873 ± 14,918 items/m3) was significantly higher than that downstream from the dam (6613 ± 8351 items/m3) (Mann–Whitney U test, p < 0.001), which indicated that dam scheduling affected the migration of MPs in surface water [40]. The TGD substantially altered the distribution of MPs with different sizes, polymer types, and morphologies in the upstream and downstream regions (p < 0.05). In terms of size distribution, SMPs represented the principal size both upstream and downstream from the TGD (Figure 3a), followed by NMPs and LMPs. However, the SMPs reflected a difference in the size distribution between the upstream and downstream regions of the TGD (p < 0.05). In particular, the proportion of particles <0.05 mm in size decreased from 35.1% upstream to 25.5% downstream (Figure 3a). After the construction of the reservoir, changes in the hydrological regime promoted the preferential sinking of SMPs [41]. Chen, et al. [42] demonstrated that SMPs were the major components of MPs in the sediments of the Three Gorges Reservoir (TGR). This implies that a higher proportion of floating SMPs upstream from the TGD is likely to settle in the sediment of the reservoir. The proportion of MP polymer types upstream from the TGD was as follows: PP (35.6%) > PE (25.5%) > PET (14.0%); the proportion downstream was PET (42%) > PP (29.1%) > PE (7.4%) (Figure 3a). This high proportion of PET downstream might be due to its multiple sources. Regarding the morphology of the MPs, the proportion of films upstream and downstream from the dam showed the greatest difference (Figure 3a). The proportion of films decreased from 23.3% upstream to 8.7% downstream, representing a change of 14.6%. In addition, the comparison of the <0.05 mm size range upstream and downstream from the TGD revealed differences in the main polymer type (Figure 3a). The proportion of PHBV increased considerably in the <0.05 mm size fraction downstream from the TGD, becoming the second most common polymer type. This was due to the fact that this biodegradable plastic was more likely to age and break apart [43].
In the TGR, the average abundance in the tributary was 12,154 ± 17,142 items/m3, which was higher than that in the main stream (7883 ± 7338 items/m3). The MPs in the main stream and tributary of the TGR differed in size, polymer type, and morphology (Figure 3b). The dominant size group was SMPs, with a considerable proportion in the main stream and tributary of the TGR, accounting for 87.84% and 94.12%, respectively. The higher proportion of SMPs in the tributary of the TGR chiefly depended on the increased proportion of smaller MPs in the <0.05 mm range (Figure 3b). The dominant polymer type in the main stream of the TGR was PP, with a proportion of 57.7%, followed by PE (10.3%), whereas the proportions of PE (29.7%) and PP (29.4%) in the tributary were comparable. Fragments were the main morphology in the main stream and tributary of the TGR, but the proportions of fibers and films differed. In the tributary of the TGR, PE and films often appeared in bundles (in the form of filmed-PE) and most originated from XXR. Moreover, the dominant polymer types in the <0.05 mm range also differed between the main stream and tributary of the TGR. Notably, polydimethyl siloxane was second only to PP, accounting for 9.0% of MPs in the main stream of the TGR (Figure 3b). This was attributed to the high contribution of Pei Shi (S21-1) in the main stream to polydimethyl siloxane (4100 items/m3), which might have been derived from point source emissions. There was no statistically significant difference in the distribution of the most important MP polymer types and morphologies between the main stream and tributary of the TGR (p > 0.05), although their proportions were variable (Figure 3b).

3.3. Stability and Conditional Fragmentation Model of MPs in the YRB

This study used the CFM to analyze the fragmentation and stability of MPs with different morphologies and polymer types (Figure 4a). For the morphology of MPs in the YRB, the λ values of fragments and pellets were significantly higher than those of fibers and films (λfiber = 8.31 < λfilm = 24.15 < λfragment = 123.66 < λpellet = 944.43), aligning well with the experimental observation. Fragments comprised the majority of SMPs, whereas fibers tended to have a larger size distribution. The α values showed a rising trend from fibers to pellets (αfiber = 1.17 < αfilm = 1.47 < αfragment = 1.81 < αpellet = 2.25), suggesting an increase in stability. Larger fibers and films are more prone to aging degradation, but the weathering of smaller fragments and pellets is inhibited. Notably, films had a small α value, suggesting that the high abundance of films in XXR might be further increased.
For the major polymer types, the order of the λ values was PET (161.26) > EVA (39.24) > PP (27.91) > PE (27.87); the order of the α values was PET (2.04) > EVA (1.55) > PE (1.50) > PP (1.43) (Figure 4a). Based on these results, PET exhibited the smallest size range and was the most stable. Previous studies have suggested that PET exists predominantly in the form of large fibers; however, this study found that the proportion of small-sized PET was not low (Figure 2b). The α values of fibrous and fragment-shaped PET were higher than those of PP (Figure 4a). This suggests that regardless of the shape, PET tends to degrade preferentially over PP to reach a stable state.

3.4. Source Identification of MPs in the YRB

This study extracted the results obtained from the CFM described above and used the information on the fragmentation and stability of various environmental media to provide support for the source identification of MPs in the YRB [26]. This study identified agricultural activities, wastewater treatment plants (WWTPs), and atmospheric deposition as the main sources of MPs in the YRB. The λ and α values are shown in Figure 4b and Table S3. The soil group covered a range of fibers, films, PP, PE, and EVA. This classification indicates that MPs with these five characteristics in surface water were predominantly derived from agricultural activities in the YRB. Previous studies have shown that MP distribution in the YRB is affected by emissions from cropland, such as agricultural mulch film and synthetic fibers in sludge-treated soil [28,44]. In this study, most film-shaped PE and EVA were found in XXR, contributing 13.82% of the total MP abundance in the YRB, which may be related to frequent agricultural activities in this area. Both PP and fibers are commonly used in agricultural supplies such as mulch films, agricultural shade nets, and woven fertilizer bags [45], as well as in fishing lines and nets commonly used in aquaculture [46]. It is well established that WWTPs are an important source of fibers [47]. Fibers entering the environment through WWTPs typically originate from the textile and laundry industries. In this study, large amounts of fibrous PET and nylon were found, which may have been shed from textiles during washing [48,49].
Notably, the information points of various polymers and the morphology of MPs were included in the atmospheric deposition group, indicating that atmospheric deposition could be the input route for many different types of MPs in the YRB. This result was similar to that of a recent study by Liu, et al. [50], who found 20 different MP polymer types in the atmosphere of coastal cities of the Yangtze River, all of which were detected in different shapes, with the 20–50 μm size range and fragments representing the highest proportions. It has also been demonstrated that fibers and PET were the main components of atmospheric fallout over the Tibetan Plateau [34]. Future research should explore additional CFM of MPs at different environmental intervals to comprehensively improve the success rate and reliability of MP source identification.

3.5. Potential Ecological Risks of MPs in the YRB

Multiple commonly used ecological risk assessment methods for MPs (PLI, H score, and ESI), as well as the SE indicator developed in this study based on the toxic effects of pollutants adsorbed to MPs, were used to comprehensively assess the exposure risk of MPs in the YRB. The PLI results showed that 86.49% of the sampling sites were not contaminated with MPs (PLI < 1; Figure 5a). The overall PLI of the YRB was Level I (PLI = 0.51), indicating that the risk of MP contamination in the basin was low. Considering the chemical toxicity coefficients of the polymers, the H score was rated as Level II (H = 29.55). However, only 18.9% of the sample points had an H score of Level I, whereas 13.5% of the sample points had an H score of Level III (Figure 5b), which was primarily due to the contribution of highly toxic PVC (S = 10,001) [27], which considerably increased the risk of toxicity despite the low abundance of PVC at the individual sampling sites. This highlights the potential risks posed by the widespread presence of MP polymers that are highly toxic in the YRB. For the ESI, 67.6% of the sampling sites reached Level II, and the overall ESI of the YRB was Level II (ESI = 1.25), indicating that the environmental status of the YRB was at a moderate risk level (Figure 5c).
The SE indicator developed in this study was introduced to evaluate the potential risks of MPs to human health in the YRB. In general, the risk of SE in the YRB was low (SE < 1; Level I). Except for site S12 in the XXR (Level IV), which had a significantly higher SE value than the other sites, indicating high risk, the remaining sampling sites were Level I (Figure 5d). This was attributed to the extremely high abundance of MPs in site S12, which formed a hotspot. And the MPs in the size range of 0.1–0.3 mm in site S12 exceeded the corresponding safety threshold. Although LMPs had the strongest ability to carry pollutants, most of them were intercepted and removed after the water treatment process in DWTPs. For SMPs, the removal efficiency of MPs in the <50 μm size range in DWTPs was low, but their ability to carry pollutants was limited, and the corresponding safety threshold was quite high (Table S4). The worst-case scenario was adopted in the construction of the TMC [23]; therefore, the SE value was also a conservative estimate. The actual environmental risks are conceivably less severe but still warrant increased attention. Since the removal efficiency of MPs in drinking water is directly related to the scope of TMC, our results suggest that local drinking water management should be strengthened. Effective methods for the removal of MPs should be sought, and MP-related indicators should be included in drinking water hygiene standards.
This study utilized MERA to evaluate the pollution risk of MPs in the YRB by considering four indicators (PLI, H, ESI, and SE). The MERA value was 8.02 (Level II) in the YRB, indicating that the YRB has a moderate pollution risk. The MERA values in different areas were in the following order: upstream > downstream from the TGD; tributary > main stream in the TGR. Compared with the downstream area of the TGD, the pollution risk of MPs in the TGR should be considered more extensively. The TGR is an important reservoir of water in China. The pollution risk of MPs in the main stream of the TGR requires further investigation, as the main stream is a sink for pollutants from the tributary [28]. In terms of the sampling sites, the MERA values of MPs in the YRB ranged from 1.53 to 78.92 (Level I–III) (Figure 5e) with a large CV (120%). The results showed that 13.5% of the sampling sites had Level III MERA values, including the Pengxi River and XXR tributaries and the Yangtze River estuary (Figure 5e). The main reason for the higher risk was the presence of highly toxic PVC in these locations. In conclusion, it is necessary to control MP pollution in the YRB, and the government should focus on tributaries and the Yangtze River estuary, as well as point source pollution.

3.6. Management of Microplastics in Aquatics Systems

To minimize the risk of MP pollution and achieve environmental and sustainable development, the government should adopt a multi-dimensional strategy to strengthen the management of MP emissions, including source control, prevention, remediation, and systematic monitoring and assessment [51]. The source control measure is designed to reduce the importation of MPs into the environment. It entails strengthening the regulatory constraints on the production and use of plastics (such as the ban on using plastic bags), promoting degradable plastics, and guiding consumer behavior through public education to reduce the use of disposable plastic [52]. The prevention measure aims at intercepting MPs from the environment. The key is to effectively capture MPs in wastewater, especially SMPs and nano-plastics, by optimizing wastewater treatment systems, including the use of membrane filtration and biodegradation techniques [52,53]. Moreover, stormwater management facilities should be improved to prevent surface runoff from carrying plastic particles into rivers [51]. Remediation technologies such as biochar adsorption and chemical degradation can remove MPs from water. Monitoring and assessment are the basis of scientific decision-making. This necessitates the establishment of a global standard for MPs monitoring [52], such as the deployment of digital detection platforms, to track the distribution of MPs in real time and dynamic adjustment of governance strategies. Moreover, the water quality standards for MPs with respect to human and organism health effects should be included in relevant specifications as soon as possible. Future research should focus on the health risks and migration mechanism of nano-plastics and improve the collaborative governance system of the whole watershed.

4. Conclusions

In this study, the abundance, whole-size characteristics, stability, and source identification of MPs in the YRB were investigated over a period of 3 years. A new evaluation index, SE, was introduced, and MERA was used to comprehensively evaluate the exposure risk of MPs. The results showed that the average MP abundance in surface water in the YRB was 8797 ± 12,281 items/m3, which was higher than that reported in previous studies. Fragments (53%), PP (33%), and SMPs (92.52%) were the main morphology, polymer type, and size class of MPs in the YRB. In particular, SMPs played an important role in MP pollution and were the main drivers of spatial heterogeneity in the YRB. The upstream and downstream regions of the TGD show significant differences in terms of abundance, size distribution, polymer types, and morphology (p < 0.001). Although the proportions of polymer types and morphologies differed between the main stream and tributary of the TGR, there were no significant differences. The CFM analysis showed that the fragments were more stable, and that the fibers tended to have a large size distribution. This study determined that MPs in the YRB have three main input pathways: agricultural activity, WWTPs, and atmospheric deposition. The MP risk in the YRB was moderate. The risk in different areas was as follows: upstream > downstream from the TGD; tributary > main stream in the TGR. Notably, the high abundance of MPs caused by point source pollution and highly toxic polymers showed that these are important factors in higher local risk. In this study, a comprehensive assessment of MP pollution in the YRB was performed by considering multiple evaluation methods, resulting in the establishment of a more complete evaluation system for assessing the environmental exposure risk of MPs. The results of this study provide support for the development of scientific and reasonable management.

Supplementary Materials

The following supporting information can be downloaded at https://www.mdpi.com/article/10.3390/su17094162/s1, Text S1. Ecological risk assessment methods [15,21,22,27]; Text S2. Species sensitivity distributions (SSDs) [22,54,55,56]; Text S3. Threshold Microplastics Concentration (TMC) [23,57,58,59]; Table S1. List of microplastics in the surface water of YRB research [10,12,13,14,28,32,40,60,61,62,63,64,65,66,67,68,69,70,71]; Table S2. Sampling sites in the YRB; Table S3. The CFM parameters for MPs from this study and various environmental samples [15,26,72,73,74,75,76,77,78,79,80,81]; Table S4. The TMC values in different size ranges; Table S5. Risk criteria for MPs based on the evaluation of the PLI, H, ESI, SE, and MERA methods; Table S6. The weight coefficients of each risk index; Table S7. Risk criteria and classification for MPs based on the ESI [19,21]; Table S8. Chronic toxicity data of MPs used to build SSD towards benthic species [82,83,84,85,86,87,88,89,90,91,92,93,94,95,96,97,98,99,100,101,102,103,104,105,106,107]; Table S9. Drinking water guideline and adsorption capacity on plastics for contaminants; Table S10. Polymer types and proportions of microplastics identified in the YRB; Figure S1: The abundance of microplastic in the YRB; Figure S2: Raman microscopy images of MPs; Figure S3: Minimum size of microplastics detected in previous Yangtze River basin-wide studies; Figure S4: (a) Nonlinear principal component analysis (PCA) and (b) Spearman correlation analysis of microplastics size characteristics (mm) in the YRB; Figure S5: The results of SSD model for the Yangtze River; Figure S6: TMC variation curve with size for 11 kinds of contaminants; Figure S7: Correlation between TMC and adsorption capacity.

Author Contributions

Q.L.: Investigation, Data curation, Formal analysis, Methodology, Writing—original draft. J.G.: Formal analysis, Methodology. B.G.: Supervision, Project administration, Conceptualization, methodology, Funding acquisition. All authors have read and agreed to the published version of the manuscript.

Funding

This research was funded by the National Natural Science Foundation of China (42277262) and the Research & Development Support Program of China Institute of Water Resources and Hydropower Research (WE0199A042021).

Institutional Review Board Statement

Not applicable.

Informed Consent Statement

Not applicable.

Data Availability Statement

The original contributions presented in this study are included in the article. Further inquiries can be directed to the corresponding author.

Conflicts of Interest

All authors declare no conflicts of interest.

Abbreviations

The following abbreviations are used in this manuscript:
MP/MPsMicroplastic/Microplastics
YRBYangtze River Basin
SMPsSmall MPs
PLIPollution Load Index
ESIEnvironmental Status Index
PNECPredicted Non-Effect Concentration
SSDSpecies Sensitivity Distribution
TMCThreshold Microplastics Concentration
DWTPsDrinking Water Treatment Plants
SESize Effect
CFMConditional Fragmentation Model
MERAMultiple Ecological Risk Assessment
XXRXiangxi River
NMPsNormal MPs
LMPsLarge MPs
PC1First Principal Component Vector
PPPolypropylene
PETPolyethylene Terephthalate
PEPolyethylene
EVAEthylene-Vinyl Acetate Copolymer
PHBVPoly(3-hydroxybutyrate acid-co-3-hydroxyvalerate acid)
PVCPolyvinyl Chloride
TGDThree Gorges Dam
TGRThree Gorges Reservoir
WWTPsWastewater Treatment Plants

References

  1. Masura, J.; Baker, J.E.; Foster, G.; Arthur, C.; Herring, C. Laboratory Methods for the Analysis of Microplastics in the Marine Environment: Recommendations for Quantifying Synthetic Particles in Waters and Sediments; NOAA Marine Debris Division; NMFS Scientific Publications Office: Seattle, WA, USA; Silver Spring: Montgomery County, MD, USA, 2015. [Google Scholar] [CrossRef]
  2. MacLeod, M.; Arp, H.P.H.; Tekman, M.B.; Jahnke, A. The global threat from plastic pollution. Science 2021, 373, 61–65. [Google Scholar] [CrossRef] [PubMed]
  3. Jiang, J.-J.; Hanun, J.N.; Chen, K.-Y.; Hassan, F.; Liu, K.-T.; Hung, Y.-H.; Chang, T.-W. Current levels and composition profiles of microplastics in irrigation water. Environ. Pollut. 2023, 318, 120858. [Google Scholar] [CrossRef] [PubMed]
  4. Cai, Y.; Mitrano, D.M.; Hufenus, R.; Nowack, B. Formation of Fiber Fragments during Abrasion of Polyester Textiles. Environ. Sci. Technol. 2021, 55, 8001–8009. [Google Scholar] [CrossRef]
  5. Tang, K.H.D. Microplastics in agricultural soils in China: Sources, impacts and solutions. Environ. Pollut. 2023, 322, 121235. [Google Scholar] [CrossRef] [PubMed]
  6. Chen, C.; Cowger, W.; Nava, V.; van Emmerik, T.H.M.; Leoni, B.; Guo, Z.-F.; Liu, D.; He, Y.-Q.; Xu, Y.-Y. Wastewater Discharge Transports Riverine Microplastics over Long Distances. Environ. Sci. Technol. 2024, 58, 15147–15158. [Google Scholar] [CrossRef]
  7. Zhao, M.; Cao, Y.; Chen, T.; Li, H.; Tong, Y.; Fan, W.; Xie, Y.; Tao, Y.; Zhou, J. Characteristics and source-pathway of microplastics in freshwater system of China: A review. Chemosphere 2022, 297, 134192. [Google Scholar] [CrossRef]
  8. Wang, K.; Liu, Y.; Shi, X.; Zhao, S.; Sun, B.; Lu, J.; Li, W. Characterization and traceability analysis of dry deposition of atmospheric microplastics (MPs) in Wuliangsuhai Lake. Sci. Total Environ. 2024, 906, 168201. [Google Scholar] [CrossRef] [PubMed]
  9. Wang, Q.; Guan, C.; Han, J.; Chai, M.; Li, R. Microplastics in China Sea: Analysis, status, source, and fate. Sci. Total Environ. 2022, 803, 149887. [Google Scholar] [CrossRef]
  10. Zhao, S.; Zhu, L.; Wang, T.; Li, D. Suspended microplastics in the surface water of the Yangtze Estuary System, China: First observations on occurrence, distribution. Mar. Pollut. Bull. 2014, 86, 562–568. [Google Scholar] [CrossRef]
  11. Zhang, Z.; Deng, C.; Dong, L.; Liu, L.; Li, H.; Wu, J.; Ye, C. Microplastic pollution in the Yangtze River Basin: Heterogeneity of abundances and characteristics in different environments. Environ. Pollut. 2021, 287, 117580. [Google Scholar] [CrossRef]
  12. He, D.; Chen, X.; Zhao, W.; Zhu, Z.; Qi, X.; Zhou, L.; Chen, W.; Wan, C.; Li, D.; Zou, X.; et al. Microplastics contamination in the surface water of the Yangtze River from upstream to estuary based on different sampling methods. Environ. Res. 2021, 196, 110908. [Google Scholar] [CrossRef] [PubMed]
  13. Yuan, W.; Christie-Oleza, J.A.; Xu, E.G.; Li, J.; Zhang, H.; Wang, W.; Lin, L.; Zhang, W.; Yang, Y. Environmental fate of microplastics in the world’s third-largest river: Basin-wide investigation and microplastic community analysis. Water Res. 2022, 210, 118002. [Google Scholar] [CrossRef] [PubMed]
  14. Xia, W.; Rao, Q.; Liu, J.; Chen, J.; Xie, P. Occurrence and characteristics of microplastics across the watershed of the world’s third-largest river. J. Hazard. Mater. 2024, 480, 135998. [Google Scholar] [CrossRef]
  15. Xu, D.; Gao, B.; Wan, X.; Peng, W.; Zhang, B. Influence of catastrophic flood on microplastics organization in surface water of the Three Gorges Reservoir, China. Water Res. 2022, 211, 118018. [Google Scholar] [CrossRef] [PubMed]
  16. Su, Y.; Hu, X.; Tang, H.; Lu, K.; Li, H.; Liu, S.; Xing, B.; Ji, R. Steam disinfection releases micro(nano)plastics from silicone-rubber baby teats as examined by optical photothermal infrared microspectroscopy. Nat. Nanotechnol. 2021, 17, 76–85. [Google Scholar] [CrossRef]
  17. Ma, M.; Zhao, J.; Xu, D.; Gao, B. Using optimized particle imaging of micro-Raman to characterize microplastics in water samples. Sci. Total Environ. 2023, 896, 165031. [Google Scholar] [CrossRef]
  18. Poulain, M.; Mercier, M.J.; Brach, L.; Martignac, M.; Routaboul, C.; Perez, E.; Desjean, M.C.; ter Halle, A. Small Microplastics as a Main Contributor to Plastic Mass Balance in the North Atlantic Subtropical Gyre. Environ. Sci. Technol. 2019, 53, 1157–1164. [Google Scholar] [CrossRef]
  19. Huang, Q.e.; Liu, M.; Cao, X.; Liu, Z. Occurrence of microplastics pollution in the Yangtze River: Distinct characteristics of spatial distribution and basin-wide ecological risk assessment. Water Res. 2023, 229, 119431. [Google Scholar] [CrossRef]
  20. Li, C.; Shi, Y.; Luo, D.; Kang, M.e.; Li, Y.; Huang, Y.; Bai, X. Interventions of river network structures on urban aquatic microplastic footprint from a connectivity perspective. Water Res. 2023, 243, 120418. [Google Scholar] [CrossRef]
  21. Rangel-Buitrago, N.; Arroyo-Olarte, H.; Trilleras, J.; Arana, V.A.; Mantilla-Barbosa, E.; Gracia, C.A.; Mendoza, A.V.; Neal, W.J.; Williams, A.T.; Micallef, A. Microplastics pollution on Colombian Central Caribbean beaches. Mar. Pollut. Bull. 2021, 170, 112685. [Google Scholar] [CrossRef]
  22. Yang, H.; Sun, F.; Liao, H.; Guo, Y.; Pan, T.; Wu, F. The pollution of microplastics in sediments of the Yangtze River Basin: Occurrence, distribution characteristics, and basin-scale multilevel ecological risk assessment. Water Res. 2023, 243, 120322. [Google Scholar] [CrossRef] [PubMed]
  23. Chowdhury, O.S.; Schmidt, P.J.; Anderson, W.B.; Emelko, M.B. Advancing Evaluation of Microplastics Thresholds to Inform Water Treatment Needs and Risks. Environ. Health 2024, 2, 441–452. [Google Scholar] [CrossRef]
  24. Zhao, W.; Li, J.; Liu, M.; Wang, R.; Zhang, B.; Meng, X.-Z.; Zhang, S. Seasonal variations of microplastics in surface water and sediment in an inland river drinking water source in southern China. Sci. Total Environ. 2024, 908, 168241. [Google Scholar] [CrossRef]
  25. Pivokonsky, M.; Cermakova, L.; Novotna, K.; Peer, P.; Cajthaml, T.; Janda, V. Occurrence of microplastics in raw and treated drinking water. Sci. Total Environ. 2018, 643, 1644–1651. [Google Scholar] [CrossRef] [PubMed]
  26. Wang, L.; Li, P.; Zhang, Q.; Wu, W.-M.; Luo, J.; Hou, D. Modeling the Conditional Fragmentation-Induced Microplastic Distribution. Environ. Sci. Technol. 2021, 55, 6012–6021. [Google Scholar] [CrossRef] [PubMed]
  27. Lithner, D.; Larsson, Å.; Dave, G. Environmental and health hazard ranking and assessment of plastic polymers based on chemical composition. Sci. Total Environ. 2011, 409, 3309–3324. [Google Scholar] [CrossRef]
  28. Chen, H.; Wang, T.; Ding, Y.; Yuan, F.; Zhang, H.; Wang, C.; Wang, Y.; Wang, Y.; Song, Y.; Fu, G.; et al. A catchment-wide microplastic pollution investigation of the Yangtze River: The pollution and ecological risk of tributaries are non-negligible. J. Hazard. Mater. 2024, 466, 133544. [Google Scholar] [CrossRef]
  29. Tan, Y.; Dai, J.; Xiao, S.; Tang, Z.; Zhang, J.; Wu, S.; Wu, X.; Deng, Y. Occurrence of microplastic pollution in rivers globally: Driving factors of distribution and ecological risk assessment. Sci. Total Environ. 2023, 904, 165979. [Google Scholar] [CrossRef]
  30. Belioka, M.-P.; Achilias, D.S. Microplastic Pollution and Monitoring in Seawater and Harbor Environments: A Meta-Analysis and Review. Sustainability 2023, 15, 9079. [Google Scholar] [CrossRef]
  31. Plastics Europe. Plastics—The Facts 2022; Plastics Europe: London, UK, 2022. [Google Scholar]
  32. Niu, X.; Wang, X.; Dong, H.; Ciren, N.; Zhang, H.; Chen, X.; Zhuoga, S.; Jia, X.; Xu, L.; Zhou, Y. Microplastics in remote region of the world: Insights from the glacier of Geladandong, China. Appl. Geochem. 2024, 168, 106026. [Google Scholar] [CrossRef]
  33. Aves, A.R.; Revell, L.E.; Gaw, S.; Ruffell, H.; Schuddeboom, A.; Wotherspoon, N.E.; LaRue, M.; McDonald, A.J. First evidence of microplastics in Antarctic snow. Cryosphere 2022, 16, 2127–2145. [Google Scholar] [CrossRef]
  34. Dong, H.; Wang, L.; Wang, X.; Xu, L.; Chen, M.; Gong, P.; Wang, C. Microplastics in a Remote Lake Basin of the Tibetan Plateau: Impacts of Atmospheric Transport and Glacial Melting. Environ. Sci. Technol. 2021, 55, 12951–12960. [Google Scholar] [CrossRef] [PubMed]
  35. Liu, R.-p.; Li, Z.-z.; Liu, F.; Dong, Y.; Jiao, J.-g.; Sun, P.-p.; Rm, E.-W. Microplastic pollution in Yellow River: Current status and research progress of biotoxicological effects. China Geol. 2021, 4, 585–592. [Google Scholar] [CrossRef]
  36. Fan, Y.; Zheng, K.; Zhu, Z.; Chen, G.; Peng, X. Distribution, sedimentary record, and persistence of microplastics in the Pearl River catchment, China. Environ. Pollut. 2019, 251, 862–870. [Google Scholar] [CrossRef] [PubMed]
  37. Mai, L.; You, S.-N.; He, H.; Bao, L.-J.; Liu, L.-Y.; Zeng, E.Y. Riverine Microplastic Pollution in the Pearl River Delta, China: Are Modeled Estimates Accurate? Environ. Sci. Technol. 2019, 53, 11810–11817. [Google Scholar] [CrossRef]
  38. Song, J. Comparison and prospect of economic and population development in seven Major River Basins (in Chinese). Resour. Econ. 2023, 36, 14–20. [Google Scholar] [CrossRef]
  39. Zhang, Y.; Gao, T.; Kang, S.; Allen, S.; Luo, X.; Allen, D. Microplastics in glaciers of the Tibetan Plateau: Evidence for the long-range transport of microplastics. Sci. Total Environ. 2021, 758, 143634. [Google Scholar] [CrossRef]
  40. Zhang, K.; Gong, W.; Lv, J.; Xiong, X.; Wu, C. Accumulation of floating microplastics behind the Three Gorges Dam. Environ. Pollut. 2015, 204, 117–123. [Google Scholar] [CrossRef]
  41. Li, Y.; Ke, S.; Xu, D.; Zhuo, H.; Liu, X.; Gao, B. Preferential deposition of buoyant small microplastics in surface sediments of the Three Gorges Reservoir, China: Insights from biomineralization. J. Hazard. Mater. 2024, 468, 133693. [Google Scholar] [CrossRef]
  42. Chen, Y.; Gao, B.; Xu, D.; Sun, K.; Li, Y. Catchment-wide flooding significantly altered microplastics organization in the hydro-fluctuation belt of the reservoir. iScience 2022, 25, 104401. [Google Scholar] [CrossRef]
  43. Samir, A.; Ashour, F.H.; Hakim, A.A.A.; Bassyouni, M. Recent advances in biodegradable polymers for sustainable applications. NPJ Mater. Degrad. 2022, 6, 68. [Google Scholar] [CrossRef]
  44. Belioka, M.-P.; Achilias, D.S. The Effect of Weathering Conditions in Combination with Natural Phenomena/Disasters on Microplastics’ Transport from Aquatic Environments to Agricultural Soils. Microplastics 2024, 3, 518–538. [Google Scholar] [CrossRef]
  45. Fakour, H.; Lo, S.-L.; Yoashi, N.T.; Massao, A.M.; Lema, N.N.; Mkhontfo, F.B.; Jomalema, P.C.; Jumanne, N.S.; Mbuya, B.H.; Mtweve, J.T.; et al. Quantification and Analysis of Microplastics in Farmland Soils: Characterization, Sources, and Pathways. Agriculture 2021, 11, 330. [Google Scholar] [CrossRef]
  46. Xue, B.; Zhang, L.; Li, R.; Wang, Y.; Guo, J.; Yu, K.; Wang, S. Underestimated Microplastic Pollution Derived from Fishery Activities and “Hidden” in Deep Sediment. Environ. Sci. Technol. 2020, 54, 2210–2217. [Google Scholar] [CrossRef] [PubMed]
  47. Montecinos, S.; Tognana, S.; Salgueiro, W.; Frosinini, C. Temporal variation of the microplastic concentration in a stream that receives discharge from wastewater treatment plants. Environ. Pollut. 2024, 340, 122776. [Google Scholar] [CrossRef]
  48. Hernandez, E.; Nowack, B.; Mitrano, D.M. Polyester Textiles as a Source of Microplastics from Households: A Mechanistic Study to Understand Microfiber Release During Washing. Environ. Sci. Technol. 2017, 51, 7036–7046. [Google Scholar] [CrossRef] [PubMed]
  49. Yuan, F.; Zhao, H.; Sun, H.; Sun, Y.; Zhao, J.; Xia, T. Investigation of microplastics in sludge from five wastewater treatment plants in Nanjing, China. J. Environ. Manag. 2022, 301, 113793. [Google Scholar] [CrossRef]
  50. Liu, P.; Shao, L.; Guo, Z.; Zhang, Y.; Cao, Y.; Ma, X.; Morawska, L. Physicochemical characteristics of airborne microplastics of a typical coastal city in the Yangtze River Delta Region, China. J. Environ. Sci. 2025, 148, 602–613. [Google Scholar] [CrossRef]
  51. Thacharodi, A.; Meenatchi, R.; Hassan, S.; Hussain, N.; Bhat, M.A.; Arockiaraj, J.; Ngo, H.H.; Le, Q.H.; Pugazhendhi, A. Microplastics in the environment: A critical overview on its fate, toxicity, implications, management, and bioremediation strategies. J. Environ. Manag. 2024, 349, 119433. [Google Scholar] [CrossRef]
  52. Belioka, M.-P.; Achilias, D.S. How plastic waste management affects the accumulation of microplastics in waters: A review for transport mechanisms and routes of microplastics in aquatic environments and a timeline for their fate and occurrence (past, present, and future). Water Emerg. Contam. Nanoplastics 2024, 3, 14. [Google Scholar] [CrossRef]
  53. Magnucka, M.; Świetlik, J.; Lembicz, A.; Nawrocki, P.; Fijołek, L. Occurrence and identification of microplastics retained in corrosion deposits of drinking water transmission pipes. Water Emerg. Contam. Nanoplastics 2024, 3, 17. [Google Scholar] [CrossRef]
  54. Cui, X.; Yang, T.; Li, Z.; Nowack, B. Meta-analysis of the hazards of microplastics in freshwaters using species sensitivity distributions. J. Hazard. Mater. 2024, 463, 132919. [Google Scholar] [CrossRef]
  55. European Chemicals Agency. Chapter R.10: Characterisation of dose [concentration]-response for environment. In Guidance on Information Requirements and Chemical Safety Assessment; European Chemicals Agency: Helsinki, Finland, 2008. [Google Scholar]
  56. Wigger, H.; Kawecki, D.; Nowack, B.; Adam, V. Systematic Consideration of Parameter Uncertainty and Variability in Probabilistic Species Sensitivity Distributions. Integr. Environ. Assess. Manag. 2019, 16, 211–222. [Google Scholar] [CrossRef]
  57. GB 5749-2022; Standards for Drinking Water Quality. National Health Commission (NHC): Beijing, China, 2022.
  58. Wu, J.; Zhang, Y.; Tang, Y. Fragmentation of microplastics in the drinking water treatment process—A case study in Yangtze River region, China. Sci. Total Environ. 2022, 806, 150545. [Google Scholar] [CrossRef] [PubMed]
  59. Zhang, S.; Gao, L.; Liu, D.; Cai, J.; Wang, J. Spatiotemporal distribution of microplastics in water source and treatment process of a WTP. Water Purif. Technol. 2024, 43, 62–69. (In Chinese) [Google Scholar] [CrossRef]
  60. Wang, W.; Ndungu, A.W.; Li, Z.; Wang, J. Microplastics pollution in inland freshwaters of China: A case study in urban surface waters of Wuhan, China. Sci. Total Environ. 2017, 575, 1369–1374. [Google Scholar] [CrossRef]
  61. Su, L.; Cai, H.; Kolandhasamy, P.; Wu, C.; Rochman, C.M.; Shi, H. Using the Asian clam as an indicator of microplastic pollution in freshwater ecosystems. Environ. Pollut. 2018, 234, 347–355. [Google Scholar] [CrossRef]
  62. Wang, W.; Yuan, W.; Chen, Y.; Wang, J. Microplastics in surface waters of Dongting Lake and Hong Lake, China. Sci. Total Environ. 2018, 633, 539–545. [Google Scholar] [CrossRef]
  63. Xu, P.; Peng, G.; Su, L.; Gao, Y.; Gao, L.; Li, D. Microplastic risk assessment in surface waters: A case study in the Changjiang Estuary, China. Mar. Pollut. Bull. 2018, 133, 647–654. [Google Scholar] [CrossRef]
  64. Li, L.; Geng, S.; Wu, C.; Song, K.; Sun, F.; Visvanathan, C.; Xie, F.; Wang, Q. Microplastics contamination in different trophic state lakes along the middle and lower reaches of Yangtze River Basin. Environ. Pollut. 2019, 254, 112951. [Google Scholar] [CrossRef] [PubMed]
  65. Luo, W.; Su, L.; Craig, N.J.; Du, F.; Wu, C.; Shi, H. Comparison of microplastic pollution in different water bodies from urban creeks to coastal waters. Environ. Pollut. 2019, 246, 174–182. [Google Scholar] [CrossRef]
  66. Zhao, S.; Wang, T.; Zhu, L.; Xu, P.; Wang, X.; Gao, L.; Li, D. Analysis of suspended microplastics in the Changjiang Estuary: Implications for riverine plastic load to the ocean. Water Res. 2019, 161, 560–569. [Google Scholar] [CrossRef]
  67. Feng, S.; Lu, H.; Yao, T.; Liu, Y.; Tian, P.; Lu, J. Microplastic footprints in the Qinghai-Tibet Plateau and their implications to the Yangtze River Basin. J. Hazard. Mater. 2021, 407, 124776. [Google Scholar] [CrossRef] [PubMed]
  68. Feng, S.; Lu, H.; Xue, Y.; Yan, P.; Sun, T. Fate, transport, and source of microplastics in the headwaters of the Yangtze River on the Tibetan Plateau. J. Hazard. Mater. 2023, 455, 131526. [Google Scholar] [CrossRef]
  69. Li, N.; Wang, X.; Li, X.; Yi, S.; Guo, Y.; Wu, N.; Lin, H.; Zhong, B.; Wu, W.-M.; He, Y. Anthropogenic and biological activities elevate microplastics pollution in headwater ecosystem of Yangtze tributaries in Hindu Kush-Himalayan region. J. Hazard. Mater. 2024, 471, 134395. [Google Scholar] [CrossRef]
  70. Zhang, K.; Xiong, X.; Hu, H.; Wu, C.; Bi, Y.; Wu, Y.; Zhou, B.; Lam, P.K.S.; Liu, J. Occurrence and Characteristics of Microplastic Pollution in Xiangxi Bay of Three Gorges Reservoir, China. Environ. Sci. Technol. 2017, 51, 3794–3801. [Google Scholar] [CrossRef] [PubMed]
  71. Xiong, X.; Wu, C.; Elser, J.J.; Mei, Z.; Hao, Y. Occurrence and fate of microplastic debris in middle and lower reaches of the Yangtze River—From inland to the sea. Sci. Total Environ. 2019, 659, 66–73. [Google Scholar] [CrossRef]
  72. Allen, S.; Allen, D.; Phoenix, V.R.; Le Roux, G.; Durántez Jiménez, P.; Simonneau, A.; Binet, S.; Galop, D. Atmospheric transport and deposition of microplastics in a remote mountain catchment. Nat. Geosci. 2019, 12, 339–344. [Google Scholar] [CrossRef]
  73. Brahney, J.; Hallerud, M.; Heim, E.; Hahnenberger, M.; Sukumaran, S. Plastic rain in protected areas of the United States. Science 2020, 368, 1257–1260. [Google Scholar] [CrossRef]
  74. Cai, L.; Wang, J.; Peng, J.; Tan, Z.; Zhan, Z.; Tan, X.; Chen, Q. Characteristic of microplastics in the atmospheric fallout from Dongguan city, China: Preliminary research and first evidence. Environ. Sci. Pollut. Res. 2017, 24, 24928–24935. [Google Scholar] [CrossRef] [PubMed]
  75. Dris, R.; Gasperi, J.; Saad, M.; Mirande, C.; Tassin, B. Synthetic fibers in atmospheric fallout: A source of microplastics in the environment? Mar. Pollut. Bull. 2016, 104, 290–293. [Google Scholar] [CrossRef] [PubMed]
  76. Roblin, B.; Ryan, M.; Vreugdenhil, A.; Aherne, J. Ambient Atmospheric Deposition of Anthropogenic Microfibers and Microplastics on the Western Periphery of Europe (Ireland). Environ. Sci. Technol. 2020, 54, 11100–11108. [Google Scholar] [CrossRef]
  77. Yukioka, S.; Tanaka, S.; Nabetani, Y.; Suzuki, Y.; Ushijima, T.; Fujii, S.; Takada, H.; Van Tran, Q.; Singh, S. Occurrence and characteristics of microplastics in surface road dust in Kusatsu (Japan), Da Nang (Vietnam), and Kathmandu (Nepal). Environ. Pollut. 2020, 256, 113447. [Google Scholar] [CrossRef] [PubMed]
  78. Bretas Alvim, C.; Bes-Piá, M.A.; Mendoza-Roca, J.A. Separation and identification of microplastics from primary and secondary effluents and activated sludge from wastewater treatment plants. Chem. Eng. J. 2020, 402, 126293. [Google Scholar] [CrossRef]
  79. El Hayany, B.; El Fels, L.; Quénéa, K.; Dignac, M.-F.; Rumpel, C.; Gupta, V.K.; Hafidi, M. Microplastics from lagooning sludge to composts as revealed by fluorescent staining- image analysis, Raman spectroscopy and pyrolysis-GC/MS. J. Environ. Manag. 2020, 275, 111249. [Google Scholar] [CrossRef]
  80. Li, Q.; Wu, J.; Zhao, X.; Gu, X.; Ji, R. Separation and identification of microplastics from soil and sewage sludge. Environ. Pollut. 2019, 254, 113076. [Google Scholar] [CrossRef]
  81. Zhang, L.; Xie, Y.; Liu, J.; Zhong, S.; Qian, Y.; Gao, P. An Overlooked Entry Pathway of Microplastics into Agricultural Soils from Application of Sludge-Based Fertilizers. Environ. Sci. Technol. 2020, 54, 4248–4255. [Google Scholar] [CrossRef]
  82. Zhang, C.; Wang, J.; Zhou, A.; Ye, Q.; Feng, Y.; Wang, Z.; Wang, S.; Xu, G.; Zou, J. Species-specific effect of microplastics on fish embryos and observation of toxicity kinetics in larvae. J. Hazard. Mater. 2021, 403, 123948. [Google Scholar] [CrossRef]
  83. Schmieg, H.; Burmester, J.K.Y.; Krais, S.; Ruhl, A.S.; Tisler, S.; Zwiener, C.; Köhler, H.-R.; Triebskorn, R. Interacting Effects of Polystyrene Microplastics and the Antidepressant Amitriptyline on Early Life Stages of Brown Trout (Salmo trutta f. fario). Water 2020, 12, 2361. [Google Scholar] [CrossRef]
  84. Xia, X.; Sun, M.; Zhou, M.; Chang, Z.; Li, L. Polyvinyl chloride microplastics induce growth inhibition and oxidative stress in Cyprinus carpio var. larvae. Sci. Total Environ. 2020, 716, 136479. [Google Scholar] [CrossRef] [PubMed]
  85. Liu, Y.; Jia, X.; Zhu, H.; Zhang, Q.; He, Y.; Shen, Y.; Xu, X.; Li, J. The effects of exposure to microplastics on grass carp (Ctenopharyngodon idella) at the physiological, biochemical, and transcriptomic levels. Chemosphere 2022, 286, 131831. [Google Scholar] [CrossRef]
  86. Yang, H.; Xiong, H.; Mi, K.; Xue, W.; Wei, W.; Zhang, Y. Toxicity comparison of nano-sized and micron-sized microplastics to Goldfish Carassius auratus Larvae. J. Hazard. Mater. 2020, 388, 122058. [Google Scholar] [CrossRef] [PubMed]
  87. Jaikumar, G.; Baas, J.; Brun, N.R.; Vijver, M.G.; Bosker, T. Acute sensitivity of three Cladoceran species to different types of microplastics in combination with thermal stress. Environ. Pollut. 2018, 239, 733–740. [Google Scholar] [CrossRef]
  88. Thi, D.D.; Miranda, A.; Trestrail, C.; De Souza, H.; Dinh, K.V.; Nugegoda, D. Antagonistic effects of copper and microplastics in single and binary mixtures on development and reproduction in the freshwater cladoceran Daphnia carinata. Environ. Technol. Innov. 2021, 24, 102045. [Google Scholar] [CrossRef]
  89. Liu, Q.; Liu, L.; Huang, J.; Gu, L.; Sun, Y.; Zhang, L.; Lyu, K.; Yang, Z. The response of life history defense of cladocerans under predation risk varies with the size and concentration of microplastics. J. Hazard. Mater. 2022, 427, 127913. [Google Scholar] [CrossRef] [PubMed]
  90. Wang, Z.; Fan, L.; Wang, J.; Zhou, J.; Ye, Q.; Zhang, L.; Xu, G.; Zou, J. Impacts of microplastics on three different juvenile shrimps: Investigating the organism response distinction. Environ. Res. 2021, 198, 110466. [Google Scholar] [CrossRef]
  91. Weber, A.; Scherer, C.; Brennholt, N.; Reifferscheid, G.; Wagner, M. PET microplastics do not negatively affect the survival, development, metabolism and feeding activity of the freshwater invertebrate Gammarus pulex. Environ. Pollut. 2018, 234, 181–189. [Google Scholar] [CrossRef]
  92. Yu, P.; Liu, Z.; Wu, D.; Chen, M.; Lv, W.; Zhao, Y. Accumulation of polystyrene microplastics in juvenile Eriocheir sinensis and oxidative stress effects in the liver. Aquat. Toxicol. 2018, 200, 28–36. [Google Scholar] [CrossRef]
  93. Au, S.Y.; Bruce, T.F.; Bridges, W.C.; Klaine, S.J. Responses of Hyalella azteca to acute and chronic microplastic exposures. Environ. Toxicol. Chem. 2015, 34, 2564–2572. [Google Scholar] [CrossRef]
  94. Yang, W.; Gao, X.; Wu, Y.; Wan, L.; Tan, L.; Yuan, S.; Ding, H.; Zhang, W. The combined toxicity influence of microplastics and nonylphenol on microalgae Chlorella pyrenoidosa. Ecotoxicol. Environ. Saf. 2020, 195, 110484. [Google Scholar] [CrossRef] [PubMed]
  95. Pan, Y.; Long, Y.; Hui, J.; Xiao, W.; Yin, J.; Li, Y.; Liu, D.; Tian, Q.; Chen, L. Microplastics can affect the trophic cascade strength and stability of plankton ecosystems via behavior-mediated indirect interactions. J. Hazard. Mater. 2022, 430, 128415. [Google Scholar] [CrossRef]
  96. Wang, Q.; Wangjin, X.; Zhang, Y.; Wang, N.; Wang, Y.; Meng, G.; Chen, Y. The toxicity of virgin and UV-aged PVC microplastics on the growth of freshwater algae Chlamydomonas reinhardtii. Sci. Total Environ. 2020, 749, 141603. [Google Scholar] [CrossRef]
  97. Chen, Q.; Li, Y.; Li, B. Is color a matter of concern during microplastic exposure to Scenedesmus obliquus and Daphnia magna? J. Hazard. Mater. 2020, 383, 121224. [Google Scholar] [CrossRef] [PubMed]
  98. Zheng, X.; Zhang, W.; Yuan, Y.; Li, Y.; Liu, X.; Wang, X.; Fan, Z. Growth inhibition, toxin production and oxidative stress caused by three microplastics in Microcystis aeruginosa. Ecotoxicol. Environ. Saf. 2021, 208, 111575. [Google Scholar] [CrossRef]
  99. Kalčíková, G.; Skalar, T.; Marolt, G.; Jemec Kokalj, A. An environmental concentration of aged microplastics with adsorbed silver significantly affects aquatic organisms. Water Res. 2020, 175, 115644. [Google Scholar] [CrossRef]
  100. Yu, H.; Peng, J.; Cao, X.; Wang, Y.; Zhang, Z.; Xu, Y.; Qi, W. Effects of microplastics and glyphosate on growth rate, morphological plasticity, photosynthesis, and oxidative stress in the aquatic species Salvinia cucullata. Environ. Pollut. 2021, 279, 116900. [Google Scholar] [CrossRef] [PubMed]
  101. Zhang, J.; Huang, D.; Deng, H.; Zhang, J. Responses of submerged plant Vallisneria natans growth and leaf biofilms to water contaminated with microplastics. Sci. Total Environ. 2022, 818, 151750. [Google Scholar] [CrossRef]
  102. Senavirathna, M.D.H.J.; Zhaozhi, L.; Fujino, T. Short-duration exposure of 3-µm polystyrene microplastics affected morphology and physiology of watermilfoil (sp. roraima). Environ. Sci. Pollut. Res. 2022, 29, 34475–34485. [Google Scholar] [CrossRef]
  103. Weber, A.; von Randow, M.; Voigt, A.-L.; von der Au, M.; Fischer, E.; Meermann, B.; Wagner, M. Ingestion and toxicity of microplastics in the freshwater gastropod Lymnaea stagnalis: No microplastic-induced effects alone or in combination with copper. Chemosphere 2021, 263, 128040. [Google Scholar] [CrossRef]
  104. Fu, L.; Xi, M.; Nicholaus, R.; Wang, Z.; Wang, X.; Kong, F.; Yu, Z. Behaviors and biochemical responses of macroinvertebrate Corbicula fluminea to polystyrene microplastics. Sci. Total Environ. 2022, 813, 152617. [Google Scholar] [CrossRef] [PubMed]
  105. Castro, G.B.; Bernegossi, A.C.; Pinheiro, F.R.; Felipe, M.C.; Corbi, J.J. Effects of Polyethylene Microplastics on Freshwater Oligochaeta Allonais inaequalis (Stephenson, 1911) Under Conventional and Stressful Exposures. Water Air Soil Pollut. 2020, 231, 475. [Google Scholar] [CrossRef]
  106. Sun, L.; Sun, S.; Bai, M.; Wang, Z.; Zhao, Y.; Huang, Q.; Hu, C.; Li, X. Internalization of polystyrene microplastics in Euglena gracilis and its effects on the protozoan photosynthesis and motility. Aquat. Toxicol. 2021, 236, 105840. [Google Scholar] [CrossRef]
  107. Xue, Y.-H.; Sun, Z.-X.; Feng, L.-S.; Jin, T.; Xing, J.-C.; Wen, X.-L. Algal density affects the influences of polyethylene microplastics on the freshwater rotifer Brachionus calyciflorus. Chemosphere 2021, 270, 128613. [Google Scholar] [CrossRef] [PubMed]
Figure 1. Sampling sites in the YRB.
Sustainability 17 04162 g001
Figure 2. (a) Organization of microplastics in the YRB. Abbreviations in the figure: Styrene/Butyl Methacrylate (SBM.); (b) Size distribution of full-size and different MP morphologies and polymers.
Sustainability 17 04162 g002
Figure 3. (a) The characteristic distribution of MPs from upstream and downstream of the TGD, and (b) the tributary and main stream of the TGR.
Sustainability 17 04162 g003
Figure 4. (a) Microplastic stability analysis in the YRB; (b) Microplastic stability analysis in different environments based on previous research.
Sustainability 17 04162 g004
Figure 5. Mutiple ecological risk assessment of MPs in surface water of the YRB, including assessment based on (a) PLI, (b) H score, (c) ESI, (d) SE, and (e) MERA.
Sustainability 17 04162 g005
Disclaimer/Publisher’s Note: The statements, opinions and data contained in all publications are solely those of the individual author(s) and contributor(s) and not of MDPI and/or the editor(s). MDPI and/or the editor(s) disclaim responsibility for any injury to people or property resulting from any ideas, methods, instructions or products referred to in the content.

