Article

Predicting EV Charging Demand in Renewable-Energy-Powered Grids Using Explainable Machine Learning

1
Adam Smith Business School, University of Glasgow, Glasgow G12 8QQ, UK
2
Queen’s Business School, Queen’s University Belfast, Belfast BT9 5EE, UK
3
Applied Economics Department, College of Economics & Management, Beijing University of Technology, Beijing 100124, China
*
Authors to whom correspondence should be addressed.
Sustainability 2025, 17(9), 4158; https://doi.org/10.3390/su17094158
Submission received: 8 March 2025 / Revised: 18 April 2025 / Accepted: 2 May 2025 / Published: 4 May 2025
(This article belongs to the Section Economic and Business Aspects of Sustainability)

Abstract

The increasing adoption of electric vehicles (EVs) and the growing reliance on renewable energy sources underscore the urgent need for accurate forecasting of EV charging demand to support the development of sustainable and resilient energy systems. This study proposes an explainable machine learning (ML)-based approach to predict hourly EV charging demand using a high-resolution dataset from California, spanning January 2021 to May 2024. Five ML models—XGBoost, random forest, LightGBM, CatBoost, and linear regression—were evaluated, with XGBoost achieving the highest predictive accuracy. Scenario analysis revealed a strong positive relationship between renewable energy penetration and EV charging demand: 10%, 20%, and 30% increases in renewable usage led to 20%, 33%, and 47% increases in predicted demand, respectively. SHAP-based feature importance analysis identified renewable energy usage, carbon footprint reduction, and grid stability as key drivers of charging behavior. The proposed framework offers a scalable, interpretable, and data-driven solution to support the alignment of EV charging infrastructure with decarbonization goals. By linking renewable energy integration with demand-side dynamics, the findings offer actionable insights for the design of adaptive electricity pricing strategies and sustainable mobility policies, contributing to the broader vision of low-carbon, environmentally responsible transportation systems.

1. Introduction

Global efforts to address the escalating challenges of climate change increasingly prioritize the reduction of greenhouse gas (GHG) emissions, which are a major driver of rising global temperatures and environmental degradation [1]. Within this broader sustainability agenda, the transportation sector stands out as a key contributor, responsible for approximately 14% of global CO2 emissions [2]. Promoting the transition to electric vehicles (EVs) is widely recognized as a pivotal strategy for decarbonizing transport systems—enabling a shift from fossil fuels to cleaner electricity sources, reducing lifecycle emissions, and improving overall energy efficiency [3]. This transition plays a crucial role in advancing climate resilience, air quality, and long-term environmental sustainability. The growing adoption of EVs and increasing penetration of renewable energy sources are reshaping the dynamics of power systems. Accurate forecasting of EV charging demand is critical not only for grid stability, but also for enabling flexible energy dispatch, reducing carbon emissions, and achieving net-zero targets. According to the IRENA 2024 Global Renewables Outlook, electric mobility, coupled with intelligent energy management and demand-side flexibility, plays a central role in accelerating the global energy transition [4]. Therefore, forecasting EV charging demand under renewable-powered grids is both technical and policy imperative. Nonetheless, the growing prevalence of EVs introduces new operational challenges in electricity management [5]. Factors such as charging peaks during high-load hours, dynamic user behavior, and grid constraints can compromise power system stability if charging patterns are not accurately anticipated [6]. Accurate forecasting of EV charging demand is critical not only for grid stability, but also for enabling flexible energy dispatch, reducing carbon emissions, and achieving net-zero targets.
In the United States, California provides a compelling example of both opportunities and risks associated with widespread EV adoption. The transportation sector accounts for 50% of the state’s GHG emissions, prompting the California Air Resources Board to enact an ambitious zero-emission vehicle regulation, mandating a steadily increasing share of zero-emission and plug-in hybrid vehicles from 2026 to 2035 [7]. This rapid electrification is projected to raise the state’s power demand by as much as 25%, posing significant strain on the grid amid ongoing efforts to expand renewable energy production [8]. These trends underscore the urgency for robust EV charging demand forecasting to inform sustainable policy measures, resource allocation, and grid resilience strategies.
Against this backdrop, machine learning (ML) has emerged as an effective approach to modeling complex, nonlinear EV charging demand. By integrating diverse data streams—energy prices, grid availability, weather conditions, renewable output and time-lagged variables—ML models can capture intricate patterns often missed by more traditional statistical methods [9]. However, as ML models grow in complexity, there is a growing need for explainable AI to clarify how individual predictors, such as renewable energy penetration and carbon footprint reduction, drive model outcomes. This study employed random forest, linear regression, LightGBM, XGBoost, and CatBoost on an hourly dataset from California (January 2021–May 2024), consisting of 43 features and 29,838 observations, to forecast EV charging demand. This study then used Shapley additive explanations (SHAP) to interpret key drivers behind the predictive models’ results.
Specifically, the main contributions of this study are as follows: (1) A high-resolution, multi-dimensional dataset was compiled and preprocessed, incorporating renewable energy production, charging infrastructure attributes, and grid stability indicators. This enables a more nuanced nonlinear, time-series analysis of EV charging demand at the hourly level. (2) Five widely used machine learning models were benchmarked within a unified forecasting framework, and SHAP-based interpretability was applied to identify the most influential predictors, thereby bridging the gap between predictive performance and model transparency. (3) The effects of increasing renewable energy usage on EV charging demand were systematically evaluated, revealing temporal behavioral patterns and their implications for grid reliability. Overall, these contributions reflect an integrative approach that combines data-driven forecasting, explainable ML, and behavioral analysis, offering policy-relevant insights for low-carbon transport systems and sustainable energy planning. In contrast to recent EV forecasting studies that focus solely on model performance or deep learning-based prediction, this study incorporated explainable AI, temporal demand analysis, and scenario simulation in a single framework—offering a holistic and policy-relevant approach to energy planning.
The remainder of this paper is organized as follows: Section 2 presents a detailed literature review on EV charging demand forecasting. Section 3 describes the data and methodology, including variable definitions and model structures. Section 4 discusses the results of the modeling experiments and scenario analyses. Finally, Section 5 concludes with policy recommendations and future research directions.

2. Literature Review

The growing adoption of EVs, driven by global efforts toward carbon neutrality, has made accurate EV charging demand forecasting a critical area of research [10]. As renewable energy sources, such as solar and wind power, play an increasing role in electricity generation, their integration into charging infrastructure presents both opportunities and challenges for grid management, energy market optimization, and policy formulation [11]. Effective demand forecasting is essential to enhance charging station allocation, reduce grid congestion, and ensure the efficient utilization of renewable energy resources. This section provides a comprehensive review of existing EV demand forecasting studies, highlighting their strengths, limitations, and implications for renewable energy integration.

2.1. Machine Learning Applications in EV Charging Demand Forecasting

The increasing penetration of EVs and the expansion of renewable energy sources have necessitated accurate forecasting of EV charging demand [12]. Traditional statistical models, such as autoregressive integrated moving average and regression-based forecasting, have been widely applied in energy demand prediction [13]. However, these models often fail to capture the highly nonlinear and dynamic nature of EV charging demand, which is influenced by multiple interdependent factors, including weather conditions, time-of-use pricing, traffic flow, and energy storage constraints [14]. In recent years, ML techniques have emerged as more robust alternatives, demonstrating superior predictive performance in energy forecasting, renewable energy integration, and charging behavior analysis [15].
Among ML approaches, deep learning architectures, such as recurrent neural networks (RNNs) and convolutional neural networks (CNNs), have demonstrated strong predictive capabilities in time-series forecasting and spatial pattern recognition. These models are particularly well-suited for analyzing the large volumes of real-time data generated by power grids, charging stations, and urban transportation networks. Ref. [16] conducted time-series forecasting of monthly EV charging demand in Utah and Los Angeles, employing a Sequence to Sequence (Seq2Seq) deep learning model. Their results demonstrated that Seq2Seq surpassed traditional forecasting models, providing a more accurate demand estimation framework. Similarly, Ref. [17] explored multiple ML algorithms, including random forest, support vector machines (SVM), and XGBoost, to predict EV session duration and energy consumption. Their study, which incorporated historical charging data, weather conditions, and traffic variables, achieved SMAPE scores of 9.9% and 11.6%, highlighting the effectiveness of ML models in demand prediction. Ref. [18] developed a two-stage adaptive robust unit commitment model that integrates ML-based scenario generation and disjunctive uncertainty modeling to improve power system scheduling under renewable variability. While their study addresses generation-side dispatch optimization, this study focuses on demand-side forecasting of EV charging load at an hourly level. By combining multiple ML models with SHAP-based interpretability and temporal behavioral analysis, this study offers a complementary perspective aimed at supporting smart charging strategies and policy planning in renewable-integrated grids. Ref. [19] proposed a reinforcement-learning-based home energy management system integrated with a vehicle-to-home unit to optimize residential energy use under real-time and time-of-use pricing schemes. Their RL-HCPV model utilizes deep learning to predict energy consumption and prices and employs fuzzy Q-learning for scheduling. Ref. [20] proposed a PSO-LSTM-XGBoost hybrid model to improve the accuracy of long-term hourly electricity load forecasting and applied the forecasts to optimize hybrid renewable energy systems using HOMER software. Their study offers a techno-economic evaluation of different configurations and validates the optimal microgrid solution in the Panamanian context.
Other studies have explored the role of vehicle-level data in charging demand prediction. Ref. [21] investigated the impact of vehicle conditions, battery state-of-charge, and destination distance on charging demand. Their comparative analysis across macro-scale and micro-scale geographical regions demonstrated that incorporating exogenous variables improved forecasting accuracy and model robustness. Ref. [22] introduced a multi-relation graph convolutional-network-based encoder–decoder model to predict EV charging demand in Sydney, integrating a Cournot competition game model to optimize resource allocation strategies.
Probabilistic forecasting methods have also gained traction in EV demand prediction. Ref. [23] proposed a hierarchical approach to predict EV charging load across different geographic regions, utilizing models such as gradient-boosted regression trees, quantile regression forests, and quantile regression neural networks. Their findings indicated a 9.5% improvement in forecasting accuracy compared to non-hierarchical methods. In a comprehensive study, Ref. [24] conducted an evaluation of ML and deep learning techniques, including short-term load forecasting, medium-term load forecasting, and long-term load forecasting. Their study demonstrated that ensemble learning techniques outperformed individual ML models in predicting EV charging behavior.

2.2. Integration of Renewable Energy in Charging Demand Forecasting

The integration of renewable energy sources, such as solar and wind power, into EV charging infrastructure presents both opportunities and challenges for demand forecasting and grid stability. Unlike traditional power generation, renewable energy availability is highly intermittent, making it essential to develop forecasting models that account for fluctuations in renewable power supply and their impact on EV charging behavior [10]. Recent studies have explored how ML techniques can be leveraged to address these challenges by enhancing prediction accuracy and optimizing charging station operations within renewable-powered networks.
Ref. [25] proposed a multi-source real-time interactive system that integrates user psychology modeling and Monte Carlo simulations to predict spatio-temporal charging load distribution. Their study emphasized that real-time information exchange across multiple data sources, including renewable energy production levels, can significantly improve the accuracy of EV charging demand forecasts. The research findings suggest that timely integration of renewable generation data into prediction models could enhance load balancing and energy allocation in charging stations that rely on solar and wind power. Ref. [26] introduced a ML-based approach for energy management in renewable microgrids, which consist of localized renewable energy generation and EV charging infrastructure. Their support vector regression–maximum deviation adjustment model outperformed conventional methods, such as autoregressive–moving-average, artificial neural network, and standard SVM models, in predicting charging station utilization rates. The study demonstrated that ML-based forecasting can effectively optimize energy distribution in charging networks powered by intermittent renewable energy sources.
Similarly, Ref. [27] applied a hybrid long short-term memory (LSTM)-based approach to predict multistep discrete charging occupancy states using EV charging data from Dundee, UK. While the primary focus of their study was temporal dependency modeling, their findings highlighted that charging station occupancy patterns are influenced by fluctuations in renewable energy availability. Their model achieved a 22.4% improvement in one-step-ahead forecasting and a 6.2% improvement in six-step-ahead predictions, suggesting that incorporating renewable energy data into forecasting models could further enhance accuracy. To improve renewable energy integration into EV charging demand forecasting, Ref. [28] proposed an energy management framework employing a whale optimization algorithm to minimize grid operation costs in hybrid microgrids. Their approach, tested on the IEEE 33-bus test system, demonstrated how advanced optimization techniques can be used to efficiently distribute renewable energy across charging networks, ensuring stable grid operation even under fluctuating power generation conditions.
To address charging demand uncertainties in renewable-integrated networks, Ref. [29] developed a deep-learning-based queuing model incorporating traffic flow predictions using CNNs. The study demonstrated that accounting for traffic patterns and renewable energy availability improves the reliability of EV charging demand forecasts, providing valuable insights into optimizing charging station planning and energy allocation.
Recent advancements in online learning and real-time forecasting have further improved charging demand predictions for newly built charging stations relying on renewable energy. Ref. [30] proposed an online EV charging demand forecasting model using general regression neural networks, which outperformed RNNs, LSTMs, Bi-LSTMs, gated recurrent units, and deep neural networks in handling asynchronous and sparse charging event data. Their study demonstrated that real-time adaptation to renewable energy fluctuations is critical for accurate EV demand forecasting in renewable-integrated stations. Additionally, Ref. [31] developed a feature-enhanced deep learning model incorporating a two-stage feature selection method using Pearson correlation coefficients. Their study emphasized the importance of selecting relevant features—including renewable energy production levels and grid constraints—to improve forecasting accuracy in low-data scenarios. Recent work by [32] presents a predictive battery thermal and energy management (p-BTEM) framework that integrates vehicle trajectory data, traffic information, and real-time control, showcasing the potential of connected vehicle systems in enhancing energy efficiency and battery lifespan. Their contribution highlights the growing importance of multi-layer intelligence in EV systems, which aligns with the need for advanced demand forecasting at the grid level addressed in this study.

2.3. Gaps and Comparative Positioning of This Study

While recent studies have demonstrated the potential of advanced ML techniques in EV charging demand prediction, several methodological gaps remain. Deep learning models such as Seq2Seq, RNNs, and LSTMs have shown high predictive accuracy [18], yet often function as “black boxes”, limiting their applicability in real-world grid and policy planning. By contrast, interpretable models such as random forests or XGBoost, particularly when coupled with SHAP analysis [18,19], can reveal key behavioral and environmental drivers of demand, though few studies have explicitly linked these insights to temporal charging patterns or policy implications.
Moreover, the integration of renewable energy features in forecasting frameworks has largely focused on improving model performance, rather than understanding how environmental variables influence EV user behavior. For instance, some studies find that increased renewable availability aligns with higher charging demand [27,30], while others report only marginal impacts due to behavioral inertia or pricing volatility [28,29]. These conflicting findings suggest a need for frameworks that jointly address forecasting accuracy, explainability, and behavioral interpretation.
In response, this study contributes a unified framework that combines (1) a comprehensive high-resolution dataset capturing renewable dynamics, pricing, and grid conditions; (2) benchmarked ML models with interpretable SHAP-based analysis; and (3) scenario-based simulations to quantify the effects of renewable integration on charging demand and emissions. This integrative approach aims to complement prior technical work by providing both scalable forecasting tools and actionable insights for demand-side energy management in renewable-powered EV systems.

3. Data and Methodology

3.1. Data and Variables

The dataset used in this study was obtained from the U.S. Government’s open data platform https://catalog.data.gov/dataset/ (accessed on 1 August 2024), which provides publicly accessible datasets related to energy consumption, transportation, and renewable energy production. The dataset contains hourly data from 1 January 2021 to 31 May 2024, covering the California region, where EV adoption and renewable energy integration have significantly increased in recent years.
To ensure the dataset is suitable for ML modeling, a series of preprocessing steps were applied to clean, transform, and extract relevant features. These steps included timestamp formatting, feature engineering, lag variable creation, categorical encoding, and missing value handling. The processed dataset was then saved for subsequent analysis.
First, the dataset contains separate date and time columns, which were merged into a single Datetime column and converted to a standardized timestamp format. The data were then sorted chronologically to maintain consistency in time-series analysis. From this Datetime feature, multiple time-based variables were extracted, including year, month, day, hour, weekday, weekend indicator, and peak-hour flag. These variables help capture the temporal dependencies of EV charging demand, as usage patterns often follow daily and weekly cycles. Second, certain categorical variables required conversion into numerical representations for ML models. The grid availability variable, originally a categorical indicator of whether grid energy was available, was transformed into a binary variable (1 for “Available”, 0 for “Unavailable”). Similarly, weather conditions were converted into numerical representations using an automated factorization approach, allowing the model to incorporate weather-based influences on charging behavior. Third, to capture temporal dependencies and trends, lag variables were introduced for key numerical features. Specifically, for electricity price, solar and wind energy production, battery storage, grid stability, and renewable energy usage, lag values were created at 1 h, 6 h, and 24 h intervals. These lag features enable the model to leverage past data points to improve future demand prediction. Fourth, certain variables were removed from the dataset to avoid redundancy and potential data leakage. The total renewable energy production feature was excluded, as its components (solar and wind energy) were already included as separate variables. Similarly, features such as adjusted charging demand and net energy cost were removed due to their potential to introduce bias into the model. Finaly, as a result of lag feature creation, missing values were introduced at the beginning of the dataset. These missing values were removed to ensure data integrity. No additional imputation was necessary, as the original dataset was complete in other aspects.
Missing values were imputed using column-wise mean values. For models that are sensitive to feature scaling (e.g., linear regression), input variables were normalized using the StandardScaler from Scikit-learn. To incorporate short-term behavioral dynamics and temporal dependencies, lagged features were constructed for key variables at 1 h, 6 h, and 24 h intervals. All lag features were carefully aligned to prevent data leakage. No manual outlier removal was applied, under the assumption that demand fluctuations reflect real-world variation and user behavior.
The final dataset contains 43 columns (variables) and 29,838 rows (records) with EV charging demand (kW) as the target variable. Table 1 provides a detailed description of the variables.
Appendix A reports the descriptive statistics of the dataset. Solar and wind energy production average around 0.15 kW, with moderate fluctuations, while electricity prices range from USD 0.05 to USD 0.20 per kWh, averaging USD 0.1249. Grid availability remains high at 94.8%, ensuring a stable power supply for EV charging. Battery storage averages 24.86 kWh, with values reaching up to 49.99 kWh, playing a crucial role in balancing supply and demand. Charging station capacity varies significantly, from 5.00 kW to nearly 50 kW, with a mean of 27.54 kW. EV charging efficiency is notably high, averaging 90.03%, while the number of EVs charging per hour ranges from 1 to 9, with an average of 4.99. Lagged variables for battery storage, grid stability, and renewable energy usage reveal consistent temporal patterns, aiding predictive analysis.
As shown in Figure 1, EV charging demand peaks sharply around 9–10 pm, reflecting a strong preference for evening residential charging. This pattern likely corresponds to users plugging in their vehicles after returning home. Demand remains relatively stable during the daytime, with lower activity observed between 2 and 5 am. These temporal dynamics suggest opportunities for demand-side management policies, such as off-peak pricing or smart charging incentives, to shift charging behavior and reduce evening grid stress.
Figure 2 reveals a subtle but consistent seasonal trend: charging demand increases in summer and declines sharply in autumn. This pattern likely reflects the interplay between mobility habits, climate, and charging efficiency. In summer, favorable weather conditions and increased travel activity lead to more frequent EV use and charging. Autumn, by contrast, marks a behavioral transition—mobility demand tapers, while cooler temperatures begin to reduce battery efficiency, discouraging discretionary charging. Though the variation appears minor in absolute terms, it underscores how seasonal context shapes aggregate charging behavior, informing both infrastructure usage forecasting and time-sensitive policy design.
Figure 3 reveals clear intra-week variation in EV charging demand. Demand peaks early in the workweek—particularly on Tuesday and Wednesday—then steadily declines, reaching its lowest point on Friday. A mild rebound is observed over the weekend. This pattern suggests that EV users tend to charge more frequently at the start of the workweek, possibly to prepare for anticipated commuting needs. The Friday dip may reflect reduced weekday travel or anticipation of weekend downtime. Meanwhile, the weekend rebound indicates continued, though less structured, usage, potentially linked to leisure activities or lower electricity prices. These fluctuations highlight the importance of aligning charging infrastructure availability and pricing incentives with weekly behavioral rhythms.
Figure 4 compares the hourly EV charging demand on weekdays (blue) and weekends (orange). While both curves follow a relatively stable profile throughout the day, notable differences emerge during morning and late evening hours. Weekday demand shows a subtle peak around 8–10 AM, likely reflecting pre-work charging or fleet operations. In contrast, weekend demand tends to rise slightly later and shows a more pronounced increase in the evening, possibly linked to residential overnight charging. The wider confidence intervals (reflected by the shadow) on weekends suggest more variability in user behavior, consistent with less structured schedules. Overall, the figure highlights how time-of-day charging patterns differ by day type, indicating potential for demand response strategies that align with user routines.
The dataset does not contain identifiers for specific vehicle types (e.g., BEVs vs. PHEVs) or trip purposes; rather, it captures aggregated regional charging behavior across a broad population of EV users.

3.2. Methods

3.2.1. Machine Learning Models

To ensure a robust evaluation of EV charging demand prediction, five ML models were implemented for comparison: linear regression, random forest, XGBoost, LightGBM, and CatBoost. A fivefold cross-validation was employed to enhance the generalizability of the models, and optimal hyperparameters for each model were determined using a grid search approach. Among these models, XGBoost was identified as the best-performing algorithm, demonstrating superior predictive accuracy and robustness in capturing the nonlinear dependencies within the dataset. Consequently, XGBoost was selected as the final model for further analysis. To improve model interpretability, SHAP analysis was applied to quantify the contribution of individual features and examine their influence on charging demand.
XGBoost is an effective ML algorithm based on the gradient boosting framework, known for its speed, accuracy, and scalability. It enhances traditional gradient boosting through parallel processing, optimized memory usage, and regularization, preventing overfitting [33]. XGBoost efficiently handles missing data, imbalanced classes, and large datasets, making it ideal for classification, regression, and ranking tasks [34]. Compared to traditional gradient boosting, it offers faster computation, better pruning, and greater flexibility, making it a preferred choice for both industry applications and data science competitions [35].
Gradient boosting optimizes a model by iteratively reducing errors using decision trees. At each step, it fits a new tree to the negative gradient of the loss function, which represents the direction of the steepest descent. The objective is to improve predictions by sequentially adding weak learners and improving overall accuracy [36].
The objective function L in XGBoost consists of a loss function to measure prediction error and a regularization term to control model complexity and mitigate overfitting:
L θ = i = 1 n l y i , y ^ i t + k = 1 t Ω f k
Equation (1) optimizes predictive accuracy while preventing overfitting through regularization. It consists of a loss function l y i , y ^ i t , which measures the difference between actual and predicted values, and a regularization term Ω f k = γ T + 1 2 λ j = 1 T w j 2 , which controls model complexity. Here, T means the number of leaf nodes, and W j represents their weights. The parameter y discourages excessive tree growth, while λ applies L 2 regularizationto smooth leaf weights. L2 regularization in XGBoost, also known as Ridge regularization, penalizes large leaf weights to reduce overfitting and improve generalization. By balancing error minimization and complexity control, XGBoost enhances generalization and efficiency, making it superior to traditional gradient boosting [37].
XGBoost follows an additive training approach, where each iteration t introduces a new function f t ( x ) to correct the residual errors from the previous prediction. This iterative process allows the model to progressively refine its accuracy by learning from past mistakes. This process can be described as below:
y ^ i t = y ^ i t 1 + f t x i
The XGBoost also minimizes a second-order Taylor expansion of the objective function around y ^ i t 1 for the purpose of the optimal outcome:
L t i = 1 n g i f t x i + 1 2 h i f t x i 2 + Ω f t
where g i = y ^ t 1 l ( y i , y ^ ( t 1 ) ) and h i = y ^ ( t 1 ) 2 l ( y i y ^ ( t 1 ) ) denote the first and second derivatives of the loss function with respect to the predicted value at iteration t 1 . At each step, a newly generated tree, f t x , is incorporated into the model to further refine predictions and reduce residual errors.
By integrating tree-based learning with an optimized regularization framework, XGBoost balances predictive power and model efficiency, ensuring fast, scalable, and accurate ML models suitable for a wide range of applications [38].
The selected models represent a variety of ML paradigms, including linear regression and several tree-based ensemble methods. These approaches have been widely applied and benchmarked in load forecasting and energy analytics due to their robustness, efficiency, and ability to handle non-linear relationships. Moreover, all models are compatible with SHAP-based interpretation, which aligns with our objective of model explainability. Among the five models, XGBoost consistently outperformed the others in terms of predictive accuracy. Therefore, it was selected for in-depth analysis and interpretation in the subsequent sections.

3.2.2. Explain the Machine

SHAP is a mathematically rigorous and theoretically grounded method for interpreting complex ML models; it provides a theoretically sound approach to feature attribution, ensuring fairness, consistency, and additivity in model interpretation. By capturing both global importance and local feature effects, it enhances model transparency and facilitates error diagnosis in complex predictive systems [39]. Its foundation in cooperative game theory allows for more accurate attributions compared to traditional methods, making it a valuable tool in explainable AI research [40].
The SHAP formula quantifies the contribution of each feature x j to a model’s prediction f x by fairly distributing the difference between the individual prediction and the baseline prediction f x using Shapley values, where f x is the model’s output for input x , and j represents the Shapley value contribution of feature x j . Each feature’s value can be calculated as follows:
j = S x 1 , , x M \ x j S ! M S 1 ! M ! f S x j f S
where f(x) represents the model’s prediction for a given input x , incorporating all features. The 0 denotes the baseline prediction, typically defined as the expected model output across the dataset, f ( x ) , serving as a reference point for evaluating individual feature contributions. Each j represents the Shapley value for feature x j , quantifying its marginal contribution to the prediction by considering all possible feature subsets [41].
SHAP summary visualization provides an intuitive way to understand both the importance of features in a ML model and the direction in which they influence predictions. The most used visualization is the SHAP summary plot, also known as the beeswarm plot, which displays SHAP values for all instances in a dataset. In this plot, features are ranked by their overall impact, with the y-axis listing the most influential features at the top. Each point represents a SHAP value for a single instance, plotted along the x-axis to indicate how much that feature increases or decreases the prediction. The color of each point corresponds to the feature value, typically with a gradient where red represents high feature values and blue represents low values. This coloring helps in identifying trends, such as whether higher feature values contribute positively or negatively to the model’s output [42].
Apart from the summary plot, the SHAP dependence plot offers deeper insights into feature relationships by plotting SHAP values against actual feature values, revealing patterns of interaction between features and the model output. For individualized explanations, a SHAP force plot can be used, which illustrates how each feature contributes to shifting a particular prediction from the baseline expectation [43].
SHAP interaction values extend standard SHAP by capturing both individual feature contributions and pairwise interactions. Unlike traditional SHAP values, which assume independent effects, SHAP interaction values decompose a feature’s impact into its direct contribution and its interaction with other features. Mathematically, they are computed by measuring the difference in SHAP values when another feature is present versus absent, ensuring fair attribution of joint effects.

4. Results and Discussion

4.1. Model Comparison

This section evaluated the performance of five ML models for EV charging demand prediction, namely, linear regression, random forest, XGBoost, LightGBM, and CatBoost. Each model underwent hyperparameter tuning to obtain its optimal configuration before conducting the final performance comparison. The models were assessed based on R2, MAE, and RMSE, and the results are presented in Table 2.
Among the models, linear regression demonstrated the weakest performance, with an R2 of only 0.5910, indicating its limited ability to capture the complex dependencies in EV charging demand. The tree-based ensemble models outperformed linear regression, showcasing their superior capability in handling non-linear relationships within the data.
For XGBoost, random forest, LightGBM, and CatBoost, grid search cross-validation was applied to select optimal hyperparameters. Each model was trained using fivefold cross-validation on the training set. After hyperparameter tuning, XGBoost achieved the highest predictive performance, with an R2 of 0.9895, MAE of 0.0054, and the lowest RMSE of 0.0089. The hyperparameter tuning process, conducted via a grid search, resulted in the following optimal configuration: Colsample_bytree: 0.9, Learning_rate: 0.1, Max_depth: 7, Min_child_weight: 1. N_estimators: 300, and Subsample: 0.9. All models were trained using an 80/20 train–test split.

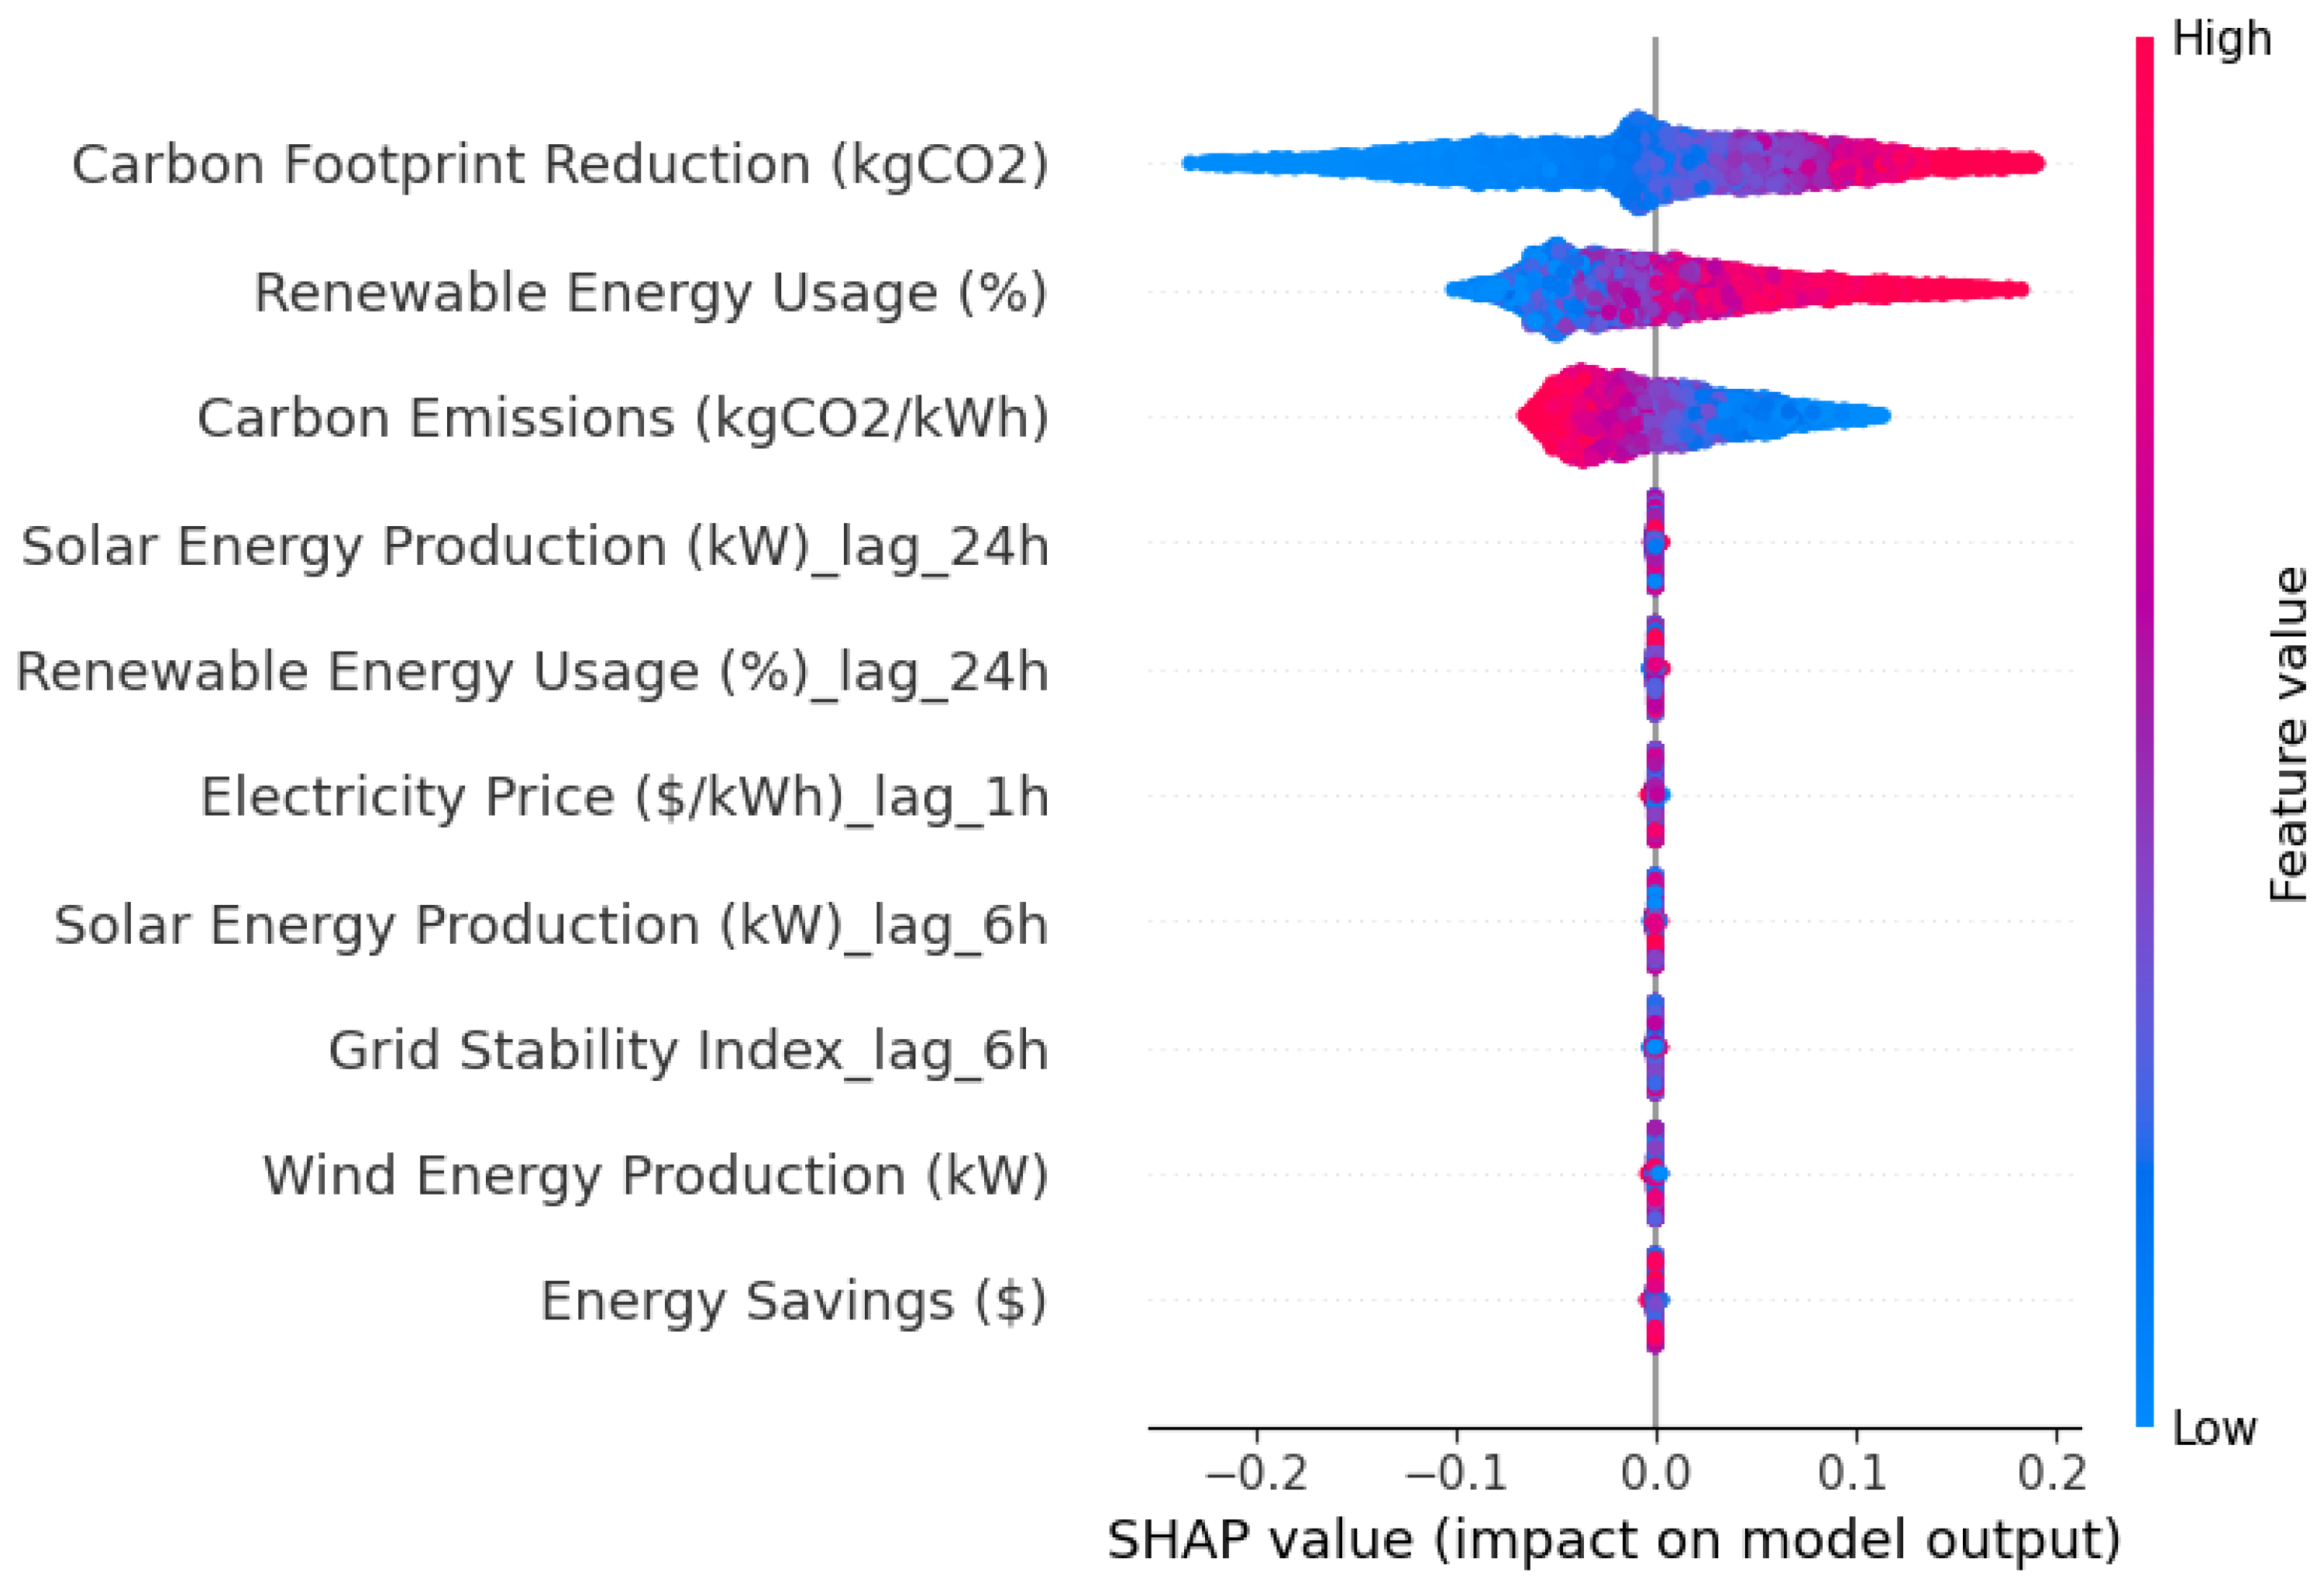
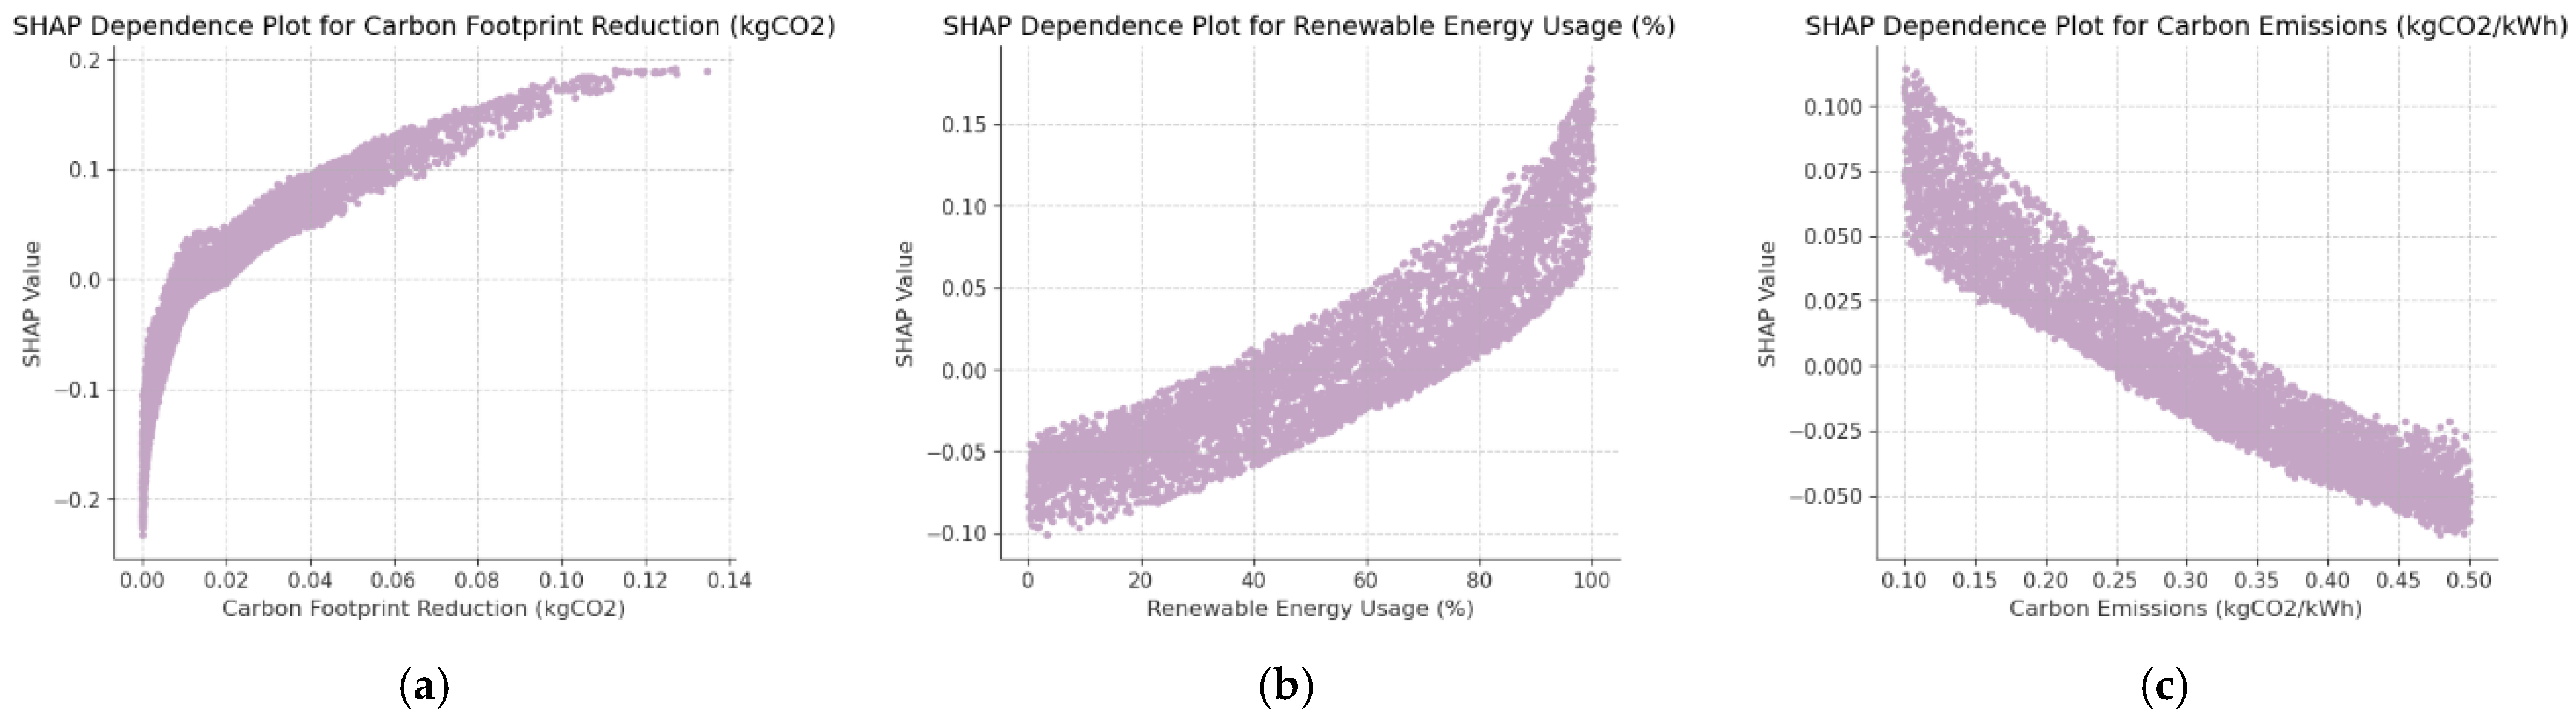
4.2. Feature Analysis

Figure 5 presents the SHAP summary plot for the top ten most influential variables in the XGBoost model used for EV charging demand prediction. The results indicate that carbon footprint reduction (kgCO2) and renewable energy usage (%) are the most significant factors affecting EV charging demand. Higher renewable energy penetration in the grid is associated with an increase in charging demand, which may be attributed to lower electricity costs, environmental incentives, and improved grid stability. Conversely, lower renewable energy availability appears to correlate with reduced charging activity, suggesting that EV users may adjust their charging behavior based on grid sustainability metrics. Additionally, carbon emissions (kgCO2/kWh) play a crucial role, indicating that the environmental impact of electricity generation influences charging decisions, likely due to carbon pricing mechanisms or consumer preferences for low-emission energy sources.
Temporal dependencies are also evident in the feature importance rankings. The presence of lagged variables, such as solar energy production (kW)_lag_24h and renewable energy usage (%)_lag_24h, suggests that historical renewable energy generation is predictive of future charging demand. This relationship is particularly relevant in contexts where time-of-use pricing strategies align with renewable generation patterns, encouraging consumers to charge their vehicles during periods of high renewable energy availability. Similarly, electricity price (USD/kWh)_lag_1h is identified as an influential factor, reinforcing the premise that short-term fluctuations in electricity pricing significantly affect charging behavior. Lower electricity prices, often observed during periods of high renewable generation or off-peak hours, are associated with increased charging activity, while higher prices discourage immediate charging.
Other variables, such as solar energy production (kW)_lag_6h and grid stability index_lag_6h, highlight the influence of short-term renewable energy fluctuations and grid stability on charging demand. The impact of wind energy production (kW) is comparatively smaller, possibly due to the less predictable nature of wind generation compared to solar energy, which follows a more regular diurnal pattern. Additionally, energy savings (USD) appears to have the lowest contribution among the top ten features, suggesting that while financial considerations play a role in EV charging decisions, they may be secondary to environmental factors and real-time grid conditions.
To further investigate the impact of the top three most influential variables identified in the SHAP summary plot, SHAP dependence plots were generated for carbon footprint reduction (kgCO2), renewable energy usage (%), and carbon emissions (kgCO2/kWh). These plots illustrate the relationship between each feature’s value and its corresponding SHAP value, providing deeper insights into how variations in these factors influence EV charging demand. Figure 6a shows a nonlinear positive relationship between carbon footprint reduction and its impact on EV charging demand. As carbon footprint reduction increases, its SHAP value also increases, indicating a strong positive effect on charging demand. However, the curve demonstrates a diminishing return effect, where the marginal impact of additional reductions in carbon footprint on charging demand decreases at higher values. This suggests that while a cleaner grid encourages higher EV charging activity, the effect plateaus beyond a certain threshold. This may be attributed to the fact that EV users who are already environmentally conscious may not significantly alter their charging behavior once a sufficiently low-carbon energy mix is achieved.
Figure 6b reveals a monotonically increasing relationship between renewable energy usage and its impact on charging demand. As the share of renewable energy in the grid increases, the SHAP values rise, suggesting a strong incentive for EV users to charge their vehicles when renewable energy availability is high. The steepest increase in impact occurs at higher renewable energy penetration levels (>60%), indicating that as grid reliance on renewables strengthens, EV charging behavior becomes increasingly aligned with clean energy availability. This trend highlights the effectiveness of time-of-use strategies and demand response programs that encourage charging during periods of peak renewable generation.
Figure 6c displays a negative correlation between carbon emissions intensity and EV charging demand impact. Higher carbon emissions per unit of electricity are associated with lower SHAP values, implying a discouraging effect on EV charging demand. As emissions per kWh increase, EV users may be less inclined to charge, potentially due to environmental concerns, carbon pricing mechanisms, or reduced incentives for clean energy consumption. Conversely, as emissions decrease, the positive impact on charging demand strengthens, aligning with the preference for low-carbon transportation and policy-driven incentives to shift charging towards cleaner energy periods. These findings reinforce the critical role of environmental factors in shaping EV charging behavior. The increasing impact of renewable energy usage and carbon footprint reduction highlights the importance of integrating clean energy incentives, real-time carbon tracking, and grid transparency in EV charging networks. Additionally, the inverse relationship between carbon emissions and demand impact suggests that policy interventions, such as carbon taxation or dynamic pricing based on grid emissions intensity, may further influence charging patterns. Future energy management strategies should focus on aligning charging incentives with renewable energy generation cycles to maximize sustainability and grid efficiency.
In addition to assessing the individual contributions of features to the XGBoost model, interaction effects between variables were analyzed to identify synergistic relationships that influence EV charging demand. Table 3 presents the interaction importance scores, where higher values indicate stronger feature interactions. The strongest interaction effect was observed for carbon footprint reduction (0.0776), suggesting that this feature does not operate in isolation but rather interacts with other factors in shaping charging demand. Given its high interaction importance, it is likely that carbon footprint reduction amplifies the effects of renewable energy usage and carbon emissions intensity, reinforcing the trend where lower emissions and higher renewable penetration drive increased charging behavior. This supports the argument that environmental policies and emissions transparency play a crucial role in consumer charging decisions [44].
The second most significant interaction effect was found in renewable energy usage (%) (0.0648); one possible explanation is that higher renewable energy availability not only directly influences charging demand but also interacts with electricity pricing mechanisms and grid stability conditions [45]. For instance, when renewable generation is high and electricity prices are low, the incentive to charge increases, leading to a combined effect on demand spikes during high-renewable periods. Third, carbon emissions (kgCO2/kWh) (0.0456) also show notable interaction importance. This suggests that when emissions intensity is high, the demand-reducing effect is amplified by other factors, such as grid stability or pricing policies. This result highlights the potential of dynamic carbon pricing models that adjust charging costs based on real-time emissions intensity, further incentivizing consumers to charge during cleaner energy periods. Finally, lagged energy production variables such as solar energy production (kW)_lag_24h (0.00078) and renewable energy usage (%)_lag_24h (0.00067) exhibit minimal interaction effects. This suggests that historical renewable energy availability, while important in predicting future charging demand, does not strongly interact with other features in influencing real-time decisions. Similarly, electricity price lag variables (e.g., electricity price (USD/kWh)_lag_1h and electricity price (USD/kWh)_lag_6h) show low interaction importance, indicating that price changes may have a direct effect on charging behavior but do not significantly amplify the impact of other factors.
The observed interactions further highlight the nonlinear dependencies in EV charging demand prediction, reinforcing the advantage of using tree-based models such as XGBoost over traditional linear models. Additionally, these findings suggest that future energy pricing and demand response strategies should consider the interdependence between environmental factors and consumer charging behavior. The high interaction importance of carbon footprint reduction and renewable energy usage indicates that providing real-time carbon footprint visibility, coupled with renewable energy incentives, could further optimize charging demand. Furthermore, the relatively weak interactions observed for lagged energy production variables suggest that historical trends alone may not be sufficient for predictive modeling, and real-time indicators should be prioritized in demand forecasting frameworks.

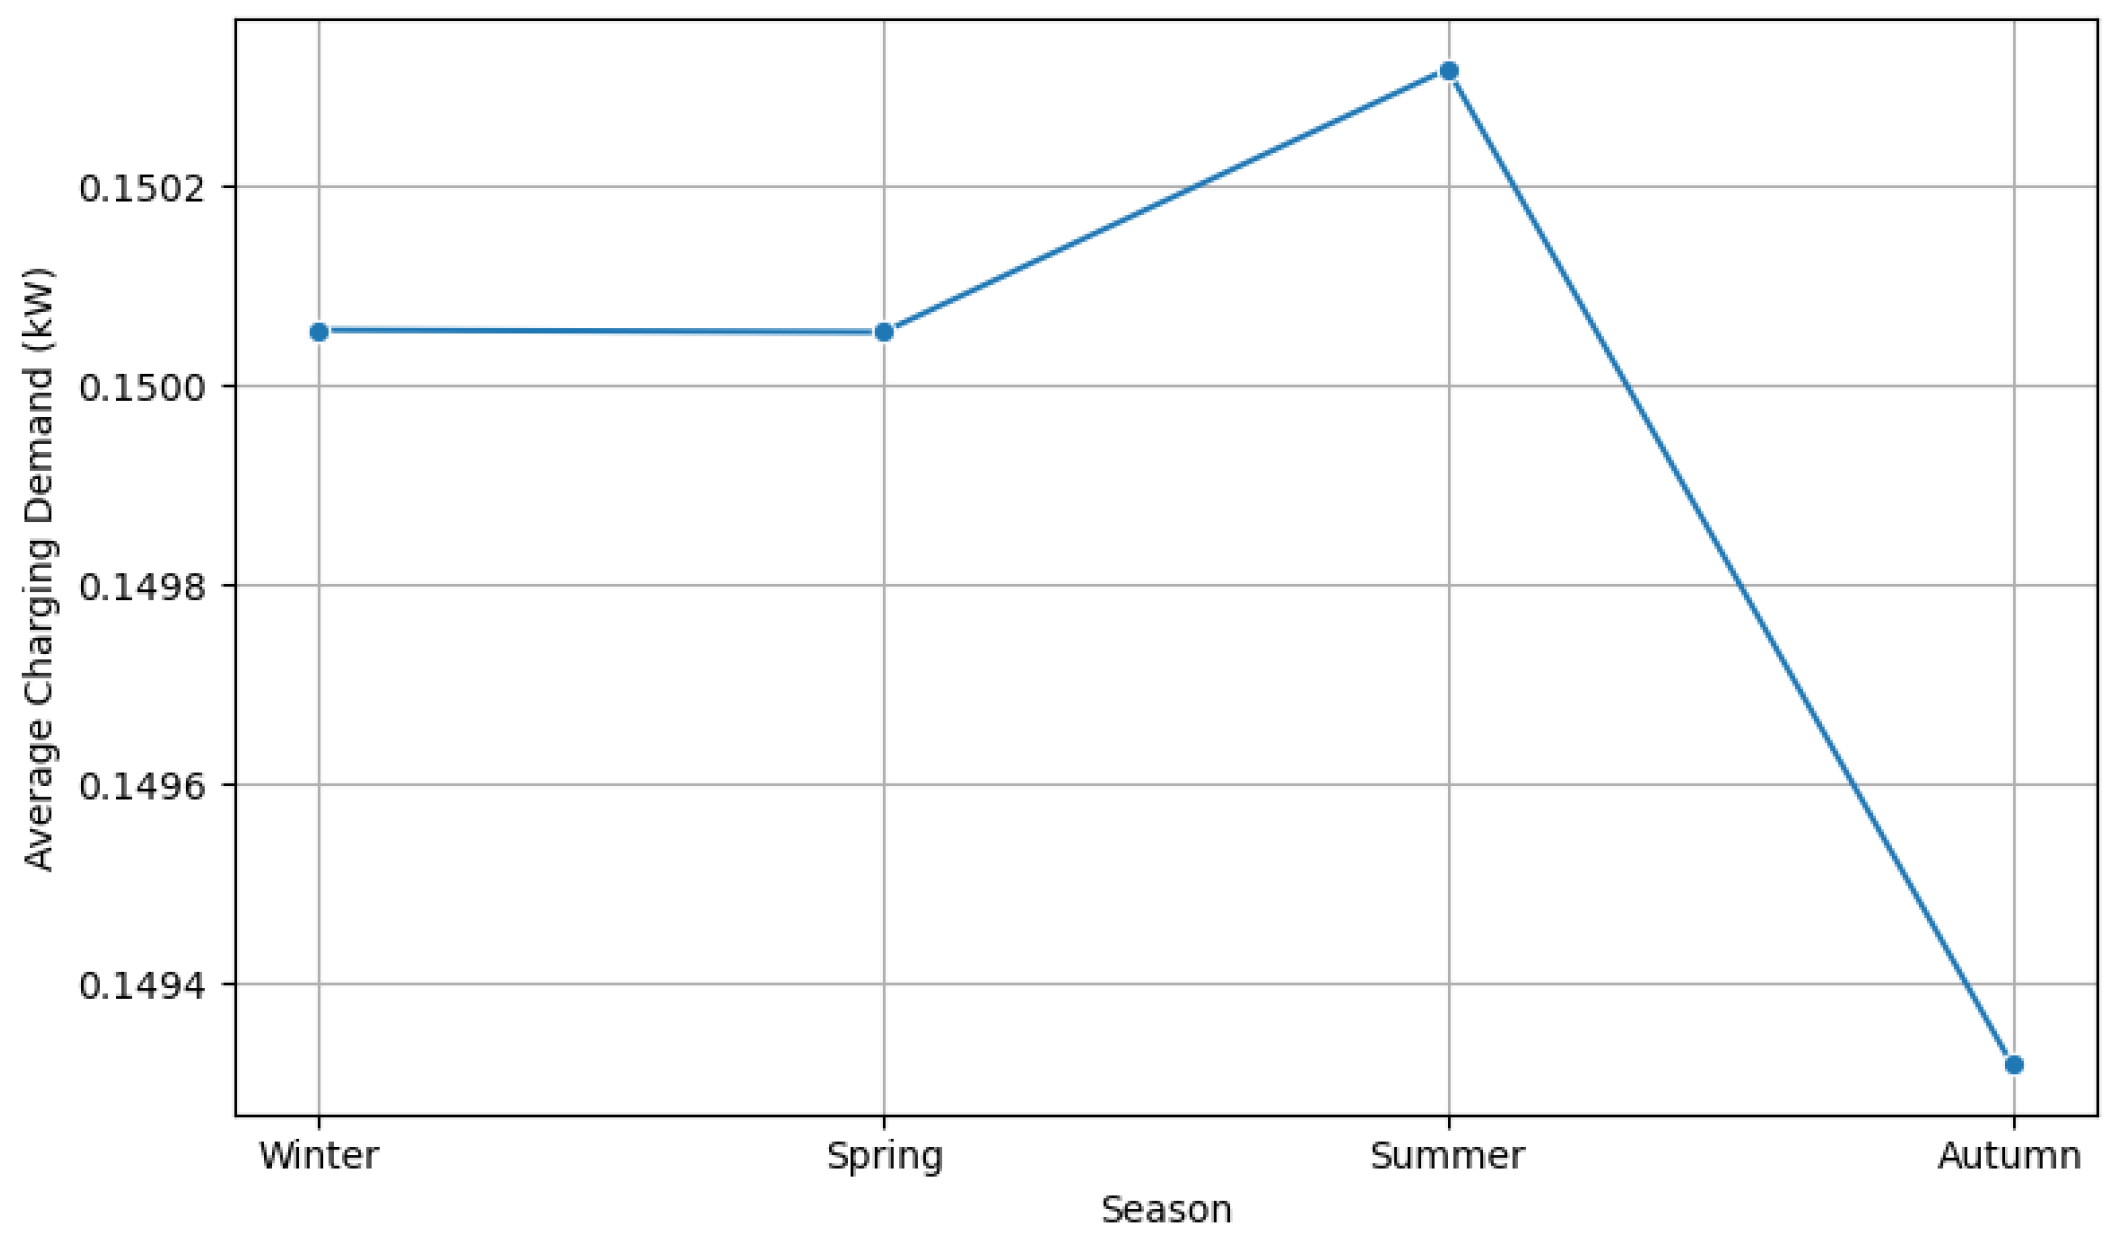
4.3. Scenario Analysis

The transition to renewable energy sources is a critical strategy for reducing GHG emissions in the transportation sector, particularly in the context of EV adoption. This section examines how increasing renewable energy penetration affects predicted EV charging demand through a scenario-based analysis. Four scenarios were considered: (1) a baseline scenario representing current conditions; (2) a 10% increase in renewable energy usage; (3) a 20% increase; and (4) a 30% increase. In each scenario, only the “Renewable Energy Usage (%)” feature was adjusted by the corresponding factor, while all other variables remained unchanged. The predictive model was then applied to the modified test dataset to estimate the average EV charging demand under each condition.
The results, as shown in Figure 7, demonstrate a positive correlation between renewable energy penetration and EV charging demand. Under the baseline scenario, the predicted average EV charging demand is 0.15 kW. When renewable energy usage is increased by 10%, the predicted demand rises to 0.18 kW, reflecting a 20% increase. Further increments in renewable energy usage to 20% and 30% result in predicted demands of 0.20 kW and 0.22 kW, respectively. These findings suggest that increasing renewable energy availability may drive higher EV charging demand. Several mechanisms could explain this trend, including reductions in electricity costs due to increased renewable energy supply, improved grid stability, and policy incentives that promote the adoption of renewable-powered EV charging infrastructure [46,47].
Therefore, the scenario analysis shows that as renewable energy usage increases by 10%, 20%, and 30%, the predicted EV charging demand rises by 20.3%, 32.9%, and 46.8%, respectively. These increases are attributed to greater grid availability, lower marginal prices, and cleaner energy incentives. Additionally, as renewable energy usage increases, the carbon intensity of grid electricity is expected to decrease, indicating potential environmental co-benefits such as lower lifecycle CO2 emissions per unit of EV charging demand.
The relationship between renewable energy penetration and EV charging demand aligns with previous research on demand elasticity in response to electricity pricing and grid decarbonization policies. Studies have shown that renewable energy integration can lead to lower marginal electricity prices, thereby encouraging greater electricity consumption in sectors such as EV charging [48]. Furthermore, as grid operators increase the share of renewable energy, time-of-use pricing and demand response strategies can be leveraged to shift EV charging to periods of high renewable energy availability, optimizing grid utilization while reducing reliance on fossil fuel-based generation [49].
From a policy perspective, these results highlight the importance of regulatory frameworks that align EV charging incentives with renewable energy integration goals. Several countries have already implemented dynamic pricing mechanisms and subsidies to encourage renewable energy-based EV charging, leading to a measurable impact on charging behaviors [50]. The potential for vehicle-to-grid integration further strengthens this synergy, as EVs can serve as distributed energy storage units, enhancing grid resilience while maximizing the utilization of intermittent renewable energy sources such as wind and solar power [51].
While the dataset used in this study is based on US EV charging data, the proposed forecasting and interpretability framework can be extended to other countries or regions with appropriate contextual adjustments. Several observed behavioral patterns, such as evening charging peaks and weekday–weekend differences, are likely to hold across various mobility cultures, though their magnitude and drivers may differ [52,53]. Further research could apply this framework to country-specific datasets to validate and localize the findings.

5. Conclusions

This study presents a comprehensive explainable ML-based approach to predicting hourly EV charging demand, integrating renewable energy dynamics and assessing the impact of increased renewable penetration through scenario analysis. By employing advanced predictive models, including XGBoost, random forest, LightGBM, and CatBoost, this study evaluated the interplay between grid stability, electricity pricing, renewable energy integration, and charging demand variability. The results indicate that renewable energy availability is a key determinant of EV charging behavior, with higher penetration levels leading to increased charging demand. The scenario analysis reveals a positive correlation between renewable energy usage and EV charging demand, demonstrating that a 10%, 20%, and 30% increase in renewable energy usage leads to 20%, 33%, and 47% increases in predicted EV charging demand, respectively.
These results also suggest that policies promoting renewable energy expansion can significantly incentivize EV adoption and influence charging patterns, thereby reducing dependence on fossil-fuel-based electricity generation. Furthermore, SHAP-based feature importance analysis identifies carbon footprint reduction, renewable energy percentage, and grid stability as the most influential factors affecting charging demand, underscoring the need for real-time grid carbon tracking and dynamic energy management strategies. This observed positive correlation is broadly consistent with prior studies such as those by Ma et al. [26] and Zamee et al. [29], who found that increased renewable generation, especially during off-peak hours, can incentivize EV users to charge more frequently due to lower marginal costs and higher grid availability. However, other studies, including Lei et al. [27], suggest that the actual demand response may vary depending on pricing structures and user flexibility. These findings emphasize the need to tailor renewable integration strategies to local behavioral and policy contexts when managing EV charging demand.
The findings suggest several directions with potential policy relevance. For example, aligning time-of-use pricing with periods of high renewable energy availability may help shift charging behavior in ways that optimize grid stability and reduce dependence on high-emission backup generation. Additionally, vehicle-to-grid integration offers promise for leveraging EVs as distributed storage units, supporting both resilience and renewable energy utilization. While these ideas are not direct outcomes of the empirical case, they are informed by the behavioral charging patterns revealed in the analysis and warrant further investigation in future studies and system planning.
Despite these promising insights, several challenges remain. The intermittency of renewable energy sources, particularly wind and solar, introduces grid reliability concerns, necessitating advancements in energy storage technologies and demand response strategies. Additionally, regional variations in electricity market structures, charging station infrastructure, and consumer charging behavior could influence the generalizability of the findings. Future research should explore the impact of EV charging behavior heterogeneity across different geographic regions, incorporating real-time grid congestion data, battery degradation modeling, and renewable energy policy variations.
In conclusion, this study highlights the transformative potential of renewable energy in shaping the future of sustainable EV charging infrastructure. By leveraging ML-driven forecasting models and aligning regulatory frameworks with grid decarbonization goals, policymakers and energy planners can foster a resilient, low-carbon transportation ecosystem. As the electrification of transport continues to accelerate, holistic energy management strategies will be critical to ensuring a sustainable, reliable, and economically viable EV charging infrastructure. In addition to forecasting performance, this study demonstrates the practical value of combining interpretable machine learning with temporal behavioral analysis. By linking model outputs to concrete usage patterns—such as evening peak demand and weekday/weekend variation—this approach offers actionable insights for demand-side management and smart charging strategies. These findings support data-informed planning in EV-integrated energy systems.
While the proposed model demonstrates high predictive accuracy, its generalizability is limited by the lack of disaggregated vehicle-level data. Additionally, SHAP-based feature interpretation reflects statistical associations rather than causal mechanisms, which may affect policy generalization in some contexts. Future research may (1) extend this framework by incorporating real-time pricing dynamics or user heterogeneity to further enhance system-level coordination and (2) incorporate disaggregated vehicle type data or real-world driving logs to better capture usage heterogeneity and improve model generalizability.

Author Contributions

Conceptualization, T.Z. and Q.P.; methodology, T.Z.; software, Q.P.; validation, T.Z., Q.P. and S.Z.; formal analysis, T.Z.; investigation, S.Z.; resources, Q.P.; data curation, Q.P.; writing—original draft preparation, T.Z.; writing—review and editing, Q.P. and S.Z.; visualization, T.Z.; supervision, Q.P.; project administration, S.Z.; funding acquisition, S.Z. All authors have read and agreed to the published version of the manuscript.

Funding

This research is partially funded by the National Natural Science Foundation of China (72140001).

Institutional Review Board Statement

Not applicable.

Informed Consent Statement

Not applicable.

Data Availability Statement

The data presented in this study are available on request from the corresponding author.

Conflicts of Interest

The authors declare no conflicts of interest.

Abbreviations

The following abbreviations are used in this manuscript:
CNNsconvolutional neural networks
EVselectric vehicles
GHGgreenhouse gas
MLmachine learning
RNNsrecurrent neural networks
Seq2Seqsequence to sequence
SHAPShapley additive explanations
SVMsupport vector machine

Appendix A

Table A1. Descriptive statistics of variables.
VariableMeanStdMinMax
EV Charging Demand (kW)0.1499510.0863550.0000030.300000
Solar Energy Production (kW)0.1499020.0866680.0000020.300000
Wind Energy Production (kW)0.1501910.0864700.0000390.300000
Electricity Price (USD/kWh)0.1248780.0433510.0500000.200000
Grid Availability0.9477850.2224650.0000001.000000
Weather Conditions2.0075411.4110020.0000004.000000
Battery Storage (kWh)24.86247214.4181840.00440049.998000
Charging Station Capacity (kW)27.53618713.0209235.00150049.998700
EV Charging Efficiency (%)90.0293775.77547080.00040099.999200
Number of EVs Charging4.9947722.5722601.0000009.000000
Battery Storage (kWh)_lag_1h24.85991814.4165360.00440049.998000
Battery Storage (kWh)_lag_6h24.86340314.4168430.00440049.998000
Battery Storage (kWh)_lag_24h24.86050814.4175610.00440049.998000
Grid Stability Index_lag_1h0.9995010.2891770.5001001.499900
Grid Stability Index_lag_6h0.9994030.2891900.5001001.499900
Grid Stability Index_lag_24h0.9994640.2891590.5001001.499900
Renewable Energy Usage (%)_lag_1h50.01617528.8253180.00180099.999500
Renewable Energy Usage (%)_lag_6h50.01454628.8296740.00180099.999500
Renewable Energy Usage (%)_lag_24h50.00893428.8277640.00180099.999500
Season2.3979821.0978071.0000004.000000

References

  1. Hansen, J.; Sato, M. Greenhouse gas growth rates. Proc. Natl. Acad. Sci. USA 2004, 101, 16109–16114. [Google Scholar] [CrossRef] [PubMed]
  2. Hannappel, R. The impact of global warming on the automotive industry. In AIP Conference Proceedings; AIP Publishing: Melville, NY, USA, 2017; Volume 1871, No. 1. [Google Scholar]
  3. Mostafaeipour, A.; Bidokhti, A.; Fakhrzad, M.B.; Sadegheih, A.; Mehrjerdi, Y.Z. A new model for the use of renewable electricity to reduce carbon dioxide emissions. Energy 2022, 238, 121602. [Google Scholar] [CrossRef]
  4. International Renewable Energy Agency (IRENA). Global Renewables Outlook: Energy Transformation 2050—2024 Update; IRENA: Abu Dhabi, United Arab Emirates, 2024. [Google Scholar]
  5. Un-Noor, F.; Padmanaban, S.; Mihet-Popa, L.; Mollah, M.N.; Hossain, E. A comprehensive study of key electric vehicle (EV) components, technologies, challenges, impacts, and future direction of development. Energies 2017, 10, 1217. [Google Scholar] [CrossRef]
  6. Bhusal, N.; Abdelmalak, M.; Kamruzzaman, M.; Benidris, M. Power system resilience: Current practices, challenges, and future directions. IEEE Access 2020, 8, 18064–18086. [Google Scholar] [CrossRef]
  7. California Air Resources Board. California Moves to Accelerate to 100% New Zero-Emission Vehicle Sales by 2035 | California Air Resources Board. 2022. Available online: https://ww2.arb.ca.gov/news/california-moves-accelerate-100-new-zero-emission-vehicle-sales-2035 (accessed on 1st January 2025).
  8. Lazo, A. California Needs a Million EV Charging Stations—But That’s ‘Unlikely’ and ‘Unrealistic’. CalMatters. 2024. Available online: https://calmatters.org/environment/climate-change/2024/07/california-electric-car-chargers-unrealistic-goals/?gad_source=1&gclid=CjwKCAiA5pq-BhBuEiwAvkzVZUJrupQiLpYA8AgYDnuaJa2zyRSI8pzgpBKgl8HjfTChOM9vtplRehoCgqAQAvD_BwE (accessed on 5 March 2025).
  9. Peng, Q.; Bakkar, Y.; Wu, L.; Liu, W.; Kou, R.; Liu, K. Transportation resilience under COVID-19 Uncertainty: A traffic severity analysis. Transp. Res. Part A Policy Pract. 2024, 179, 103947. [Google Scholar] [CrossRef]
  10. Peng, Q.; Liu, W.; Zhang, Y.; Zeng, S.; Graham, B. Generation planning for power companies with hybrid production technologies under multiple renewable energy policies. Renew. Sustain. Energy Rev. 2023, 176, 113209. [Google Scholar] [CrossRef]
  11. Peng, Q.; Liu, W.; Shi, Y.; Dai, Y.; Yu, K.; Graham, B. Multi-objective electricity generation expansion planning towards renewable energy policy objectives under uncertainties. Renew. Sustain. Energy Rev. 2024, 197, 114406. [Google Scholar] [CrossRef]
  12. Zhu, T.; Cruden, A.; Peng, Q.; Liu, K. Enabling extreme fast charging. Joule 2023, 7, 2660–2662. [Google Scholar] [CrossRef]
  13. Ediger, V.Ş.; Akar, S. ARIMA forecasting of primary energy demand by fuel in Turkey. Energy Policy 2007, 35, 1701–1708. [Google Scholar] [CrossRef]
  14. Somu, N.; MR, G.R.; Ramamritham, K. A deep learning framework for building energy consumption forecast. Renew. Sustain. Energy Rev. 2021, 137, 110591. [Google Scholar] [CrossRef]
  15. Bedi, J.; Toshniwal, D. Deep learning framework to forecast electricity demand. Appl. Energy 2019, 238, 1312–1326. [Google Scholar] [CrossRef]
  16. Yi, Z.; Liu, X.C.; Wei, R.; Chen, X.; Dai, J. Electric vehicle charging demand forecasting using deep learning model. J. Intell. Transp. Syst. 2022, 26, 690–703. [Google Scholar] [CrossRef]
  17. Shahriar, S.; Al-Ali, A.R.; Osman, A.H.; Dhou, S.; Nijim, M. Prediction of EV charging behavior using machine learning. IEEE Access 2021, 9, 111576–111586. [Google Scholar] [CrossRef]
  18. Shayan, M.E.; Petrollese, M.; Rouhani, S.H.; Mobayen, S.; Zhilenkov, A.; Su, C.L. An innovative two-stage machine learning-based adaptive robust unit commitment strategy for addressing uncertainty in renewable energy systems. Int. J. Electr. Power Energy Syst. 2024, 160, 110087. [Google Scholar] [CrossRef]
  19. Almughram, O.; Abdullah ben Slama, S.; Zafar, B.A. A reinforcement learning approach for integrating an intelligent home energy management system with a vehicle-to-home unit. Appl. Sci. 2023, 13, 5539. [Google Scholar] [CrossRef]
  20. Ma, W.; Wu, W.; Ahmed, S.F.; Liu, G. Techno-economic feasibility of utilizing electrical load forecasting in microgrid optimization planning. Sustain. Energy Technol. Assess. 2025, 73, 104135. [Google Scholar] [CrossRef]
  21. Kim, Y.; Kim, S. Forecasting charging demand of electric vehicles using time-series models. Energies 2021, 14, 1487. [Google Scholar] [CrossRef]
  22. Li, C.; Dong, Z.; Chen, G.; Zhou, B.; Zhang, J.; Yu, X. Data-driven planning of electric vehicle charging infrastructure: A case study of Sydney, Australia. IEEE Trans. Smart Grid 2021, 12, 3289–3304. [Google Scholar] [CrossRef]
  23. Buzna, L.; De Falco, P.; Ferruzzi, G.; Khormali, S.; Proto, D.; Refa, N.; Straka, M.; van der Poel, G. An ensemble methodology for hierarchical probabilistic electric vehicle load forecasting at regular charging stations. Appl. Energy 2021, 283, 116337. [Google Scholar] [CrossRef]
  24. Yaghoubi, E.; Yaghoubi, E.; Khamees, A.; Razmi, D.; Lu, T. A systematic review and meta-analysis of machine learning, deep learning, and ensemble learning approaches in predicting EV charging behavior. Eng. Appl. Artif. Intell. 2024, 135, 108789. [Google Scholar] [CrossRef]
  25. Zhang, M.; Sun, Q.; Yang, X. Electric vehicle charging load prediction considering multi-source information real-time interaction and user regret psychology. Power Syst. Technol. 2021, 46, 632–641. [Google Scholar]
  26. Lan, T.; Jermsittiparsert, K.; Alrashood, S.T.; Rezaei, M.; Al-Ghussain, L.; Mohamed, M.A. An advanced machine learning based energy management of renewable microgrids considering hybrid electric vehicles’ charging demand. Energies 2021, 14, 569. [Google Scholar] [CrossRef]
  27. Ma, T.Y.; Faye, S. Multistep electric vehicle charging station occupancy prediction using hybrid LSTM neural networks. Energy 2022, 244, 123217. [Google Scholar] [CrossRef]
  28. Lei, M.; Mohammadi, M. Hybrid machine learning based energy policy and management in the renewable-based microgrids considering hybrid electric vehicle charging demand. Int. J. Electr. Power Energy Syst. 2021, 128, 106702. [Google Scholar] [CrossRef]
  29. Zhang, X.; Chan, K.W.; Li, H.; Wang, H.; Qiu, J.; Wang, G. Deep-learning-based probabilistic forecasting of electric vehicle charging load with a novel queuing model. IEEE Trans. Cybern. 2020, 51, 3157–3170. [Google Scholar] [CrossRef] [PubMed]
  30. Zamee, M.A.; Han, D.; Cha, H.; Won, D. Self-supervised online learning algorithm for electric vehicle charging station demand and event prediction. J. Energy Storage 2023, 71, 108189. [Google Scholar] [CrossRef]
  31. Cao, T.; Xu, Y.; Liu, G.; Tao, S.; Tang, W.; Sun, H. Feature-enhanced deep learning method for electric vehicle charging demand probabilistic forecasting of charging station. Appl. Energy 2024, 371, 123751. [Google Scholar] [CrossRef]
  32. Dong, H.; Hu, Q.; Li, D.; Li, Z.; Song, Z. Predictive battery thermal and energy management for connected and automated electric vehicles. IEEE Trans. Intell. Transp. Syst. 2024, 26, 2144–2156. [Google Scholar] [CrossRef]
  33. Pan, S.; Zheng, Z.; Guo, Z.; Luo, H. An optimized XGBoost method for predicting reservoir porosity using petrophysical logs. J. Pet. Sci. Eng. 2022, 208, 109520. [Google Scholar] [CrossRef]
  34. Wang, C.; Deng, C.; Wang, S. Imbalance-XGBoost: Leveraging weighted and focal losses for binary label-imbalanced classification with XGBoost. Pattern Recognit. Lett. 2020, 136, 190–197. [Google Scholar] [CrossRef]
  35. Nielsen, D. Tree Boosting with Xgboost-Why Does Xgboost Win “Every” Machine Learning Competition? Master’s Thesis, Norwegian University of Science and Technology (NTNU), Trondheim, Norway, 2016. [Google Scholar]
  36. Touzani, S.; Granderson, J.; Fernandes, S. Gradient boosting machine for modeling the energy consumption of commercial buildings. Energy Build. 2018, 158, 1533–1543. [Google Scholar] [CrossRef]
  37. Trizoglou, P.; Liu, X.; Lin, Z. Fault detection by an ensemble framework of Extreme Gradient Boosting (XGBoost) in the operation of offshore wind turbines. Renew. Energy 2021, 179, 945–962. [Google Scholar] [CrossRef]
  38. Chen, T.; Guestrin, C. Xgboost: A scalable tree boosting system. In Proceedings of the 22nd ACM SIGKDD International Conference on Knowledge Discovery and Data Mining, San Francisco, CA, USA, 13–17 August 2016; pp. 785–794. [Google Scholar]
  39. Bücker, M.; Szepannek, G.; Gosiewska, A.; Biecek, P. Transparency, auditability, and explainability of machine learning models in credit scoring. J. Oper. Res. Soc. 2022, 73, 70–90. [Google Scholar] [CrossRef]
  40. Wang, N.; Zhang, H.; Dahal, A.; Cheng, W.; Zhao, M.; Lombardo, L. On the use of explainable AI for susceptibility modeling: Examining the spatial pattern of SHAP values. Geosci. Front. 2024, 15, 101800. [Google Scholar] [CrossRef]
  41. Covert, I.; Lundberg, S.M.; Lee, S.I. Understanding global feature contributions with additive importance measures. Adv. Neural Inf. Process. Syst. 2020, 33, 17212–17223. [Google Scholar]
  42. Kim, Y.; Kim, Y. Explainable heat-related mortality with random forest and SHapley Additive exPlanations (SHAP) models. Sustain. Cities Soc. 2022, 79, 103677. [Google Scholar] [CrossRef]
  43. Lundberg, S.M.; Erion, G.G.; Lee, S.I. Consistent individualized feature attribution for tree ensembles. arXiv 2018, arXiv:1802.03888. [Google Scholar]
  44. Zhu, Q.; Duan, Y.; Sarkis, J. Supply chain carbon transparency to consumers via blockchain: Does the truth hurt? Int. J. Logist. Manag. 2024, 35, 833–864. [Google Scholar] [CrossRef]
  45. Wozabal, D.; Graf, C.; Hirschmann, D. The effect of intermittent renewables on the electricity price variance. OR Spectr. 2016, 38, 687–709. [Google Scholar] [CrossRef]
  46. García-Villalobos, J.; Zamora, I.; San Martín, J.I.; Asensio, F.J.; Aperribay, V. Plug-in electric vehicles in electric distribution networks: A review of smart charging approaches. Renew. Sustain. Energy Rev. 2014, 38, 717–731. [Google Scholar] [CrossRef]
  47. Schill, W.P.; Zerrahn, A.; Kunz, F. Prosumage of solar electricity: Pros, cons, and the system perspective. Econ. Energy Environ. Policy 2017, 6, 7–32. [Google Scholar] [CrossRef]
  48. Li, R.; Lee, H. The role of energy prices and economic growth in renewable energy capacity expansion–Evidence from OECD Europe. Renew. Energy 2022, 189, 435–443. [Google Scholar] [CrossRef]
  49. Muratori, M.; Rizzoni, G. Residential demand response: Dynamic energy management and time-varying electricity pricing. IEEE Trans. Power Syst. 2015, 31, 1108–1117. [Google Scholar] [CrossRef]
  50. Holland, S.P.; Mansur, E.T.; Muller, N.Z.; Yates, A.J. Are there environmental benefits from driving electric vehicles? The importance of local factors. Am. Econ. Rev. 2016, 106, 3700–3729. [Google Scholar] [CrossRef]
  51. Lund, H.; Kempton, W. Integration of renewable energy into the transport and electricity sectors through V2G. Energy Policy 2008, 36, 3578–3587. [Google Scholar] [CrossRef]
  52. Gnann, T.; Plötz, P.; Kühn, A.; Wietschel, M. Modelling market diffusion of electric vehicles with real world driving data—German market and policy options. Transp. Res. Part A Policy Pract. 2015, 77, 95–112. [Google Scholar] [CrossRef]
  53. Hanni, U.E.; Yamamoto, T.; Nakamura, T. An Analysis of Electric Vehicle Charging Intentions in Japan. Sustainability 2024, 16, 1177. [Google Scholar] [CrossRef]
Figure 1. Average EV charging demand by hour.
Sustainability 17 04158 g001
Figure 2. Average EV charging demand by season.
Sustainability 17 04158 g002
Figure 3. Average EV charging demand by weekday.
Sustainability 17 04158 g003
Figure 4. Hourly charging demand on weekdays vs. weekends (0-No, 1-Yes).
Sustainability 17 04158 g004
Figure 5. SHAP summary plot.
Sustainability 17 04158 g005
Figure 6. SHAP dependence plots. (a) Carbon footprint reduction; (b) renewable energy usage; (c) carbon emissions.
Sustainability 17 04158 g006
Figure 7. Impact of increasing renewable energy usage on EV charging demand.
Sustainability 17 04158 g007
Table 1. Variable description.
VariableDescription
EV Charging Demand (kW)The amount of electricity (in kilowatts) demanded by EV for charging during each hour
Solar Energy Production (kW)The amount of electricity (in kilowatts) produced from solar energy sources during each hour
Wind Energy Production (kW)The amount of electricity (in kilowatts) produced from wind energy sources during each hour
Electricity Price ($/kWh)The price of electricity per kilowatt-hour
Grid AvailabilityIndicates whether the grid was available or not during each hour
Weather ConditionsDescribes the weather during each hour, with possible values such as “Clear”, “Cloudy”, “Rainy”, “Sunny”, and “Partly Cloudy”
Battery Storage (kWh)The amount of electricity stored in batteries during each hour
Charging Station Capacity (kW)The maximum capacity of the charging stations in kilowatts
EV Charging Efficiency (%)The efficiency of the EV charging process, expressed as a percentage
Number of EVs ChargingThe number of EV charging during each hour
Renewable Energy Usage (%)The percentage of energy used from renewable sources
Grid Stability IndexAn index indicating the stability of the grid, with higher values indicating greater stability
Carbon Emissions (kgCO2/kWh)The amount of carbon emissions produced per kilowatt-hour of electricity
Power Outages (h)The duration of power outages during each hour
Energy Savings ($)The amount of money saved through energy efficiencies during each hour
Carbon Footprint Reduction (kgCO2)The reduction in carbon emissions due to renewable energy usage
Renewable Energy EfficiencyThe efficiency of utilizing renewable energy for charging EVs
YearThe year corresponding to the recorded data
MonthThe month corresponding to the recorded data (1–12)
DayThe day of the month corresponding to the recorded data (1–31)
HourThe hour of the day when the data was recorded (0–23)
WeekdayThe day of the week corresponding to the recorded data (0 = Monday, 6 = Sunday)
Is_WeekendA binary indicator (1 = weekend, 0 = weekday)
Is_Peak_HourA binary indicator (1 = peak charging hour, 0 = non-peak hour)
Electricity Price ($/kWh)_lag_1hElectricity price (USD/kWh) recorded one hour before the current observation
Electricity Price ($/kWh)_lag_6hElectricity price (USD/kWh) recorded six hours before the current observation
Electricity Price ($/kWh)_lag_24hElectricity price (USD/kWh) recorded 24 h before the current observation
Solar Energy Production (kW)_lag_1hAmount of electricity (kW) produced from solar energy sources one hour before the current observation
Solar Energy Production (kW)_lag_6hAmount of electricity (kW) produced from solar energy sources six hours before the current observation
Solar Energy Production (kW)_lag_24hAmount of electricity (kW) produced from solar energy sources 24 h before the current observation
Wind Energy Production (kW)_lag_1hAmount of electricity (kW) produced from wind energy sources one hour before the current observation.
Wind Energy Production (kW)_lag_6hAmount of electricity (kW) produced from wind energy sources six hour before the current observation
Wind Energy Production (kW)_lag_24hAmount of electricity (kW) produced from wind energy sources 24 h before the current observation
Battery Storage (kWh)_lag_1hAmount of electricity stored in batteries one hour before the current observation
Battery Storage (kWh)_lag_6hAmount of electricity stored in batteries six hour before the current observation
Battery Storage (kWh)_lag_24hAmount of electricity stored in batteries 24 h before the current observation
Grid Stability Index_lag_1hGrid stability index recorded one hour before the current observation
Grid Stability Index_lag_6hGrid stability index recorded six hour before the current observation
Grid Stability Index_lag_24hGrid stability index recorded 24 h before the current observation
Renewable Energy Usage (%)_lag_1hPercentage of energy used from renewable sources one hour before the current observation
Renewable Energy Usage (%)_lag_6hPercentage of energy used from renewable sources six hour before the current observation
Renewable Energy Usage (%)_lag_24hPercentage of energy used from renewable sources 24 h before the current observation
SeasonThe season corresponding to the recorded data (e.g., 1 = Winter, 2 = Spring, 3 = Summer, 4 = Autumn)
Table 2. Performance comparison of ML models.
ModelR2MAERMSE
Linear regression0.59100.04180.0554
Random forest0.98590.00600.0103
XGBoost0.98690.00620.0099
LightGBM0.98470.00720.0107
CatBoost0.96750.01160.0156
Table 3. Top 10 features by SHAP interaction importance.
NumberFeatureInteraction Importance
1Carbon Footprint Reduction (kgCO2)0.077598
2Renewable Energy Usage (%)0.064800
3Carbon Emissions (kgCO2/kWh)0.045645
4Solar Energy Production (kW)_lag_24h0.000789
5Grid Stability Index_lag_6h0.000721
6Electricity Price (USD/kWh)_lag_1h0.000706
7Solar Energy Production (kW)_lag_6h0.000705
8Wind Energy Production (kW)_lag_24h0.000688
9Renewable Energy Usage (%)_lag_24h0.000678
10Electricity Price (USD/kWh)_lag_6h0.000666
Disclaimer/Publisher’s Note: The statements, opinions and data contained in all publications are solely those of the individual author(s) and contributor(s) and not of MDPI and/or the editor(s). MDPI and/or the editor(s) disclaim responsibility for any injury to people or property resulting from any ideas, methods, instructions or products referred to in the content.

