1. Introduction
The relationship between urban and rural areas is critical for a country’s economic and social development. A strong urban–rural relationship plays a crucial positive role in effective national modernization. As urbanization continues globally, both developed and developing countries need to explore and implement strategies suitable for their national contexts to foster positive urban–rural relationships and better support vigorous urban development [
1]. As the world’s largest developing country, China has a unique dual economic structure in relation to its urban and rural areas [
2]. China’s cities and villages are broadly defined as the municipal districts and surrounding areas within the city’s administrative boundaries. However, as China’s social and economic development has entered a new era, the significant urban–rural gap has become a pressing issue that must be addressed [
3]. The urban–rural gap extends beyond economic disparities to include imbalances in public services, culture, and the ecological environment. Integrated urban–rural development helps to eliminate dual structures and promotes the free flow of resources and the sharing of infrastructure and services between cities and neighboring rural areas [
4]. Establishing a robust mechanism for urban–rural integration (URI) is essential for achieving high-quality modernization.
Since the beginning of the 21st century, the Chinese government has prioritized reconciling tensions within the dual urban–rural structure as one of its main development goals by implementing targeted policies in rural and urban areas to eliminate these tensions and promote integrated development [
5]. The Digital Rural Strategy was first proposed in the Central Document No. 1 of 2018, attracting widespread attention [
6]. As a new form of economic activity, the digital economy (DE) has gradually become a key driving force and core focus of economic development and transformation in this new era [
7]. Characterized by high innovation, broad applicability, and extensive coverage, the DE simultaneously enhances productivity and consumption, facilitates low-cost accumulation and the efficient flow of resources critical to urban and rural development, breaks down traditional barriers affecting the movement of such resources, and serves as an important pathway for promoting the bidirectional flow of urban- and rural-development resources to achieve high-quality development [
8,
9,
10,
11].
The rapid development of the DE has significantly affected various aspects of urban and rural development, and the interactions between them have become increasingly complex. Research shows a significant correlation between the DE and URI [
12]. The DE influences rural labor mobility and social capital allocation [
13], reduces the segmentation of urban and rural markets [
14], balances the distribution of factors among urban and rural residents [
15], promotes green and high-quality development [
16], drives URI, and narrows the urban–rural gap [
17]. Research has shown that the
DE has greatly boosted employment and income growth in Canada’s service sector [
18], with positive effects also reported on rural household income in Ghana [
19].
Urban–rural integration is not only a stage in the evolution of urban–rural relations but also an important manifestation of the restructuring of the regional economic and social system [
20]. In essence, the process of urban–rural integration reflects the restructuring of the regional spatial structure, which is manifested in the transformation of the traditional “center–periphery” pattern into a networked spatial interaction pattern under the dynamic flow of factors [
21]. In his early research, Carey H C first systematically introduced the concept of “gravity” into the framework of analyzing socioeconomic interactions. He argued that there is a gravitational-like economic link between cities and villages and between regions, and that this force promotes spatial agglomeration and market expansion [
22]. Subsequent studies have further extended the framework to the study of the spatial structure of networks formed by the “gravitational pull” between nodes, which explains development patterns in different areas, countries, and regions. For example, David Bogataj et al. analyzed the spatial distribution structure of existing intercontinental freight hubs through a gravity model and elaborated on the impact of the location of new ports on the intercontinental supply chain [
23]. Tiantian Li et al. compared the network structure of high-quality economic development in China’s Yellow River Basin and Yangtze River Basin based on the context of regional integration and by means of social network analysis and found that the two network relationships are more stable, but the correlation of the nodes is not high [
24]. Bensassi et al. analyzed the impact of the spatial distribution of logistics infrastructure on the export trade of the Spanish region by extending the gravity model [
25].
Currently, there is limited research on the spatial correlation structure of the mutual influences between the DE and URI. Most scholars have focused on studying the interactions between the DE and URI or their spatial evolution processes [
26,
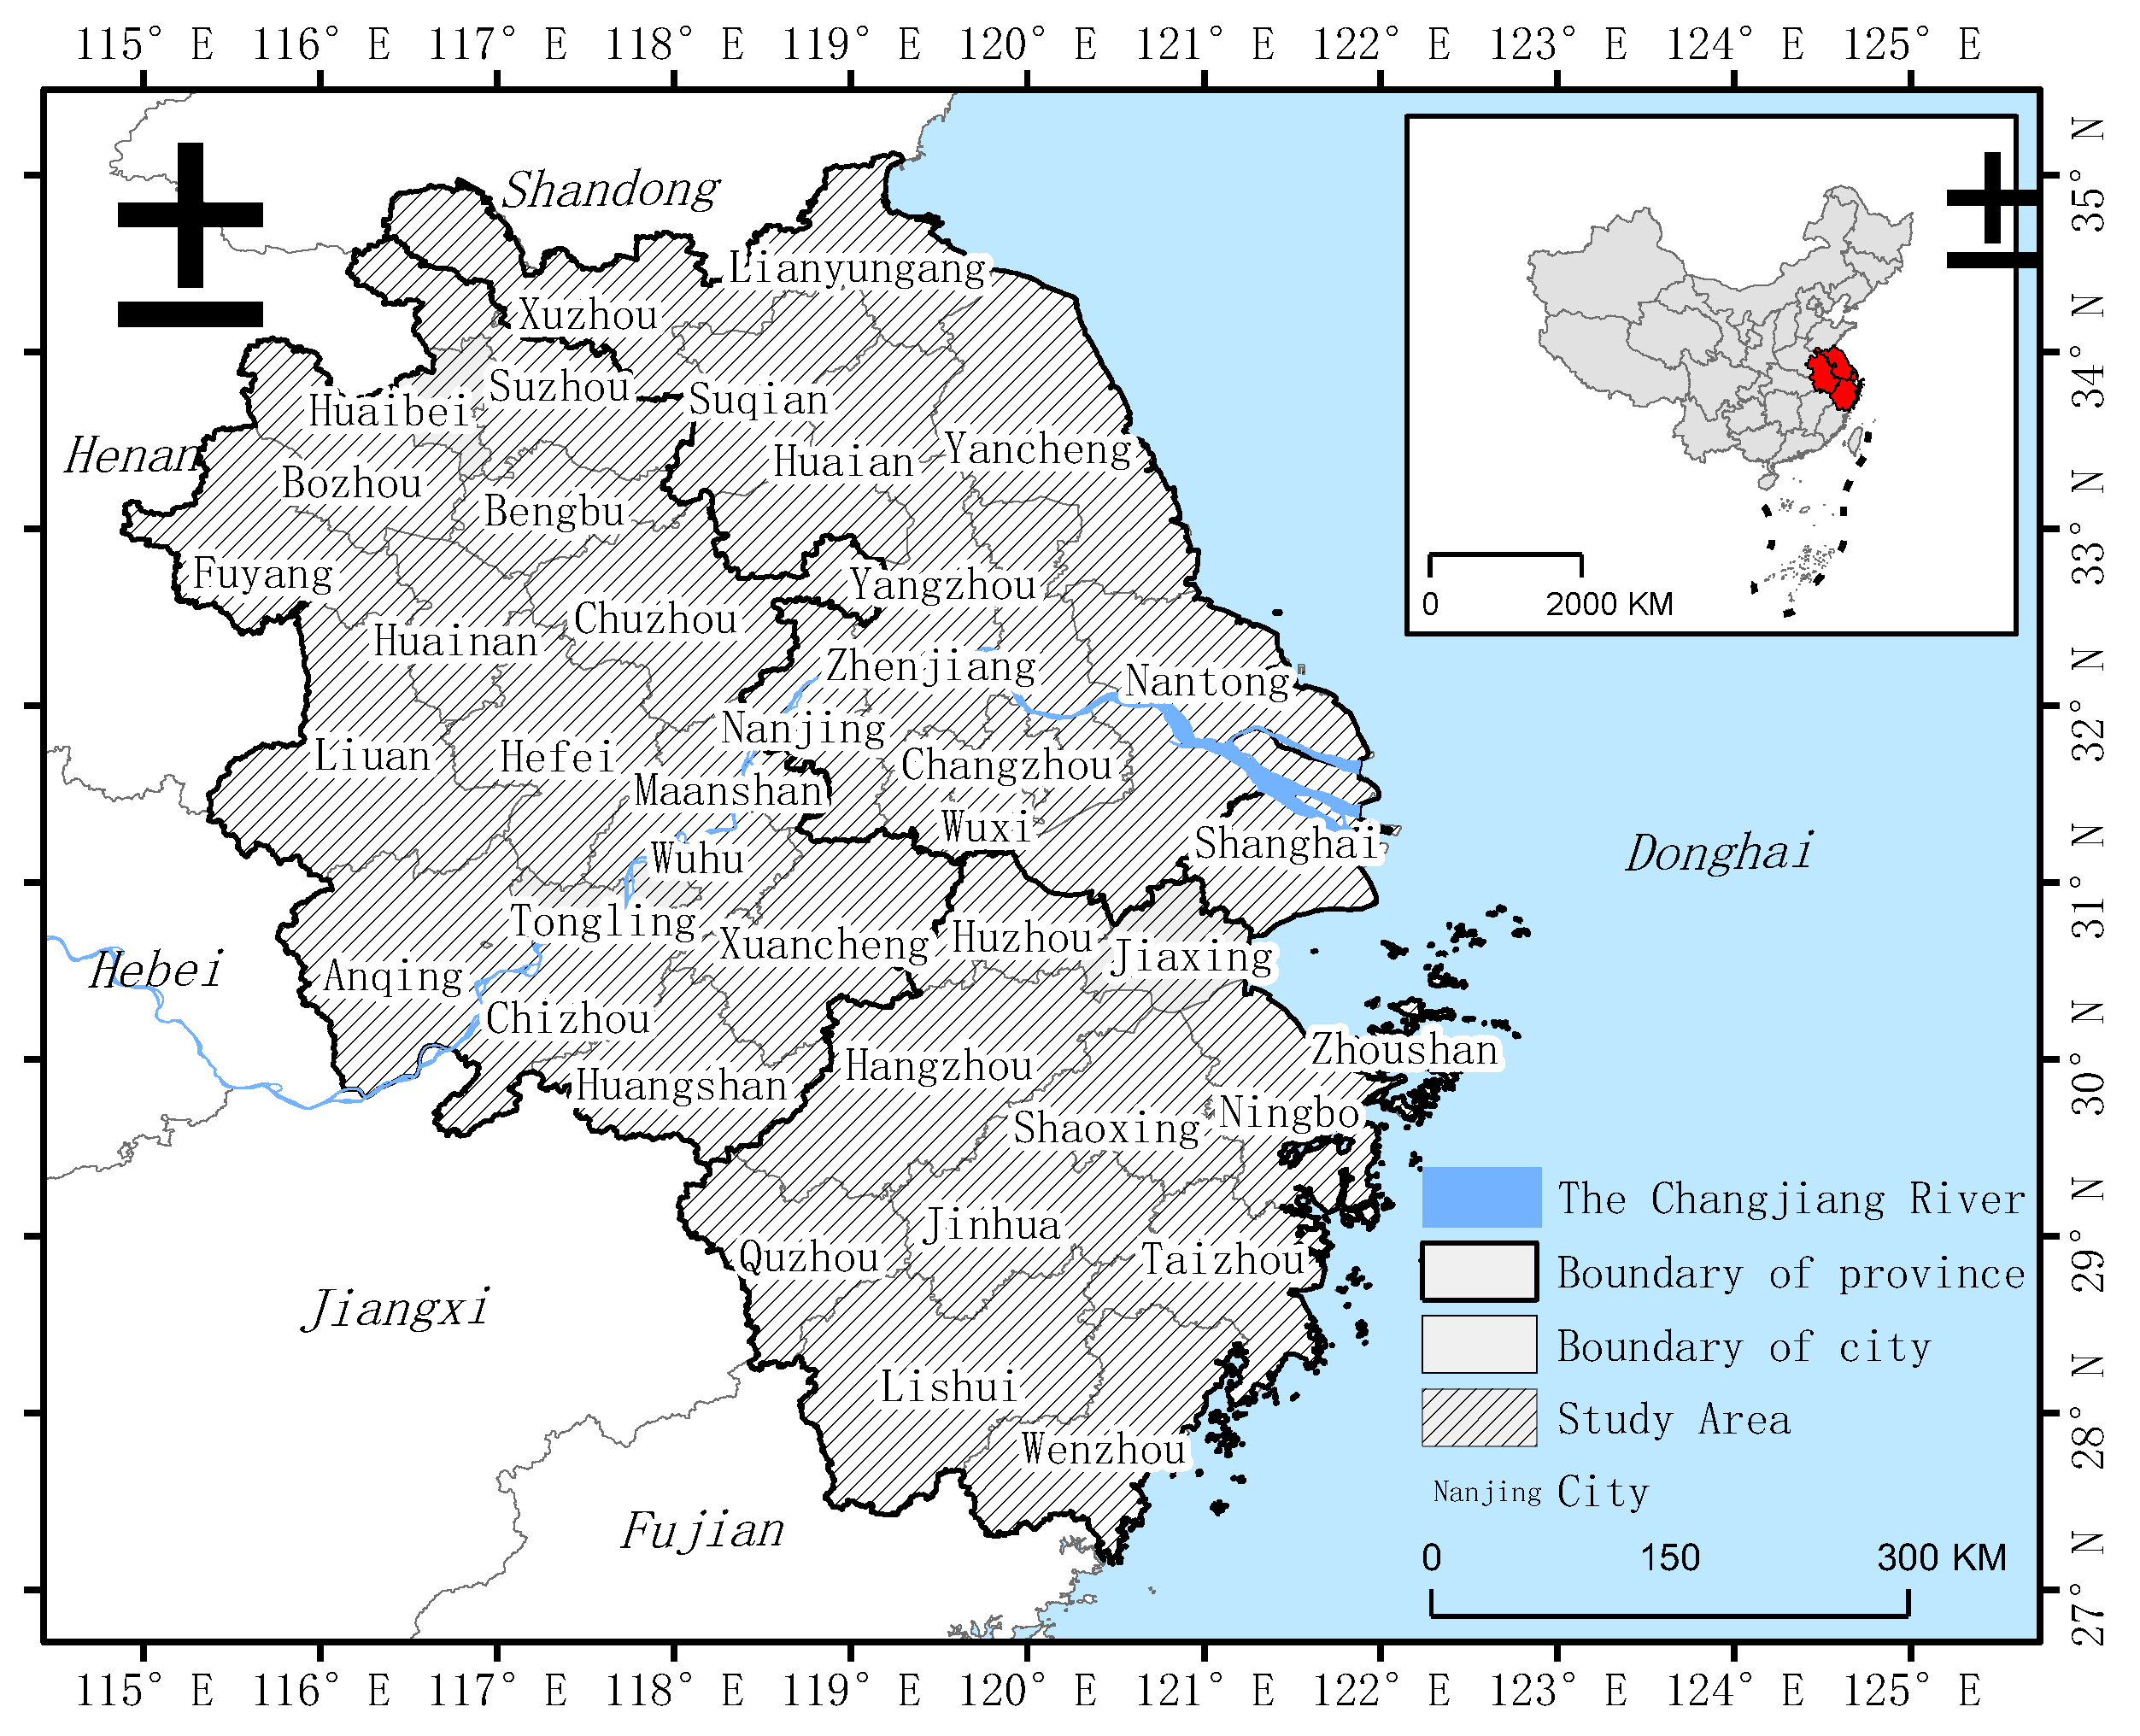
27], with few addressing the spatial correlation structure of their coordinated development. Given this context, this study aimed to systematically assess the development level of the digital economy (DE) and urban–rural integration (URI) in 41 cities in the Yangtze River Delta (YRD), reveal the spatial and temporal characteristics and spatial correlation structure of the coupling of the DE and URI, and explore the main factors affecting the development of the DE and URI in these cities. On this basis, we propose targeted development policy recommendations, which are expected to provide theoretical references and practical reference for achieving high-quality and sustainable development of urban–rural integration in the Yangtze River Delta region and other regions. First, this paper provides an evidence-based evaluation of the development levels and spatial evolution of the coupling coordination between the DE and URI in the Yangtze River Delta. Second, it constructs a spatial correlation network based on a modified gravity model and employs social network analysis (SNA) to explore the roles and contributions of different cities within this network. Third, it utilizes geographic detectors to analyze the factors influencing the coordinated development of the DE and URI.
As a template for URI in China and a crucial hub for digital economic development, studying the synergistic growth of the DE and URI in the Yangtze River Delta is of significant theoretical and practical importance for promoting high-quality development [
28]. Moreover, the findings can provide a practical reference for research on the DE and URI in other regions and even other developing countries.
3. Results and Discussion
3.1. Temporal Characteristics
3.1.1. Temporal Characteristics of Development
Based on panel data from cities in the YDR from 2010 to 2022, the development-level indices of the DE (U1) and URI (U2) systems were calculated. Because of the large amount of data, as well as the fact that both urban–rural integration and digital economic development are complex socioeconomic development phenomena that require a great deal of time to accumulate before they can be reflected, in order to visualize the changes between the two, the results for 2010, 2014, 2018, and 2022 were selected to construct a comparison matrix (
Table 4) for the analysis.
When comparing the development levels of the DE and URI, it was found that from 2010 to 2014, the DE in the YDR generally lagged behind URI. Particularly in cities such as Xuzhou, Nantong, Zhenjiang, and Wenzhou, there was a significant mismatch between the DE and URI. An analysis of the primary, secondary, and tertiary industry outputs of these cities revealed that their economic development relied heavily on secondary and tertiary industries, with a low proportion of primary industry output. Benefiting from policies that promoted DE development and industrial digital transformation, from 2014 to 2022, most cities began to outperform in terms of DE development compared with URI owing to policy support. The DE has developed rapidly in cities such as Hangzhou, Nanjing, Shanghai, Hefei, Suzhou, and Wuxi. Notably, thanks to the regional linkage development strategy of digital industry in Shanghai and Hangzhou, the DE development level exceeded 0.60 in 2019 and 2017, respectively, with Shanghai reaching 0.751 by the end of the study period.
3.1.2. Temporal Characteristics of Coordination
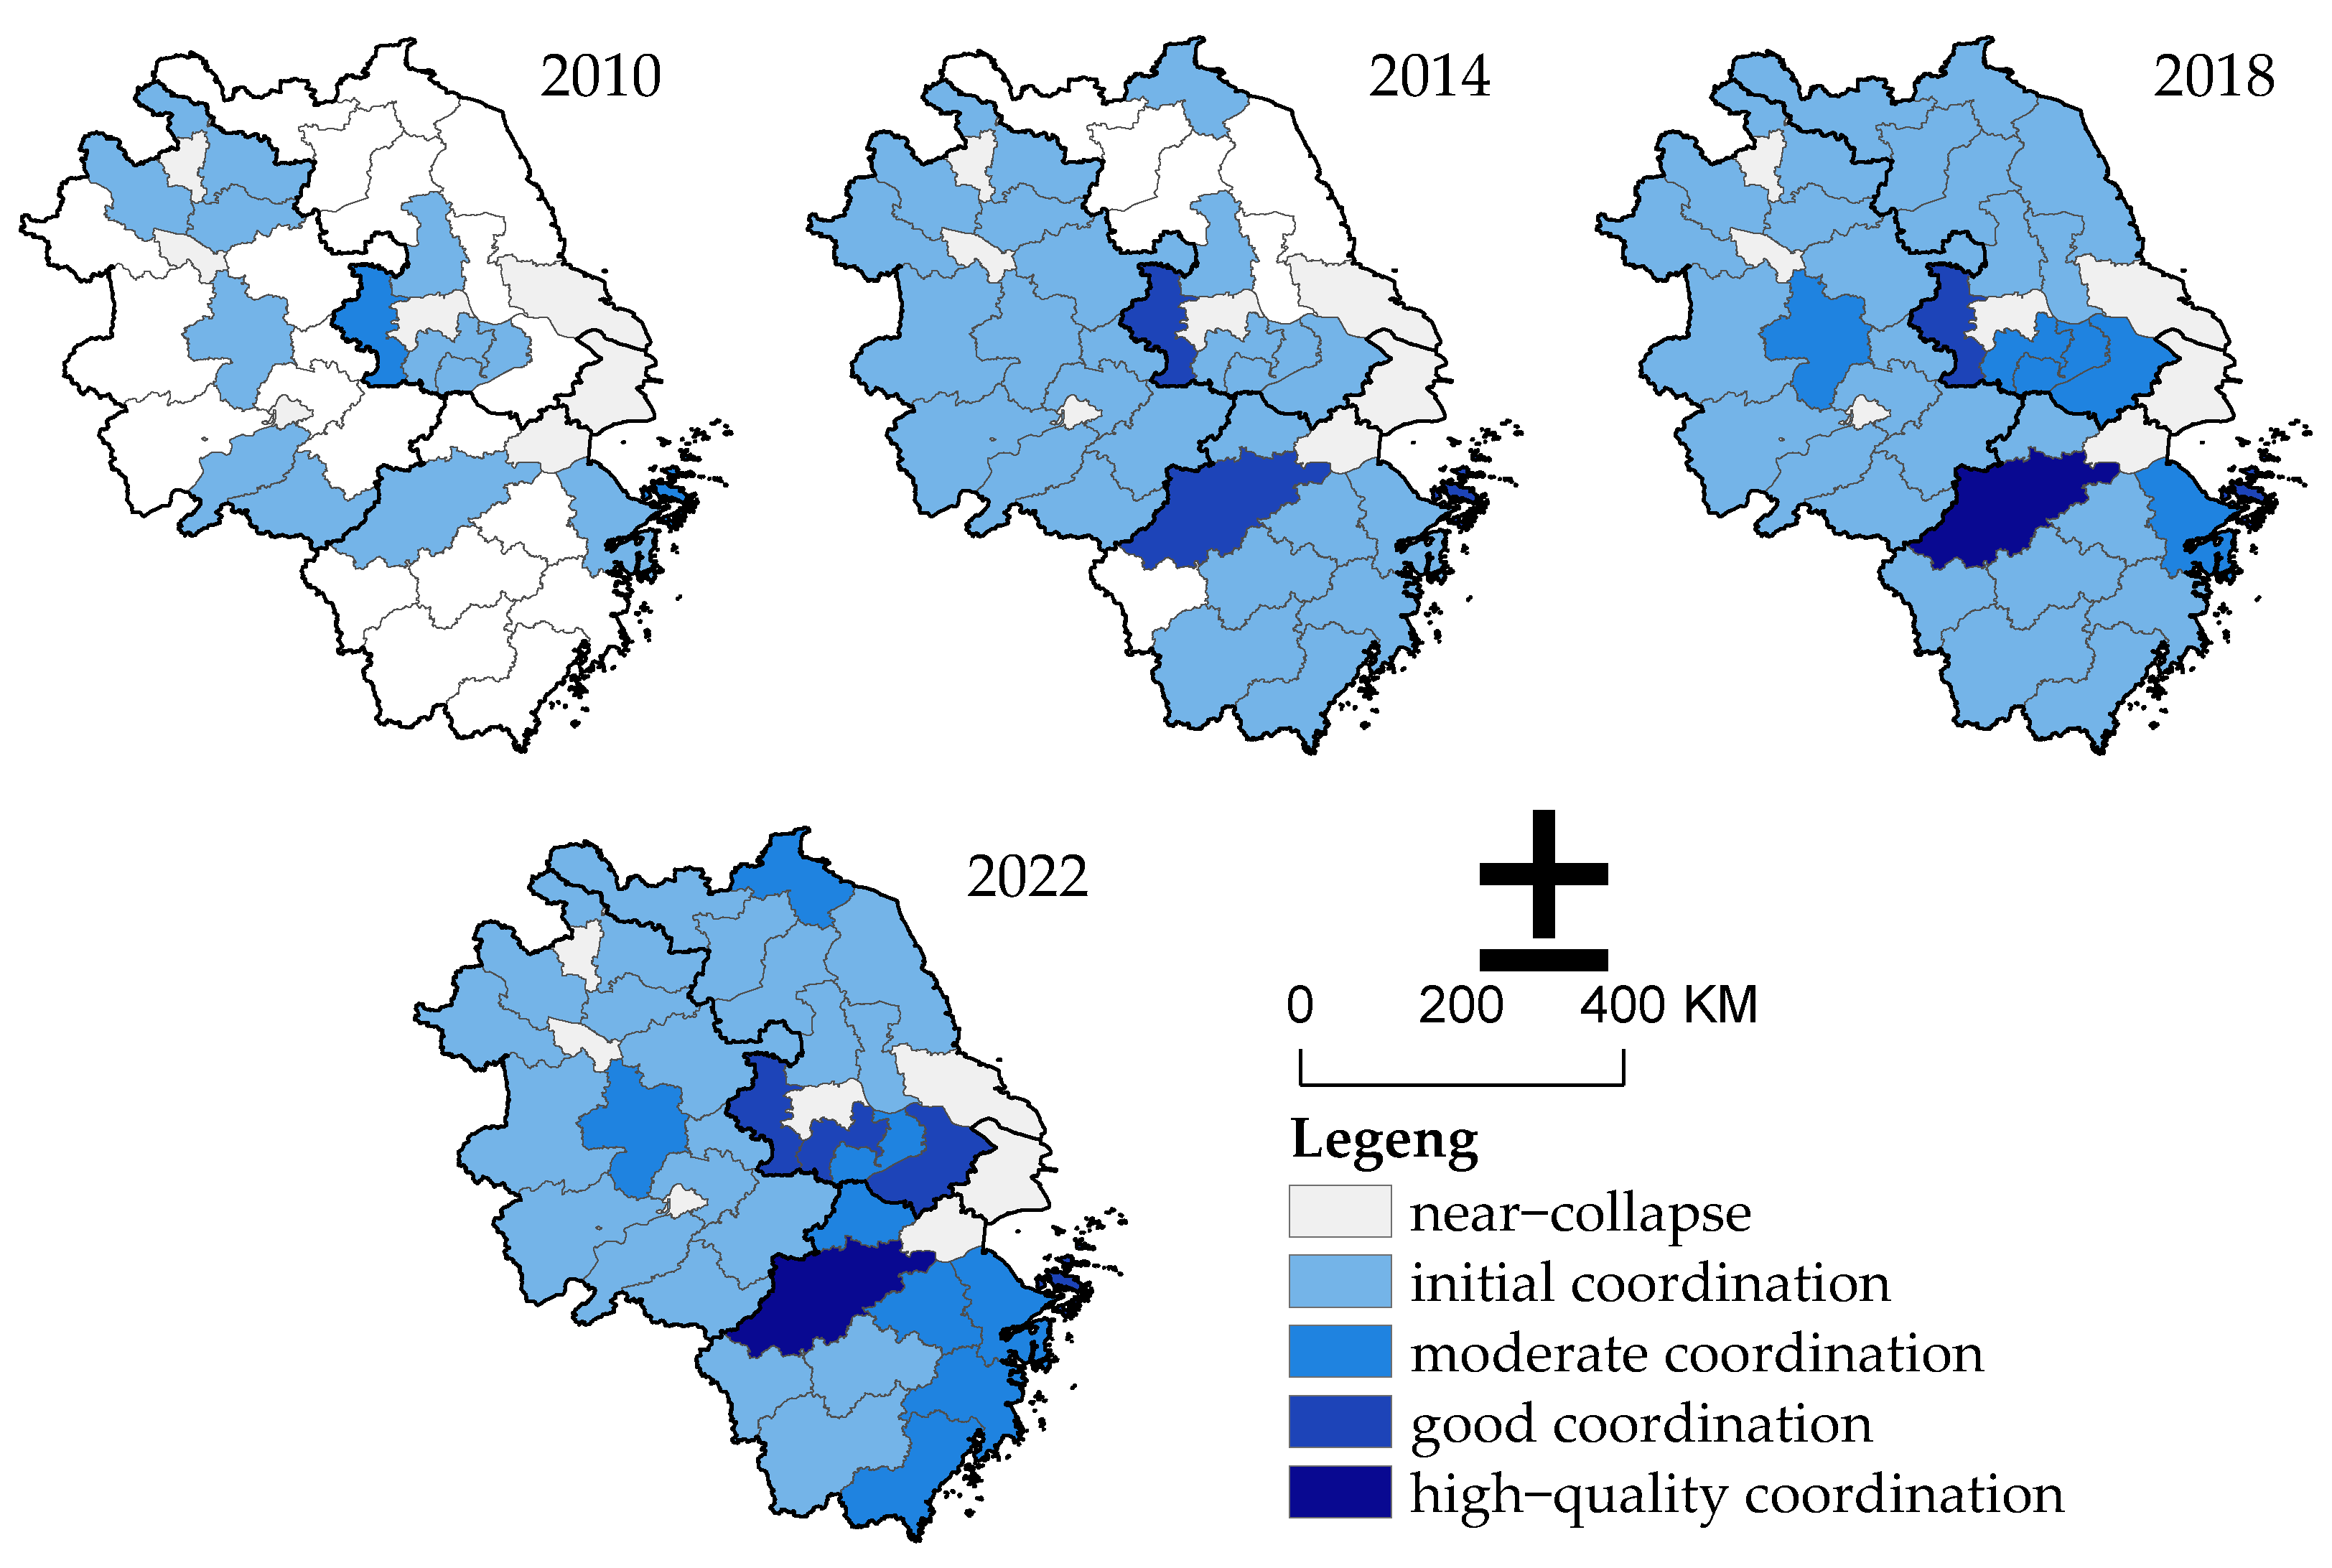
Based on the results calculated from the coupling coordination degree model, ArcGIS 10.8 software was used to create spatial distribution evolution maps of the coupling coordination degree between the DE and URI across cities in the YDR (
Figure 2). As illustrated in
Figure 2, owing to the mismatch between regional DE development and URI, the coupling degree in most cities of the YDR has been relatively low, primarily ranging between 0.2 and 0.5, indicating that preliminary and moderate coordination has predominated. Specifically, during the period from 2010 to 2014, the coordination level between DE development and URI was extremely low, with most areas showing minimal to no coordination. Only a few cities, mainly provincial capitals and their surrounding areas, had achieved preliminary coordination. As the regional political and economic center, the provincial capital city is at the forefront of regional industry and digital upgrading. From 2014 to 2018, preliminary coordination became the norm, with some provincial capitals achieving moderate or high coordination. Cities along the Nanjing–Shanghai axis benefiting from the radiative effects of Shanghai and Nanjing displayed good coordination. From 2018 to 2022, preliminary and moderate coordination became dominant, with some cities achieving good coordination. Cities with higher levels of coordination were predominantly located along the Nanjing–Shanghai axis and in the southeastern coastal region, with the overall distribution forming an “M” shape. In summary, from 2010 to 2022, the degree of coupling coordination of the YDR was primarily in the preliminary coordination stage. After 2018, with the implementation of the YDR integration strategy, cities such as Nanjing, Shanghai, and Hangzhou played significant roles in promoting growth, leading to an increase in cities with moderate and good coordination.
3.1.3. Spatial Characteristics
From 2010 to 2022, the standard deviation ellipsoid of the coupling coordination degree between the DE and URI in the YDR showed a distinct northwest–southeast distribution pattern. The parameters of the standard deviation ellipsoid generally remained stable (see
Table 5), with slight fluctuations. The shape index of the ellipsoid displayed a continuous fluctuating trend, with the major axis showing a decreasing trend and the minor axis first decreasing and then increasing. The amplitude of the change in the major axis was greater than that in the minor axis. This indicates that the concentration of the coupling coordination degree increased over the 2010–2022 period and the distribution direction became more pronounced. The overall azimuth angle of the ellipsoid showed a “first decreasing, then increasing” trend, suggesting that the directional characteristics of the distribution of the coupling coordination degree in the YDR changed slightly. The centroid of the standard deviation ellipsoid was located in the southern part of Nanjing (119°6′ E–118°59′ E, 31°25′ N–31°27′ N), primarily because the central and southeastern cities of the YDR had higher levels of coupling coordination than the northwestern regions, causing the centroid to be positioned slightly southward in the central part of the delta. The centroid of the standard deviation ellipsoid shifted southeastward during the study period, indicating an increasing concentration of the coupling coordination degree in the southeastern part of the YDR, which also reflected the growing relative advantage of the central and southeastern regions of the delta.
3.1.4. Spatial Development Trends
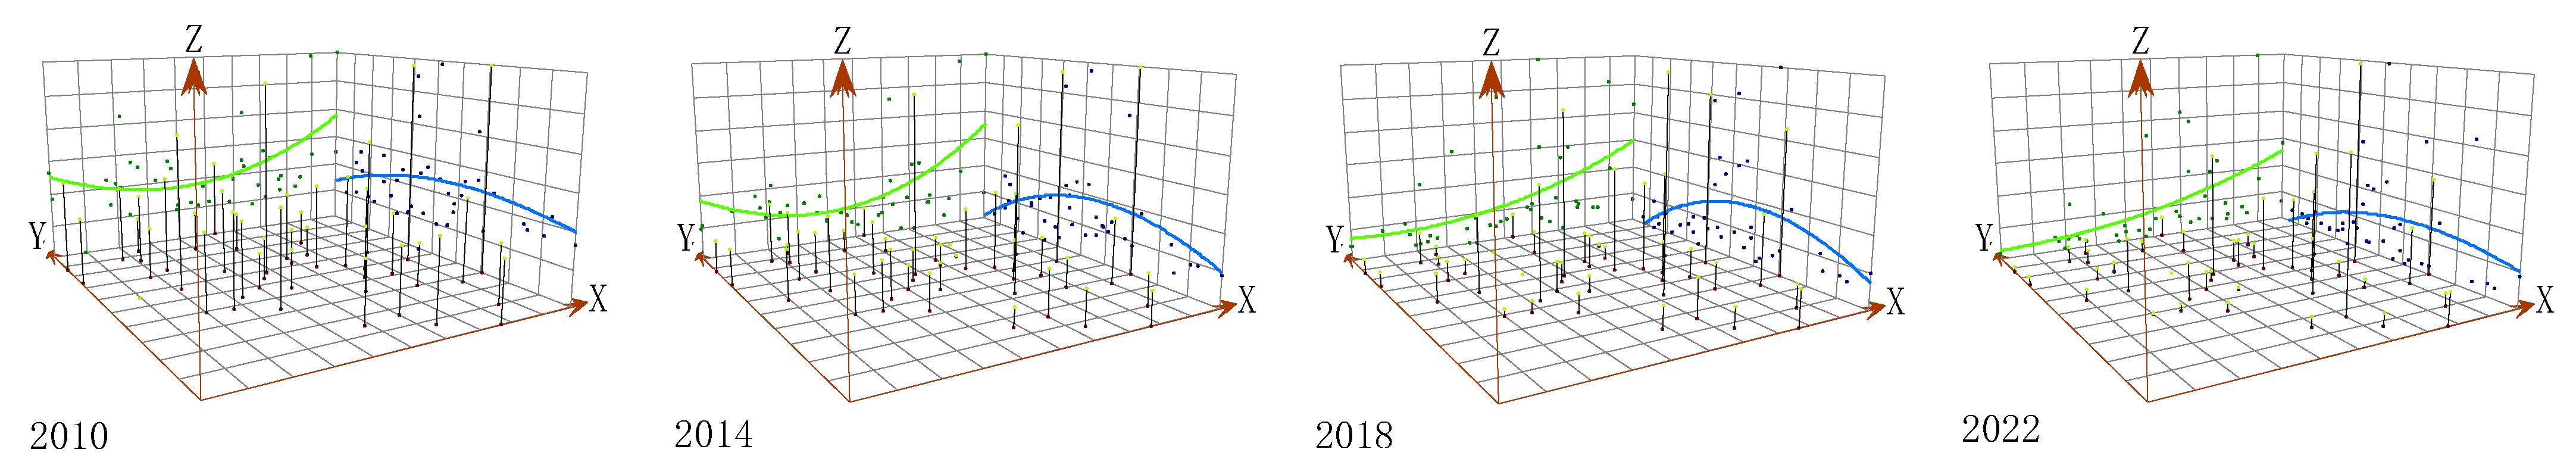
Trend analysis was employed to explore the developmental mechanisms and evolutionary processes of coupling coordination between the DE and URI in the YDR. According to the trend surface fitting results (
Figure 3), in the early years, the distribution of the coupling coordination degree across the X-axis (east–west) displayed a U-shape with “high ends and a low center”, while along the Y-axis (north–south), it exhibited an inverted triangle pattern with a “high center and low ends”. Over time, the X-axis (east–west) trend gradually evolved into a “high east, low west” pattern, indicating that the advantages in the coupling coordination degree of eastern cities became more pronounced. Along the Y-axis (north–south), the overall curve showed a downward trend with more pronounced declines at both ends, indicating an expanding advantage for the central cities. Notably, the changing trend along the east–west direction was steeper than that along the north–south direction, indicating more pronounced and intense distribution differences along the east–west axis. In summary, during coupling coordination development in the YDR, the central region outperformed the southern and northern regions, and the eastern region outperformed the western region.
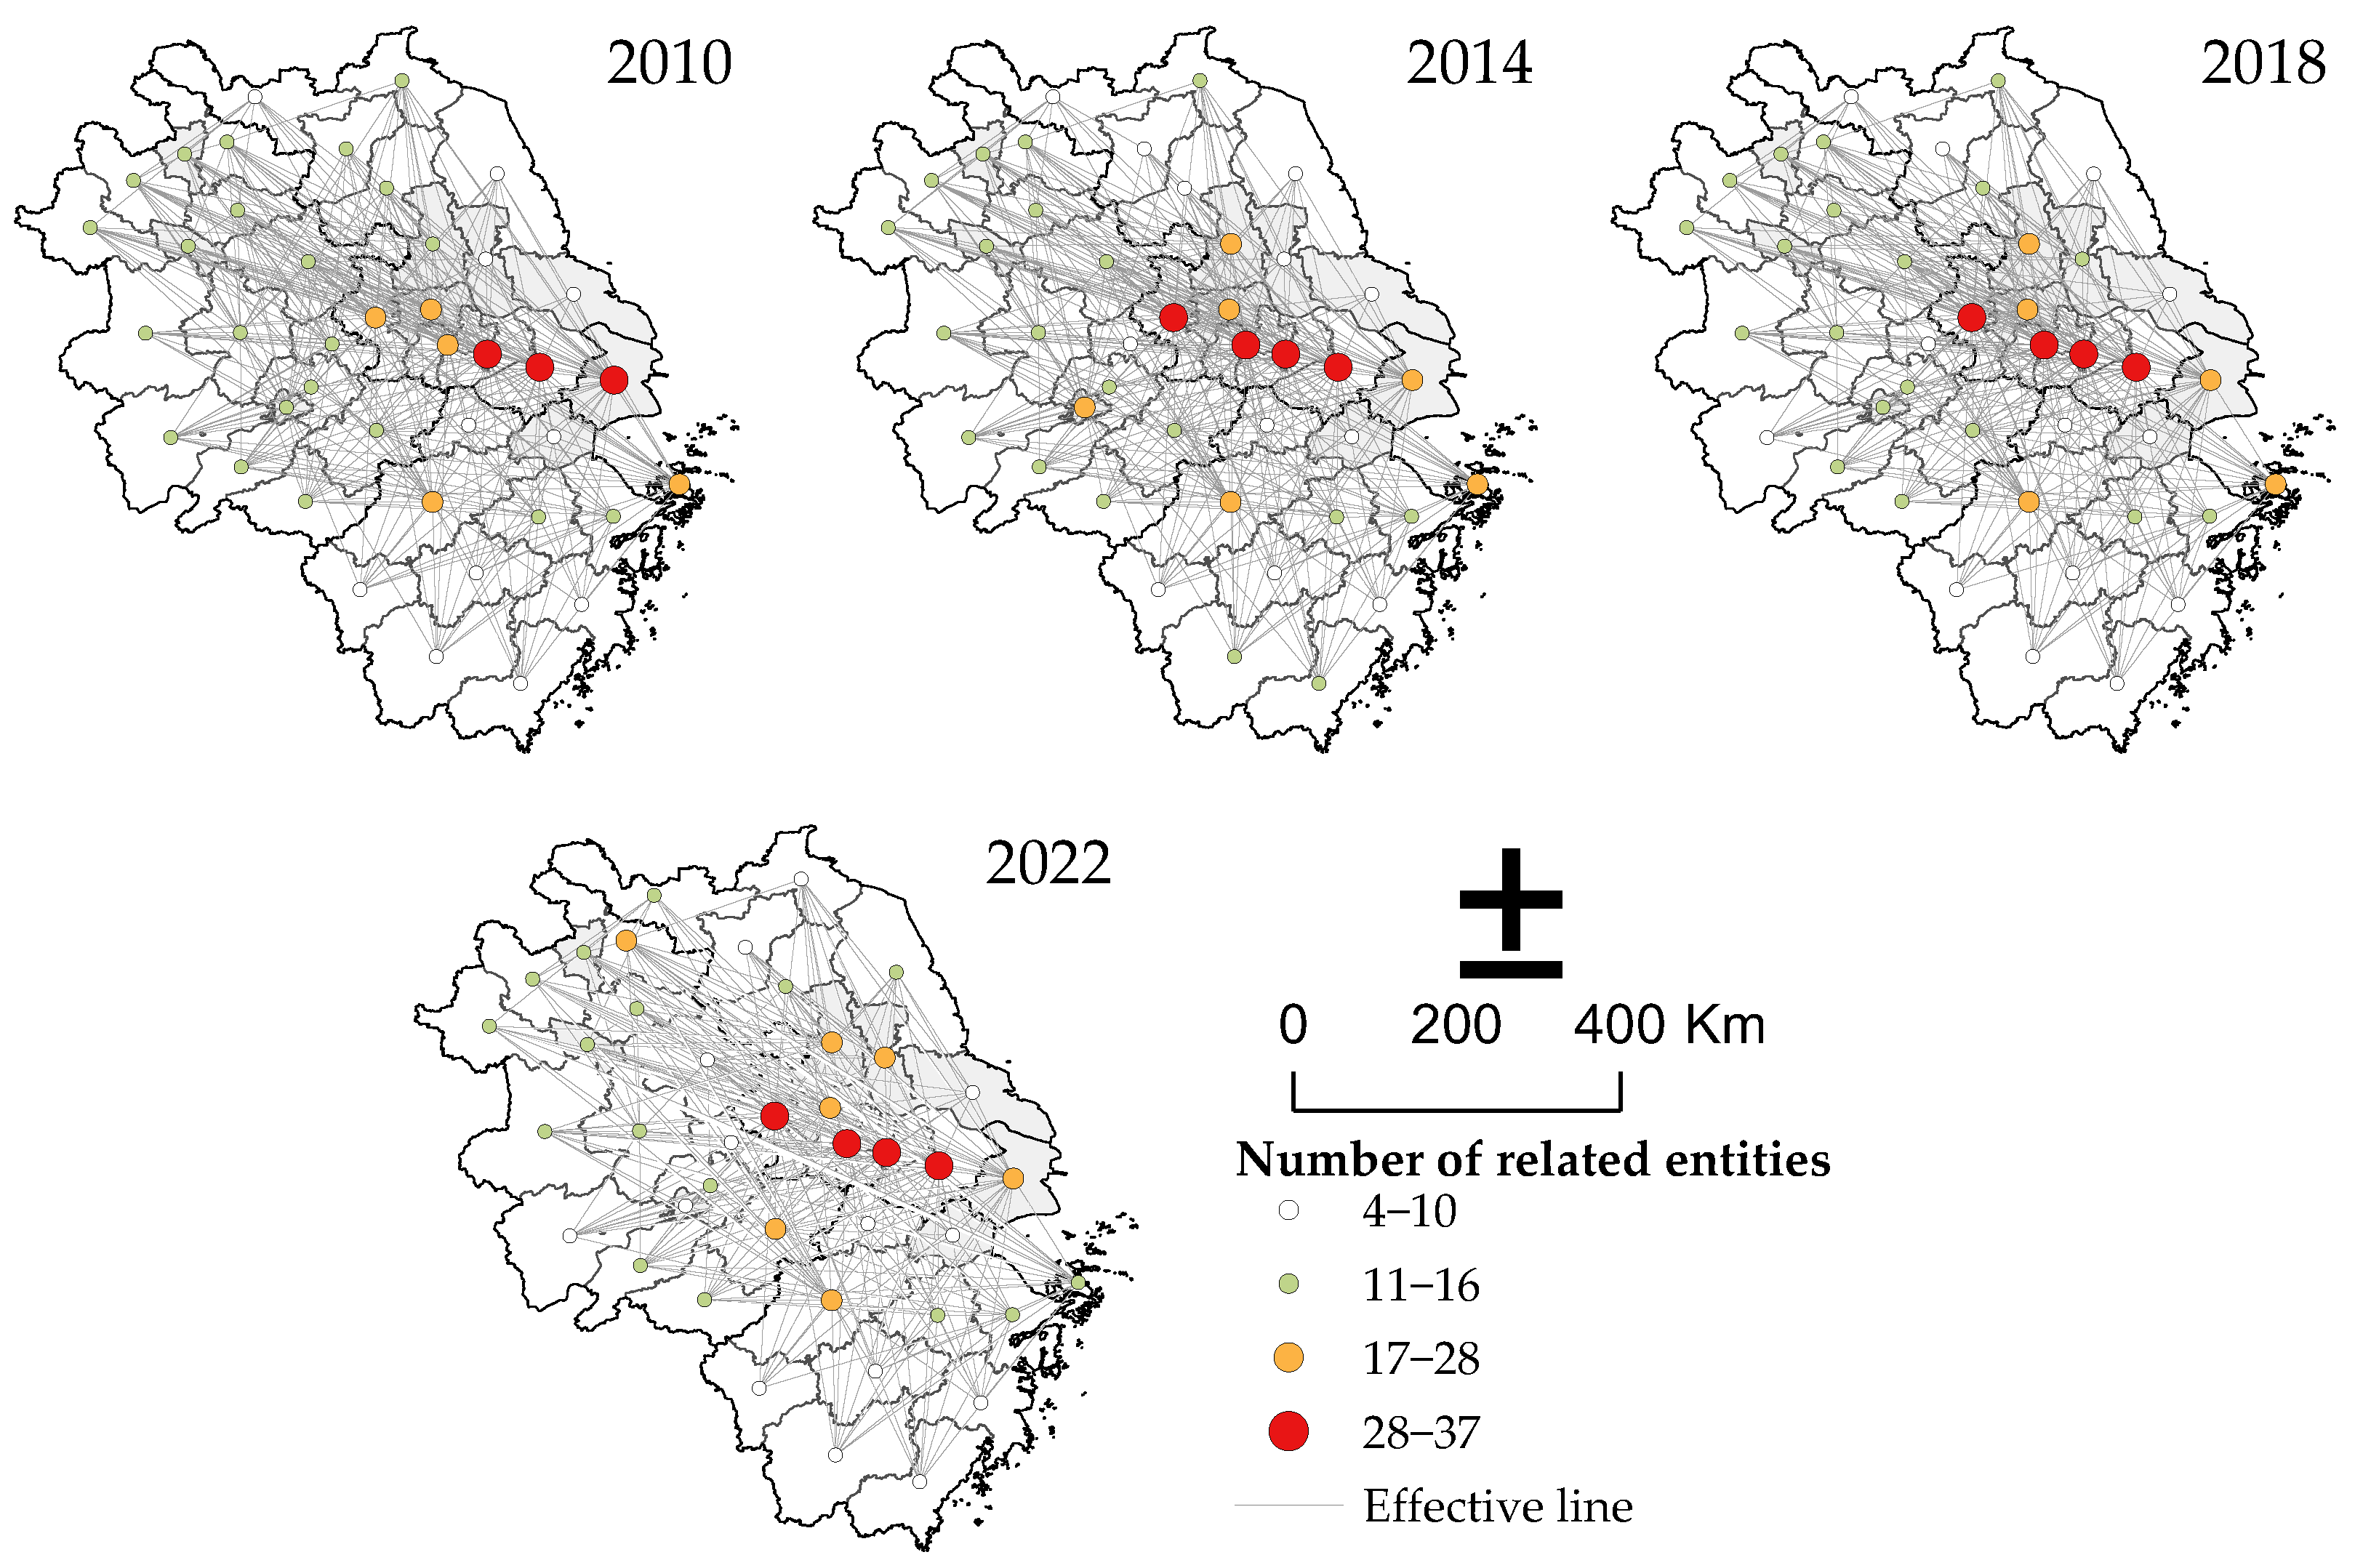
3.2. Spatial Correlation Network
Figure 4 illustrates that the coupling coordination degree between the DE and URI in the YDR had a distinct network structure, indicating that the coupling coordination degree transcended traditional geographical constraints and that its spatial effects were no longer confined to neighboring units. In 2010, Shanghai, Suzhou, and Wuxi occupied core positions within the coupling coordination network, with surrounding cities, such as Nanjing, Zhenjiang, and Changzhou, showing significant connectivity. After 2014, Nanjing, Changzhou, Wuxi, and Suzhou leveraged their strategic locations in the core region and emerged as central areas, while the number of surrounding secondary cores gradually increased over time. The spatial interactions between Jiangsu province (centered on Nanjing and Suzhou) and Shanghai became more frequent, whereas the interactions between Anhui and Zhejiang provinces remained relatively sluggish. Overall, the spatial interactions exhibited unbalanced characteristics, with a dense central area and sparse connections in the northwest and southeast. By 2022, Jiangsu’s position in the network was robust, with Hangzhou and Yangzhou connecting to adjacent cities and fostering a multipolar network in the central YDR. Suqian and Xuancheng had also emerged as significant gateways in the northwest and southwest regions; however, the overall network pattern still reflected an unbalanced structure that requires improvement.
3.2.1. Analysis of Overall Network Characteristics
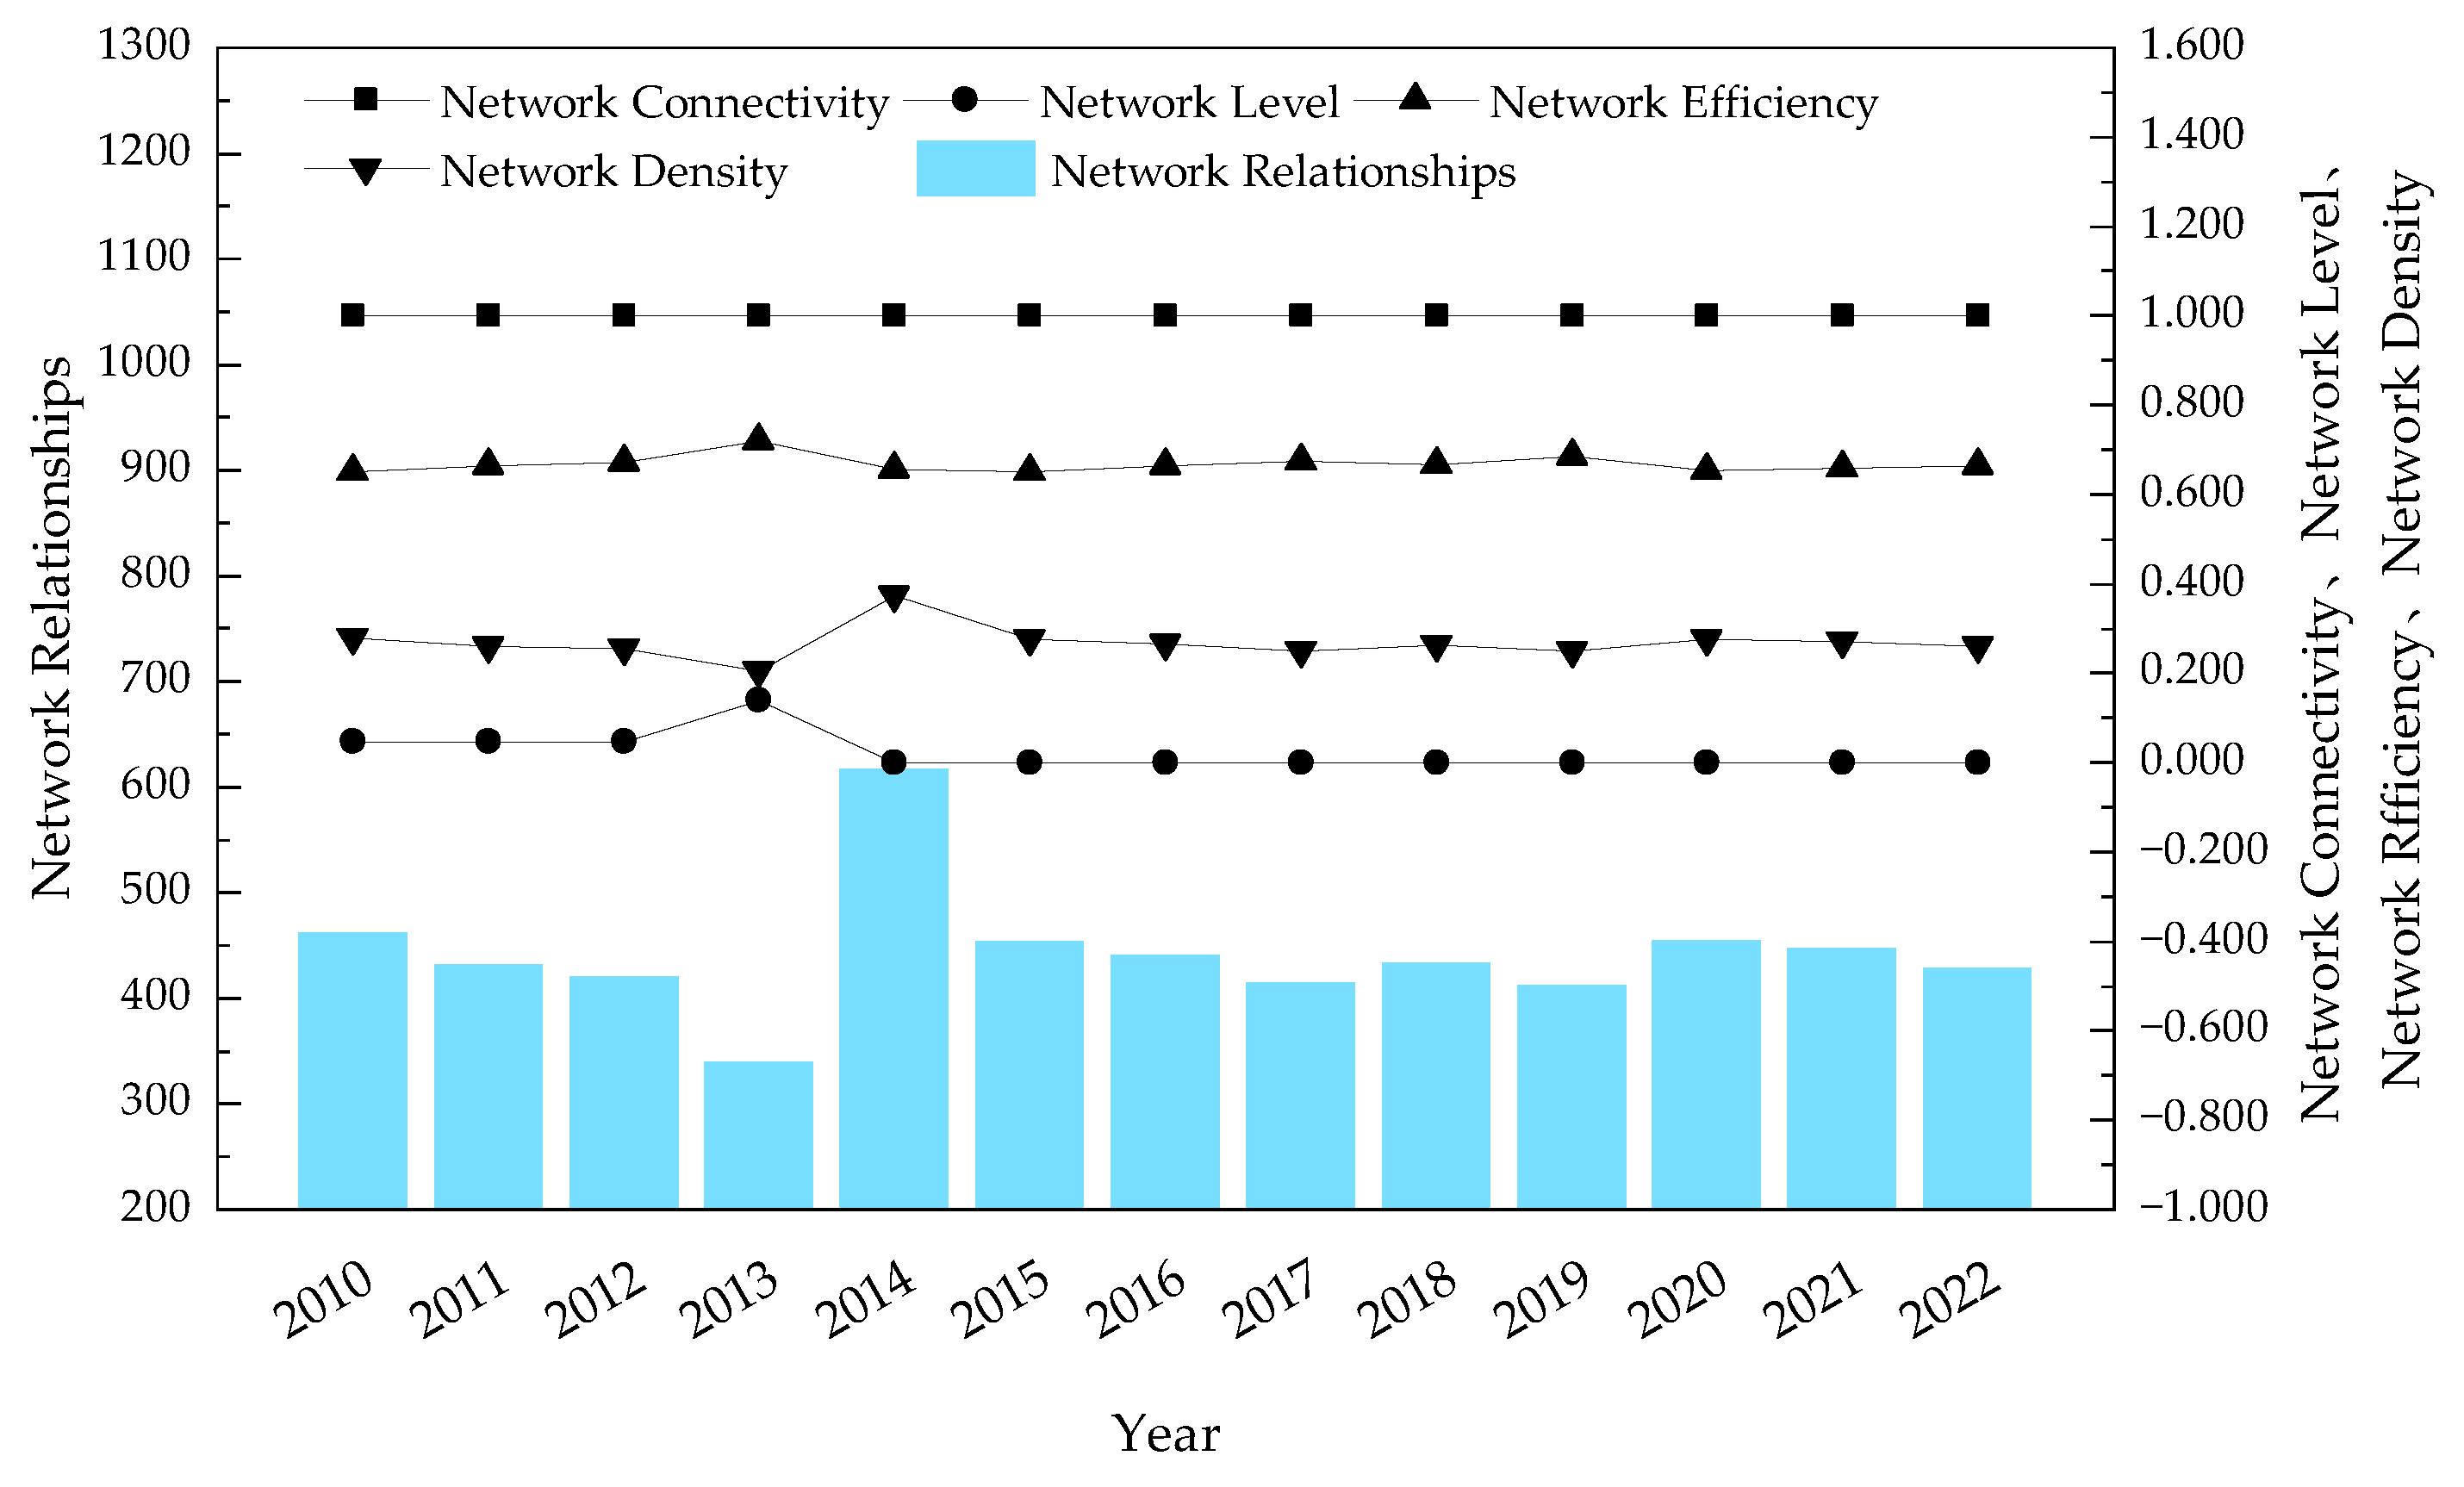
Overall, the network connection strength of the DE and URI integration-coupled coordination in the YDR remained stable. The number of network relationships initially declined and then increased, whereas network efficiency and density exhibited only slight fluctuations (
Figure 5). Specifically, the network correlation remained constant at 1, indicating the absence of “isolated nodes”. From 2010 to 2014, the number of network relationships decreased from 461 to 340, reflecting a reduction in interactions between cities. A possible reason is that the competition in the digital industry layout between the early cities weakened. After 2014, the number of network relationships increased and stabilized at approximately 430, suggesting the restoration of spatial connections in coupling coordination among cities. However, a significant gap remains in terms of the maximum possible relationship count (1640), indicating that cities should continue to enhance cooperation and collaborative construction in the DE and in URI to improve the density and compactness of spatial connections. In terms of network hierarchy, the structure had transitioned from a hierarchical model to a flat one by 2014, with the network density fluctuating around 0.270, suggesting a stable spatial correlation. The average network efficiency was maintained at a high level of 0.670, implying that the intercity connection paths were still relatively singular and the degree of network connectivity and stability required enhancement.
3.2.2. Analysis of Node Centrality Characteristics
By calculating the centrality of each city, we assessed its role and position within the spatial correlation network. As shown in
Table 6, the overall degree of centrality has declined. In 2010, Shanghai, Wuxi, and Suzhou had significantly higher degree centralities than the other cities, positioning them as leaders with a notable radiative effect on surrounding cities. Conversely, cities such as Nantong, Taizhou, and Jinhua had lower degree centralities, categorizing them as peripheral actors. With an overall increase in coupling coordination, the degree centralities of Nanjing and Changzhou also increased, enhancing the influence of Jiangsu and Shanghai within the YDR network structure. The closeness centrality displayed an overall upward trend. Nantong, Yancheng, Jinhua, and Taizhou formed the first tier, whereas Huai’an, Suqian, and Wenzhou constituted the second tier, becoming intermediaries for the diffusion of advantages owing to their favorable transportation positions. Most provinces exhibited low betweenness centrality values. However, cities such as Shanghai, Wuhu, and Suqian showed gradual increases in betweenness centrality, indicating the effective mediation role played by cities surrounding the core area. Conversely, cities such as Ma’anshan, Anqing, and Tongling have experienced declining betweenness centralities over the years, contributing to the dispersive pattern of multiple intermediaries. Overall, the DE and URI coupled coordination network has resulted in a limited number of unevenly distributed communication intermediaries, which hinders the improvement of network accessibility and stability.
3.3. Analysis of the Driving Factors of Coupling Coordination Development
The coordinated development of the DE and URI is influenced by multiple factors. Based on prior research, four influencing driving-force factors were identified for analysis using a geographical detector to determine relevant developmental characteristics, as follows.
Resource mobility: This factor reflected the convenience of material and information flow between urban and rural areas. The selected detection factors included urban–rural transportation accessibility (X1), internet penetration rate (X2), and the number of mobile phone users per 100 people (X3).
Industrial development: This factor reflected the development level of dominant urban and rural industries. The selected detection factors included the value-added ratio of primary, secondary, and tertiary industries (X4) and the level of agricultural technology (X5).
Social equalization: This reflected the extent of equal access for urban and rural residents to social development. The selected detection factors included the number of hospital beds per 1000 people in urban and rural areas (X6) and the urban–rural medical insurance ratio (X7).
Living environment: This reflected the quality of urban and rural living environments and pollution prevention measures. The selected detection factors included the green coverage rate in built-up areas (X8) and the centralized treatment rate of sewage treatment plants (X9).
After excluding strong correlations between these driving factors using the variance inflation factor, the results showed that none of the variables exhibited strong multicollinearity, thus eliminating the potential issue of strong correlations among the variables.
GeoDetector 2018 software was used to calculate the influence of different detection factors on the coupling coordination degree of the DE and URI for each year (
Table 7). From a time-series perspective, the impact of each detection factor on the coupling coordination degree varied across different periods. From 2010 to 2014, the main influencing factors were the internet penetration rate (
X2), the number of mobile phone users per 100 people (
X3), the value-added ratio of primary to secondary and tertiary industries (
X4), the agricultural technology level (
X5), and the number of hospital beds per 1000 people in urban and rural areas (
X6). From 2014 to 2022, the influence of the internet penetration rate (
X2) and the number of mobile phone users per 100 people (
X3) increased annually, becoming the main influencing factors, along with the level of agricultural technology (
X5).
4. Conclusions and Recommendations
4.1. Conclusion
This study identified various indicators to assess the development levels of the DE and URI in the YDR, after which the coupling coordination degree between these two components was calculated and their coordinated development characteristics and spatiotemporal evolution analyzed, which was then followed by a geographic detector analysis to identify the driving factors influencing the coupling coordination degree. The main conclusions are as follows.
- (1)
The DE and URI in the YDR exhibited different characteristics across various time periods. From 2010 to 2014, the DE lagged behind URI, but experienced rapid growth. Between 2014 and 2022, most cities witnessed their digital economies begin to surpass the levels of URI, with Shanghai and Hangzhou achieving DE development levels of 0.60 in 2019 and 2017, respectively.
- (2)
The coupling coordination degree of the DE and URI in the YDR was relatively low, with most cities recording coupling degrees below 0.40. This discrepancy can be primarily attributed to a mismatch between the two types of development. By the end of the study period, cities with higher levels of coordination were concentrated in the eastern and southeastern regions of the YDR, displaying an M-shaped distribution.
- (3)
The standard deviation ellipse of the coupling coordination degree in the YDR showed clear directional characteristics, with a northwest–southeast distribution pattern. The parameters of the standard deviation ellipse remained stable, with its centroid located in the southern area of Nanjing, exhibiting a movement pattern of “first southeast, then northwest”.
- (4)
Throughout the study period, the distribution of the coupling coordination degree along the X-axis (east–west) evolved from a U-shaped pattern—characterized as “high at both ends, low in the middle”—to “high in the east, low in the west”. Along the Y-axis (north–south), it maintained a “reverse triangular” shape, characterized as “high in the middle, low at both ends”, but the trend became steeper. Overall, the development trend indicated that the central region was outperforming the southern and northern regions and that the eastern region was outperforming the western region.
- (5)
The coupling coordination degree formed a complex network structure, with core cities expanding from Shanghai, Suzhou, and Wuxi to Nanjing and Changzhou, promoting multipolar development. Although the overall network connection strength remained stable, collaboration among cities needs to be enhanced. The network structure transitioned from hierarchical to flat, with centrality analysis indicating an increase in influence for Nanjing and Changzhou. However, the distribution of mediation roles remained uneven, affecting network accessibility and stability.
- (6)
The factors influencing the coordinated development of the DE and URI were found to be complex, with varying influences across different periods. From 2010 to 2014, industrial development was the dominant driving force. Between 2014 and 2022, household internet penetration rates and mobile phone user numbers gradually became the primary influencing factors.
4.2. Recommendations
Based on the research conclusions, the following recommendations are proposed.
- (1)
Enhancing Digital Infrastructure to Reduce Regional Disparities
The study highlights the uneven development of digital infrastructure across different regions. Governments should prioritize investment in rural broadband expansion, 5G deployment, and smart infrastructure, ensuring equal access to digital services. Additionally, financial incentives and public–private partnerships should be encouraged to accelerate the construction of digital public service platforms in rural areas.
- (2)
Strengthening the Bidirectional Flow of Resources between Urban and Rural Areas
The results show that digital economic benefits are not evenly distributed across urban and rural areas. To bridge this gap, policies should promote digital platforms for agricultural supply chains, e-commerce integration, and remote education and healthcare services. Supporting rural entrepreneurship in the digital sector can further facilitate the diffusion of digital economic advantages to underdeveloped areas.
- (3)
Establishing Targeted Policy Interventions to Improve Coordination Mechanisms
Given the varying levels of urban–rural coordination across different cities, a regional policy differentiation approach should be implemented. Coastal cities with advanced digital economies should focus on integrating smart technologies with urban–rural governance, while inland regions should prioritize digital infrastructure investment and capacity-building programs to support lagging areas.
- (4)
Developing a Monitoring and Evaluation Framework for Digital-Economy-Driven Urban–Rural Integration
To ensure effective implementation, a real-time data monitoring system should be developed to track the progress of digital economy initiatives and their impact on urban–rural integration. Periodic assessments should be conducted to refine policies using data-driven decision-making tools such as geospatial analysis, machine learning, and impact evaluation models.
- (5)
Incorporating Digital Economy Development into Urban–Rural Sustainability Goals
Digital transformation should be aligned with sustainability objectives, ensuring that urban–rural digital development supports carbon reduction, smart energy solutions, and low-carbon transportation. Policy frameworks should integrate green digital finance initiatives, renewable energy projects, and intelligent urban planning, fostering a sustainable and resilient urban–rural development model.
4.3. Discussion
This study explored the coordinated development of the DE and URI within the YDR region alongside its spatial correlation structure, employing various quantitative analysis methods such as the entropy-weighted TOPSIS method, coupling coordination model, improved gravity model, and geo-detector. Several key findings merit further discussion. First, in terms of the evolution of the network structure, there has been a significant change in the core cities of the Yangtze River Delta, with cities such as Hangzhou and Suzhou gradually increasing their centrality. This change may be attributed to the significant improvements in digital infrastructure, innovation capacity, and expansion of the digital economy in these cities, which have enhanced their ability to drive the development of neighboring regions. Second, the change in the number of network relationships also reflects the dynamic adjustment of intraregional cooperation. Overall, the frequency of intercity factor mobility increased as the digital economy and the level of urban–rural integration improved, leading to higher network density; however, the number of connections declined in some cities in some years, which may be related to macroeconomic fluctuations, the impact of the new crown epidemic, or regional policy adjustments. Future research should adopt a multidimensional perspective, including economic, social, and political factors.
However, the study still has some shortcomings. Firstly, we used economic and social data to construct an indicator system for the development of DE and URI based on previous studies, but it may not accurately reflect the development level of DE and URI, because there is no uniform standard for measuring the development level of the two and the differences in the statistical methods of the data in different regions. Second, the study focused on 41 cities in the YDR region, and despite the fact that the region has a developed economy and relatively complete data, the results may be difficult to fully apply to other regions in China with different levels of economic development and urban–rural structures. Finally, the methodology used in the study may have certain simplifications and assumptions when dealing with multidimensional interactions and dynamic changes, only describing the temporal evolution of the URI and the coordinated development of DE in the YDR, but with a lack of in-depth relationships. In the future, research can combine remote sensing images, travel data, and other big data combined with instrumental variables such as government investment and infrastructure construction to explore the system and mechanisms of the impact of DE on urban and rural integration development.


