Article

Enhanced Landslide Risk Assessment Through Non-Probabilistic Stability Analysis: A Hybrid Framework Integrating Space–Time Distribution and Vulnerability Models

1
School of Civil Engineering and Architecture, Wuhan Institute of Technology, Wuhan 430074, China
2
School of Civil and Hydraulic Engineering, Huazhong University of Science and Technology, Wuhan 430074, China
*
Author to whom correspondence should be addressed.
Sustainability 2025, 17(9), 4146; https://doi.org/10.3390/su17094146
Submission received: 26 March 2025 / Revised: 30 April 2025 / Accepted: 1 May 2025 / Published: 3 May 2025
(This article belongs to the Section Hazards and Sustainability)

Abstract

Landslide risk assessment can quantify the potential damage caused by landslides to disaster-bearing bodies, which can help to reduce casualties and economic losses. It is not only a tool for disaster prevention and mitigation, but also a key step to achieve the coordinated development of the environment, economy, and society, and it provides important support for the realization of the global sustainable development goals (SDGs). In this study, a risk assessment method is proposed for an individual landslide based on the non-probabilistic reliability theory. The method represents an improvement to and innovation in existing risk assessment methods, which can obtain more accurate assessment results with fewer sample data points, refines the methods and steps of landslide risk assessment, and fully considers the destabilization mechanism of the landslide and the interaction with disaster-bearing bodies. A non-probabilistic reliability analysis of the slope was conducted, and the possibility of landslide occurrence was characterized by the failure value of the slope. Moreover, the influence range of the landslide was predicted using empirical formulas; space–time distribution probabilities of the disaster-bearing bodies were estimated by combining their location and activity patterns; and the vulnerability of the disaster-bearing bodies was calculated according to the landslide intensity and the resistance or susceptibility index of the disaster-bearing bodies. The method’s feasibility was verified through its application to the Xiatudiling landslide as a case study. In the process of performing slope stability calculations, it was found that the calculation results of the Monte Carlo method were consistent with those of the non-probabilistic reliability approach proposed in this paper, which was able to obtain more accurate results with less sample data. The personnel life and economic risks were 1.8499 persons/year and CNY 184,858/year (USD 25,448/year), respectively, under heavy rainfall conditions. The results were compared with the risk judgment criteria for geological disasters, and both risk values were unacceptable. After landslide treatment, the possibility of landslide occurrence was reduced, and the personnel life risk and economic risk of the landslide were also reduced. Both risk values then became acceptable. The effect of landslide treatment was obvious. The proposed method provides a new technique for assessing landslide risks and can help in designing mitigation strategies. This method can be applied to landslide risk surveys conducted by geological disaster prevention institutions, demonstrating enhanced applicability in data-scarce regions to improve risk assessment efficiency. It is particularly suitable for emergency management authorities, enabling rapid and comprehensive assessment of landslide risk levels to support informed decision making during critical response scenarios.

1. Introduction

Landslide risk refers to the number of personnel casualties and economic losses that may be caused by landslide disasters within a certain period. The risk assessment of landslides allows us to understand the extent of the impact of potential landslides on human activities and to implement timely prevention measures [1,2,3,4].
Varnes [5] first proposed that the value of landslide risk is the product of the landslide hazard, the vulnerability of the disaster-bearing bodies, and the value of the disaster-bearing bodies; Fell [6] presented relevant definitions applicable to landslide risk assessment and discussed risk quantification and acceptable risk; and Van Westen et al. [7] added to some of the risk assessment steps that had been proposed and developed a relatively complete framework for landslide risk assessment.
After that, more in-depth research on landslide risk assessment methods was carried out. Zhou et al. [8] calculated the landslide hazard and vulnerability of the region based on the contribution weight model and used GIS technology to overlay the two to obtain the geological disaster risk zoning. Saleem et al. [9] used an analytical hierarchical process (AHP) to assign weights to the susceptibility factors of landslides in the sub-Himalayan region of Pakistan and obtained susceptibility zones using the weighted overlay method. Liu et al. [10] considered various factors that influenced landslide occurrence and used AHP combined with GIS technology to assess landslide susceptibility in the region. Although these methods can analyze and calculate the risk and susceptibility of landslides, the assessment process is somewhat subjective. The precision and accuracy of the assessment results cannot be guaranteed in some cases, and the information provided by the assessment results is limited.
Han et al. [11] used the Monte Carlo method to calculate the stability of a slope and completed the risk assessment of the landslide by combining the vulnerability and location distribution of the disaster-bearing bodies. This type of method requires more precision in landslide risk assessment and can obtain relatively specific and accurate assessment results. However, the assessment process is complicated, the calculation workload is large, and a large amount of sample data must be collected to support the accuracy of the assessment results.
Landslide risk is determined by the possibility of landslide occurrence and the consequences of landslides [12,13]. Analysis of the possibility of landslide occurrence is the basis for landslide risk assessment. Landslide possibilities can be assessed using qualitative and quantitative methods. Qualitative methods are mainly based on the statistics of historical landslides and the experience of experts to judge the possibility of landslide occurrence and the degree of landslide hazard [14,15,16,17]. The methods are generally applicable to regional landslide risk assessment. The assessment process is used to analyze the geological and environmental conditions of known landslides, identify some key impact factors affecting landslide occurrence, determine the weights of the impact factors through mathematical models such as AHP and the logistic regression model, and perform weighted overlay with them to obtain the possibility level of landslide occurrence in the region [18,19,20]. However, the methods are empirical and subjective to a certain degree.
In contrast, quantitative methods are mainly used to quantify the possibility of landslide occurrence through methods such as the limit equilibrium method, numerical simulation method, and reliability method, which generally apply to individual landslide risk assessment. The limit equilibrium method [21,22] and numerical simulation method [23,24] give the sliding surface and stability factor of the slope by calculation. The reliability method gives the reliability index and failure probability of the slope by calculation [25,26,27]. These methods are less subjective and more precise and consider the destabilizing mechanism of the landslide itself.
The commonly used quantitative methods are probability-based reliability methods, which characterize the possibility of landslide occurrence by the failure probability of a slope. These methods require a large amount of sample data of geotechnical parameters for their calculations and assume the probability distribution type of parameters after statistical analysis, followed by the application of reliability methods (e.g., first-order second-moment, Monte Carlo, Rosenblueth, and stochastic finite element methods) to calculate the failure probability of a slope. The calculation results of these methods are significantly affected by the assumed probability distribution type of parameters and the truncated function of the probability distribution function [28,29]. Thus, a certain degree of uncertainty exists, which causes uncertainty in the landslide risk assessment results.
The non-probability reliability method based on the convex model can compensate for the shortcomings of probability reliability methods and evaluate slope stability without assuming the probability distribution type and distribution function of geotechnical parameters; additionally, the non-probabilistic reliability index and failure value of the slope can be provided [30,31]. Presently, research on the non-probabilistic reliability analysis of slopes is scarce, and studies on the application of non-probabilistic reliability methods in landslide risk assessment are lacking. Liao et al. [32], Han et al. [11], Wei [33], and Sui et al. [34] all used similar quantitative risk assessment methods to analyze and calculate the risk of landslides. Considering the influence factors of rainfall and seismic activity, they analyzed the stability of the slope by using the probability reliability method and calculated the final risk values of the landslide by combining the vulnerability calculation of the disaster-bearing bodies. Considering the advantages of the non-probabilistic reliability method, this paper improves and innovates the recent similar evaluation methods and applies them to the risk assessment of landslides.
To bridge this gap in the literature, this study proposed a method for risk assessment of individual landslides based on non-probabilistic reliability theory. The method calculated the failure value of the slope by non-probabilistic reliability analysis; predicted the influence range of the landslide using empirical formulas; and calculated the landslide risk values by combining space–time distribution, vulnerability, and the number of disaster-bearing bodies. The personnel life and economic risk judgment criteria of geological disasters were established for a region based on local geological disaster data and the economic development level. Moreover, the landslide risk values were compared with the risk judgment criteria to determine whether the landslide risk was acceptable.
The novelty of this study is that a non-probabilistic reliability method was used for the first time for the quantitative risk assessment of landslides, which completed the stability analysis of slopes with less sample data and workload. The calculation results of the non-probabilistic reliability method were consistent with those of the probabilistic reliability method, which is currently the more mainstream method. Moreover, the rainfall influence factor was taken into account in the non-probabilistic reliability calculation of slopes, which made the calculation results more in line with reality and extended the use of the non-probabilistic reliability method to slope stability analysis. Finally, in this paper, the method and steps of landslide risk assessment were more refined, the interaction relationship between the landslide and the disaster-bearing bodies was fully considered, and a set of systematic risk assessment methods for individual landslides was proposed, which provided a new idea and method for landslide risk assessment.

2. Methods

The risk from landslides is related to the possibility of landslide occurrence, space–time distribution (personnel or economic property), vulnerability, and the number of disaster-bearing bodies [34,35]. The greater the possibility of landslide occurrence, the greater the landslide risk, and the possibility of landslide occurrence is calculated by the non-probabilistic reliability method. The space–time distribution refers to the location of the disaster-bearing body and the possibility of being in a specific location, which is related to the influence range of the landslide and determines the space–time distribution probability of the disaster-bearing body. Vulnerability refers to the extent of damage to the disaster-bearing body affected by the landslide and is related to the properties of the landslide and the disaster-bearing body. Moreover, the number of disaster-bearing bodies is also a key factor in determining the level of landslide risk, where the greater the number is, the greater the risk. The specific steps of the landslide risk assessment method proposed in this study are shown in Figure 1.

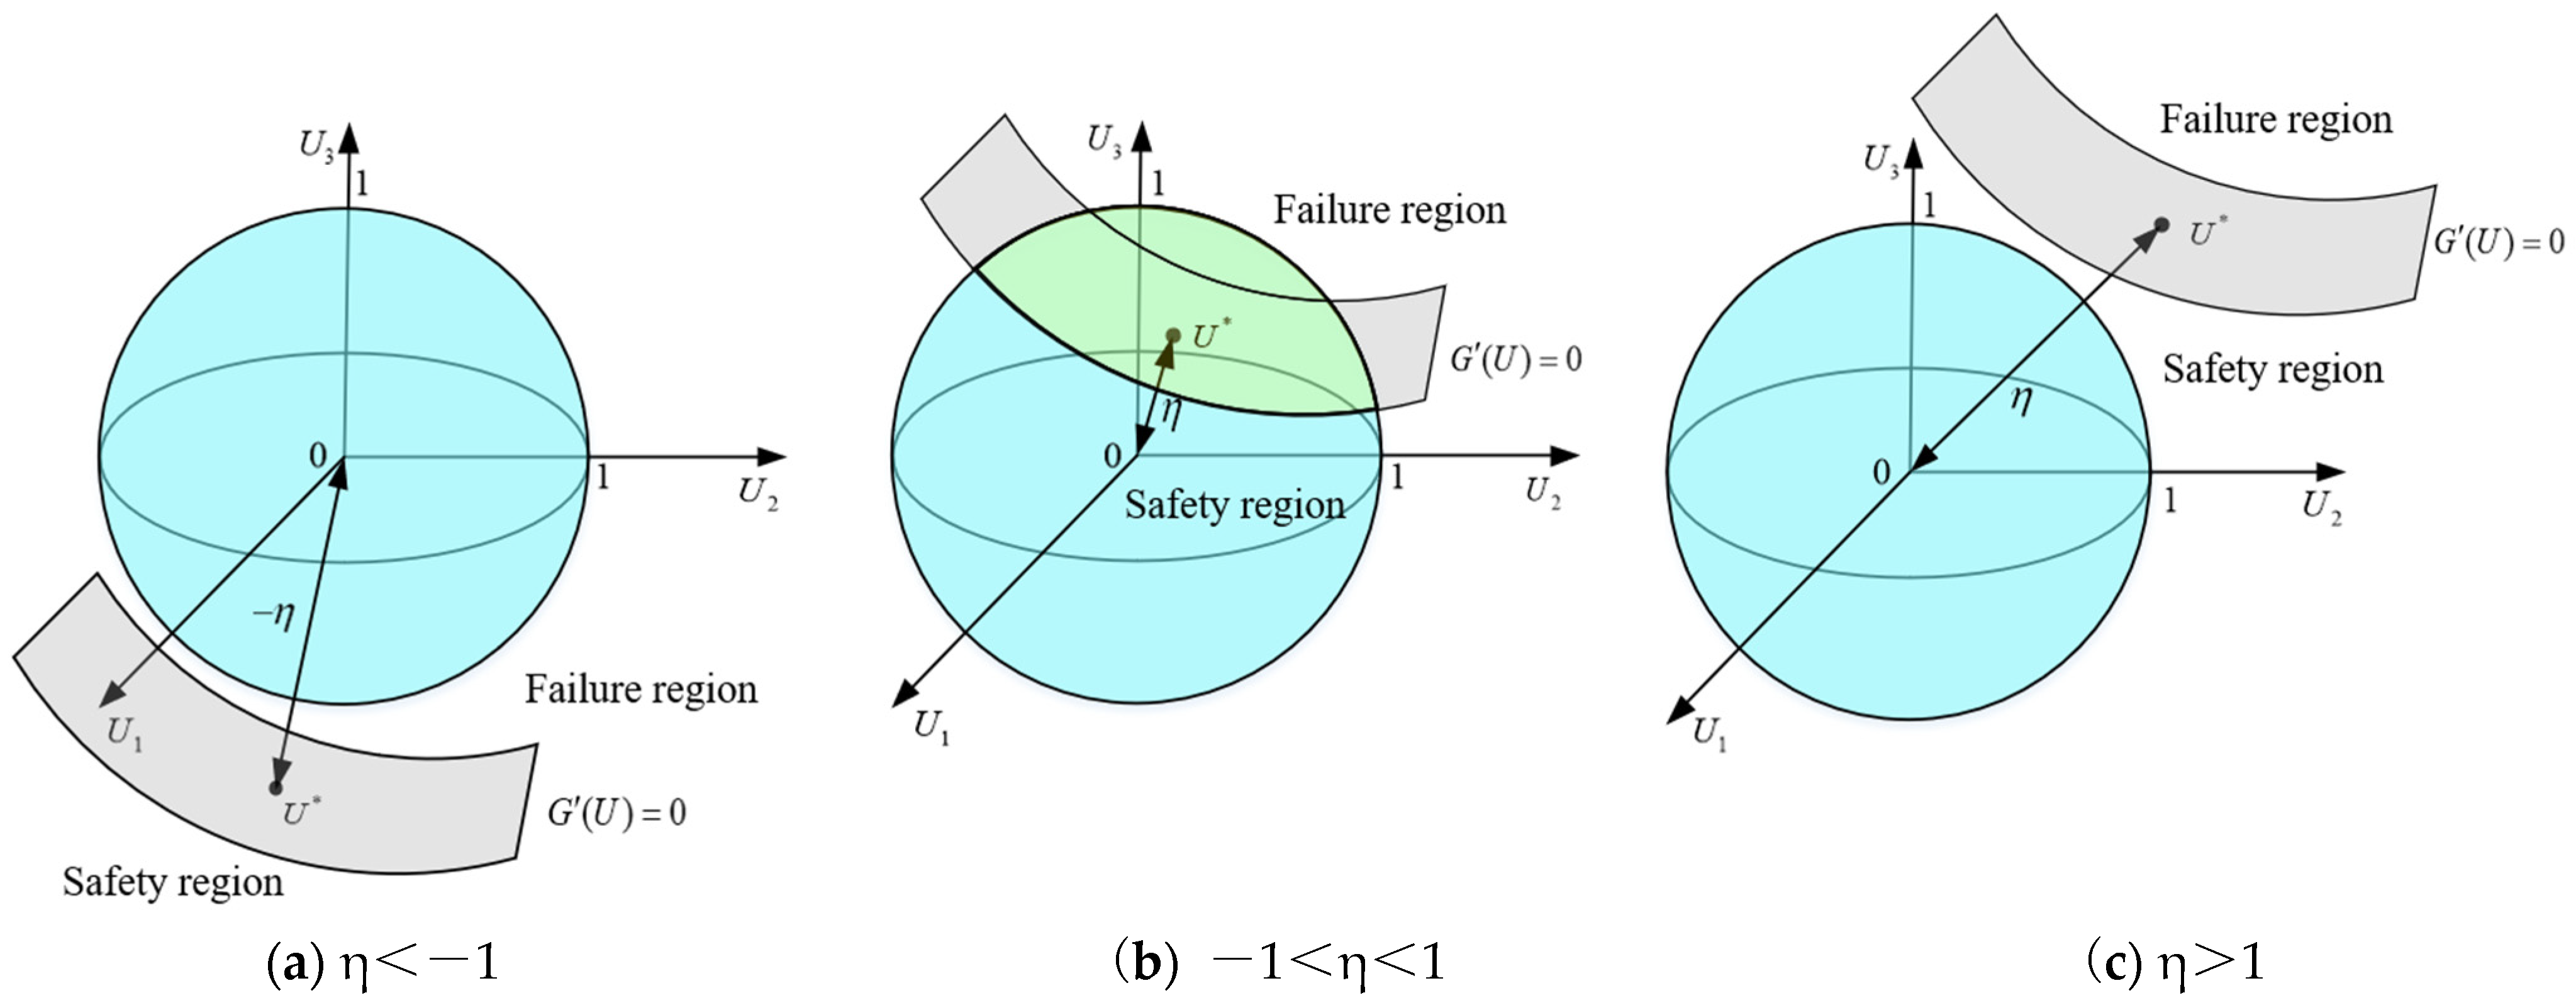
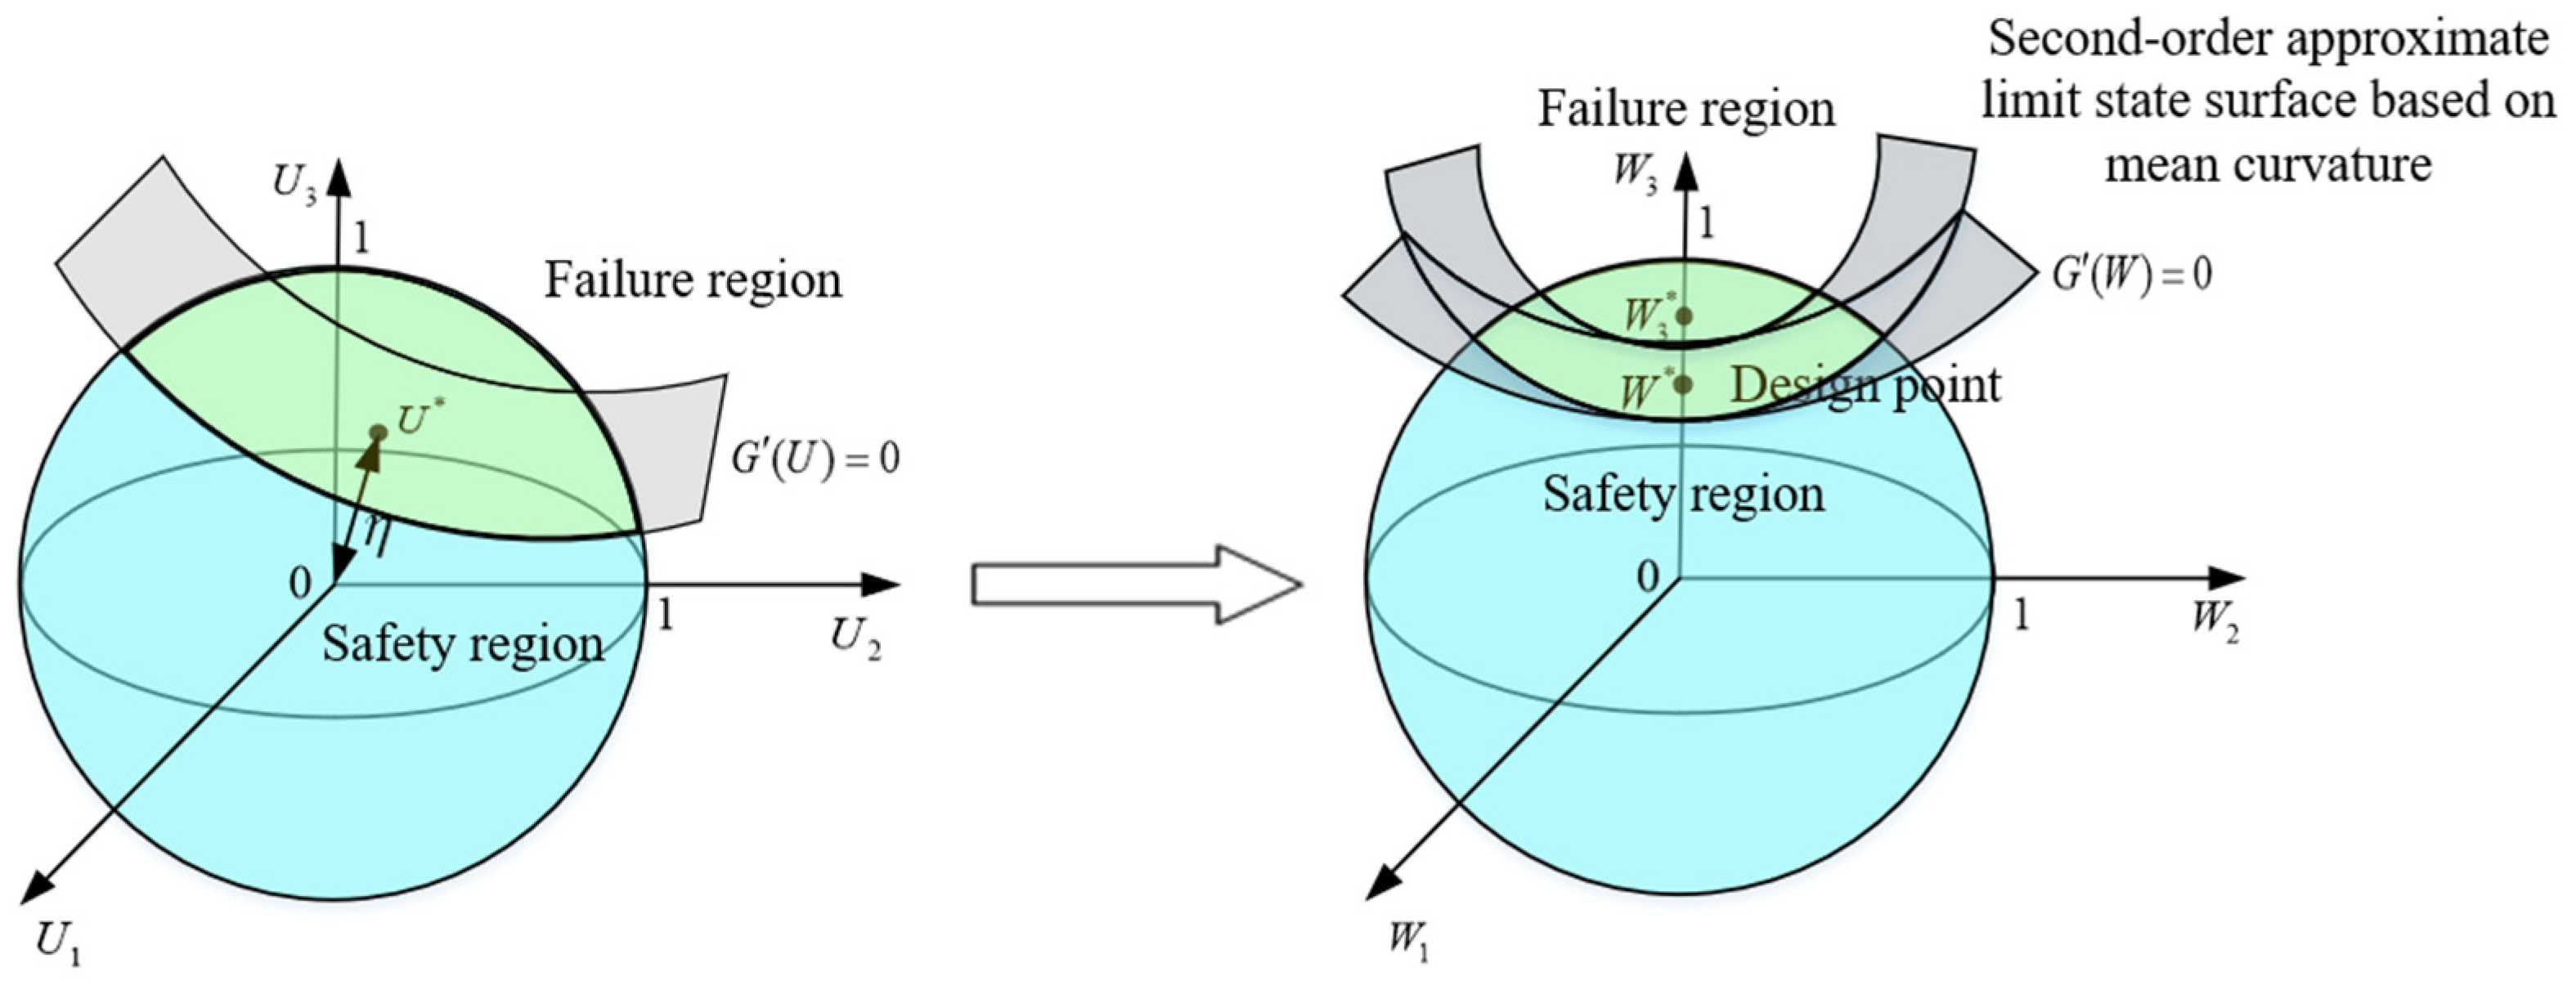
2.1. Possibility of Landslide Occurrence

The non-probabilistic reliability method needs relatively less parameter information to obtain the slope stability analysis results considering uncertain factors, and the calculation process is relatively simple. The possibility of landslide occurrence assessed using the non-probabilistic reliability method is characterized by the failure value of the slope F D , which is calculated in the following section using the non-probabilistic reliability method based on an ellipsoidal model.
Multiple interval numbers can be generated by uncertain factors affecting slope stability, an n-dimensional hyper-cube in space can be formed from n uncertainty interval variables, X 1 , X 2 , …, X n , that affect slope stability, and the endpoints of this hyper-cube in the ith (i = 1, 2, …, n) dimension are X i m i n and X i m a x ( X i m i n and X i m a x are the minimum and maximum values of the interval variable X i , respectively). An ellipsoidal model can be constructed by determining the minimum outer hyper-ellipsoid of this hyper-cube.
The midpoint C i and radius R i of the ellipsoidal model in the ith (i = 1, 2, …, n) dimension are given as follows:
C i = ( X i m i n + X i m a x ) / 2
R i = n ( X i m a x X i m i n ) / 2
The covariance matrix of the ellipsoidal model is:
ρ = R 1 2 0 0 R n 2
The constructed ellipsoidal model can be expressed as follows:
E X = X X C T ρ 1 X C 1
where X = X 1 , X 2 , , X n and C = C 1 , C 2 , , C n .
Various uncertain parameters generally have different orders of magnitude, which may cause the morbid state of the characteristic matrix of the ellipsoid model, thus affecting the calculation results. Therefore, it is necessary to standardize the ellipsoid model. Let the standardized variables U = U 1 , U 2 , , U 3 in the standard vector space be:
U = 1 R 1 0 0 1 R n X C
The transformation of the uncertainty interval variables from the original space to the standard vector space was accomplished using the following equation:
X = R 1 0 0 R n U + C
The ellipsoidal model in Equation (4) is transformed into a unit hypersphere in the standard vector space as follows:
E U = U U T U 1
After constructing the approximate structure performance function G ( X ) = G ( X 1 , X 2 , , X n ) of the slope using the response surface method [36,37], the standardized approximate structure performance function G ( U ) = G ( U 1 , U 2 , U n ) can be obtained using the above method.
In the non-probabilistic reliability method, the non-probabilistic reliability index η is defined as the shortest distance from the origin to the limit state surface in the standard vector space, and its value can be obtained by solving the following equation by the HL–RF iterative algorithm [38,39]:
η = sgn G 0 m i n U s . t .   G U = 0
where s g n is the symbolic function. When G 0 > 0 , return 1; when G 0 = 0 , return 0; and when   G 0 < 0 , return −1.
As shown in Figure 2, for a unit sphere in the standard vector space E U ( E U represents the uncertainty region composed of an n-dimensional standardized variable U), the failure value is defined as the volume ratio of the sphere in the failure region to the volume of the entire sphere. When the non-probabilistic reliability index is 1 η 1 , part of the sphere is in the failure region, and there is a certain possibility that a landslide will occur. Subsequently, the failure value can be calculated using the following equation [40,41]:
F D 1 s g n W n * 2 + s g n W n * 2 I 1 W n * 2 n + 1 2 , 1 2 + κ * n + 1 1 B n + 1 2 , 1 2 1 W n * 2 n + 1 2
where κ * is the average curvature obtained by the Taylor expansion of the limit state function in the standard vector space to the quadratic term at the design point U * ; W n * is the corresponding value of the feature plane position in space W, which is transformed from the standard vector space U (as shown in Figure 3, the space transformation here is for the convenience of solving the integrals); B , is the Beta function; and I , is the Beta function with incomplete regularization.
When using the failure value F D obtained from Equation (9) as the possibility of landslide occurrence, if the calculated failure value of the slope corresponds to the natural state, no conversion is required. If the calculated failure value of the slope results from the action of rainfall or an earthquake, it is necessary to consider the recurrence period of the rainfall or earthquake necessary, and the failure value calculated using Equation (9) should be divided by the return period to obtain the annual failure value of the slope [42].

2.2. Space–Time Distribution Probability of Disaster-Bearing Bodies

The space distribution probability of disaster-bearing bodies is the possibility of a landslide reaching the location of disaster-bearing bodies when the slope is unstable. Its value is related to the hazard range of landslides and the location of the disaster-bearing bodies. The hazard range of landslides can be estimated using physical modeling tests, numerical simulations, and empirical formulas. After obtaining the potential hazard range of landslides, the space distribution probability of disaster-bearing bodies can be analyzed according to their location. The space distribution probability of disaster-bearing bodies within and outside the hazard range of landslides is 1 and 0, respectively [33,43].
The time distribution probability of disaster-bearing bodies is the possibility that they are located within a specific position of the landslide hazard range when the slope is unstable. The time distribution probabilities of disaster-bearing bodies are related to their movements and activity patterns. For buildings and other static disaster-bearing bodies (with fixed positions), their time distribution probability is 1, whereas the positions of mobile disaster-bearing bodies, such as personnel and animals, may change at any time. Determining their activity pattern and calculating their time distribution probability requires the ratio of the time they spend within a position of the landslide hazard range to the total time over a period [44].

2.3. Vulnerability of Disaster-Bearing Bodies

The vulnerability of disaster-bearing bodies refers to the extent of possible damage to the disaster-bearing bodies when the slope collapses, and it is quantified by a value ranging between 0 and 1 [45,46,47,48]. For buildings, 0 represents intact and 1 represents complete damage, whereas, for personnel, 0 represents no injury, and 1 represents death.
When a landslide occurs, the vulnerability of a building V E is determined by the landslide intensity (which can be expressed by the impact force of the landslide body, I 1 ) and building resistance (which can be expressed by the overall shear resistance of a building, Q ), which can be calculated using the following equation [49]:
V E = I 1 / Q ,   I 1 < Q 1 ,   I 1 Q
I 1 = m 2 g h f h / tan θ f Y
where m is the mass of the landslide body, h is the centroid height of the landslide body, g is the acceleration due to gravity, Y is the distance of the building from the toe of the slope, f is the friction coefficient of the sliding path, and θ is the slope angle. The calculation methods for the overall shear resistance Q of several major building types can be found [50].
When a landslide occurs, the vulnerability of indoor personnel V P 1 is related to the damage degree of the building, as follows [51]:
V P 1 = 0.001 × e ( β × V E )
where β is the value coefficient, which is 6.1, 6, 5.9, 5.75, and 5.5 for masonry, reinforced concrete, steel, frame, and timber structures, respectively.
The vulnerability of outdoor personnel V P 2 is related to the intensity of landslide action on the personnel I 2 and the susceptibility of the personnel to landslides S , and can be calculated using the following vulnerability evaluation model [51]:
V P 2 = I 2 / 1 S 2 / 2     I 2 1 S 1 1 I 2 / S 2 / 2     I 2 > 1 S
I 2 and S can be calculated by following equations [51]:
I 2 = 1 1 I v e l 1 I d e p 1 I w i d
S = 1 1 S h e l 1 S a g e 1 S w a r
where I v e l is the impact speed index of the landslide body, calculated according to Equation (16); I d e p and I w i d are the impact depth index and the impact width index of the landslide body, respectively, and the values can be found in Table 1 and Table 2, respectivley; S h e l is the health status index of the personnel, and the value can be found in Table 3; S a g e is the age level index of the personnel, and it can be calculated according to Equation (17); and S w a r is the index of the local disaster warning level, and the value can be found in Table 4 [51].
I v e l = 0   v 5 × 10 1 l n v / 9 + 0.3 2   5 × 10 1 < v < 5 × 10 3   1   v 5 × 10 3
where v is the sliding velocity of the landslide body (mm/s).
S a g e = 3 × 10 4 a 2 0.02 a + 0.37
where a is the age of the personnel. The age level index value of each age group can be calculated first, and then the total age level index value can be obtained by combining the proportion of the number of people at each age level.

2.4. Calculation of Landslide Risk

Quantitatively estimating the indirect losses caused by a landslide is difficult; therefore, the main consideration here is the direct losses to personnel and economic property. Personnel life and economic risks can be calculated using the following formulas [52,53]:
R P = F D × P S P × P T P × V P × N P
R E = F D × P S E × P T E × V E × N E
where R P and R E are the values of the personnel life risk (persons/year) and economic risk (CNY/year) caused by landslides, respectively; P S P is the space distribution probability of the personnel; P S E is the space distribution probability of the disaster-bearing bodies belonging to the category of economic property;   P T P is the time distribution probability of the personnel; P T E is the time distribution probability of the disaster-bearing bodies belonging to the category of economic property; V P is the vulnerability of the personnel; V E is the vulnerability of the disaster-bearing bodies belonging to the category of economic property; N P is the number of persons potentially exposed to landslide hazards; and N E is the value (CNY) of the disaster-bearing bodies belonging to the category of economic property potentially exposed to landslide hazards.
Equations (18) and (19) are commonly used formulas for calculating landslide risk, which, respectively, calculate the personnel life risk value and the economic risk value, providing more accurate quantitative results. The values of personnel life risk, when indoor and outdoor, are calculated separately and summed to obtain the total personnel life risk. Additionally, some disaster-bearing bodies may have different space distribution probabilities, time distribution probabilities, and vulnerabilities. Therefore, the risk value should be calculated for each disaster-bearing body separately and summed to obtain the final total risk value of the landslide.

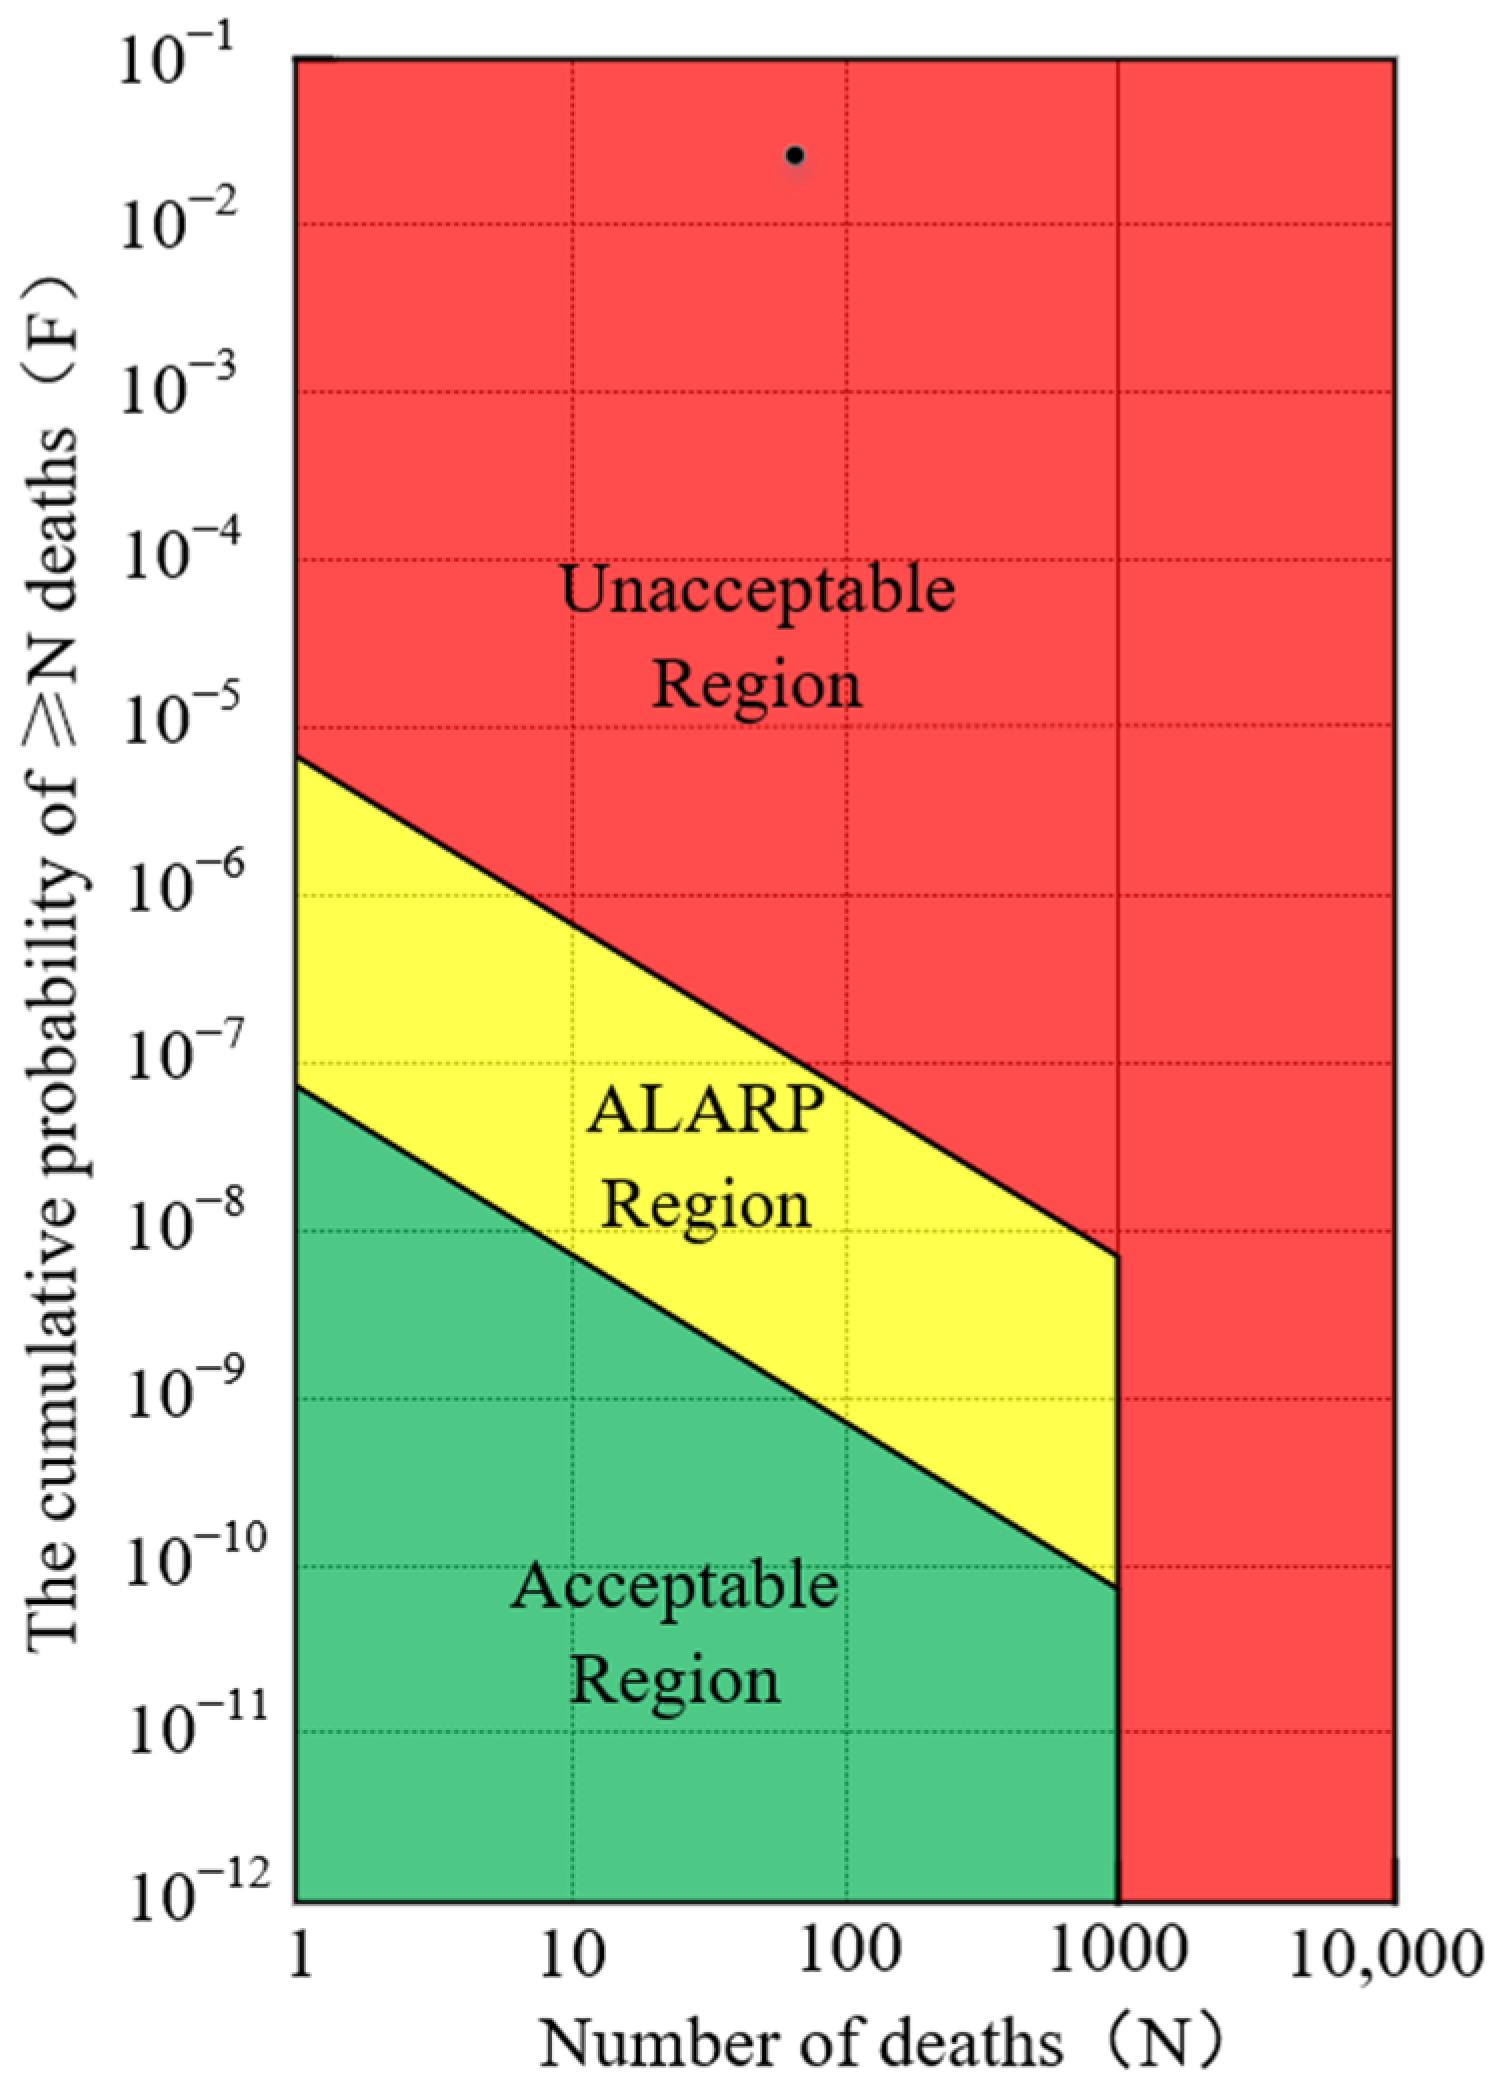
2.5. Risk Judgment of Landslide

After calculating risk values using Equations (18) and (19), the values need to be compared with the regional risk judgment criteria for geological disasters in the area to determine whether the landslide risk is within the acceptable range. If unacceptable, measures should be taken to improve the stability of slopes or implement measures to enhance the disaster-resistant capacity of disaster-bearing bodies, such as relocation and improving the disaster emergency response capacity, thereby reducing the landslide risk to an acceptable level.
For the personnel life risk, both individual and societal risk judgment criteria must be met for the personnel life risk to be considered acceptable. The following introduces the method for constructing personnel life risk judgment criteria in a given area. First, statistical data are collected on the total population, the population threatened by geological disasters, and the number of deaths due to geological disasters in the region over several years, and the mortality rate of geological disasters for the total population and population threatened by geological disasters is calculated for each year. Second, the median mortality rate of geological disasters for the total population is found in all years as the base value of the maximum acceptable risk, and the median mortality rate of geological disasters for the population threatened by geological disasters in all years is taken as the base value of the maximum tolerable risk. Then, we consider factors such as the local development level and degree of importance attached to disasters to adjust the base values appropriately, obtaining the final maximum acceptable risk value of the individual C 1 and the final maximum tolerable risk value of the individual C 2 . Thus, individual risk judgment criteria are established. Finally, the number of deaths N is used as the horizontal coordinate and the cumulative probability of ≥ N deaths as the vertical coordinate. Based on the national conditions of the country, the limit line of maximum acceptable risk and maximum tolerable risk are obtained according to F 1 = C 1 / N and F 2 = C 2 / N , respectively. The societal risk judgment criteria are then established and can be expressed by the F–N curve.
The economic risk judgment criteria can generally be formulated using the gain–loss ratio method, which is determined comprehensively according to the average annual disaster losses and annual per capita income levels of the region. These criteria can also be determined by combining the local economic development level and resources available for regional disaster prevention and mitigation.
After conducting the risk judgment of the landslide, the risk assessment process is completed. Based on the assessment results, high-risk landslides can be identified. Nearby residents can be evacuated in time to minimize casualties. Measures can be taken to protect infrastructure and private properties to reduce economic losses. This approach helps to reduce the social unrest caused by disasters and enhance public trust in the government. Moreover, the assessment results provide a basis for the government to formulate land use policies and limit development in high-risk landslide areas. The results also help the government to formulate emergency response plans and clarify evacuation routes and rescue resource allocation.

3. Example Analysis

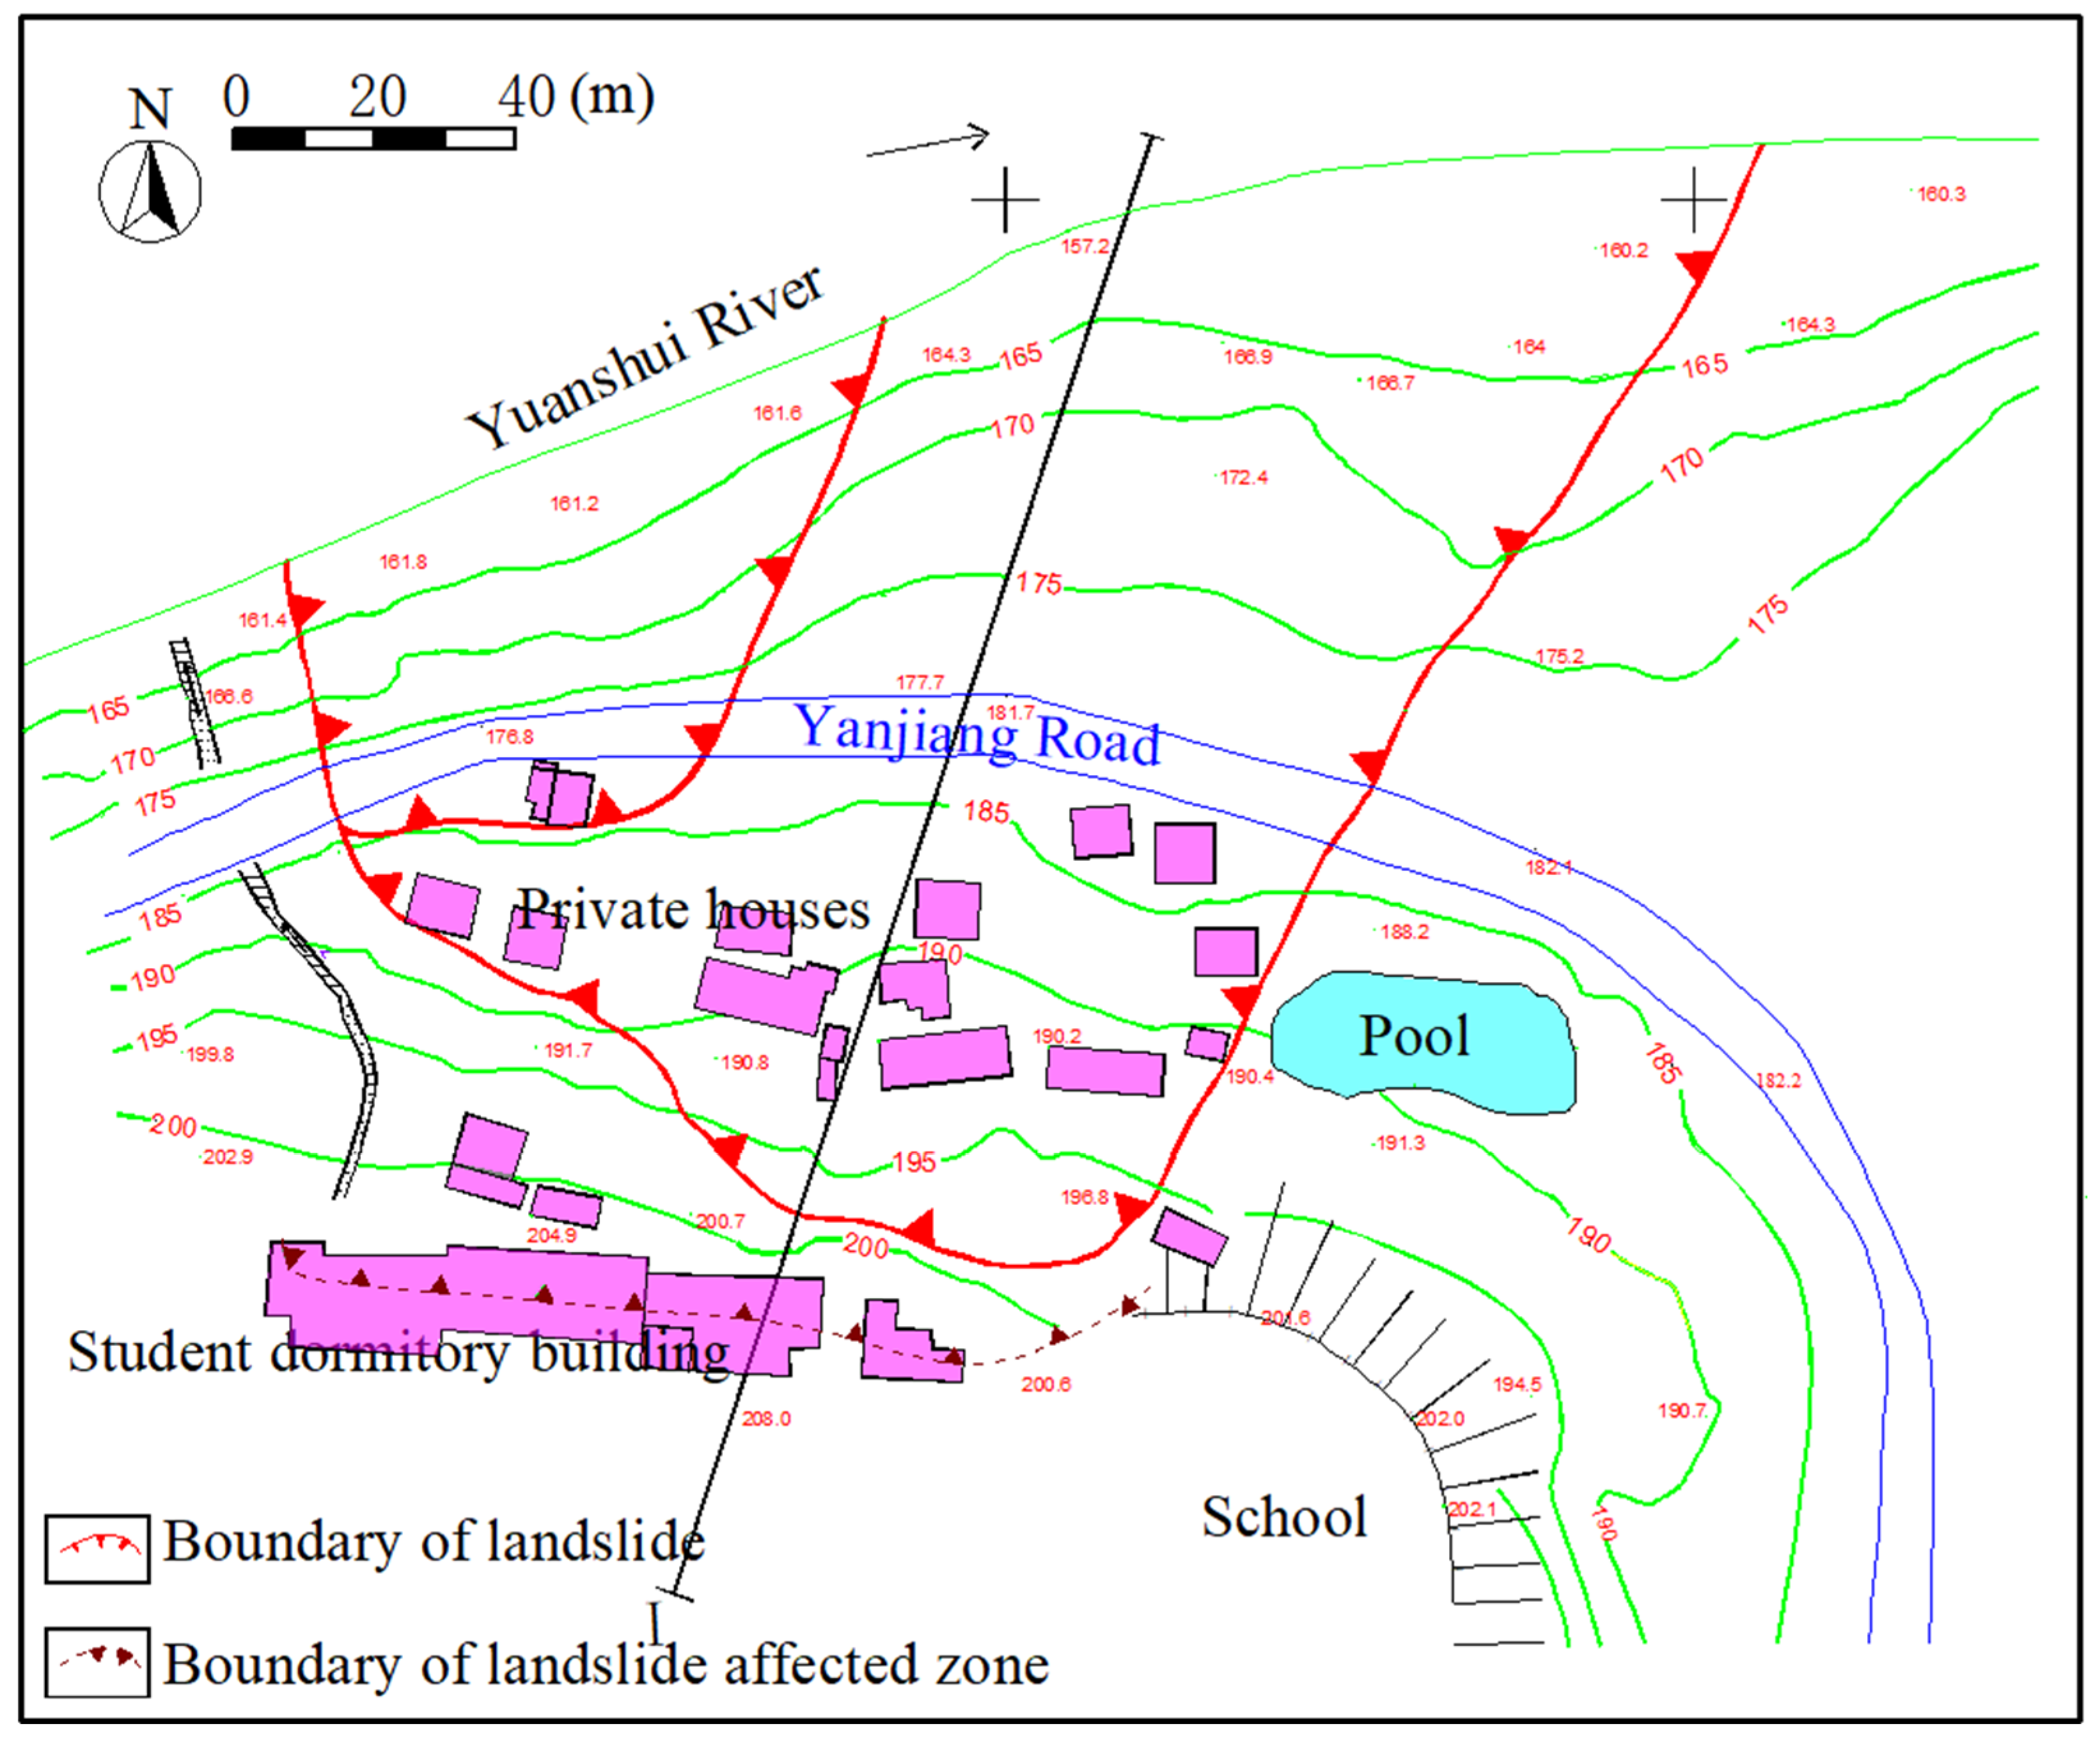
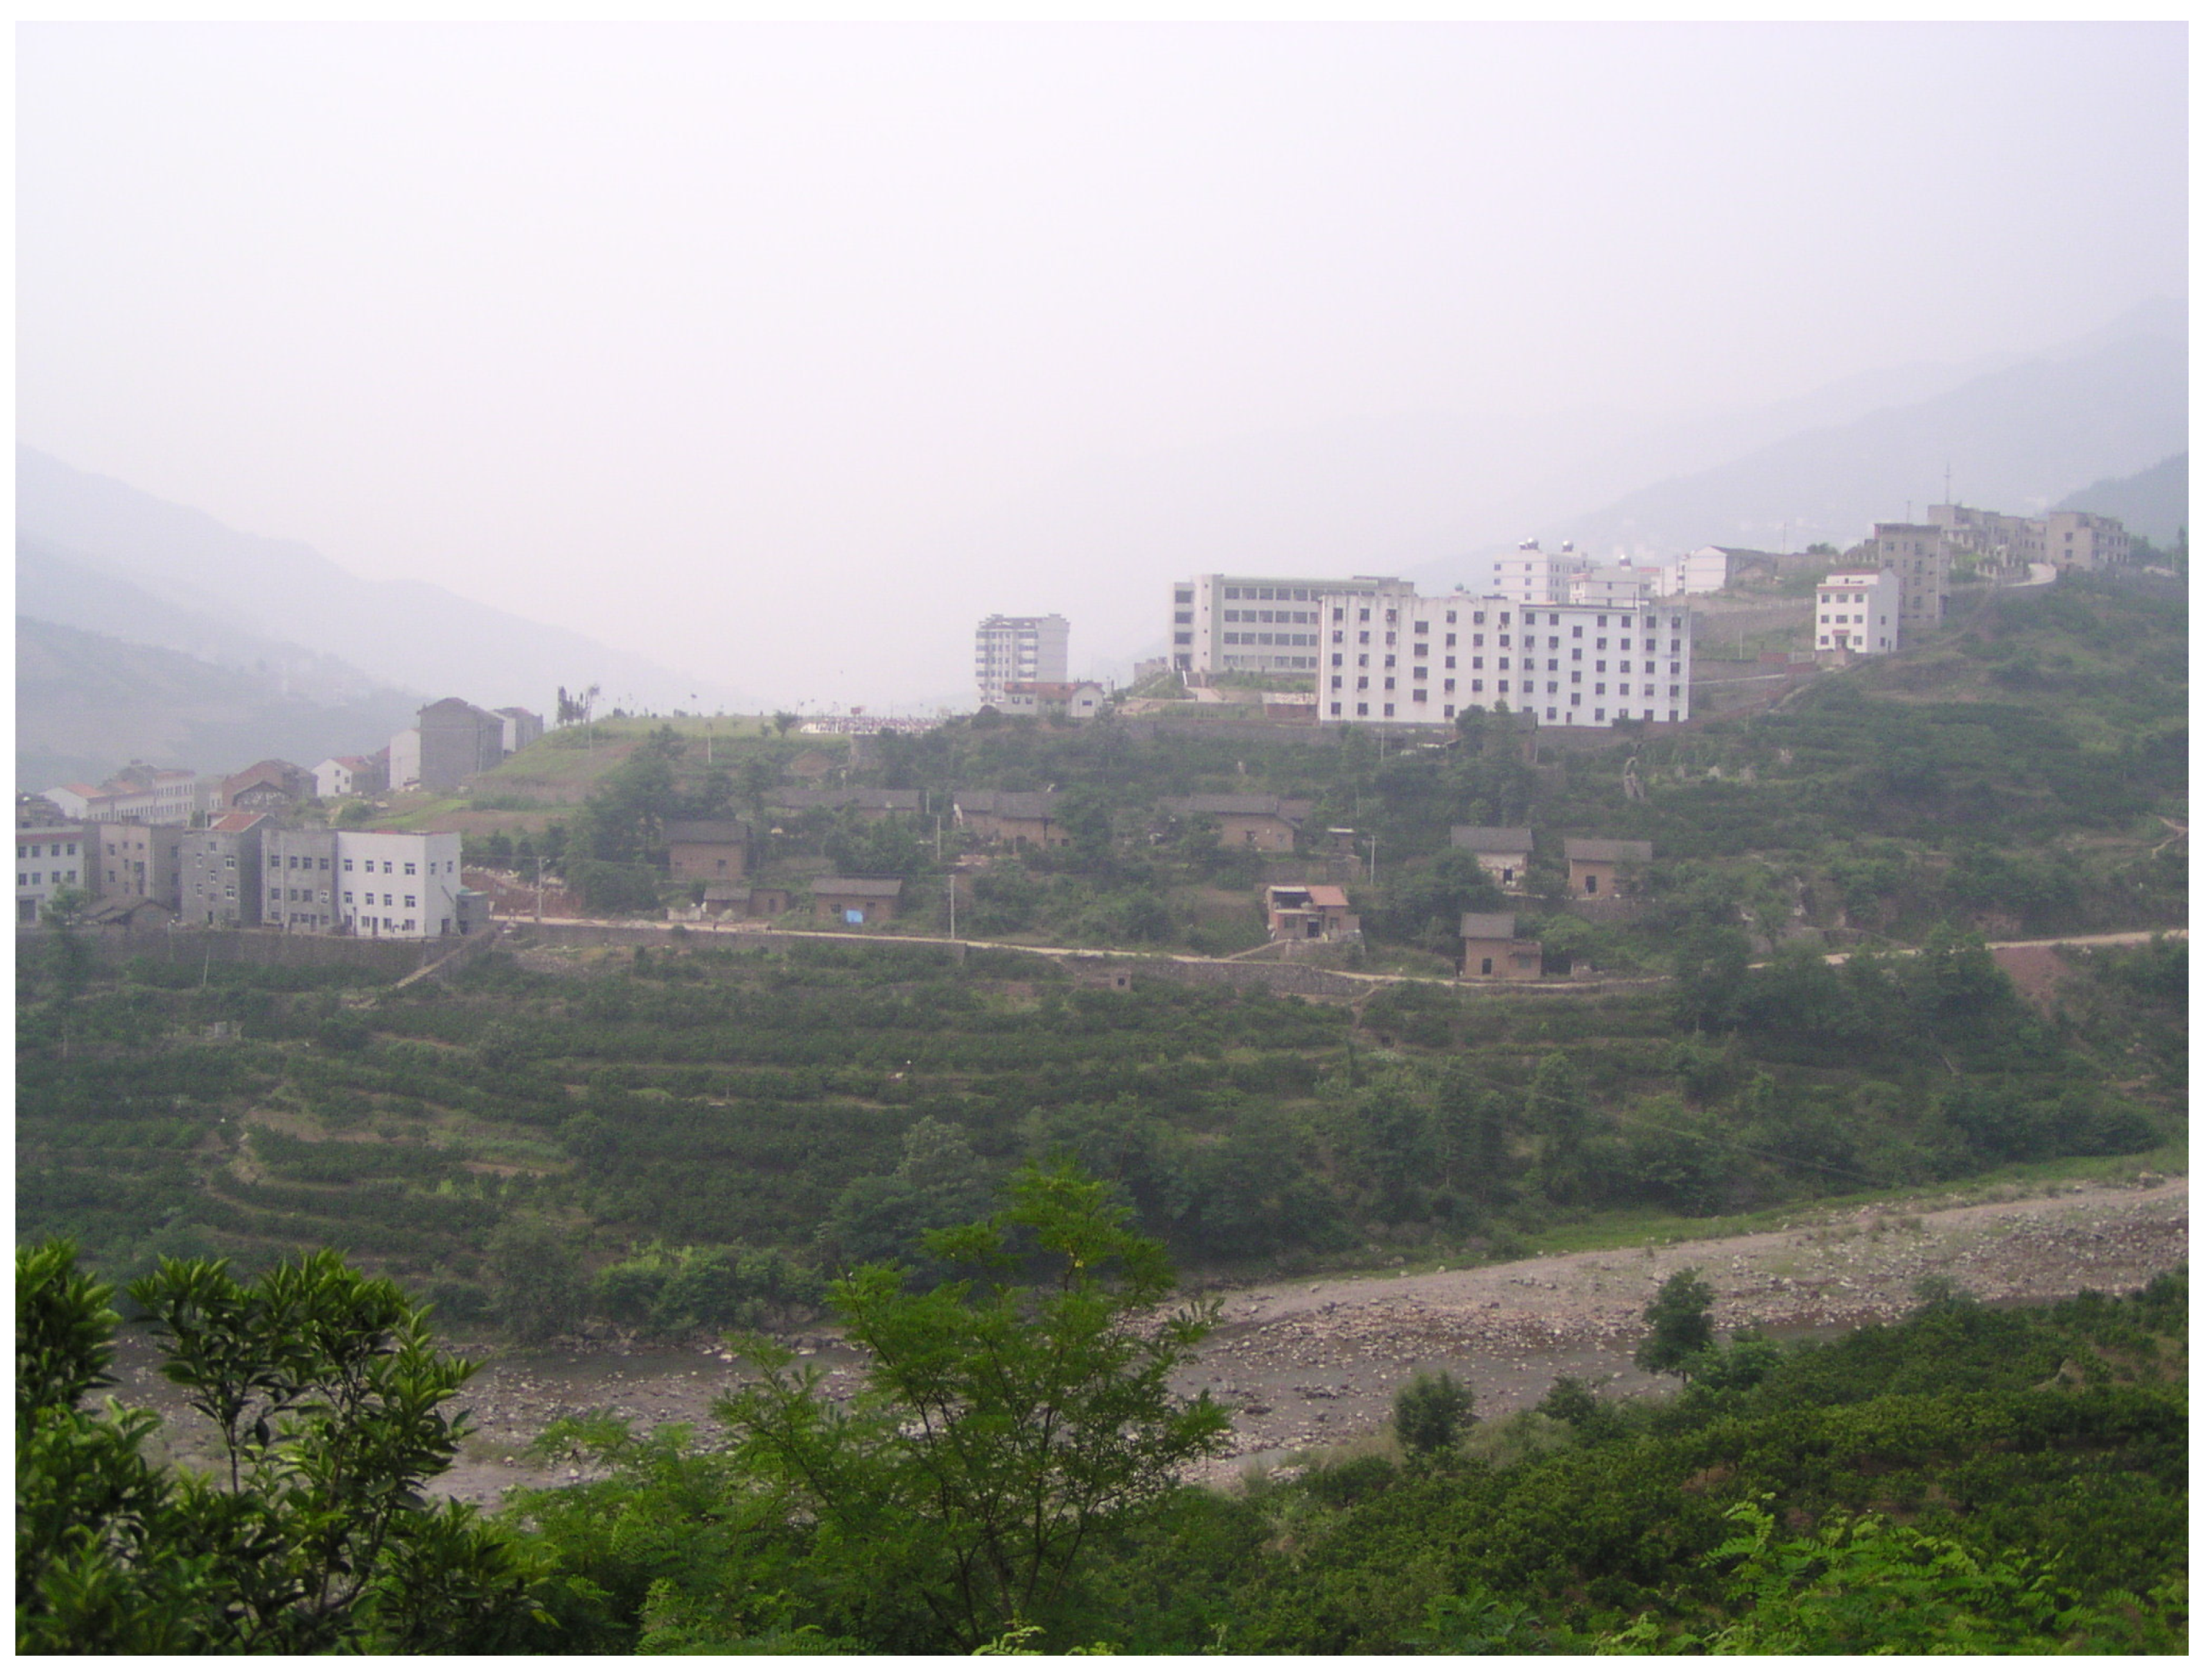
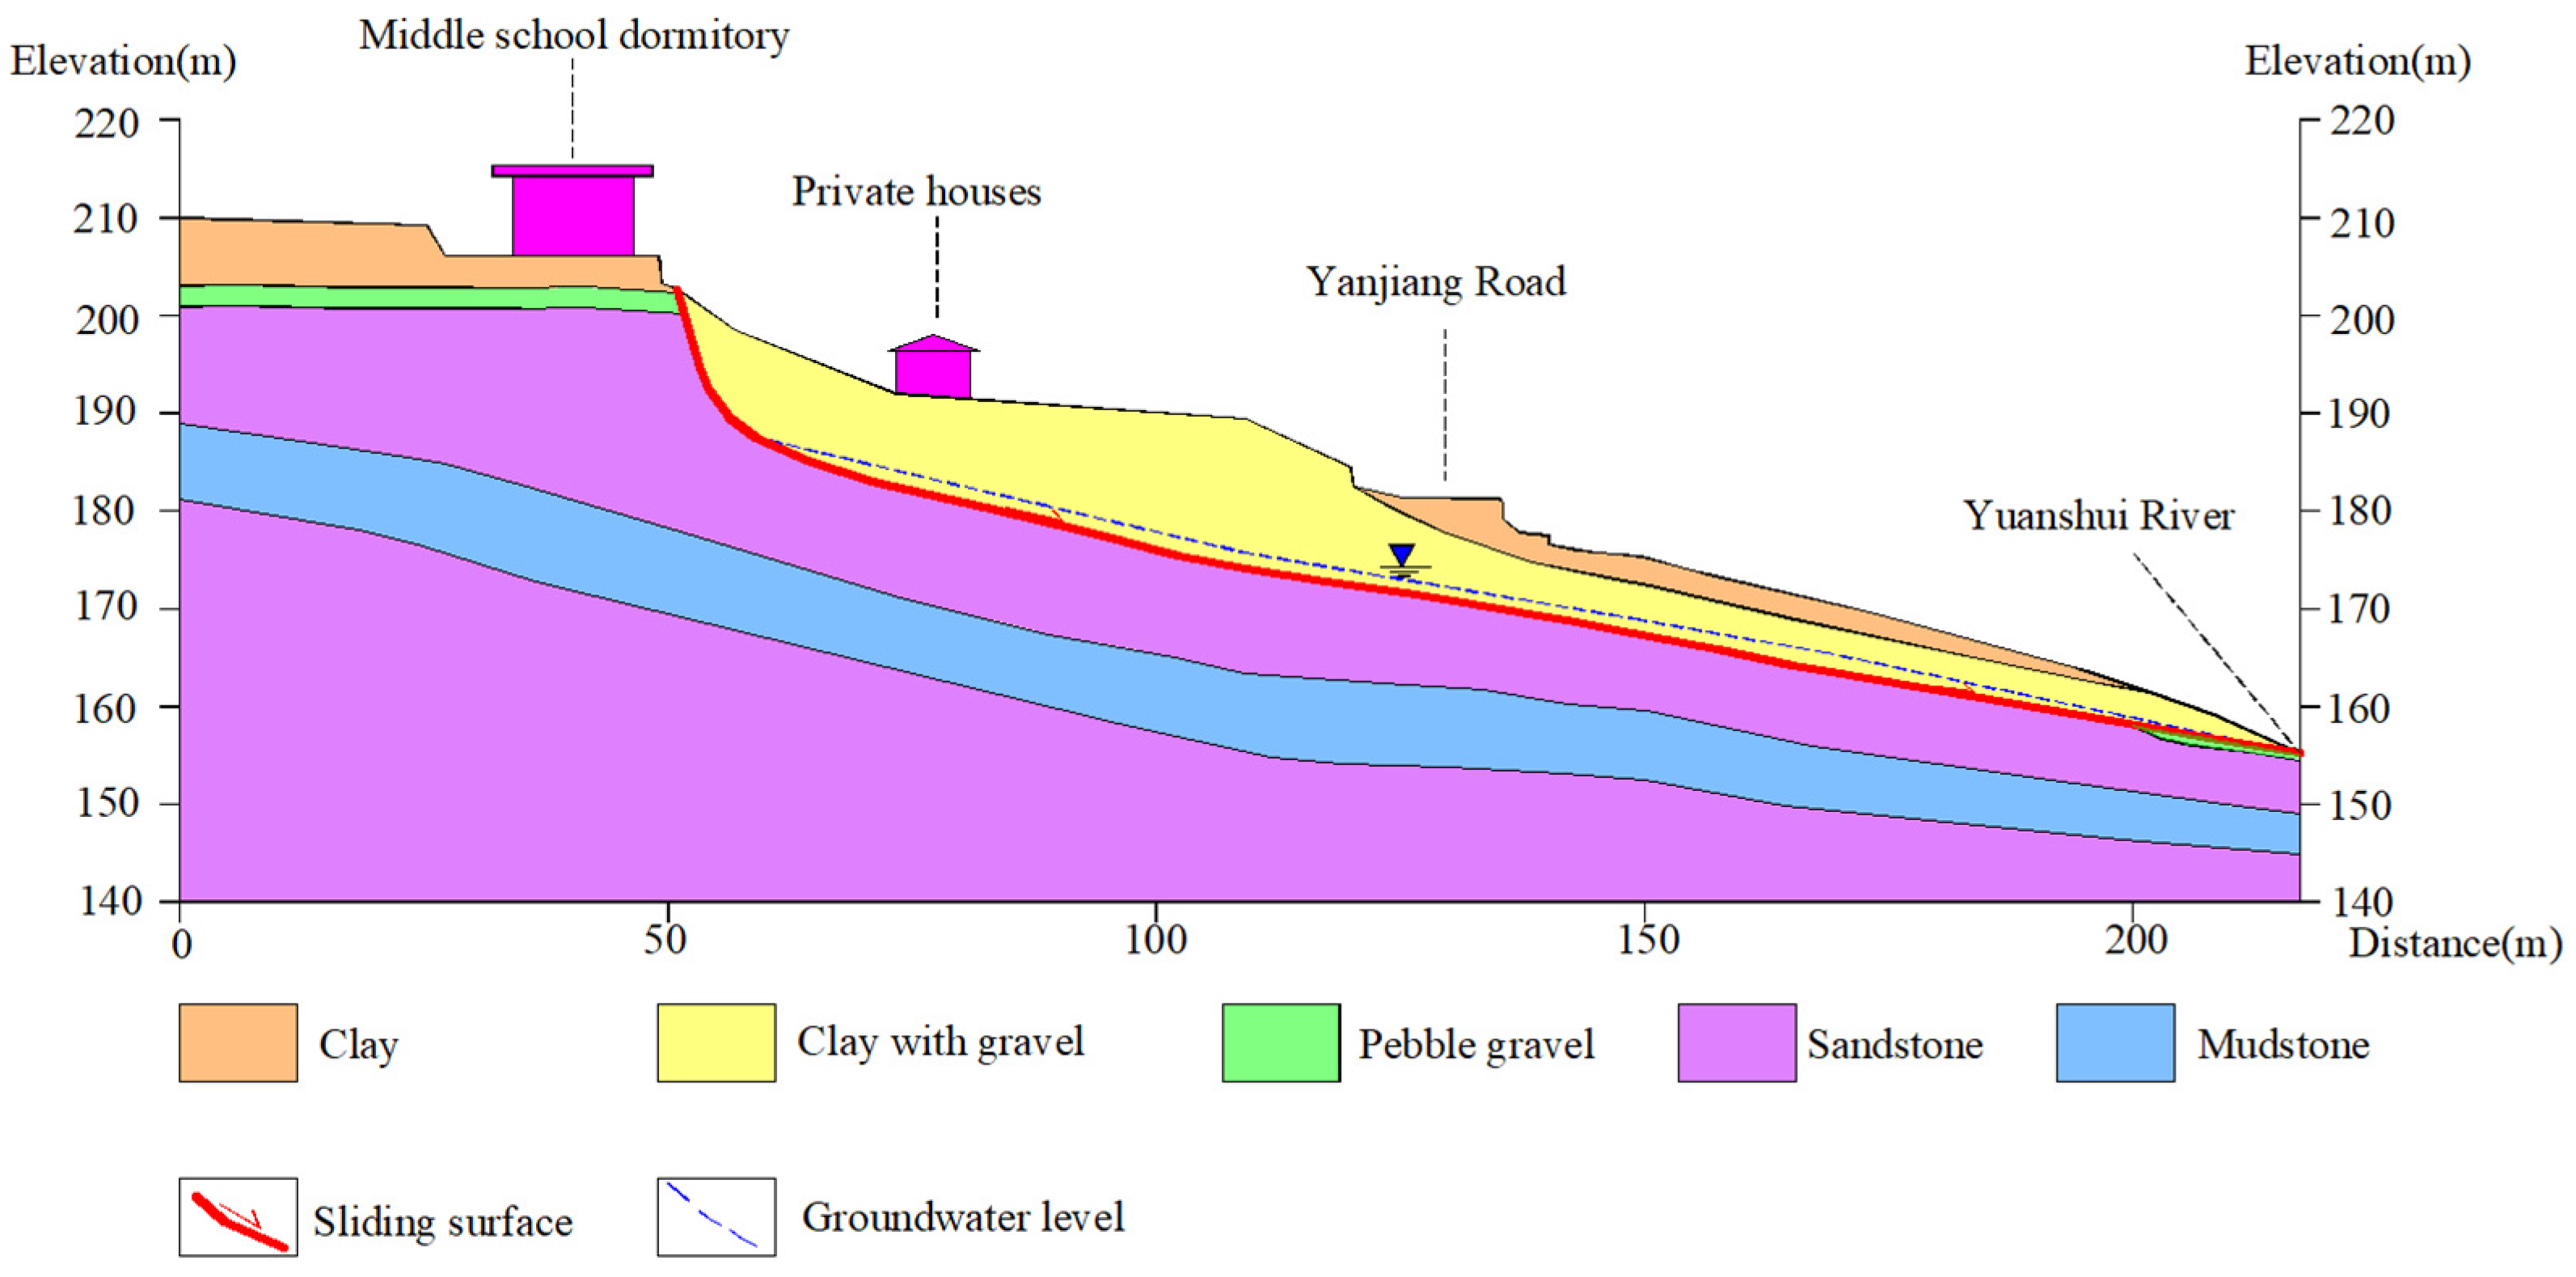
3.1. Study Area and Data

This section takes the 2005 landslide as an example to assess its risk level at that time. The Xiatudiling landslide (Figure 4 and Figure 5) was located on the southern bank of the Yuanshui River in Zigui County, Hubei Province, China. The area has a subtropical climate, with four distinct seasons and abundant rainfall. The average annual temperature was 17–19 °C, with extremes reaching 42 °C and −8.9 °C. The average annual rainfall ranged from 950 to 1590 mm, with the long-term average being 1147 mm. The area is located in the Daba Mountains, with regional elevations typically ranging from 500 to 1100 m. The mountain near the landslide area features higher terrain in the west and lower terrain in the east. The peak elevation of the western mountain is about 500 m, and the Yuanshui River Valley is the lowest point. The landslide occurred on a river bank slope landform. The exposed strata in this area consisted of sandstone, mudstone, and Quaternary deposits from the middle section of Penglaizhen Fm J3. The bedrock comprised sandstone and mudstone from the middle section of Penglaizhen Fm J3. The Yuanshui River, the mainstream of the surface water system in this area, forms the lowest base level of local groundwater discharge. This seasonal river has a length of 52.6 km, drains a basin area of 193.7 km2, and has an average annual runoff of 8.34 m3/s. It is the main source of agricultural and domestic water in this area. A shallow gully that developed in the landslide area marks the eastern boundary of the landslide. When the Three Gorges Reservoir reaches its impoundment level of 175 m, the water level of the Yuanshui River—a branch of the Yangtze River—will correspondingly rise to 175 m. At this stage, the leading edge of the Xiatuling landslide will be completely submerged.
It was an old landslide formed by deposits overlying the bedrock surface. The landslide extended from the hillside’s back edge toward the Yuanshui River. The elevations of the landslide’s front and back edges were approximately 156 m and 205 m, respectively, the width ranged from 70 to 210 m, and the average length was 170 m. The average thickness of the upper landslide body was 14 m, while the average thickness below Yanjiang Road was 7 m, resulting in a total volume of approximately 250,000 m3. The landslide body comprised clay in the surface layer overlying mudstone and sandstone in the middle and lower parts. The sliding zone contained mudstone and clay with pebbled gravel, with a maximum thickness under 1 m and a buried depth ranging from 6.80 to 7.10 m. The basal bedrock consisted of sandstone and mudstone [54,55].
The most severely deformed section, I-I, in the middle of the landslide is shown in Figure 6 [55]. The physical and mechanical parameters of the landslide’s geotechnical materials are listed in Table 5.
The landslide was a bedding bedrock landslide, and the basal sliding surface was mainly controlled by the interface between sandstone and mudstone. There were many joints in the sandstone layer, which could easily lead to groundwater seepage. The accumulation of groundwater could significantly soften the mudstone through physical and chemical processes, affecting its mechanical properties and thereby reducing the stability of the slope. Consequently, groundwater accumulated near the sandstone–mudstone contact interface, which softened the mudstone and decreased the shear strength of the interface, further deteriorating the landslide’s stability. Moreover, the lateral erosion of the Yuanshui River was another key factor contributing to the landslide occurrence, as it reduced the mechanical properties of the slope materials. The historical activity of the landslide can be inferred from the landform and stratigraphic characteristics. The rear sliding surface was steeper, and the frontal sliding surface was gentler, indicating a thrust-type landslide. After the initial sliding of the valley-side slope in the Xiatuling area, it experienced local fragmentation and differential movement. The manifestations of landslide activity were clearly evident. The landslide body showed slight deformation without overall movement. The deformation area and boundary were distinct, as shown in Figure 4. Cracks in residential houses and floors, along with building deformations, were indicators of landslide activity. These were caused by rainfall, riverbank erosion, and human activities. If these conditions persist, the landslide may reactivate. Furthermore, after the Three Gorges Reservoir reaches the 175 m water level, the mid-to-lower section of the landslide would be permanently submerged, severely compromising its stability. There was a high possibility of complete failure, endangering the road, residents, and orchards on the landslide, and potentially affecting the middle-school dormitory located beyond the rear edge of the landslide.

3.2. Risk Assessment

The most severely deformed section, I-I, was selected for analysis. The landslide is located in the Three Gorges Reservoir area, where rainfall is one of the key triggers for landslide occurrence [56]. Rainwater infiltration increases the landslide mass weight and softens the soil, ultimately reducing soil strength. The reservoir water level fluctuates between 145 m and 175 m, and these fluctuations significantly affect landslide stability. Considering both rainfall and reservoir water level changes, their effects on the landslide were incorporated through the reduction in physical and mechanical parameters and soil shear strength in the calculations. According to relevant technical investigation requirements [57], the landslide was water-affected, and the prevention engineering grade was Grade III. Therefore, the main load combinations considered were reservoir water level and rainstorm conditions. The stability analysis was conducted following the working condition combinations specified in the technical investigation requirements. The stability factors, calculated using the Morgenstern–Price method [58] (a limit equilibrium method) for different working conditions, are shown in Table 6. The Xiatudiling landslide had its lowest stability factor under Working Condition 4, which was consequently selected for the landslide risk assessment.
The non-probabilistic method uses deterministic interval arithmetic, which avoids the need for a large number of Monte Carlo simulations or high-dimensional integral calculations required by the probabilistic method. It can significantly shorten the calculation time without generating large-scale random samples and is especially suitable for rapid on-site assessment with limited computing power. The non-probabilistic method directly identifies the key sensitive parameters through the upper and lower bounds of the interval, while the probabilistic method requires repeated probability density function fitting and sampling, complicating the process. In addition, the probabilistic method requires presupposing that the parameters follow a specific distribution (such as a normal distribution), but the parameter distribution may be unknown or difficult to verify in practical engineering. The non-probabilistic method avoids this limitation through the interval model and reduces potential errors resulting from inaccurate distribution assumptions. The non-probabilistic method does not rely on a large amount of historical data or accurate probability distributions and directly processes parameter range data through interval analysis. It is especially suitable for engineering scenarios with uncertain geological parameters and limited monitoring data, such as the Xiatudiling landslide. Therefore, this paper uses the non-probabilistic reliability method to analyze the stability of the Xiatudiling landslide.
In most of the research on slope stability, the variability of cohesion and angle of internal friction has a large effect on slope stability. In contrast, the variability of the other parameters has less of an effect on slope stability and can usually be treated as constants. Therefore, the cohesion and internal friction angle of the landslide body and sliding zone were regarded as uncertain parameters, whereas the density was constant. Here, δ represents the standard deviation of a parameter, calculated as the product of the parameter’s mean value and its coefficient of variation. Following Eurocode standards, uncertainties are accounted for using the 5% fractile. While non-probabilistic methods typically form parameter intervals from sample data, when sample data are not directly applicable, the interval range can be determined based on the 5% fractile by adding and subtracting 1.65 δ from the mean value. Due to the complex environmental conditions in the field, the samples cannot be used directly, and the data in Table 5 are calculated parameters obtained after correction processing. Therefore, the coefficient variation of cohesion and internal friction angle were set to 0.2 and 0.1, respectively. According to the 5% fractile, the values of cohesion and internal friction angle of the landslide body were [20.1,39.9] kPa and [20.04,27.96]°, respectively, and those of cohesion and internal friction angle of the sliding zone were [9.512,18.488] kPa and [13.16,18.44] °, respectively. The influence of rainfall leads to a decrease in rock and soil strength, thus reducing the calculated landslide stability coefficient. In the process of constructing the approximate structural performance function, 20 sampling sets within the parameter intervals were analyzed and the stability coefficient of each sampling combination under rainfall conditions was calculated, yielding an approximate structural performance function that considers rainfall conditions. According to the method described in Section 2.1, the non-probabilistic reliability index of the landslide under the first working condition was −0.0499, and the failure value was calculated as 0.5437 using Equation (9). To verify the accuracy of the non-probabilistic reliability calculation result, the Monte Carlo method was employed for comparison, with one million simulations performed. The failure probability of the landslide under the fourth working condition was 57.65%. The landslide failure value calculated by the non-probabilistic reliability method shows consistency with the failure probability obtained through the probabilistic reliability method. For rainfall working conditions with a 10-year return period, the final annual failure value of the Xiatudiling landslide was calculated as 0.5437/10 = 0.05437. The failure value (0.5437) quantifies the landslide occurrence possibility, equivalent to 54.37% failure probability, providing an intuitive measure of landslide stability. The annual failure value (0.05437), based on the rainfall return period, represents the yearly occurrence possibility. In landslide risk calculations, this stability measure must be converted to annual occurrence possibility for subsequent computations.
The sliding distance of a landslide can be calculated using various methods [59]. Based on the available data and the landslide’s basic characteristics, the following empirical formula was employed to calculate the horizontal sliding distance of the landslide [60]:
log H / L = 0.094 log V + 0.1
where H is the vertical sliding height (the height difference between the leading and trailing edges of the landslide body), L is the horizontal sliding distance of the landslide body, and V is the volume of the landslide body.
The landslide body had a volume of 250,000 m3 and a vertical sliding height of 49 m, resulting in a calculated horizontal sliding distance of 125.2 m. The landslide’s influence range encompassed nearly all disaster-bearing bodies on the landslide. Within this range, the space–time distribution probability was 1 for all disaster-bearing bodies, except personnel, and the space distribution probability was 1 for the personnel. The time distribution probability of the personnel is presented in Table 7.
After a landslide becomes unstable, the landslide body undergoes significant displacements and deformations. Therefore, buildings on the landslide body are not subject to impact force calculations. Based on on-site expert judgment and reference to empirical values from the relevant literature [61], the building vulnerability in this case can be assigned directly. In such a scenario, houses on the landslide body and riverside roads have a vulnerability of 1 (indicating complete damage/collapse). Land and fruit trees may still have extremely little utilization value after being destroyed by the landslide. Their vulnerability can be assigned according to the same method and other literature [62,63], and the vulnerability can be taken as 0.9. Using the sliding speed calculation method, the landslide body was divided into slices, and the speed of each slice was calculated separately [64]. The maximum sliding speed of the landslide body was determined to be 5.26 m/s. Following the methodology outlined in Section 2.3, the vulnerabilities were established as 0.45 for indoor personnel and 1 for outdoor personnel.
The number of people potentially affected by the landslide was 65, and the direct economic losses of the disaster-bearing bodies belonging to the economic property category included CNY 400,000 for a section of Yanjiang Road, CNY 1.2 million for houses, and CNY 2 million for land and orchards. Additionally, the landslide posed potential hazards to three student dormitory buildings at the mountain’s back edge, indirectly affecting approximately 1800 people, with estimated indirect economic losses of CNY 4.5 million due to building damage. However, these indirect impacts were excluded from risk calculations as they fell outside of the landslide’s direct scope.
By substituting the above analysis results into Equations (18) and (19), the personnel life risk and economic risk of the Xiatudiling landslide were calculated (Table 8 and Table 9). The individual risk of personnel was 0.0285, the personnel life risk was 1.8499 persons/year, and the economic risk was CNY 184,858/year. Using the median mortality rates of geological disasters for both the total population and at-risk population in Hubei Province (2004–2021) as baseline values, and by comprehensively considering prevention principles, local economic development levels, and disaster management priorities, we established individual and societal risk judgment criteria. The maximum acceptable individual risk was 1.00 × 10⁻⁷, while the maximum tolerable individual risk was 1.00 × 10⁻⁵. The societal risk judgment criteria for personnel are presented in Figure 7, which defines three regions, as follows: (1) the Unacceptable Region, where risks require mitigation; (2) the Acceptable Region, where no measures are needed; and (3) the ALARP (As Low As Reasonably Practicable) Region, where risks should be minimized. Through the analysis of relevant data, Peng [65] determined the economic risk judgment criteria for the region by examining average annual direct economic losses from geological disasters alongside GDP data from Zigui County and Badong County, while also considering the area’s historical disaster patterns, economic conditions, and social environment. The unacceptable risk was an average annual loss of CNY 100,000, and the acceptable risk was an average annual loss of CNY 10,000. The criteria were subsequently applied to evaluate the risk of the Xiatudiling landslide.
A comparison of the calculated personnel life risk and economic risk values for the Xiatudiling landslide with the established risk judgment criteria revealed that both risks exceeded the maximum tolerable thresholds, placing them at an unacceptable level.

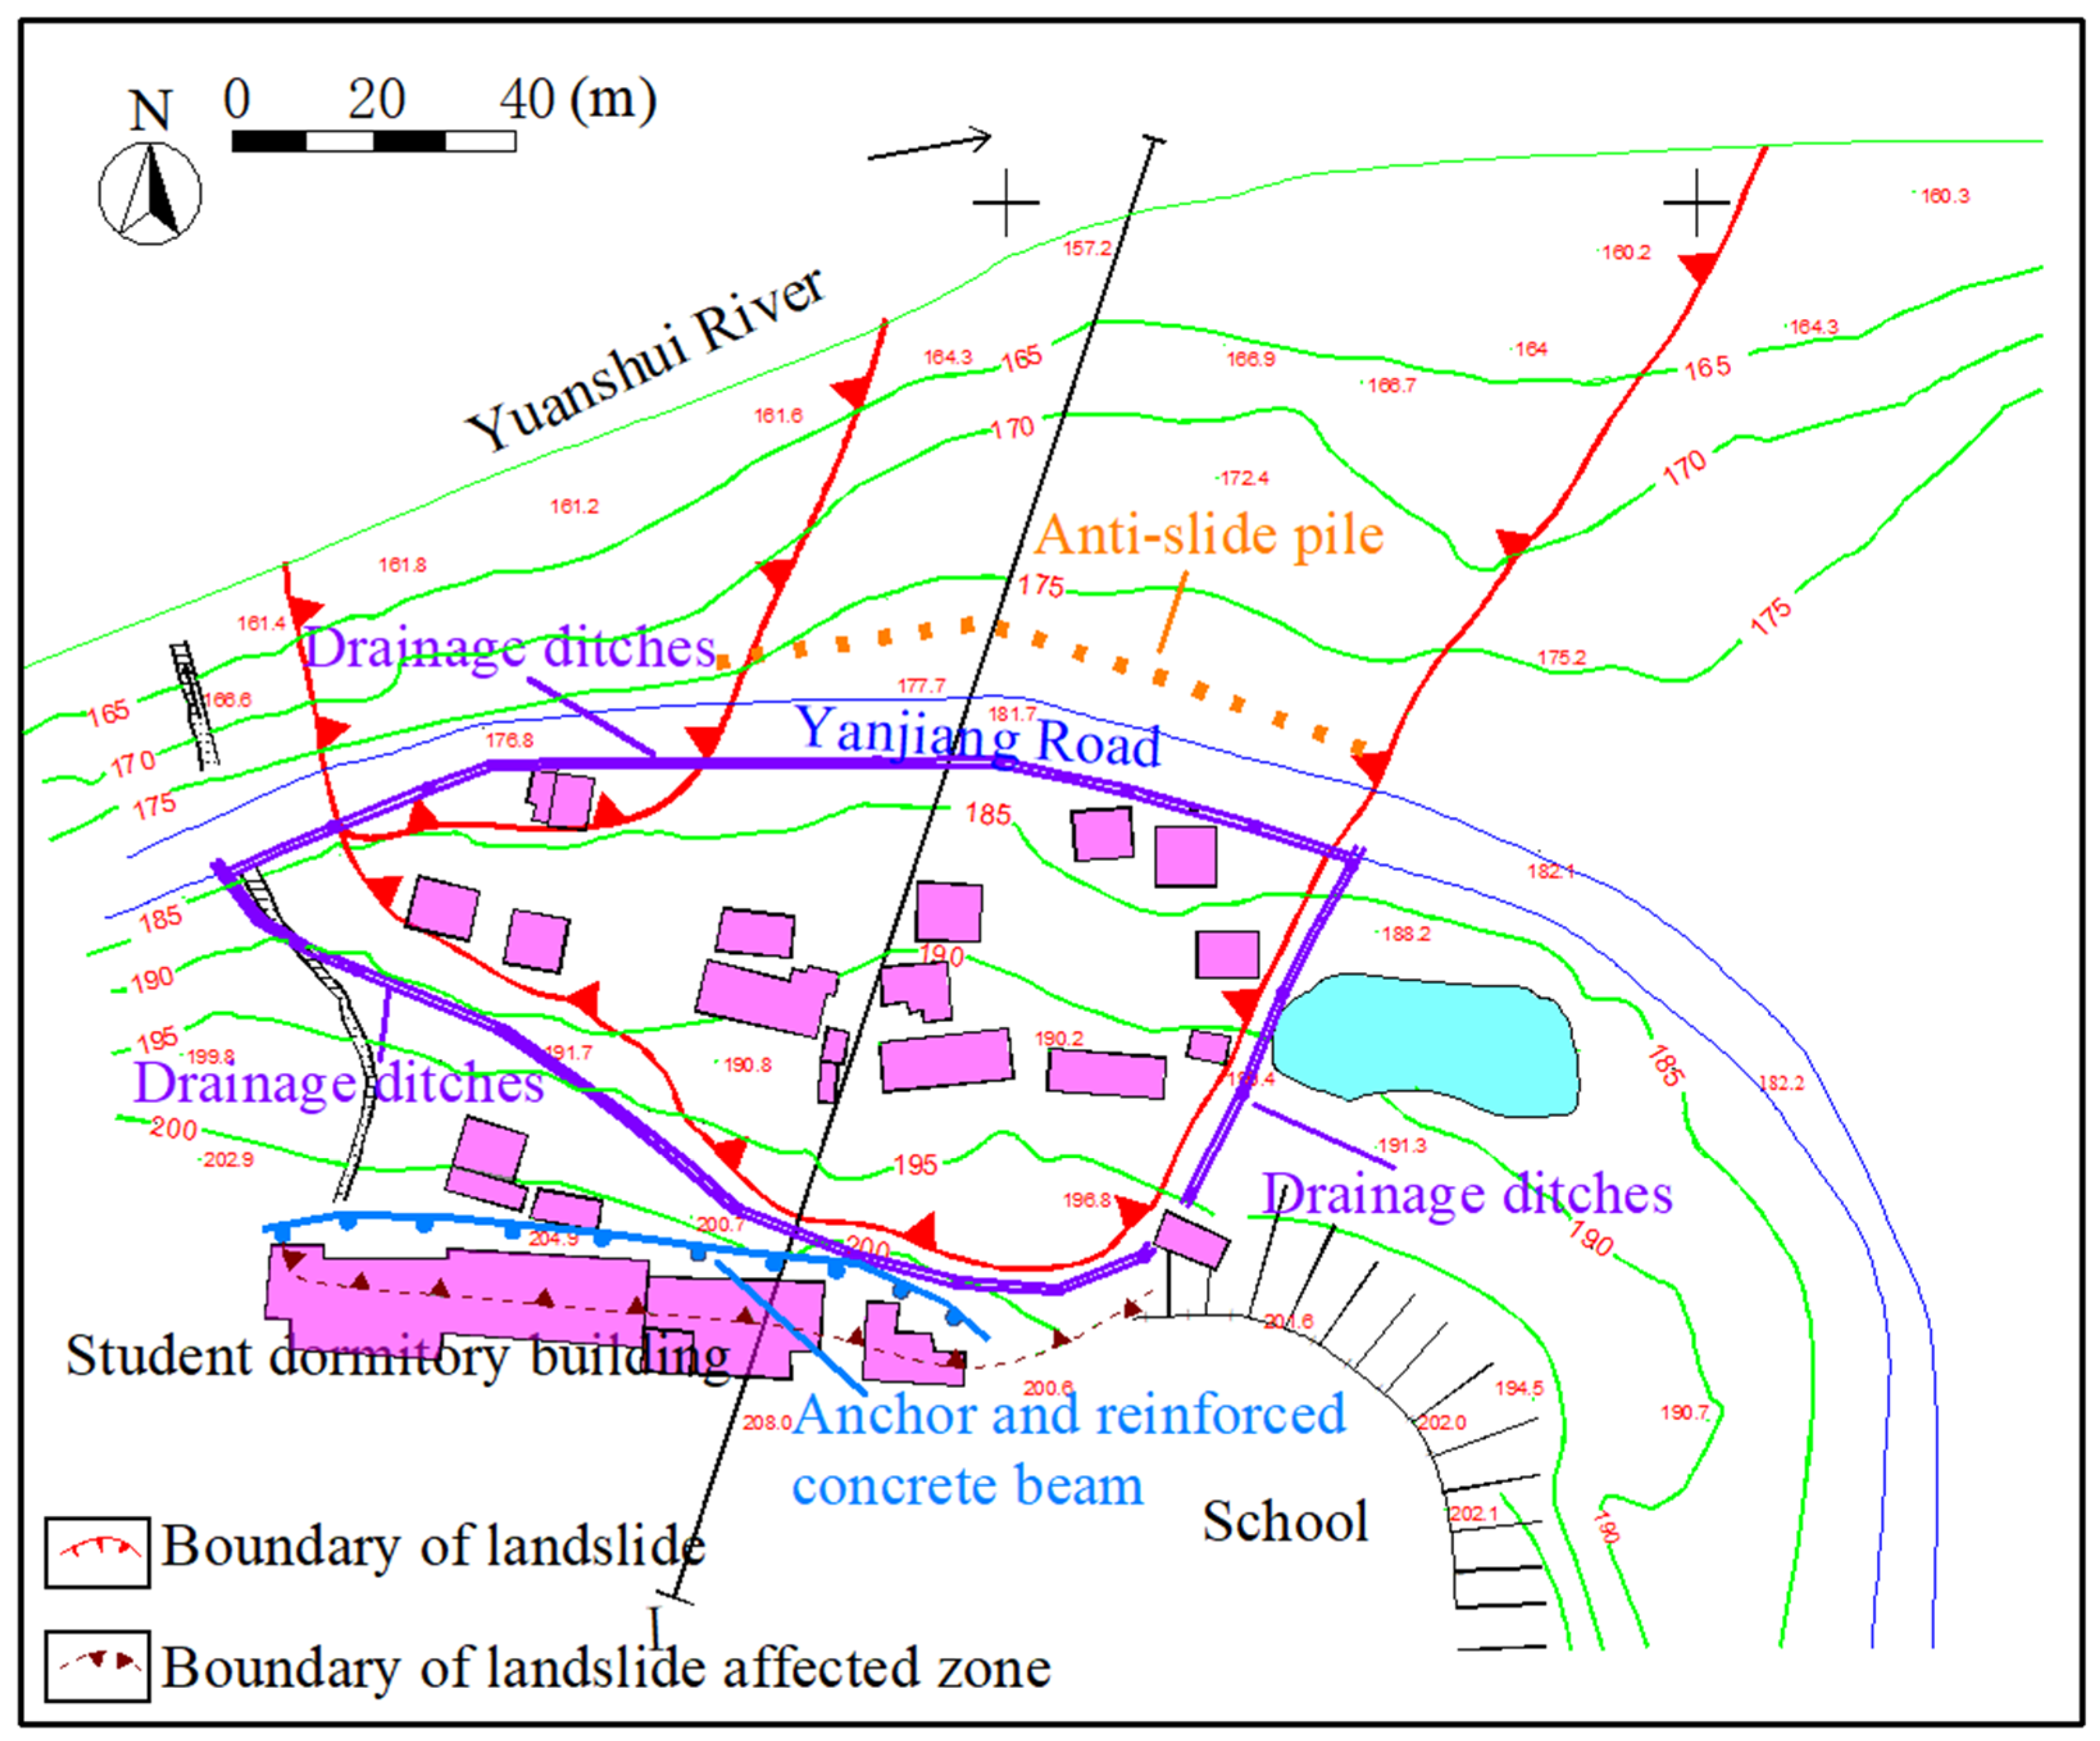
3.3. Landslide Treatment

The stabilization scheme of anti-slide pile combined with anchor and reinforced concrete beam (Figure 8) is used to stabilize the landslide. Anchors and square reinforced concrete beams were installed at the trailing edge of the landslide, anti-slide piles were placed in the middle and front of the landslide, and a surface drainage system was implemented in the landslide area. The scheme mainly adopts a retaining method, which is simple, convenient, and easy to implement. Moreover, the construction experience with cantilever piles having large cross sections in the Three Gorges Reservoir area is extensive, and the treatment is thorough.
After the landslide treatment, the risk assessment of the landslide was reassessed to understand its risk level and treatment effect. Recalculations were performed according to the method described above. Firstly, the stability of the landslide under the fourth working condition was calculated again. For the main sliding section, I-I, the stability factor of the landslide after treatment was 3.415, and the non-probabilistic reliability index was 2.2343; therefore, the landslide is unlikely to occur, and the failure value was 0 (the failure probability of the landslide calculated using the Monte Carlo method was 0%, which was consistent with the failure value result). Secondly, the risk values of the landslide were calculated. The values of the personnel life and economic risks of the Xiatudiling landslide were also 0 after the treatment. Finally, the risk of the landslide was judged to determine the risk level. By comparison, the landslide risk was at an acceptable level, and no more risk management measures were needed. Thus, the proposed scheme effectively reduced the landslide risk.

4. Results and Discussion

In this paper, the risk assessment of the Xiatudiling landslide was carried out using the proposed method. The I-I section with the most serious landslide deformation was used as the basis of analysis, and the limit equilibrium method was used to calculate the stability of the landslide under each working condition. It was found that the stability coefficient of the landslide in the fourth working condition was the lowest, and there was a possibility of instability, so this working condition was selected for the risk assessment. Firstly, the stability of the landslide was analyzed by the non-probabilistic reliability method. The ellipsoid model was constructed using the parameter intervals of cohesion and internal friction angle of the landslide body and sliding zone. The approximate structure performance function was constructed through the relationship between parameters and stability coefficients. The non-probabilistic reliability index of the landslide was calculated to be −0.0499, which indicates an unstable state, and the failure value of the landslide was derived from the formula as 0.5437. This result was calculated under the working condition of a 10-year return period, and the annual failure value of the landslide was 0.05437.
Secondly, the horizontal sliding distance of the landslide was calculated as 125.2 m by an empirical formula, which defined the potential hazard range of the landslide. The space–time distribution probability of the disaster-bearing bodies within the influence range of the landslide was analyzed by their location and activity pattern. Because the houses and road were on the landslide body when the landslide destabilized and slid, the houses and road would be completely destroyed, and the vulnerability was assigned as 1. Using the calculation method of sliding speed, the possible sliding speed of the landslide was 5.26 m/s, and the value of intensity of landslide action on personnel was directly derived from this result as 1, leading to a vulnerability of outdoor personnel of 1, according to the equation. Since the vulnerability of houses was 1, Equation (12) gave the vulnerability of indoor personnel as 0.45. For other disaster-bearing bodies where vulnerability quantification was difficult, values were assigned based on specific circumstances. For example, the vulnerability of orchards, which retained some use value after landslide damage, was set at 0.9. After assessing the value and number of disaster-bearing bodies, these values were applied to Equations (18) and (19) to calculate the personnel life risk and economic risk as 1.8499 persons/year and CNY 184,858/year (USD 25,448/year), respectively.
Finally, comparing the results with the established landslide risk judgment criteria, it was found that the landslide risk was at an unacceptable level. After the landslide treatment, the same method was reapplied to assess the risk, and the risk was reduced to an acceptable level, demonstrating obvious treatment effectiveness.
Before and after the treatment, the failure probabilities of the landslide calculated by the Monte Carlo method were 57.65% and 0%, respectively, consistent with the failure values. However, some differences were observed due to the following reasons: (1) the calculation principles of the non-probabilistic reliability and probabilistic reliability methods differ; and (2) the non-probabilistic method does not assume a distribution type for the parameters, whereas the probabilistic reliability method assumes that the parameters follow a normal distribution. This method of calculating the failure value does not require numerous repeated simulations but only requires dozens of slope stability analyses (20 times in this paper) during the construction of the response surface. In contrast, the Monte Carlo method must perform hundreds of thousands or millions of slope stability calculations. Therefore, the non-probabilistic reliability method can achieve results consistent with the Monte Carlo method while significantly reducing the computational workload. Thus, using the non-probabilistic failure value to measure landslide occurrence probability proves feasible.
Existing non-probabilistic studies of slopes have not considered working condition factors; therefore, the calculation results tend to be idealized. In this study, the influencing factor of rainfall conditions was included in the analysis, which extended the applicability of the slope non-probability method, and the results of slope stability analysis became more realistic. In addition, this study employed a more refined analysis approach for assessment steps than other risk assessment methods for individual landslides, which made the study of landslides and disaster-bearing bodies more specific. Different methods were used to analyze landslides and different types of disaster-bearing bodies. The interaction between landslides and disaster-bearing bodies was fully considered, enabling more quantitative assessment results. The assessment results from this methodological framework are relatively more informative. Landslides directly threaten human life safety, and this method can provide an accurate and comprehensive risk assessment of landslides, thereby reducing casualties and health risks, contributing to the achievement of the sustainable development goals (SDGs), particularly SDG 3, which focuses on good health and well-being.
Comparing the methods, calculation process, results accuracy, and applicability of this paper with similar risk assessment articles [11,33,34,44], our study uses the non-probabilistic reliability method to analyze landslide stability and combines it with disaster-bearing body vulnerability assessment. The landslide stability calculation is relatively simple yet yields accurate results. For the vulnerability calculation of disaster-bearing bodies, different methods were applied according to the landslide’s specific conditions. In contrast, similar landslide risk assessment articles typically employ probabilistic reliability methods for stability analysis. These studies often lack sufficient quantification in analyzing disaster-bearing bodies, feature more complex stability analysis processes, and require greater computational effort. They also tend to be less precise in calculating space–time distribution probabilities and personnel vulnerability, failing to distinguish between indoor and outdoor disaster scenarios, which compromises the accuracy of final risk assessments. The key differences are summarized in Table 10.

5. Future Work and Limitations

In reality, geotechnical parameters exhibit spatial variability. Therefore, in this study, to facilitate non-probabilistic reliability calculations, slope material layers were treated as homogeneous, without considering spatial variability and parameter correlations. This simplification may overestimate slope stability. Future studies could represent spatial variability and parameter correlations using interval numbers to improve calculation accuracy. Seismic stresses constitute another major trigger for landslides, and their effects are typically incorporated in slope stability analyses. Incorporating seismic influences into non-probabilistic reliability calculations would expand the method’s applicability and yield more comprehensive results. The influence of seismic activity can be reflected in the damage of seismic waves to landslides. With the help of software analysis, seismic conditions can be considered in the stability analysis of landslides. The landslide model is constructed in the calculation software and the corresponding initial conditions are set. Then, the corresponding seismic force parameters, such as peak acceleration or acceleration curve, can be input according to the different software, so as to simulate the landslide under seismic conditions and calculate the stability coefficient. Following the proposed method, seismic-condition landslide risk assessments can then be performed. Similar to rainfall factors, different seismic stresses correspond to distinct return periods—a crucial consideration for risk assessment. The above appropriate attempts can be made to realize the non-probabilistic reliability analysis and risk assessment of landslides under seismic conditions. Additionally, the result of landslide risk assessment based on non-probabilistic reliability analysis will be more accurate. In future research, we will validate these approaches through practical case studies while refining the theoretical framework presented in this paper.
Meanwhile, we will study how to integrate real-time monitoring data (such as rainfall, groundwater level, and surface displacement) into the assessment model to achieve dynamic risk assessment and early warning for landslides. Building upon this study, we will develop a landslide risk early warning platform to enable real-time monitoring, early warning, and information dissemination, providing decision support for government departments and the public. We will also focus on developing intuitive and easy-to-understand landslide risk visualization methods and constructing an open, shared landslide risk information platform accessible to the public through online channels. These studies will significantly enhance landslide disaster prevention capabilities, reduce casualties and property losses, increase public awareness of landslide risks, and promote broader societal participation in landslide disaster prevention and mitigation efforts.

6. Conclusions

In this study, to enable more accurate landslide risk assessment while reducing time and workload, the non-probabilistic reliability method was applied. The slope failure value quantified landslide occurrence probability, establishing a systematic risk assessment method for individual landslides. This method employs the non-probabilistic reliability method to calculate the failure value of a slope, predicts the influence range of the landslide using empirical formulas, estimates space–time distribution probabilities of disaster-bearing bodies based on their location and activity patterns, and calculates the vulnerability of disaster-bearing bodies according to the landslide intensity and resistance or susceptibility index of these bodies. The proposed method contributes to reducing the casualties and economic losses caused by landslide disasters, thereby better achieving good health and well-being.
The proposed method was applied to the Xiatudiling landslide as a case study. The analysis incorporated rainfall factors, yielding results that better reflect engineering practice. Landslide stability was analyzed using both reliability and non-probabilistic reliability methods, producing consistent results—with the latter requiring less computational effort and sample data. The personnel life risk caused by the landslide was 0.0285 persons/year, and the economic risk was CNY 184,858/year. Both values exceeded the acceptable thresholds. Following treatment, the slope instability probability was reduced to zero, effectively eliminating these risks. The treatment’s effectiveness validated the method’s feasibility, demonstrating its potential for quantitative landslide risk assessment while expanding non-probabilistic reliability applications. However, two limitations were identified. To facilitate the calculation, the slope material is regarded as homogeneous, and the spatial variability of the parameters is not taken into account, which leads to the overestimation of the stability of the slope. In addition, the possible impact of seismic activity is not considered in the landslide risk assessment, which leads to the lack of comprehensive consideration of risk assessment factors and affects the final analysis results. The proposed method will be further studied and improved later.
The landslide risk assessment method proposed in this study provides new ideas and tools for landslide risk management, though there remain many directions worthy of further exploration. Future work will incorporate real-time monitoring data to enable dynamic risk assessment and develop a landslide risk early warning platform for real-time monitoring and information dissemination. Additionally, we will create landslide risk visualization methods and establish an open, shared landslide risk information platform to enhance the practical application of risk assessment. These advancements will significantly reduce landslides’ impact on human society.

Author Contributions

Conceptualization, S.S.; Methodology, K.P. and J.Q.; Investigation, C.Z. and Z.Y.; Data curation, S.S., K.P. and J.Q.; Writing—original draft, K.P.; Writing—review and editing, S.S., K.P. and W.G.; Supervision, W.G. All authors have read and agreed to the published version of the manuscript.

Funding

This research was funded by the National Natural Science Foundation of China (no. 52008319).

Institutional Review Board Statement

Not applicable.

Informed Consent Statement

Not applicable.

Data Availability Statement

The original contributions presented in this study are included in the article. Further inquiries can be directed to the corresponding author.

Conflicts of Interest

The authors declare no conflicts of interest.

References

  1. Hu, R.; Fan, L.; Wang, S.; Wang, L.; Wang, X. Theory and method for landslide risk assessment-current status and future development. J. Eng. Geol. 2013, 21, 76–84. [Google Scholar]
  2. Xu, J.; Zhang, M.; Fan, W. An overview of geological disaster risk assessment. J. Catastrophol. 2015, 30, 130–134. [Google Scholar]
  3. Ahmed, B. Landslide susceptibility mapping using multi-criteria evaluation techniques in Chittagong Metropolitan Area, Bangladesh. Landslides 2015, 12, 1077–1095. [Google Scholar] [CrossRef]
  4. Chang, M.; Cui, P.; Dou, X.; Su, F. Quantitative risk assessment of landslides over the China-Pakistan economic corridor. Int. J. Disaster Risk Reduct. 2021, 63, 102441. [Google Scholar] [CrossRef]
  5. Varnes, D.J. Landslide Hazard Zonation: A Review of Principles and Practice; Unesco: Paris, France, 1984. [Google Scholar]
  6. Fell, R. Landslide risk assessment and acceptable risk. Can. Geotech. J. 1994, 31, 261–272. [Google Scholar] [CrossRef]
  7. Van Westen, C.; Van Asch, T.W.; Soeters, R. Landslide hazard and risk zonation—Why is it still so difficult? Bull. Eng. Geol. Environ. 2006, 65, 167–184. [Google Scholar] [CrossRef]
  8. Zhou, G.; Pei, Y.; Wu, C. Regional landslide risk assessment of Muchuan county as s case based on contributing weight model and GIS. Met. Mine 2013, 11, 130–134. [Google Scholar]
  9. Saleem, J.; Ahmad, S.S.; Butt, A. Hazard risk assessment of landslide-prone sub-Himalayan region by employing geospatial modeling approach. Nat. Hazards 2020, 102, 1497–1514. [Google Scholar] [CrossRef]
  10. Liu, X.; Shao, S.; Shao, S. Landslide susceptibility zonation using the analytical hierarchy process (AHP) in the Great Xi’an Region, China. Sci. Rep. 2024, 14, 2941. [Google Scholar] [CrossRef]
  11. Han, S.; Liu, M.; Wu, J.; Zhang, S.; Sun, Q.; Zhang, T. Risk assessment of slope disasters induced by typhoon-rainfall in the southeast coastal area, China: A case study of the Shiyang north slope. J. Geomech. 2022, 28, 583–595. [Google Scholar]
  12. Huang, J.; Lyamin, A.V.; Griffiths, D.V.; Krabbenhoft, K.; Sloan, S.W. Quantitative risk assessment of landslide by limit analysis and random fields. Comput. Geotech. 2013, 53, 60–67. [Google Scholar] [CrossRef]
  13. Ali, A.; Huang, J.; Lyamin, A.V.; Sloan, S.W.; Griffiths, D.V.; Cassidy, M.J.; Li, J.H. Simplified quantitative risk assessment of rainfall-induced landslides modelled by infinite slopes. Eng. Geol. 2014, 179, 102–116. [Google Scholar] [CrossRef]
  14. Guettouche, M.S. Modeling and risk assessment of landslides using fuzzy logic. Application on the slopes of the Algerian Tell (Algeria). Arab. J. Geosci. 2013, 6, 3163–3173. [Google Scholar] [CrossRef]
  15. Pan, Y.; Zheng, Y.; Li, K.; Liao, J. Framework for the preliminary risk classification of slopes prone to large failure. Eng. Geol. 2021, 287, 106124. [Google Scholar] [CrossRef]
  16. Bentivenga, M.; Gizzi, F.T.; Palladino, G.; Piccarreta, M.; Potenza, M.R.; Perrone, A.; Bellanova, J.; Calamita, G.; Piscitelli, S. Multisource and multilevel investigations on a historical landslide: The 1907 Servigliano earth flow in Montemurro (Basilicata, Southern Italy). Land 2022, 11, 408. [Google Scholar] [CrossRef]
  17. Marr, P.; Donato, Y.A.J.; Carraro, E.; Kanta, R.; Glade, T. The role of historical data to investigate slow-moving landslides by long-term monitoring systems in Lower Austria. Land 2023, 12, 659. [Google Scholar] [CrossRef]
  18. Kanwal, S.; Atif, S.; Shafiq, M. GIS based landslide susceptibility mapping of northern areas of Pakistan, a case study of Shigar and Shyok Basins. Geomat. Nat. Hazards Risk 2017, 8, 348–366. [Google Scholar] [CrossRef]
  19. Jennifer, J.J.; Saravanan, S.; Abijith, D. Application of Frequency Ratio and Logistic Regression Model in the Assessment of Landslide Susceptibility Mapping for Nilgiris District, Tamilnadu, India. Indian Geotech. J. 2021, 51, 773–787. [Google Scholar] [CrossRef]
  20. Xue, Q.; Zhang, M.; Li, L. Loess landslide susceptibility evaluation based on slope unit and information value method in Baota District, Yan’an. Geol. Bull. China 2015, 34, 2108–2115. [Google Scholar]
  21. Cheng, J.; Wang, X.; Du, W.; Shi, H. Application of Janbu method in slope stability analysis of Baiyunebo west iron mine. Coal Technol. 2015, 34, 130–132. [Google Scholar]
  22. Chen, Z. Soil Slope Stability Analysis—Theory Methods and Programs; China Water & Power Press: Beijing, China, 2003. [Google Scholar]
  23. Zheng, Y.; Zhao, S. Application of strength reduction FEM in soil and rock slope. Chin. J. Rock Mech. Eng. 2004, 19, 3381–3388. [Google Scholar]
  24. Zhao, Z.; Zhu, Y.; Hou, H.; Li, L. Stability analysis of loess fill slope supported by frame prestressed anchors considering tensile strength cut-off. Sci. Rep. 2024, 14, 3007. [Google Scholar] [CrossRef]
  25. Wang, Y. Uncertain parameter sensitivity in Monte Carlo simulation by sample reassembling. Comput. Geotech. 2012, 46, 39–47. [Google Scholar] [CrossRef]
  26. Guo, Z.; Chen, L.; Yin, K.; Shrestha, D.P.; Zhang, L. Quantitative risk assessment of slow-moving landslides from the viewpoint of decision making: A case study of the Three Gorges Reservoir in China. Eng. Geol. 2020, 273, 105667. [Google Scholar] [CrossRef]
  27. Huang, C.; Yin, K.; Liang, X.; Gui, L.; Zhao, B.; Liu, Y. Study of direct and indirect risk assessment of landslide impacts on ultrahigh-voltage electricity transmission lines. Sci. Rep. 2024, 14, 25719. [Google Scholar] [CrossRef] [PubMed]
  28. Dong, L.; Sun, D.; Li, X.; Zhou, Z. Interval non-probabilistic reliability of a surrounding jointed rockmass in underground engineering: A case study. IEEE Access 2017, 5, 18804–18817. [Google Scholar] [CrossRef]
  29. Zheng, Z.; Li, Y.; Wen, L.; Zhang, Y.; Wang, T. Reliability analysis of an embankment dam slope based on an ellipsoid model and PSO-ELM. Structures 2023, 55, 2419–2432. [Google Scholar] [CrossRef]
  30. Bi, R.; Han, X.; Jiang, C.; Bai, Y.; Liu, J. Uncertain buckling and reliability analysis of the piezoelectric functionally graded cylindrical shells based on the nonprobabilistic convex model. Int. J. Comput. Methods 2013, 11, 1350080. [Google Scholar] [CrossRef]
  31. Gao, L.; Liang, B.; Wu, Z. Nonprobabilistic reliability solution method of slope convex set model. J. High. Transp. Res. Dev. 2022, 16, 51–59. [Google Scholar] [CrossRef]
  32. Liao, X.; Huang, R.; Yang, L.; Li, Y.; Wang, Y.; Wang, B.; Li, Y. Risk analysis and evaluation of a landslide in Shiyan city. Resour. Environ. Eng. 2020, 34, 388–395. [Google Scholar]
  33. Wei, Q. Risk Assessment of Rain-Induced Unstable Slope in Danjia. Master’s Thesis, Southwest University of Science and Technology, Mianyang, China, 2023. [Google Scholar]
  34. Sui, H.; Su, T.; Hu, R.; Wang, D.; Zheng, Z. Study on the risk assessment method of rainfall landslide. Water 2022, 14, 3678. [Google Scholar] [CrossRef]
  35. Corominas, J.; Van Westen, C.; Frattini, P.; Cascini, L.; Malet, J.P.; Fotopoulou, S.; Catani, F.; Van Den Eeckhaut, M.; Mavrouli, O.; Agliardi, F.; et al. Recommendations for the quantitative analysis of landslide risk. Bull. Eng. Geol. Environ. 2014, 73, 209–263. [Google Scholar] [CrossRef]
  36. Wong, F.S. Slope reliability and response surface method. J. Geotech. Eng. 1985, 111, 32–53. [Google Scholar] [CrossRef]
  37. Zhou, D.; Mei, Y.; Yang, T. Research on stability of high slope of sandy loess road cutting based on response surface method. J. Saf. Sci. Technol. 2024, 20, 139–147. [Google Scholar]
  38. Jiang, C.; Han, X.; Lu, G.; Liu, J.; Zhang, Z.; Bai, Y. Correlation analysis of non-probabilistic convex model and corresponding structural reliability technique. Comput. Methods Appl. Mech. Eng. 2011, 200, 2528–2546. [Google Scholar] [CrossRef]
  39. Kang, Z.; Luo, Y.; Li, A. On non-probabilistic reliability-based design optimization of structures with uncertain-but-bounded parameters. Struct. Saf. 2011, 33, 196–205. [Google Scholar] [CrossRef]
  40. Jiang, C.; Bi, R.; Lu, G.; Han, X. Structural reliability analysis using non-probabilistic convex model. Comput. Methods Appl. Mech. Eng. 2013, 254, 83–98. [Google Scholar] [CrossRef]
  41. Shu, S.; Qian, J.; Gong, W.; Pi, K.; Yang, Z. Non-probabilistic reliability analysis of slopes based on fuzzy set theory. Appl. Sci. 2023, 13, 7024. [Google Scholar] [CrossRef]
  42. Liu, G.; Xi, J.; Dai, E.; Wu, W. Loss risk assessment of the hazard-affectted body of landslides in China. J. Nat. Disasters 2014, 23, 39–46. [Google Scholar]
  43. Han, Y. Risk Assessment of Hua-Yen Temple Landslide. Master’s Thesis, Chang’an University, Xi’an, China, 2017. [Google Scholar]
  44. Sui, H.; Hu, R.; Gao, W.; Gao, W.; Luo, G. Risk assessment of individual landslide based on the risk acceptable model: A case study of the Shiyantan landslide in Mayang County, China. HERA 2020, 26, 2500–2519. [Google Scholar] [CrossRef]
  45. Uzielli, M.; Nadim, F.; Lacasse, S.; Kaynia, A.M. A conceptual framework for quantitative estimation of physical vulnerability to landslides. Eng. Geol. 2008, 102, 251–256. [Google Scholar] [CrossRef]
  46. Li, Z.; Nadim, F.; Huang, H.; Uzielli, M.; Lacasse, S. Quantitative vulnerability estimation for scenario-based landslide hazards. Landslides 2010, 7, 125–134. [Google Scholar] [CrossRef]
  47. Nguyen, T.T.N.; Liu, C.C. A new approach using AHP to generate landslide susceptibility maps in the Chen-Yu-Lan Watershed, Taiwan. Sensors 2019, 19, 505. [Google Scholar] [CrossRef]
  48. Fahad, S.; Hossain, M.S.; Huong, N.T.L.; Nassani, A.A.; Haffar, M.; Naeem, M.R. An assessment of rural household vulnerability and resilience in natural hazards: Evidence from flood prone areas. Environ. Dev. Sustain. 2023, 25, 5561–5577. [Google Scholar] [CrossRef]
  49. Wu, Y.; Liu, D.; Lu, X.; Song, Q. Vulnerability assessment model for hazard bearing body and landslide risk index. Rock Soil Mech. 2011, 32, 2487–2492+2499. [Google Scholar]
  50. Yin, Z. Prediction Method of Earthquake Disaster and Loss; Seismological Press: Beijing, China, 1995. [Google Scholar]
  51. Du, J. Risk Assessment of Individual Landslide. Ph.D. Thesis, China University of Geosciences, Wuhan, China, 2012. [Google Scholar]
  52. Fell, R.; Ho, K.K.S.; Lacasse, S.; Leroi, E. A frame work for landslide risk assessment and management. In Landslide Risk Management; CRC Press: London, UK, 2005. [Google Scholar]
  53. Song, Y.; Fan, W.; Li, J.; Du, X. Risk assessment of property loss caused by unstable slopes under different rainfall conditions—A case study of Xinglong town of Zhenba county. J. Eng. Geol. 2020, 28, 401–411. [Google Scholar]
  54. Wu, Y.; Yin, K.; Li, S. Stability analysis and treatment engineering design of Xiatudiling landslide. In Proceedings of the National Geotechnical and Engineering Academic Conference, Beijing, China, 22 December 2003. [Google Scholar]
  55. Dai, Y.; Yin, K.; Wang, Y. Discussion on method of landslide velocity calculation and surge prediction. Rock Soil Mech. 2008, 29, 407–411. [Google Scholar]
  56. Wen, H.; Zhang, Y.; Fu, H.; Xie, P.; Hu, J. Research status of instability mechanism of rainfall-induced landslide and stability evaluation methods. China J. Highw. Transp. 2018, 31, 15–29+96. [Google Scholar]
  57. Geological Disaster Prevention Headquarters of the Three Gorges Reservoir Area. Geological Disaster Prevention Engineering of the Three Gorges Reservoir Area Phase III. Technical Requirements for Geological Investigation; Geological Disaster Prevention Headquarters of the Three Gorges Reservoir Area: Yichang, China, 2004. [Google Scholar]
  58. Morgenstern, N.R.; Price, V.E. The analysis of the stability of general slip surface. Geotechnique. 1965, 15, 79–93. [Google Scholar] [CrossRef]
  59. Gong, W.; Zhang, S.; Juang, C.H.; Tang, H.; Pudasaini, S.P. Displacement prediction of landslides at slope-scale: Review of physics-based and data-driven approaches. Earth-Sci. Rev. 2024, 258, 104948. [Google Scholar] [CrossRef]
  60. Kuan, X. Geomorphologic prediction of landslide movement distance. Translated by Wang NQ. Railw. Geol. Subgrade 1989, 3, 42–47. [Google Scholar]
  61. Liu, C. Landslide Risk Assessment at Wanzhou Urban area in the Three Gorges Reservoir. Ph.D. Thesis, China University of Geosciences, Wuhan, China, 2014. [Google Scholar]
  62. Wang, J. Landslide Risk Assessment in Wanzhou County, Three Gorges Reservoir. Ph.D. Thesis, China University of Geosciences, Wuhan, China, 2015. [Google Scholar]
  63. Jiang, J. Risk Assessment of Fengxi Villa Slope in Feng County. Master’s Thesis, Chang’an University, Xi’an, China, 2018. [Google Scholar]
  64. Pan, J. Analysis of Anti-Sliding Stability of Buildings and Landslides; China Water & Power Press: Beijing, China, 1980. [Google Scholar]
  65. Peng, L. Landslide Risk Assessment in the Three Gorges Reservoir. Ph.D. Thesis, China University of Geosciences, Wuhan, China, 2014. [Google Scholar]
Figure 1. Landslide risk assessment process.
Sustainability 17 04146 g001
Figure 2. Schematic of the non-probability reliability index.
Sustainability 17 04146 g002
Figure 3. Transformation of the standardized vector space U to space W.
Sustainability 17 04146 g003
Figure 4. Planar graph of the Xiatudiling landslide.
Sustainability 17 04146 g004
Figure 5. Panoramic view of the Xiatudiling landslide.
Sustainability 17 04146 g005
Figure 6. Lithological section (I-I) of the Xiatudiling landslide.
Sustainability 17 04146 g006
Figure 7. Societal risk judgment criteria of personnel.
Sustainability 17 04146 g007
Figure 8. Treatment scheme for the Xiatudiling landslide.
Sustainability 17 04146 g008
Table 1. Value of the impact depth index of the landslide [51].
Landslide impact depth index (m)<0.10.1–0.30.3–0.60.6–0.8≥0.8
I d e p 0.10.30.70.91.0
Table 2. Value of the impact width index of the landslide [51].
Landslide impact width index (m)<5050–200200–400400–700≥700
I w i d 0.10.30.50.81.0
Table 3. Value of the health status index of the personnel [51].
Health statusGoodLess functionalDeformity
S h e l 0.10.1–0.80.8–1.0
Table 4. Value of the index of the local disaster warning level [51].
Local disaster warning levelPerfectionModerationPlainNo early warning system
S w a r 0–0.20.2–0.60.6–1.01.0
Table 5. Physical and mechanical parameters of the landslide geotechnical bodies.
Natural Density
(kN/m3)
Saturated Density
(kN/m3)
Cohesion
(kPa)
Internal Friction Angle
(°)
Landslide body21.523.530.024.0
Sliding zone19.219.714.015.8
Underlying sandstone 300.040.0
Underlying mudstone 200.022.0
Table 6. Stability calculation for the Xiatudiling landslide.
Working ConditionLoad CombinationStability Factor
1Weight + 145 m water level1.404
2Weight + 162 m water level1.409
3Weight + 162 m water level + Rainfall with a return period of 1 year1.013
4Weight + 162 m water level + Rainfall with a return period of 10 years0.984
5Weight + 175 m water level1.418
6Weight + 175 m water level + Rainfall with a return period of 1 year1.126
7Weight + 175 m water level + Rainfall with a return period of 10 years1.093
Table 7. Personnel composition and time distribution probabilities.
Personnel CategoryNumberTime Distribution Probability of the Personnel IndoorsTime Distribution Probability of the Personnel Outdoors
Students50.520.21
Workers250.500.14
Other residents350.640.36
Table 8. Personnel life risk value.
Personnel CategoryRisk Value of the
Personnel Indoors
(Persons/year)
Risk Value of the
Personnel Outdoors
(Persons/year)
Total Risk Value
(Persons/year)
Students0.06360.05711.8499
Workers0.30580.1903
Other residents0.54800.6851
Table 9. Economic risk value.
Disaster-Bearing BodiesValue
(CNY)
Risk Value
(CNY/year)
Total Risk Value (CNY/year)
Yanjiang Road400,00021,748184,858
Houses1,200,00065,244
Land and fruit trees2,000,00097,866
Table 10. Key differences in landslide risk assessment methods.
This StudySimilar Article
MethodThe non-probability reliability method is used to calculate the stability of the landslide, and the classification of the disaster-bearing bodies is divided in detail. The vulnerability analysis is carried out by different methods.The probabilistic reliability method is used to calculate the stability of the landslide, and the disaster-bearing bodies are analyzed simply. Only two methods are used to analyze the vulnerability.
Calculation processSimpleComplex
Results accuracyAccurateGenerally accurate
ApplicabilityHighly applicableGenerally applicable
Disclaimer/Publisher’s Note: The statements, opinions and data contained in all publications are solely those of the individual author(s) and contributor(s) and not of MDPI and/or the editor(s). MDPI and/or the editor(s) disclaim responsibility for any injury to people or property resulting from any ideas, methods, instructions or products referred to in the content.

