1. Introduction
Against the background of accelerating global climate governance and green economic transformation, green collaborative innovation has emerged as a key pathway for enterprises to crack the dilemma of low-carbon development and achieve the Sustainable Development Goals [
1]. Halfway through the United Nations 2030 Agenda for Sustainable Development, global greenhouse gas emissions continue to rise. This trend is in significant conflict with the IPCC (Intergovernmental Panel on Climate Change) Sixth Assessment Report’s goal of temperature control—if the global temperature rise is to be controlled within 1.5 degrees Celsius, a 43% reduction in emissions is required by 2030, or else we will face the risk of an “irreversible climate tipping point”. As the world’s largest carbon emitter, China has clearly put forward the strategic goal of “promoting Chinese-style modernization through green and low-carbon development” and emphasized breaking through the bottleneck of energy and industrial transformation through technological synergy [
2]. This is not only about national carbon neutrality commitments, but also a key support for the global sustainable development agenda. However, the existing research predominantly examines the enabling effects of conventional digital technologies such as big data and blockchain in technological collaboration [
3,
4] while overlooking the transformative potential of artificial intelligence (AI)—a more complex general-purpose technology—in reshaping innovation ecosystems [
5,
6]. This research gap directly restricts the application efficiency of technological leverage in sustainable development, making it difficult for green collaborative innovation to break through the efficiency bottleneck.
Corporate green innovation faces dual challenges. First, the dynamic restructuring of global green low-carbon industry value chains has intensified technological diffusion barriers and core patent monopolies, driving up R&D costs and constraining independent innovation efficiency [
7]. AI technologies, leveraging intelligent data analytics and patent semantic mining algorithms, can effectively identify technological complementarities and reduce information search costs, thereby breaking the “low-end lock-in” dilemma in supply chain restructuring [
8,
9]. Second, insufficient inter-organizational knowledge sharing, frequent transaction frictions, and resource misallocation undermine collaborative innovation effectiveness [
10]. AI-driven knowledge graphs and smart contract technologies can mitigate transaction frictions caused by trust deficits and incomplete contracts through standardized knowledge interaction protocols and automated execution of collaboration terms [
2,
11,
12]. The traditional closed innovation model makes it difficult to meet the ecological needs of open innovation. In this context, as an important paradigm of open innovation, green collaborative innovation urgently needs to use AI technology to integrate multiple subject resources, disperse technical risks and cost pressure, and then break through the bottleneck of enterprise green transformation [
13,
14].
The rapid advancement of AI presents new opportunities for reconstructing green collaborative innovation networks [
5]. As a frontier technology in the digital economy, AI is reshaping corporate innovation ecosystems through smart data analytics (e.g., emission hotspot identification), process automation optimization (e.g., carbon footprint tracking systems), and intelligent resource allocation (e.g., cross-organizational computing power-sharing platforms) [
8,
15]. The existing studies focus more on the green innovation effect of digital transformation. They demonstrate that digital technologies facilitate collaborative innovation by reducing information asymmetry and enabling cross-domain knowledge flows [
2,
16]. However, the existing literature exhibits two limitations. First, most studies focus on AI’s general innovation effects [
17,
18] while neglecting its technological adaptability in green collaboration scenarios. As a result, its sustainable development value has not been fully released. Second, given that green collaborative innovation involves complex interactions between heterogeneous knowledge-based actors, can AI truly optimize synergy efficiency by restructuring transaction cost frameworks and reconfiguring human capital allocation to overcome traditional collaboration dilemmas? Current theories inadequately address this, particularly regarding the unverified mediating pathways of transaction costs and the labor force structure.
Based on this, we used the joint green patent data of China’s A-share listed companies from 2010 to 2023 to systematically investigate the impact and mechanism of artificial intelligence on green collaborative innovation. The results show that (1) artificial intelligence has a promoting effect on green collaborative innovation. This conclusion is still valid after the endogeneity problem is alleviated and the robustness test is conducted. (2) The nonlinear relationship test suggests that threshold effects or diminishing returns of artificial intelligence on corporate green collaborative innovation have not yet occurred. (3) The mechanism test shows that the promoting effect of artificial intelligence on green collaborative innovation can be realized by reducing transaction costs and optimizing the labor structure. (4) The moderating effect analysis shows that green investor entry and CEO openness can strengthen the promoting effect of artificial intelligence on green collaborative innovation. This promoting effect is more pronounced in regions with higher marketization and stronger legal regulations. (5) The heterogeneity tests indicate that the positive impact of artificial intelligence technology application on green collaborative innovation is more significant in the case of high macroeconomic uncertainty, large-scale enterprises, and SOEs. (6) In addition, the promoting effect of artificial intelligence on green collaborative innovation helps firms reduce carbon emissions and improve ESG performance, promoting sustainable business practices. We further revealed that this promoting effect exhibits heterogeneity with different firm sizes, ownership types, sectors to which firms belong, and the stringency of regional environmental penalties.
Compared with the existing research, the marginal contribution of this study is as follows. First, unlike the existing research focusing on production efficiency [
19], organizational performance [
20], energy transition [
15], specific emissions [
21], and other perspectives, the micro impact of artificial intelligence technology is examined. This study explores the impact of artificial intelligence adoption from the perspective of green collaborative innovation for the first time and examines the heterogeneous impact of macroeconomic uncertainty and micro-characteristics of enterprises, which expands the research boundaries of the existing literature on the application of artificial intelligence technology. Second, it suggests viable options for promoting green collaborative innovation. It is different from previous studies that focus on the impact of green bonds [
1], digital dynamic capabilities [
13], supply chain networks [
22], and other factors on green collaborative innovation. From the perspective of external technology, we examine how AI can drive green collaborative innovation by reducing transaction costs and optimizing the labor structure, opening the “black box” of how AI affects corporate green collaborative innovation and, thus, broadening the scope of the existing research. Third, this study enriches the literature on green innovation by studying how external capital incentives (green investors) and internal cognitive drivers (CEO openness) regulate the impact of artificial intelligence on green collaborative innovation. The existing studies have paid more attention to the moderating effect of factors such as digital adaptability [
18] and industry concentration [
23]. In contrast, we identified the moderating effect of external capital incentives (green investors) and internal cognitive drive (CEO openness), which provides new insights into the boundary conditions of AI technology application driving corporate green collaborative innovation and enriches the scenario mechanism research on the endogenous driving factors of green collaborative innovation. From a technology–organization–environment co-evolution perspective, this research clarifies the micro-level operational chain of AI-enabled green innovation, providing theoretical support for developing countries to achieve leapfrog low-carbon transitions through digital technologies. Practically, it offers actionable insights for advancing AI-enabled green industries, constructing collaborative green innovation ecosystems, and supporting the realization of the United Nations Sustainable Development Goals (SDGs).
5. Results
5.1. Baseline Regression
Table 3 shows the estimated results of the baseline regression. Column (1) shows regression results without controlling for any control variables and fixed effects. The coefficient of AI is significantly positive, indicating that the application of artificial intelligence technology can improve the level of green collaborative innovation in enterprises. Column (2) adds control variables at the firm level. The coefficient of AI is significantly positive at the 1% level. This further illustrates that the application of artificial intelligence technology promotes green collaborative innovation in enterprises. Columns (3) and (4) gradually increase the year and firm fixed effects, and the coefficient of AI is still significantly positive. From the statistical significance results, in all regressions, the impact of AI on corporate green collaborative innovation is always positive at the significance level of 1%. This shows that the higher the application degree of AI technology in enterprises, the higher the level of green collaborative innovation. From the perspective of economic significance, the coefficient of AI in Column (4) shows that when other conditions remain unchanged, every unit increase in the application degree of AI technology will increase the level of enterprise green collaborative innovation by about 11.93%. This indicates that the application of AI technology has a significant positive impact on enterprise green collaborative innovation. First, from the horizontal comparison across the industry, this 11.93% enhancement substantially exceeds the average innovation effect (by approximately 8.2%, according to the China Intelligent Manufacturing Development Report 2023) of digital transformation in manufacturing. In particular, considering that green collaborative innovation involves cross-departmental and cross-industrial chain technology integration, the systemic efficiency gains enabled by AI carry greater strategic value. Second, it makes dynamic inference based on the practice of coordinated Beijing–Tianjin–Hebei development. According to the Beijing–Tianjin–Hebei Regional Development Index (2023), the annual growth rate of the Beijing–Tianjin–Hebei collaborative index is 12.9%. If the application degree of artificial intelligence technology in Beijing–Tianjin–Hebei firms increases by one unit, the annual growth rate of the expected index will increase from 12.9% to 26.28% ((1 + 0.1193) × (1 + 0.129) − 1). That is, the average annual growth rate will have increased by 13.38 percentage points. This acceleration effect could enable the Beijing–Tianjin–Hebei region to achieve its 14
th Five-Year Plan green technology R&D targets 2–3 years ahead of schedule, strongly validating the practical policy value of AI empowerment. In summary, both statistically and economically, artificial intelligence demonstrably promotes corporate green collaborative innovation. Hypothesis H1 is supported.
Empirical analysis of control variables reveals that (1) larger enterprises exhibit a stronger propensity for green collaborative innovation. This trend can be attributed to their substantial financial capacity to absorb the capital costs associated with green innovation. Moreover, the realization of innovation outcomes requires sufficient organizational resilience to withstand potential market entrants and creative destruction threats. Even when large enterprises possess singular resource advantages, cross-sector collaboration not only facilitates resource complementarity, but also generates economies of scale through synergistic innovation. (2) The estimated coefficient of firm age shows a significant negative impact on green collaborative innovation. This could be attributed to mature firms’ culture being more inclined toward maintaining their existing market share, and they are cautious about high-risk and long-term green collaborative innovation. In contrast, younger firms typically demonstrate greater risk tolerance and organizational flexibility, showing stronger receptiveness to open collaboration and cross-domain technology integration. (3) R&D investment intensity is significantly negatively correlated with corporate green collaborative innovation. This relationship may stem from resource concentration patterns in R&D-intensive industries (e.g., pharmaceutical manufacturing and information technology), where enterprises prioritize internal technological breakthroughs to sustain competitive barriers. Such closed-loop R&D models potentially divert resources from cross-organizational collaboration infrastructure development (e.g., supply chain coordination and industry–academia platforms), thereby impeding the formation of open innovation networks essential for green collaboration. Furthermore, the decision-making tendency of management may also have an impact. Firms with high R&D investments may strategically attach more importance to technological leadership than environmental protection, thus neglecting green collaborative innovation. (4) Key pollution monitoring units also show a statistically positive impact on green collaborative innovation. This may stem from the fact that focus monitoring firms face stricter environmental regulations and must adopt green innovations to meet standards or face possible penalties. This pushes companies to invest in green technologies and collaborative innovation projects. Moreover, as a monitoring unit, the environmental performance of an enterprise directly affects its market reputation. Through green collaborative innovation, companies can enhance their brand image and meet the environmental protection needs of consumers and investors, thus gaining competitive advantages.
5.2. Threshold Effect of Artificial Intelligence on Green Collaborative Innovation
President Xi Jinping has emphasized that while technology serves as a powerful driver for development, it may also become a source of risks. It is imperative to proactively judge the regulatory conflicts, social risks, and ethical challenges arising from technological advancement. This requires maximizing the benefits of rapidly evolving cutting-edge technologies while mitigating their potential negative impacts. Therefore, we further investigated the nonlinear impact of artificial intelligence on corporate green collaborative innovation. We added the quadratic term of artificial intelligence (AI
2) into Model 1 for regression analysis, and the results are shown in
Table 4. We found that the coefficient of AI was still significantly positive at the 1% level. However, the regression coefficient of AI
2 was not significant. This shows that there is no nonlinear relationship between artificial intelligence and enterprise green collaborative innovation.
Potential explanations are as follows. First, the application of artificial intelligence in green innovation remains at an early stage, with most enterprises having yet to reach the critical threshold for technological adoption. At present, the marginal utility of artificial intelligence technology has not yet exhibited diminishing returns, as companies continue to accumulate benefits through foundational applications without approaching the resource investment boundaries required for deep technological integration. Second, green collaborative innovation involves cross-firm and cross-domain technological convergence. In this process, artificial intelligence technology primarily acts as an “enabler” rather than a “dominant driver”. Its value realization depends on synergies with other technologies (e.g., IoT, blockchain), so the independent contribution of artificial intelligence technology has not reached the threshold to trigger nonlinear changes. Third, government departments continue to encourage enterprises to engage in green collaborative innovation through carbon neutrality policies and green technology subsidies. These policy-driven benefits partially offset rising marginal costs of technological investments. For instance, China’s “Dual Carbon” strategy provides long-term certainty for enterprises, enabling linear growth in AI-related investments rather than premature saturation. Consequently, threshold effects or diminishing returns of artificial intelligence on corporate green collaborative innovation have not yet occurred.
5.3. Endogeneity Test
5.3.1. Missing Variable Bias Test
Due to the diversity and complexity of factors affecting green collaborative innovation, it may lead to endogeneity problems caused by missing variables. Therefore, we tested for missing variable bias and inferred the extent to which missing variables affect the baseline results. Referring to Altonji et al. [
48], we used observable variables to measure the degree of bias in unobservable variables. That is, by controlling a set of finite observable variables, we calculated the difference ratio of explanatory variable coefficients and assessed the possibility of bias from missing variables to the baseline results. The greater the ratio value, the stronger the explanatory power of the observed variables, and the lower the potential bias resulting from omitted variables.
According to
Table 5, the minimum value of the ratio is 24.3622, and the mean value is 31.7840. This shows that if unobservable variables can cause errors in the baseline estimation results of this study, their explanatory power should be at least 24.4 times that of the selected control variables. Given that our baseline regression rigorously controlled for firm-level and year-level fixed effects, as well as variables related to artificial intelligence and green collaborative innovation, there is strong reason to believe that the potential bias caused by unobservable omitted variables is likely minimal. Therefore, the empirical findings presented earlier are robust.
5.3.2. Selection Bias
The adoption of artificial intelligence technology by enterprises may not be random, but it is affected by human capital, technological level, industry characteristics, data infrastructure, external policy shocks, and other factors. Therefore, the problem of sample self-selection bias may exist in empirical research. Hence, we used propensity score matching (PSM) and the Heckman two-stage model to deal with the selective bias problem.
First, we used the propensity score matching method to overcome self-selection bias. According to whether the firms had artificial intelligence patent applications, we divided the samples into a treated group and a control group, and we took the control variables in Model 1 as the matching criteria using the 1:1 nearest neighbor matching method with put-back.
Figure 1 presents the kernel density plots of propensity scores for the treated and control groups before and after PSM matching. We observed that prior to matching, the propensity score distributions of the two groups differed substantially. After matching, however, the curves aligned more closely, with a significantly increased overlap area. This suggests that the covariates were well-balanced between the treated and control groups in the post-matching sample. Moreover, the results of the balance test show that the standardized deviations of the covariates after matching were less than 8%, and the results of the t-test did not reject the null hypothesis that the coefficients of the treated group and the control group were not significantly different. This shows that the characteristic difference between the experimental group and the control group was eliminated to a large extent, and the matching effect was good. The t-value of the average treatment effect (ATT) after matching was 34.29, which was significant at the 1% level, indicating that matching was effective. We used the matched samples to conduct regression analysis on Model 1 again, and the test results of the matched samples are shown in Column (1) of
Table 6. The regression coefficient of AI was significantly positive. The results show that the conclusions of this study are still robust when the self-selection bias problem is mitigated.
Second, we further used the Heckman two-stage model to control the estimation bias of the sample selection problem. In the first stage, the probit model was used to estimate the probability of whether enterprises carry out green collaborative innovation.
In order to ensure that the inverse Mills ratio (IMR) was uncorrelated with the random disturbance term of the main regression, it was necessary to introduce exogenous variables into the first-stage regression model. The existing research has found that executives with overseas backgrounds have been exposed to stricter environmental regulations (such as EU carbon tariffs and US ESG standards) and have a deeper understanding of the sustainable development concept. This experience drives companies to incorporate green collaborative innovation into their strategies to meet international standards and market demands [
49]. However, executives with overseas backgrounds do not have a direct and obvious impact on the application degree of artificial intelligence, so it largely meets the independence and exclusivity assumptions for exogenous variable selection. To this end, referring to Li et al. [
50], we selected the proportion of executives with an overseas background (Overseas) as the exogenous variable, ran the regression together with the control variables above, and calculated the inverse Mills ratio (IMR).
Column (2) of
Table 6 reports the first-stage probit regression results. The regression coefficient of Overseas was found to be 0.1541, and it was significant at the level of 5%. This shows that Overseas is highly correlated with whether listed companies conduct green collaborative innovation, which passes the test of weak instrumental variable and meets the selection conditions of exogenous variables. In the second stage, we introduced the inverse Mills ratio (IMR) into the baseline regression model to mitigate sample selection bias caused by the non-random behavior of firms. Column (3) of
Table 6 shows the regression results after considering the sample selection bias. It can be seen that after adding IMR, the regression coefficient of AI is still significantly positive at the 1% level. The results show that the findings of this study remain robust after controlling for the sample selection problem.
5.3.3. Reverse Causality Test
In addition to the endogeneity problems caused by missing variables and the selection bias mentioned above, this study may also have reverse causality problems. That is, firms with a higher level of green collaborative innovation may be more willing to apply artificial intelligence technology. This reverse causality can also bias the estimated coefficients. As a result, we used the instrumental variable method to further mitigate the endogeneity problems caused by reverse causality, missing variables, and selection bias, thereby strengthening the credibility of the benchmark conclusions.
First of all, referring to Lewbel [
51], Choi et al. [
45], Jin and Yu [
46], and Cao et al. [
47], we selected the mean of the artificial intelligence technology application degree of other firms in the same industry (AI_ind), the mean of the artificial intelligence technology application degree of other firms in the same province (AI_pro), and the third power of the artificial intelligence deviation (AI_iv) as instrumental variables for testing. The specific logic was as follows: (1) the application degree of artificial intelligence at the industry level and province level may significantly affect the firm’s own emphasis on artificial intelligence technology, but it will not have a direct impact on the green collaborative innovation behavior of a single enterprise, so this instrumental variable basically meets the requirements of relevance and externality. (2) According to Lewbel [
51], using the third power of artificial intelligence deviation to construct instrumental variables can help eliminate endogeneity bias to a certain extent.
Columns (4) and (5) in
Table 6 report the regression results of 2SLS. It can be found that in the first-stage regression, the coefficients of AI_ind, AI_pro, and AI_iv are all significant at the 1% level. This result is consistent with the theoretical expectation and supports the correlation hypothesis for instrumental variables. At the same time, based on the Kleibergen–Paap rk LM test, the null hypothesis of “insufficient recognition of instrumental variables” is significantly rejected, which confirms that the model does not have the problem of insufficient recognition. The Cragg–Donald Wald F statistic is 4314.569, significantly exceeding the standard critical value of the Stock–Yogo weak instrument–variable test. This shows that the instrumental variables used exclude weak instrumental variables. The Hansen J statistic is 4.179, and the corresponding
p-value is 0.1237, indicating that the instrumental variables used are relatively exogenous, and there is no evidence of over-identification issues. In addition, in the second-stage regression, the regression coefficient of AI is significantly positive at the 1% level, once again verifying that the application of artificial intelligence technology can promote the green collaborative innovation of firms.
5.3.4. Placebo Test
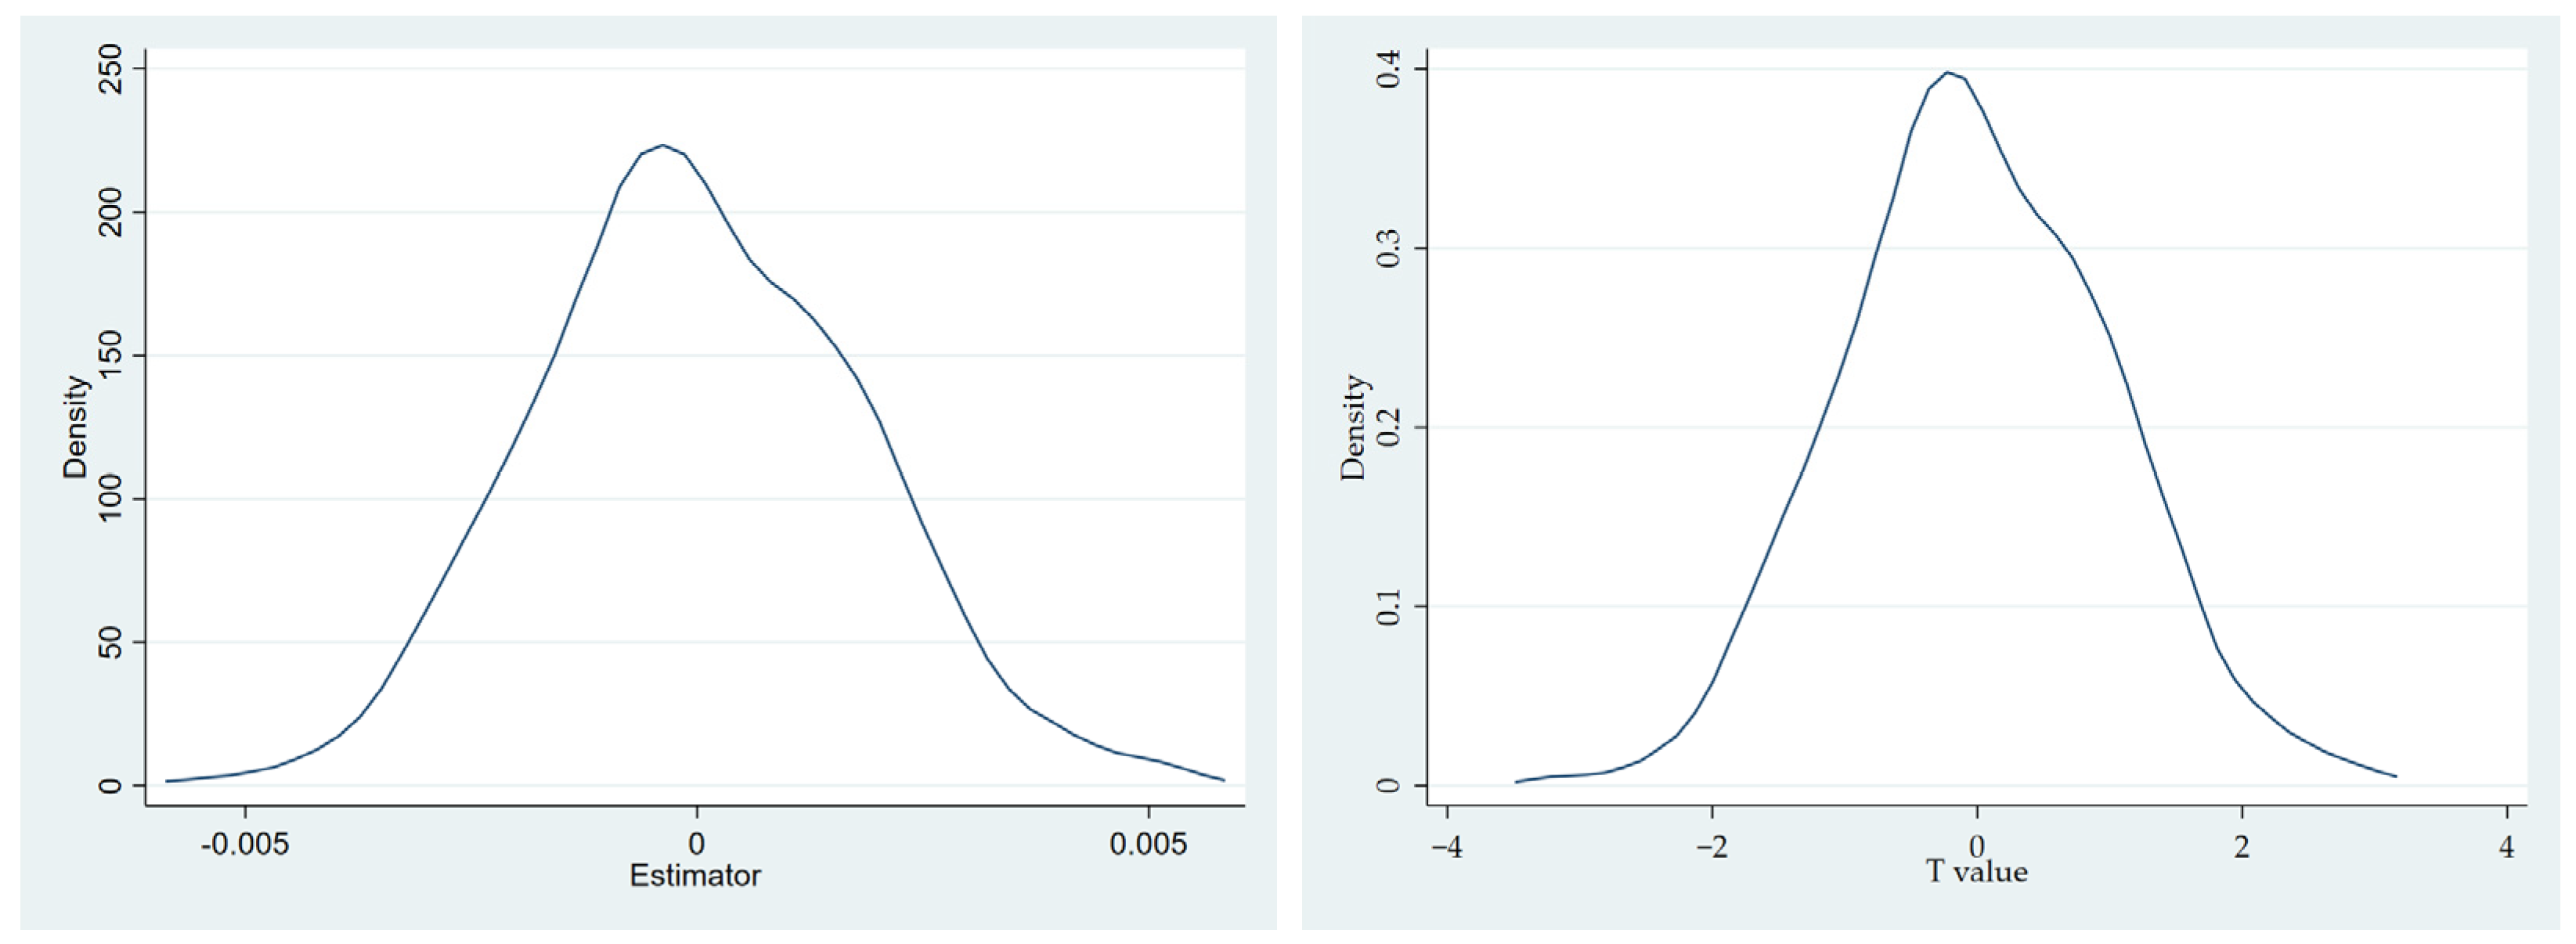
To further eliminate potential interference from unobservable factors in the estimation results, we conducted a placebo test. Specifically, if the positive impact of artificial intelligence (AI) on corporate green collaborative innovation (GCI) were driven by unobservable factors, such an effect would persist even when artificial intelligence indicators were randomly assigned to target firms. Therefore, we randomly assigned the annual artificial intelligence indicators to listed companies in the sample and then repeated the regression of artificial intelligence (Random_AI) and corporate green collaborative innovation (GCI) in random order 1000 times according to Model 1. The results of the placebo test are shown in
Figure 2. As illustrated in the left panel of
Figure 2, the regression coefficients derived from the randomized simulations exhibited a normal distribution centered around zero, and the absolute values of these coefficients were consistently smaller than the empirically observed coefficient of 0.1193 (see Column (4) in
Table 3). Furthermore, the right panel of
Figure 2 reveals that only a minimal proportion of the regression coefficients were statistically significant (either positive or negative). These findings indicate that the virtual treatment effect constructed in this study does not exist, which fully indicates that the conclusion that the application of artificial intelligence technology can significantly improve the level of enterprise green collaborative innovation is not caused by other unobservable factors. This further validates the robustness of our findings.
5.4. Robustness Test
5.4.1. Changing Variable Measurement Methods
For the possible variable measurement bias problem, on the one hand, we changed the measurement method of the dependent variable and used the total number of green patent grants jointly applied by listed companies and other entities such as enterprises, universities, and scientific research institutions to measure the green collaborative innovation of enterprises (GCI1). The regression results are shown in
Table 7. The coefficients of AI are all positive and significant at the 1% level, supporting the conclusions in the baseline regression.
On the other hand, we replaced the measurement method for the independent variable. First, referring to Islam et al. [
41] and Huang et al. [
15], we used the penetration of industrial robots at the firm level to measure the artificial intelligence application degree (AI1). Second, referring to Chen et al. [
43], Song et al. [
14], and Qu and Jing [
44], we employed text analysis methods to extract the number of artificial intelligence keywords from listed firms’ annual reports. We used a natural logarithm (number of artificial intelligence keywords + 1) to measure the application degree of artificial intelligence technology in the firm (AI2). Specifically, the selection of keywords refers to artificial intelligence terminology from Chen and Srinivasan [
52], AI industry reports by Ping An Securities and Shenzhen Forward-Looking Industry Research Institute, and the AI vocabulary list provided by the World Intellectual Property Organization (WIPO). Through manual screening, we initially identified 52 seed words. Using Word2vec technology and the Skip-gram model, we trained these seed words along with textual materials from annual reports and patent documents as corpora. For each seed word, we identified 10 semantically closest terms based on cosine similarity between the seed word and other vocabulary. Subsequently, we removed duplicate terms, AI-irrelevant words, and low-frequency terms. Finally, this process yielded a total of 73 words to form the artificial intelligence dictionary for this study. The specific artificial intelligence dictionary is shown in
Appendix A,
Table A1. Third, we also used the word frequency of “artificial intelligence” in the MD&A section of the annual report to re-measure the application degree of artificial intelligence technology in enterprises (AI3). The regression results are shown in
Table 8. It can be found that the results did not change substantially, which proves the robustness of the benchmark conclusion.
5.4.2. Hysteresis Effect
Since the impact of artificial intelligence on green collaborative innovation may take more than 1 year to emerge, we treated AI as lagging for one period and multiple periods. As can be seen from Columns (1)–(3) in
Table 9, the coefficients of L_AI, L2_AI, and L3_AI are all significantly positive. This not only verifies the robustness of the conclusion, but also shows, to a certain extent, that the promoting effect of artificial intelligence on enterprise green collaborative innovation has not only a short-term impact, but also a long-term impact.
5.4.3. Adding Fixed Effects and Adjusting the Clustering Level
In view of the possible model setting bias in this study, we added fixed effects and adjusted the cluster level as follows. (1) Increasing industry × year fixed effect and province × year fixed effect. Based on the original controls for firm fixed effects and year fixed effects, we further added the industry × year fixed effect and province × year fixed effect to control the impact of time-varying unobservable factors at the industry and provincial levels. (2) Adjusting the clustering to the enterprise level. The previous estimates reported results with standard errors clustered at the industry-year level, which, to some extent, captured both industry-specific differences and annual shocks, thereby avoiding underestimating standard errors. However, since the data on artificial intelligence and corporate green collaborative innovation are both at the firm level, we employed firm-level clustered standard errors to more accurately reflect the variability of the estimated coefficients. This method better handles the correlation within the cross-sectional dimension or the time-series dimension. As can be seen from Columns (4)–(6) in
Table 9, the coefficients of AI are all significantly positive. This indicates that the findings of this study remain robust.
5.5. Mechanism Analysis
According to the previous theoretical analysis, we believe that artificial intelligence can promote enterprise green collaborative innovation by reducing transaction costs and optimizing the labor force structure. Referring to Jiang [
53], we focused on the impact of artificial intelligence on these two paths and built the following model to test the action mechanism:
where M
i,t represents the mediating variable, including the transaction cost and labor force structure.
5.5.1. Mechanism I: Reducing Transaction Cost
In order to verify research hypothesis H2, referring to Collis and Montgomery [
54], we used the proportion of intangible assets in the total assets to measure transaction costs (Cost1). To enhance the reliability and robustness of the conclusions, we also employed the ratio of the total sum of fixed assets, construction in progress, intangible assets, and long-term prepaid expenses to the total assets as a measure of transaction costs (Cost2) [
55].
The results in Columns (1) and (2) of
Table 10 show that the application of artificial intelligence technology can significantly reduce enterprise transaction costs. Moreover, the existing research shows that due to bounded rationality, opportunism, and asset-specific characteristics of green innovation, the process of green collaborative innovation generates transaction costs [
36]. Lower transaction costs are the key to improving the efficiency and effect of green synergy [
35]. Therefore, the empirical results of this study support Hypothesis H2, indicating that the application of artificial intelligence technology helps firms reduce transaction costs, thus promoting green collaborative innovation.
5.5.2. Mechanism II: Optimizing Labor Force Structure
In order to verify research hypothesis H3, referring to Dou et al. [
56] and Zhang and Peng [
57], we used the ratio of the number of employees with Master’s degrees and above to the total number of employees to measure the labor structure of a firm (Labor1). To enhance the reliability and robustness of the conclusions, we additionally measured the labor force structure using the proportion of the high-skilled workforce to the total number of employees (Labor2). Specifically, we categorized the firm workforce into six groups: production workers, administrative and support staff, technical personnel, marketing and sales personnel, financial personnel, and others. The proportion of high-skilled labor (including technical, marketing/sales, and financial personnel) to the total number of employees was then calculated [
58].
The results in Column (2) of
Table 10 show that the application of artificial intelligence technology can significantly optimize the labor structure. The existing literature confirms that high-quality human capital is key to knowledge accumulation and technological innovation [
59,
60]. When a firm has higher-quality human capital, it can improve the efficiency of understanding green technology’s nature and the accuracy of innovation decision-making, thus improving the interaction efficiency with other collaborative innovation subjects [
61]. Moreover, green collaborative innovation is essentially a dynamic reconstruction process of a multi-agent value network. High-quality human capital can significantly improve the operational efficiency of innovation networks by shaping trust relationships and optimizing collaboration models [
62,
63]. In addition, Alfalih and Hadj [
64] pointed out that high-quality human capital contains stronger environmental awareness, which is conducive to stimulating the demand for green products, thus promoting the green collaborative innovation of enterprises. Therefore, the empirical results of this study support Hypothesis H3, indicating that the application of artificial intelligence technology helps optimize the labor structure and improve the quality of human capital, thus promoting green collaborative innovation.
5.6. Further Analysis
5.6.1. Green Investor Entry, Artificial Intelligence, and Green Collaborative Innovation
As a special category of institutional investors, when selecting investment objects, green investors consider whether the project conforms to environmental testing standards, pollution control effects, and ecological protection as important preconditions [
65]. As a fund investor taking into account environmental and social responsibility, a green investor comprehensively considers multiple performances, such as economic, social, and environmental performance, in the investment process. They play a strong supervisory and governance role in the process of enterprise development, which helps to achieve the dual effect of economic benefits and environmental protection [
66]. According to the resource dependence theory and stakeholder theory, the entry of social capital with green investment preference into enterprises can provide solid capital support for enterprises to effectively carry out high-quality green collaborative innovation [
67]. More importantly, green capital has the attribute of long-term investment, which helps to reduce the risk of green technology transformation, promotes enterprises to fulfill their green governance obligations, and strengthens the willingness for green collaborative innovation. In addition, green investor entry can influence the green innovation decisions of the management through the direct decision of “voting with hands” and the indirect intervention of “voting with feet”, thus increasing the possibility and initiative of enterprises to carry out green collaborative innovation activities and promoting the connection between AI R&D goals and the SDGs [
68]. Based on this, we expected that green investor entry can strengthen the positive effect of artificial intelligence on green collaborative innovation.
In order to identify the moderating effect of green investor entry on the relationship between artificial intelligence and green collaborative innovation, green investor entry (Greninvest) and the interaction term (Greninvest × AI) were added to Model 1, where Greninvest was the logarithm of the number of green investors plus 1 [
69]. Column (1) of
Table 11 reports the regression results of the moderating effect of green investor entry. It can be seen that the coefficients of AI and Greninvest × AI are significantly positive at the level of 1%. This means that green investor entry can significantly enhance the promoting effect of artificial intelligence on green collaborative innovation.
The uneven regional economic and sociocultural development levels in China have led to significant disparities in marketization degrees and legal environments across different regions. Green investors exhibit substantial variations under these distinct external conditions. To further investigate how the moderating effect of green investor entry changes under different economic conditions and regulatory environments, we employed the marketization index and legal environment index developed by Wang Xiaolu et al. (data sourced from the China Provincial Marketization Index Database) to measure regional marketization levels and legal regulatory enforcement. Samples were categorized based on the industry–year medians.
As shown in Columns (2) and (3) of
Table 11, the coefficients of Greninvest × AI are significantly positive at the 5% level, with the coefficient in the high marketization group being significantly higher than that in the low marketization group (validated by between-group differences tests). This indicates that the positive moderating effect of green investor entry on the relationship between artificial intelligence and green collaborative innovation is more pronounced in regions with higher marketization levels. A plausible explanation is that compared to low-marketization regions, high-marketization regions possess more efficient factor mobility mechanisms. Price signals and competitive mechanisms enable rapid alignment between green technology innovation demands and capital supply, thereby better guiding green investors to prioritize funding for AI-driven green collaborative innovation projects.
Columns (4) and (5) of
Table 11 reveal that the coefficients of Greninvest × AI are also significantly positive at the 5% level, with the coefficient in the high legal regulatory group significantly exceeding that in the low legal regulatory group (validated by between-group differences tests). This suggests that the positive moderating effect of green investor entry is further amplified in regions with high legal regulations. The underlying rationale lies in the fact that regions with high legal regulations typically establish clearer property rights definitions and infringement accountability mechanisms. Such legal certainty alleviates green investors’ concerns about technology plagiarism or patent disputes, encouraging them to fund high-risk, long-cycle AI-driven green collaborative innovation initiatives. Additionally, high legal regulations facilitate complete commercialization chains for technological achievements. Green investors can leverage mechanisms such as patent pledge financing and technology licensing to accelerate the application of artificial intelligence in green collaborative innovation fields.
5.6.2. CEO Openness, Artificial Intelligence, and Green Collaborative Innovation
CEO openness refers to a CEO’s characteristics of actively changing the current situation of the organization, pursuing diversity, and being willing to explore new governance systems and strategic directions [
70]. In general, CEOs with high openness are willing to accept new ideas, actions, and experiences and actively explore innovative activities [
71]. Therefore, CEOs with higher openness are more likely to accept the open innovation paradigm and more actively absorb other innovators to carry out collaborative innovation, which helps to enhance the willingness of multiple partners to carry out green collaborative innovation [
72]. In addition, CEO openness can reduce opportunistic and short-sighted behaviors in cooperation, enhance the willingness of external partners to maintain long-term cooperation, and help enterprises establish a stable and close cooperative relationship with green partners [
10]. Based on this, we expected that a high level of CEO openness can strengthen the positive effect of AI on green collaborative innovation.
In order to identify the moderating effect of CEO openness on the relationship between artificial intelligence and green collaborative innovation, CEO openness (Open) and interaction term (Open × AI) were added to Model 1. Referring to Datta et al. [
70] and Gal [
71], we used the CEO’s education level, CEO’s age, and CEO’s tenure to measure CEO openness (Open). Column (1) of
Table 12 reports the regression results of the moderating effect of CEO openness. It was found that the coefficients of AI and Open × AI were significantly positive. This means that the higher the degree of CEO openness, the more significant the promoting effect of artificial intelligence on green collaborative innovation.
The unbalanced level of regional economic, social, and cultural development in China leads to great differences in the degree of marketization and the legal environment in different regions. CEO openness varies greatly in different external environments. To identify how the moderating effect of CEO openness changes under distinct regulatory environments or economic conditions, we employed the marketization index and the legal institutional environment index developed by Wang Xiaolu et al. for analysis and categorized samples based on the industry–year medians.
According to Columns (2) and (3) of
Table 12, the coefficient of Open × AI is significantly positive only in the high-marketization group, with the coefficient in this group being significantly larger than that in the low-marketization group (validated by between-group differences tests). This indicates that in regions with higher marketization levels, CEO openness plays a more pronounced positive moderating role in the relationship between artificial intelligence and green collaborative innovation. Possible reasons are described below. (1) Highly marketized regions typically feature intense competition, where competitive pressures compel enterprises to adopt differentiated innovation pathways. CEOs with greater openness are more inclined to break away from traditional technological path dependencies and drive the cross-integration of artificial intelligence with green collaborative innovation. (2) Consumers and enterprises in high marketization regions are more willing to pay for green products/services, and CEOs with greater openness can keenly perceive changes in market demand and apply artificial intelligence technology to green collaborative innovation. (3) In addition, these regions often feature dense innovation networks (e.g., technology parks, industry–university–research alliances), enabling CEOs with greater openness to establish cross-sector collaborations more easily.
Columns (4) and (5) of
Table 12 reveal that the coefficient of Open × AI is significantly positive only in the high legal regulatory group, with the coefficient in this group being significantly larger than that in the low legal regulatory group (validated by between-group differences tests). This suggests that the positive moderating effect of CEO openness is further amplified in regions with high legal regulations. The key explanations are as follows. (1) High legal regulations reduce uncertainty in innovation, thereby creating strategic trial-and-error space for highly open CEOs. This institutional environment enables CEOs with greater openness to boldly promote cross-domain integration between artificial intelligence and green technologies. (2) Regions with high legal regulations establish secure boundaries for technology-sharing through intellectual property protection and antitrust regulations. Within such governance parameters, open-minded CEOs may be more proactive in advancing AI-driven green collaborative innovation initiatives.
5.6.3. Heterogeneity Test
The impact of artificial intelligence on corporate green collaborative innovation may be constrained by internal and external factors, such as macroeconomic uncertainty, firm size, and the nature of firm ownership. First, uncertainty has become a defining feature of the current global economic development. Under varying levels of macroeconomic uncertainty, corporate strategic orientation and resource allocation capabilities undergo dynamic adjustment, which may lead to differential effects of artificial intelligence on green collaborative innovation. Second, there are differences in the application degrees of artificial intelligence and the development needs of green innovation in enterprises of different sizes, so the impact of artificial intelligence on green collaborative innovation is heterogeneous in terms of enterprise size. Third, state-owned enterprises (SOEs) and non-SOEs differ in management models and innovation decision-making due to their distinct ownership structures, which may lead to different effects of artificial intelligence on improving enterprise green collaborative innovation. Accordingly, we conducted a heterogeneity analysis on the relationship between artificial intelligence and green collaborative innovation based on three perspectives: macroeconomic fluctuations, firm size, and nature of firm ownership. The heterogeneity test results are presented in
Table 13.
Regarding macroeconomic uncertainty, we measured it using the annual arithmetic average of China’s economic policy uncertainty index developed by Baker et al. [
73]. The sample was divided into high and low macroeconomic uncertainty groups based on the median value. Columns (1) and (2) show that while AI coefficients remain significant in both groups, the coefficient for the high macroeconomic uncertainty group is significantly larger than that of the low macroeconomic uncertainty group (validated by between-group differences tests). This suggests that the promoting effect of artificial intelligence on green collaborative innovation becomes more pronounced under higher macroeconomic uncertainty. A plausible explanation lies in uncertainty serving as a latent driver of corporate innovation. Specifically, in highly uncertain environments, firms exhibit stronger motivation to adopt technological transformations to enhance operational performance and secure sustainable competitive advantages. Macroeconomic uncertainty can drive the application of artificial intelligence technology and green collaborative innovation with the help of incentive and selection effects and then strengthen the positive correlation between artificial intelligence and green coordinated innovation.
For firm size, we divided the sample into large-scale firms and small-scale firms based on the industry–year medians of the total assets of firms and further examined the differences in the impact of artificial intelligence on green collaborative innovation at different sizes. Columns (3) and (4) reveal that the regression coefficients of AI are all significant, and the coefficient of the large-scale firm group is significantly larger than that of the small-scale firm group (validated by between-group differences tests). This indicates that artificial intelligence exerts a stronger promoting effect on green collaborative innovation in larger firms. The technology adoption theory provides a rationale: large resource-rich firms typically act as early adopters of emerging technologies, whereas small resource-constrained firms face limitations in fully leveraging artificial intelligence for green innovation. Moreover, large firms’ superior slack resources enhance their risk-bearing capacity and confidence in pursuing green collaborative innovation.
Concerning the nature of firm ownership, we divided the sample firms into state-owned firms and non-state-owned firms based on the enterprise ownership structure and further investigated the difference in the impact of artificial intelligence on green collaborative innovation under different property rights. Columns (5) and (6) demonstrate that while AI coefficients are significantly positive for both groups, the coefficient of SOEs significantly exceeds that of non-SOEs. This highlights that, compared with non-state-owned firms, the promoting effect of artificial intelligence on green collaborative innovation in state-owned firms is more significant. A plausible explanation is that developing artificial intelligence technology requires substantial hardware investments and specialized talent, imposing significant demands on financial resources and human capital. SOEs’ superior resource advantages and higher risk tolerance enable them to make complementary investments that amplify AI’s benefits for green innovation. Furthermore, SOEs’ inherent advantages in information access, policy support, and resource allocation provide more robust safeguards for green collaborative innovation activities.
5.6.4. Economic Consequences Test
The previous part confirms that artificial intelligence can promote green collaborative innovation by reducing transaction costs and optimizing the labor structure. We further explored the economic consequences. That is, we aimed to examine whether the promoting effect of artificial intelligence on green collaborative innovation can help firms reduce carbon emissions, improve ESG performance, and promote sustainable business practices. Hence, we constructed the following model to analyze economic consequences:
where Carbon
i,t represents the carbon emission level of a firm, which is measured by the ratio of the pollutant discharge fee or environmental protection tax paid by the firm to the total profit and ESG
i,t represents the ESG performance of the firm. We used the ESG rating of Huazheng to measure the ESG performance.
Table 14 reports the test results of the economic consequences analysis. It can be found in Column (1) that the coefficient of GCI is significantly negative at the 5% level. From an economic perspective, after controlling for other factors, each unit increase in a company’s green collaborative innovation level reduces its carbon emission levels by 0.05%. This finding demonstrates the positive role of artificial intelligence technology in the long-term development of enterprises. Artificial intelligence technology facilitates the enhancement of green collaborative innovation, which ultimately contributes to the reduction of corporate carbon emissions. In Column (2), the coefficient of GCI is significantly positive at the 1% level, which means that a higher level of green collaborative innovation can significantly improve ESG performance. From an economic perspective, after controlling for other factors, each unit increase in a company’s green collaborative innovation level improves its ESG performance by 5.17%. The findings demonstrate the positive role of artificial intelligence technology in corporate sustainable development. Artificial intelligence technology enhances enterprises’ ESG performance by promoting green collaborative innovation, ultimately fostering better sustainability outcomes. In conclusion, after the application of artificial intelligence technology promotes green collaborative innovation, it can significantly reduce corporate carbon emissions and improve ESG performance so as to help firms better achieve the sustainable development goals.
In addition, this study further analyzed the heterogeneity of the impact of green collaborative innovation on carbon emissions and the impact of green collaborative innovation on ESG performance. Specifically, we examined four types of heterogeneity: firm scale, firm property rights nature, sector to which the firm belongs, and regional environmental protection penalty enforcement. The grouping methods for firm scale and firm property rights nature are consistent with those in the previous section. Regarding the sector to which the firm belongs, we classified the samples into three categories, primary-sector firms, secondary-sector firms, and tertiary-sector firms, for testing based on the International Standard Industrial Classification of All Economic Activities and the Chinese National Economic Industry Classification System. Meanwhile, we used the number of environmental administrative penalty cases in each province to measure the regional environmental protection penalty enforcement and group them according to the industry–year medians. The results of the heterogeneity test are shown in
Table 15 and
Table 16.
As shown in Columns (1) and (2) of
Table 15, compared with small-scale firms, green collaborative innovation has a more significant inhibitory effect on the carbon emissions of large-scale firms. The possible reason for this result is that large-scale firms are more willing to assume social responsibilities and have stronger capabilities for green collaborative innovation. Moreover, compared with small firms, large-scale firms have resource advantages and can increase green R&D investments, actively carry out green collaborative innovation, etc., thus making it easier to reduce carbon emissions.
As shown in Columns (3) and (4) of
Table 15, compared with non-SOEs, green collaborative innovation has a more significant inhibitory effect on the carbon emissions of SOEs. The possible reason for this result is that, compared with non-SOEs, SOEs can obtain more government support and resources, which is conducive to their implementation of green collaborative innovation and environmental policies, and they can more effectively play the inhibitory role of green collaborative innovation on enterprises’ carbon emissions.
As shown in Columns (5)–(7) of
Table 15, green collaborative innovation only has an inhibitory effect on the carbon emissions of secondary-sector firms. A possible explanation is that the secondary sector covers industry and construction, which are the main areas of energy consumption and carbon emissions. Its production process relies on a large amount of fossil energy, such as in industries including steel, cement, and chemicals, which have a large carbon emissions base. Green collaborative innovation can target these high-emission links and effectively reduce carbon emissions through technological improvement and management optimization. In contrast, the primary sector is mainly agriculture, and its carbon emissions mainly come from land use changes and agricultural activities, such as livestock breeding and fertilizer use. Its emission sources are scattered and difficult to manage centrally. The tertiary sector is mainly the service industry, with relatively low energy consumption. Its carbon emissions are mainly concentrated in energy use in office spaces, transportation, etc., and the overall emission scale is relatively small. Therefore, the impact of green collaborative innovation on these carbon emissions is relatively limited.
As shown in Columns (8) and (9) of
Table 15, green collaborative innovation has a more significant inhibitory effect on the carbon emissions of enterprises in regions with stronger environmental penalty enforcement. A possible explanation is that in regions with stronger environmental protection penalty enforcement, enterprises face a stronger impact of environmental costs, which forces more enterprises to increase green R&D investments and actively carry out green collaborative innovation to reduce carbon emissions. Moreover, in regions with stronger environmental protection penalty enforcement, enterprises are more inclined to improve environmental performance through green collaborative innovation to achieve carbon emission reduction, thereby obtaining innovation compensation and market competitiveness.
According to Columns (1) and (2) of
Table 16, green collaborative innovation demonstrates a more significant enhancement effect on ESG performance in large-scale firms compared with small-scale firms. This outcome may arise because large firms tend to improve their ESG performance to gain legitimacy. Relative to smaller firms, large firms face greater public scrutiny and broader stakeholder engagement. The need to effectively balance diverse interests and formulate key responses to meet stakeholder demands drives them to more actively adopt green collaborative innovation to comply with ESG standards.
According to Columns (3) and (4) of
Table 16, green collaborative innovation exhibits a stronger promoting effect on ESG performance in SOEs. A potential explanation lies in SOEs’ dual focus: beyond profit generation, they bear social responsibilities, including addressing wealth inequality, labor disputes, and environmental protection. Their institutional characteristics enable swifter responses to policy guidance and government signals. When national initiatives promote ESG and sustainable development, SOEs consequently demonstrate stronger motivation to leverage green collaborative innovation for ESG advancement.
Columns (5)–(7) of
Table 16 reveal that green collaborative innovation significantly enhances ESG performance in both secondary and tertiary sectors, with a more pronounced effect in the tertiary sector. This disparity may stem from fundamental industrial characteristics. The primary sector features extended production cycles and seasonal constraints, delaying the observable impacts of technological adoption. In contrast, the secondary and tertiary sectors benefit from shorter production cycles that facilitate quicker implementation of collaborative innovation outcomes. Furthermore, the social image and reputation of tertiary-sector firms are critical to their business development. Strong ESG performance enables enterprises to establish a positive social image while strengthening consumer trust and loyalty. In contrast, consumers of secondary-sector products tend to prioritize factors such as price, quality, and functionality, showing relatively lower concern for corporate ESG performance. Consequently, tertiary-sector enterprises exhibit greater motivation than their secondary-sector counterparts to enhance their ESG performance through green collaborative innovation, thereby securing societal recognition and support.
According to Columns (8) and (9) of
Table 16, green collaborative innovation demonstrates heightened effectiveness in improving ESG performance among enterprises located in regions with stringent environmental penalties. This phenomenon likely occurs because rigorous environmental regulations impose substantial compliance pressures. Potential violations risk severe consequences, including heavy fines and operational suspensions that threaten both financial stability and corporate reputation. Green collaborative innovation offers enterprises a dual solution: meeting environmental requirements while achieving sustainable development. Through collaborative green innovation with suppliers and partners, enterprises can jointly develop and implement eco-friendly technologies, processes, and products. This approach not only enhances ESG performance but also reduces environmental risks and regulatory penalties.
6. Conclusions and Police Implications
6.1. Conclusions
The new generation of information technology, artificial intelligence, and green environmental protection technology is becoming a new engine of economic growth. Through the application of artificial intelligence technology, the formation and development of new quality productivity are promoted, thus enabling the development of green and low-carbon industries. This is the key to promoting high-quality economic development. From the perspective of collaborative innovation, using the data of green patents jointly applied by Chinese A-share listed companies and other entities from 2010 to 2023, this study discusses the effect and mechanism of artificial intelligence on green collaborative innovation. The results show that (1) artificial intelligence has a promoting effect on green collaborative innovation. This conclusion is still valid after the endogeneity problem is alleviated and a robustness test is conducted. (2) The nonlinear relationship test suggests that threshold effects or diminishing returns of artificial intelligence on corporate green collaborative innovation have not yet occurred. (3) The mechanism test shows that the promoting effect of artificial intelligence on green collaborative innovation can be realized by reducing transaction costs and optimizing the labor structure. (4) The moderating effect analysis shows that green investor entry and CEO openness can strengthen the promoting effect of artificial intelligence on green collaborative innovation. This promoting effect is more pronounced in regions with higher marketization and stronger legal regulations. (5) The heterogeneity tests indicate that the positive impact of artificial intelligence technology application on green collaborative innovation is more significant in the case of high macroeconomic uncertainty, large-scale enterprises, and SOEs. (6) In addition, the promoting effect of artificial intelligence on green collaborative innovation helps firms reduce carbon emissions and improve ESG performance, promoting sustainable business practices. We further revealed that this promoting effect exhibits heterogeneity in different firm sizes, ownership types, the sectors to which the firm belongs, and the stringency of regional environmental penalties.
6.2. Policy Recommendations
According to the above conclusions, this study has the following policy implications.
For enterprises, firms should seize the opportunity of artificial intelligence technology and take advantage of artificial intelligence technology to promote breakthroughs in the key core technologies. Firstly, they can reduce transaction costs by building intelligent collaborative platforms. For example, a blockchain-powered supply chain management system can be deployed to automate environmental terms execution and technology matching processes through smart contracts, reducing cross-organizational negotiation and information search costs. Alternatively, an industry-level data sharing alliance can be established to realize secure collaborative analysis by using privacy-computing technology and reduce data flow barriers and compliance costs. Secondly, enterprises should actively integrate a variety of artificial intelligence technologies, combine different tools and algorithms such as machine learning, deep learning, knowledge graphs, and reasoning technology, enhance the ability to identify green innovation opportunities, allocate innovation resources, transform innovation strategies, and actively participate in green collaborative innovation. Finally, enterprises should also attach importance to the construction of human capital, constantly optimize the labor structure, enhance the learning and adaptation ability in the process of green collaborative innovation through high-quality human capital, improve the performance of green innovation, and accelerate the value transformation of artificial intelligence technology into green innovation.
The government, first of all, should promote the clarification of data property rights and improve the benefit distribution mode of green collaborative innovation. Secondly, in order to give full play to the positive role of the artificial intelligence technology application in green coordinated innovation, the government should intensify efforts to open up and share diversified knowledge resources, establish cross-regional and cross-industrial integration and interconnection mechanisms, and build data resource platforms for different industries and enterprises. It provides strong support for enterprises, parks, universities, research institutes, and green technology innovation alliances to drive green collaborative innovation through digital transformation. Finally, the government needs to formulate and implement long-term policies to support the artificial intelligence technology R&D and application and give innovation alliances sufficient time and resources to conduct technology trials, thus promoting green collaborative innovation. At the same time, the government can also introduce relevant policies, tax and fee cuts, subsidies, and other measures to increase the participation of financial institutions, intermediaries, and other organizations in green collaborative innovation.
6.3. Further Discussion
First, an extended discussion on ethical issues must be carried out. This study acknowledges the role of artificial intelligence in driving corporate green collaborative innovation but emphasizes the ethical risks inherent in its deployment. (1) Artificial intelligence technology relies on vast datasets for model training, which may involve privacy breaches of supply chain partners, consumer data, or environmental information (e.g., production process data, emissions monitoring records). For example, when optimizing green technology solutions via artificial intelligence, failure to anonymize sensitive partner data or obtain proper authorization could violate data compliance laws such as China’s Personal Information Protection Law, leading to legal disputes and eroding trust within the innovation ecosystem. (2) Algorithmic bias may compromise fairness in green resource allocation. If artificial intelligence models used to screen green technology suppliers or prioritize innovation projects embed biases (e.g., regional or scale-based discrimination), they risk exacerbating the “Matthew Effect” in environmental governance. To address this, enterprises should establish ethical review mechanisms, integrate fairness metrics (e.g., counterfactual fairness testing) during algorithm design, and enhance decision transparency through explainable artificial intelligence technology.
Second, an extended discussion on regulatory barriers must be conducted. The global regulatory landscape is dynamically tightening, posing three key challenges for businesses. (1) Cross-border data flow restrictions (e.g., China’s Data Export Security Assessment Measures) may hinder multinational corporations from consolidating global R&D data, limiting the generalizability of artificial intelligence models. (2) Certification barriers for environmental AI algorithms (e.g., the EU’s proposed “Green Algorithm” compliance audits) could increase technical implementation costs. (3) Intellectual property disputes (e.g., patent ownership of AI-generated green technology solutions) may dampen enthusiasm for cross-enterprise collaboration. These regulatory hurdles could delay the scaled application of artificial intelligence solutions, particularly creating a crowding-out effect for small and medium-sized enterprises.
Finally, an extended discussion on compliance strategies must be conducted. To balance green innovation with regulatory requirements, enterprises should adopt the following approaches: (1) implementing a compliance-by-design framework that embeds data minimization and anonymization modules at the artificial intelligence development stage and leverages federated learning for distributed data training; (2) proactively engaging in co-developing industry standards, such as collaborating on ethical guidelines for green AI algorithms to align regulations with technological progress; (3) establishing dynamic risk assessment systems to monitor AI-driven decisions’ environmental equity impacts on stakeholders (e.g., communities, suppliers), iteratively optimizing algorithms to enhance social responsibility. At the policy level, regulators should adopt a “regulatory sandbox” approach, enabling controlled testing of green AI applications to accelerate compliance verification.
6.4. Limitations and Potential Future Study Areas
Although this study provides a systematic exploration of the impact of artificial intelligence on green collaborative innovation, there remain several limitations that require improvement in future research. First, regarding the measurement of green collaborative innovation, we adopted the widely accepted metric of quantifying corporate green collaborative innovation levels through the quantity of jointly applied for green patents and the total number of green patent grants jointly applied for. Future studies could refine the classification of green patents based on the International Patent Classification (IPC) codes to enable deeper analysis of how artificial intelligence applications affect collaborative innovation in different types of green technologies.
Second, concerning the measurement of mediating variables, transaction costs were proxied using asset specificity [
54]. However, this indicator only reflects static characteristics of asset structure and fails to dynamically capture transactional frictions in green collaborative innovation. Future research could improve this by incorporating process-based metrics such as contract enforcement efficiency. Additionally, this study focused on validating the mediating role of labor structure optimization between artificial intelligence and green collaborative innovation; future investigations could explore both the direct impacts of artificial intelligence on the labor structure (e.g., job displacement effects) and the indirect influences (e.g., skill transformation), thereby further expanding the research on the interdisciplinary interaction of artificial intelligence and economics at the micro-enterprise level.
Third, this study primarily focused on verifying the direct effects of artificial intelligence on green collaborative innovation. Future studies could delve into the following: (1) heterogeneity in AI’s facilitative effects under varying intensities of data privacy protection; (2) dynamic relationships between algorithm fairness metrics and corporate ESG performance; (3) how the speed of AI technology iteration forces policy adaptation; (4) combining a spatial econometric model and a hierarchical network model, this paper explores the dynamic law of artificial intelligence technology on cross-regional innovation; and (5) identification of threshold effects of regulatory enforcement, thereby providing more nuanced guidance for policy formulation.


