Abstract
In the context of China’s accelerated “dual transition” towards industrial intelligence and green development, this paper investigates how local government decarbonization pressures affect urban industrial intelligence in China. Using the Low-Carbon City Pilot policy as a quasi-natural experiment, a staggered difference-in-differences approach and Causal Forest model reveal the following findings: (1) Local government decarbonization pressures significantly boost urban industrial intelligence. (2) Local government decarbonization pressures foster intelligent development by encouraging the introduction of intelligent policies, which motivate enterprises to adopt proactive strategies. Meanwhile, the pressures compel enterprises to engage in source-based environmental governance, resulting in a passive intelligent response. Together, these approaches enhance urban industrial intelligence. (3) Fiscal pressure negatively moderates the relationship between local government decarbonization pressures and urban industrial intelligence. (4) There is an inverted U-shaped relationship between openness to foreign trade and the Conditional Average Treatment Effect (CATE), while CATE is higher for cities with higher urban labor costs. (5) Finally, urban industrial intelligence effectively channels local government decarbonization pressures into measurable emission reductions. These findings have significant policy relevance for building a low-carbon, intelligent society.
1. Introduction
Carbon emissions have become a critical issue at the national level over the years, due to their contribution to local air pollution, acid rain, and climate change. In China, which is the world’s largest carbon emitter, the National Development and Reform Commission of China launched three rounds of Low-Carbon City Pilot (LCCP) policies in 2010, 2012, and 2017, as a critical step toward its national carbon goals. The cities involved in the LCCP are critical in setting appropriate emission targets, assessing emission indicators, and testing new policies to promote low-carbon industries and technologies to meet local needs. Consequently, local governments of these cities face intensified decarbonization pressures. However, balancing decarbonization with high-quality development remains a significant challenge. Recent studies highlight industrial intelligence—integrating big data analytics, AI, and automation across production processes to enable data-driven, autonomous decision-making and adaptive self-learning—as a promising solution for improving energy and environmental performance [1,2]. Given the pivotal significance of industrial intelligence in global technological competition [3,4,5], it is essential to explore whether local governments, under decarbonization pressure, will utilize it to simultaneously achieve decarbonization and high-quality development. Answers to this question provide policymakers with valuable insights for formulating effective low-carbon transformation strategies, thereby advancing high-quality development and addressing global climate imperatives.
Different from previous studies that focus on the effects of LCCP policies, this study employs the policy as an instrument of local governments’ decarbonization pressures, and examines how decarbonization pressures influence their behavior. Using panel data from 283 Chinese cities between 2007 and 2019, the LCCP policies are leveraged as a quasi-natural experiment, and a staggered DID specification and a Causal Forest model are employed to examine the impact of local government decarbonization pressures on urban industrial intelligence. The analysis reveals an increase of 1.96 industrial robots per 10,000 employees after the implementation of the policies, indicating that local government decarbonization pressures significantly boost urban industrial intelligence. Mechanism analysis shows that local government decarbonization pressures promote urban industrial intelligence by encouraging intelligent policies and enterprises’ source-based environmental governance.
Potential endogeneity concerns are addressed through several approaches. The parallel trends assumption is verified with a dynamic DID regression. Selection bias and unobserved heterogeneity are mitigated through the PSM-DID method. A series of robustness tests are conducted to ensure the reliability of the results. Placebo tests confirm that the findings are not driven by any time trends. Regressions are rerun with Callaway and Sant Anna’s [6] estimators, and additional checks are conducted by replacing the key explanatory variable to avoid bias caused by potential measurement error, and by controlling for confounding policies during the same period.
Additionally, China’s 1994 tax-sharing reform, which transferred major taxes like VAT to the central government, significantly cut local revenues [7]. However, local governments still must fulfill various high-quality development objectives, creating a mismatch between constrained revenues and escalating expenditures, highlighting the need to explore the moderating role of fiscal pressure on how local government decarbonization pressures impact urban industrial intelligence. The results indicate that fiscal pressure weakens the effect of local government de-carbonization pressures on urban industrial intelligence. Specifically, each additional unit of fiscal pressure reduces the effect by 1.89 industrial robots per 10,000 employees.
Econometric models excel in interpretability and robustness but often fail to capture heterogeneous treatment effects. Causal Forests, combining Random Forests with causal inference, address this limitation by uncovering nonlinear relationships and identifying individual effects across subgroups [8]. Thus, Causal Forests are further employed to identify variable importance and analyze heterogeneity. An inverted U-shaped relationship is revealed between openness to foreign trade and the Conditional Average Treatment Effect (CATE), while a positive correlation between labor costs and CATE is also identified. Lastly, the decarbonization impact of industrial intelligence is assessed and confirmed to be positive.
The research mainly contributes to the literature on the relationship between local government decarbonization pressures and urban industrial intelligence. Research on industrial intelligence has primarily examined its impact on employment [9,10,11,12,13,14,15], and a few studies have explored the decarbonization effects of industrial robots [1,16]. However, the extent and mechanisms of local governments’ role in the development of industrial intelligence, particularly under decarbonization pressures from higher-level authorities, remain understudied in the literature. The work of Zhang and Zhang [17] is the most closely related to this paper. They examined how environmental regulation induces firm digitalization. Different from them, the study focuses on the behavior of the local government, examining how local government characteristics influence policy effectiveness.
The second contribution is that enterprise environmental governance is differentiated into source-based and end-of-pipe governances, an area rarely touched on in existing studies. Sun et al. [18], closely related to this work, classified corporate environmental investments into source-based and end-of-pipe types, showing that green mergers and acquisitions only promote source-based investment. However, different from their study, this study explores how these two governance mechanisms mediate the impact of local government decarbonization pressures on urban industrial intelligence.
Lastly, this paper also contributes to the literature by applying the Causal Forest model, an advanced machine learning technique, to examine the heterogeneous effects of local government decarbonization pressures on urban industrial intelligence.
The remainder of this paper is organized as follows. Section 2 presents the hypotheses development, Section 3 describes the model setting and variable selection, Section 4 discusses the empirical results, Section 5 examines heterogeneity using Causal Forests, Section 6 tests the decarbonization effects of industrial intelligence, and Section 7 concludes with policy implications.
2. Hypotheses Development
2.1. China’s Pressure-Based System and Local Government Decarbonization Pressures
China’s unique “pressure-based system” is characterized by a quantitative task segmentation method with hierarchical breakdowns, a materialized multi-level evaluation system, and a political and economic reward–penalty mechanism [19]. This system uses evaluation outcomes as criteria for officials’ appointments and promotions, prompting various government levels to fulfill assigned tasks and targets under stringent evaluation-driven pressure [20].
While local governments face pressures from multiple sources, such as the top-down performance evaluation pressure exerted by higher-level governments on local governments, the horizontal competition pressure among neighboring cities, and the bottom-up demand pressure from citizens on local government, the core mechanism behind these pressures remains “politicization”—higher-level governments, particularly the central government and various Party committees, designate certain key development tasks as “political tasks” and motivate lower-level governments and functional departments to achieve these tasks through political promotions or economic incentives [21].
Following the economic reforms, economic development was established as a central political directive and became the foremost “political task”. Under the policy of prioritizing economic development, China has used GDP growth rates as a key indicator of political performance for decades, prompting local governments to engage in a “GDP-centered promotion tournament” driven primarily by promotion incentives. This tournament model provided local officials with strong incentives to promote local economic growth, contributing to what has been described as China’s “economic growth miracle”. However, it also resulted in significant resource wastage and environmental degradation, becoming one of the institutional foundations of China’s extensive growth model [19].
To shift away from an extensive economic growth model and reduce high carbon emissions, China has gradually introduced greenhouse gas emission reduction targets and the “dual carbon” strategy. As a result, carbon reduction has become an increasingly important “political task”. This change has brought about a rising number and greater weight of indicators related to energy conservation, emission reduction, and carbon reduction within the performance evaluation system, as the system evolves from a single-metric focus to a multi-goal framework, including sustainable economic development, social welfare improvement, social progress, and ecological civilization. It has ultimately resulted in growing decarbonization pressures for local governments.
2.2. Local Government Decarbonization Pressures and Urban Industrial Intelligence
Local government officials, driven by the prospect of promotion through achieving environmental governance goals, are incentivized to transfer their decarbonization pressures to other economic entities within their jurisdictions. Consequently, as key players in market economic activities and major sources of carbon emissions, enterprises become the primary recipients of these pressures. Furthermore, enterprises are central to driving industrial intelligence, with the transformation and upgrading of their production systems being crucial for industrial advancement and gaining technological leadership. Under the influence of local government decarbonization pressures, the enthusiasm and initiative of enterprises in pursuing intelligent development directly affect the progress and outcomes of overall urban industrial intelligence. Figure 1 illustrates the mechanisms through which local government decarbonization pressures affect urban industrial intelligence from the perspectives of both “proactive” and “passive” industrial intelligence of enterprises. Proactive industrial intelligence denotes enterprises’ voluntary adoption of intelligent practices in response to supportive policies, while passive industrial intelligence reflects compelled adoption under regulatory pressure to achieve emission reduction and sustainability goals.
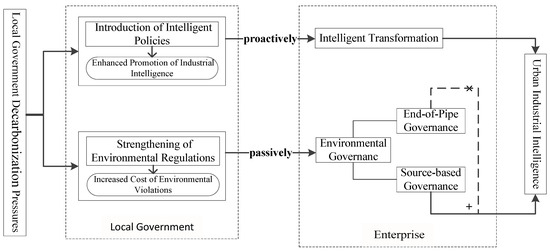
Figure 1.
Mechanism of local government decarbonization pressures affecting urban industrial intelligence.
First, under decarbonization pressures, local governments proactively promote various low-carbon technologies, including energy-saving and efficiency-enhancing technologies, non-fossil energy technologies, alternatives for fuels and raw materials, carbon capture, utilization, and storage technologies, and carbon sink technologies. Among these, intelligent technology is a crucial subset of energy-saving and emission-reduction technology. Recognizing that enhancing industrial core competitiveness through industrial intelligence has become a global consensus and trend, local governments prioritize intelligent technology as a primary low-carbon solution, thereby introducing more intelligent supportive policies, including financial incentives, policy consulting, expedited approvals, expanded financing, the designation of model intelligent enterprises, and industry–academia cooperation. These measures encourage enterprises to proactively adopt intelligent solutions to achieve decarbonization, ultimately contributing to urban industrial intelligence at the macro level.
Second, as suggested by the Porter Hypothesis [22], local government decarbonization pressures strengthen environmental regulations, raising compliance costs for enterprises and “forcing” them to decarbonize through internal environmental governance passively [22]. Some enterprises may pursue source-based governance, which primarily relies on intelligent products and technologies, to optimize production processes, while others may resort to lower-cost end-of-pipe governance by installing pollution control devices like desulfurization and dust removal systems [23]. However, in response to local governments’ long-term focus on ecological governance performance, an increasing number of enterprises are moving toward source-based governance to achieve decarbonization and avoid penalties, thereby advancing urban industrial intelligence.
Based on the above analysis, the following hypothesis is proposed:
H1:
Local government decarbonization pressures significantly promote urban industrial intelligence.
2.3. The Moderating Effect of Local Government Fiscal Pressure
Amid slowing economic growth, unsustainable land-based financing, and rising local debt, local governments in China are under increasing fiscal pressure.
Due to the constraints of short official tenures and the long investment recovery periods associated with industrial intelligence, local governments may exhibit shortsighted behavior in governance. This can manifest in a “race to the bottom” strategy, by reducing investments in environmental management and regulation to cut fiscal expenditures [24]. This approach indirectly lowers carbon reduction costs for highly polluting enterprises by diminishing their motivation to cut emissions. Consequently, the intended “passive” industrial intelligence transformation mechanism for enterprises becomes ineffective. This may even “crowd out” corporate investments in intelligent technologies [25], thereby hindering the advancement of industrial intelligence in urban areas. Hence, the following hypothesis is further proposed:
H2:
Fiscal pressure diminishes the positive effect of local government decarbonization pressures on urban industrial intelligence.
3. Model Setting and Variable Selection
3.1. Model Setting
As discussed above, local governments in low-carbon pilot cities typically face greater decarbonization pressures due to their role in demonstrating leadership in low-carbon development and their responsibility for policy innovation. Therefore, the LCCP policy is used as a quasi-natural experiment to construct variables that measure local government decarbonization pressures. A staggered DID model and a Causal Forest model are employed to investigate the impact of local government decarbonization pressures on urban industrial intelligence.
3.1.1. Staggered DID Model
3.1.2. Causal Forest Model
Traditional Random Forest models are ensemble learning methods based on decision trees and employ the bootstrap method for resampling with replacement to generate B training sets. Each training set trains a decision tree by minimizing Mean Squared Error (MSE), creating a “forest” of B trees to predict the target variable Y from feature set X. In this model, the output of a single decision tree is the average observed Y at the leaf node, and the final output of the Random Forest model is the average of all trees. Despite strong predictive capabilities, the traditional Random Forest model cannot directly estimate the average treatment effect for causal analysis.
The Causal Forest model enhances traditional Random Forests by incorporating them as an Adaptive Kernel Method within a Partially Linear Model framework for treatment effect estimation. Thereby, the Random Forest model is endowed with the capability for causal inference [26]. Compared to traditional Random Forests, the Causal Forest model introduces several differences. First, prediction objective is different: traditional Random Forests estimate Y, while Causal Forests, using “causal trees,” estimate causal effects. Second, the methods adopt different criteria for data partitioning. Traditional forests split nodes to minimize MSE, while Causal Forests maximize heterogeneity in treatment effects at each node split. Third, the model fitting approach differs. Traditional forests divide data into training and test sets. Causal Forests use an “honest” approach, splitting training data into subsets for tree construction and treatment effect estimation, reducing overfitting and bias. Compared to traditional econometric models, Causal Forests integrate the principles of Random Forests and causal inference, addressing treatment group selection bias and enabling the estimation of heterogeneity in experimental studies. This method demonstrates robust statistical properties, particularly in analyzing heterogeneous effects [8].
First, the Conditional Average Treatment Effect (CATE) in Causal Forests is represented as:
where denotes the target observed value for the treatment group, denotes the target observed value for the control group, and represents the conditional expectation of the difference between the treatment and control groups.
Subsequently, by analyzing the average treatment effects across various dimensions of cities, it is possible to more accurately explore the heterogeneous impact of local government decarbonization pressures on urban industrial intelligence with different characteristics, referred to as heterogeneous treatment effects (HTEs). By applying the Causal Forest algorithm to the covariate space of cities, the HTE estimates can be derived, as illustrated in Equation (3), to analyze the impact of LCCP policies.
where represents the treatment variable, which corresponds to the key variable of interest in this study; denotes the outcome variable, referring to the level of urban industrial intelligence; refers to the covariates, representing the set of control variables in this study. is the data-adaptive kernel formed by the machine learning algorithm. indicates the propensity scores for matching treated and control cities, following a uniform distribution between 0 and 1; represents the expected policy treatment effect for the studied cities under treatment and control conditions. The symbol -i signifies “out-of-bag” (OOB) prediction, meaning that is excluded from the calculation of .
Given the advantages of econometric models in interpretability, significance, and robustness, as well as their applicability in mechanism testing and model expansion, a staggered DID model is employed for baseline regression, mechanism analysis, and moderation effect analysis. Additionally, Causal Forests effectively capture sample heterogeneity, revealing complex nonlinear relationships and identifying individual effects across different subgroups. Therefore, Causal Forests are used for variable importance identification and subsequently conducts a heterogeneity analysis.
3.2. Variable Selection and Measurement
The selection and processing of specific indicators are outlined as follows:
3.2.1. Dependent Variable
The dependent variable, denoted UII, represents the level of urban industrial intelligence. Industrial robots, which combine AI (“software”) with production equipment (“hardware”), embody industrial intelligence; thus, their application effectively reflects the level of industrial intelligence. Utilizing industry-level industrial robot stock data from IFR on China, a city-level indicator of industrial robot penetration is developed, defined as the number of industrial robots per 10,000 employees, following Acemoglu and Restrepo [9], to quantify urban industrial intelligence across Chinese cities.
The construction process is as follows: Based on the old-to-new category correspondence table of China’s Industrial Classification for National Economic Activities, the industrial sub-sector classifications (two-digit codes) within the sample period were standardized according to the current “Industrial Classification for National Economic Activities” (GB/T 4754-2017). Based on the mapping between the “Industrial Classification for National Economic Activities” (GB/T 4754-2017), IFR industry classification, and the “International Standard Industrial Classification of All Economic Activities” (ISIC) Rev. 4, China’s industrial sub-sector data was matched with the IFR industrial robot stock data. This enabled the calculation of the industrial robot penetration rate for each city.
Specifically, the first step involves calculating the employment structure at the city level. IFR has provided annual data on industrial robots by different industries in China from 2006 onward. To avoid the confounding impact of industrial robot adoption on the labor market, the employment structure is determined based on the ratio of employment in each industrial sub-sector to the total employment in the city at the end of 2005. In Equation (4), represents the employment structure of industrial sub-sector j in city i, denotes the number of employees in industrial sub-sector j in city i for the year 2005, and refers to the total number of employees in city i for the year 2005.
The second step calculates the industrial robot penetration rate at the national level for each industrial sub-sector using IFR’s sector-specific industrial robot data and national-level employment data. Here, denotes the industrial robot penetration rate for industrial sub-sector j in year t, represents the number of employees in industrial sub-sector j in 2005, and indicates the stock of industrial robots in industrial sub-sector j in year t.
The third step calculates the industrial robot penetration rate for city i in year t by summing the products obtained from the previous two steps. Specifically, this is done by multiplying the employment structure of each industrial sub-sector j in city i by the corresponding national-level industrial robot penetration rate for that sub-sector in year t, and then summing these products.
3.2.2. Key Variable of Interest
The key variable of interest is denoted . represents a dummy variable indicating cities included in the low-carbon city pilot. A value of 1 is assigned if a city is designated as a pilot city, and 0 otherwise. equals 0 before the city is designated as a low-carbon pilot city, and 1 during and after the year of designation. The announcement of the second batch of low-carbon cities occurred in December 2012. Considering the lag in policy implementation, 2013 is used as the starting year for this batch of pilots. The start dates for the first and third batches of pilot programs are determined based on the dates of official document publication.
3.2.3. Control Variables
Drawing on the research of Cheng and Zhang [27], the control variables selected for this study are as follows:
- (1)
- Economic Development Level (lnpgdp): Economic development results from the advancement of productivity and technological progress, while technological progress itself requires economic development as support. More developed regions tend to accumulate more capital, technology, and talent than less developed regions, which are necessary factors for industrial intelligence and facilitate the enhancement of industrial intelligence levels. In this study, the logarithm of per capita GDP at constant 2007 prices is used to measure the level of regional economic development.
- (2)
- Population Density (population): A higher population density signals a more extensive local market, thereby increasing the potential appeal to investors. It also reflects a higher concentration of skilled professionals, which can stimulate regional learning effects. Increased investment and talent aggregation facilitate the innovation, influx, and application of emerging artificial intelligence technologies, thereby further promoting the improvement of regional industrial intelligence levels. This study measures population density by the number of people per unit area.
- (3)
- Labor Costs (wage): The weakening of China’s demographic dividend has led to rising labor costs. On the one hand, the increased labor costs may “crowd out” investments in artificial intelligence innovation and industrial intelligent equipment, thereby restricting the development of industrial intelligence. On the other hand, the increased labor costs may “push” regions to adopt industrial robots and other intelligent equipment to reduce labor expenses, which in turn promotes the advancement of industrial intelligence. In this study, average employee wages are used to measure regional labor costs.
- (4)
- Human Capital Level (human): High levels of human capital are fundamental for regional technological progress and intelligent innovation. This study measures human capital level by the ratio of population with a college diploma or higher to the total resident population.
- (5)
- Financial Development Level (finance): On the one hand, higher levels of financial development enable regions to supply sufficient capital to support the development of industrial intelligence, thus promoting its progression. On the other hand, such regions may allocate funds to sectors with shorter investment return cycles, potentially hindering the development of industrial intelligence. In this study, the ratio of year-end financial institution loan balances to GDP is used to measure the level of regional financial development.
- (6)
- Openness to Foreign Trade (open): On the one hand, regions with higher levels of openness are more likely to introduce advanced technologies, equipment, and production processes, which can enhance the development of industrial intelligence. On the other hand, such regions may direct funds to foreign markets, creating a “crowding-out effect” that reduces local investments in industrial intelligence, thereby hindering its progress. In this study, the ratio of total import and export values to GDP is used to measure the level of regional openness.
- (7)
- Industrial Development Level (industry): Regions with more advanced industrial development tend to have larger-scale industrial activity, which can complicate the transformation process and thus slow the progress toward industrial intelligence. This research measures industrial development level by the proportion of industrial value added to GDP.
- (8)
- Scientific Expenditure Level (science): Innovation activities such as artificial intelligence and process innovation are core drivers of industrial intelligence. Higher levels of regional scientific expenditure indicate greater investment in innovation, fostering a favorable innovation ecosystem. This, in turn, enhances regional innovation capacity and increases the potential for industrial intelligence development. The ratio of government financial science expenditure to GDP is used to measure the science expenditure level in the study.
The names, symbols, and measurement methods of the variables are summarized in Table 1.

Table 1.
Summary of variable definitions.
3.3. Sample Selection, Data Sources, and Descriptive Statistics
After excluding cities with significant data gaps, a panel dataset of 283 cities for the period 2007–2019 is compiled, considering the limited availability of industrial robot data.
Industrial robot stock data are obtained from the International Federation of Robotics (IFR), while city characteristics are obtained from the China City Statistical Yearbook and cities’ annual economic and social development reports. Table 2 reports summary statistics.
Table 2.
Summary statistics.
4. Empirical Results Analysis
4.1. Baseline Regression Analysis
Table 3 reports the baseline regression results. The coefficients of treat × post are all significantly positive at the 1% level. The industrial robot penetration increased by 1.96 after the implementation of the pilot program in Column 3, when city characteristics are controlled for. The coefficient suggests that the local government decarbonization pressures substantially promote the development of urban industrial intelligence.
Table 3.
Baseline results.
4.2. Parallel Trend Test and Placebo Test
4.2.1. Parallel Trend Test
One condition of the DID model to yield unbiased treatment effect is that the treatment and control groups satisfy the parallel trend assumption. This means that, prior to policy implementation, the industrial intelligence levels of the treatment and control groups should follow a similar trajectory, or alternatively, the coefficient of the core explanatory variable should not be statistically significantly different from zero. To test the condition, the event study method is employed for the parallel trend test, which can be represented as follows:
represents a set of dummy variables indicating the event years, where the value is 1 if city i is designated as a low-carbon city pilot in year t, and 0 otherwise. and denote individual and time fixed effects, respectively. Attention is focused on the coefficient , which captures the difference in industrial intelligence levels between pilot and non-pilot cities in year t following the implementation of the LCCP policy.
The coefficients of the above regression are presented in Figure 2. The coefficient estimates for most periods preceding the implementation of the LCCP policy are not significantly different from zero, and no significant trend is observed. However, after the implementation, the coefficient estimates are significantly greater than zero and show an increasing trend over time. This indicates that there were no significant differences in the levels of industrial intelligence between pilot and non-pilot cities prior to the policy implementation, confirming that the model satisfies the parallel trend assumption.
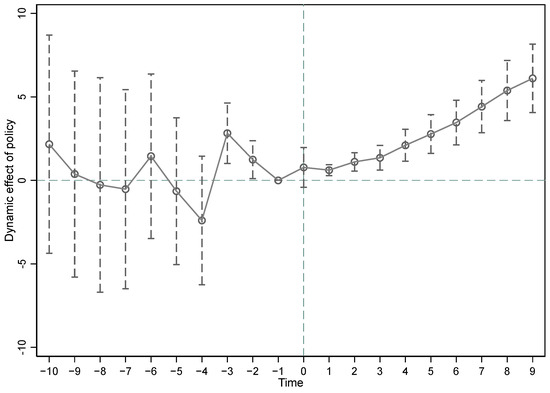
Figure 2.
Parallel trend test. Note: dots represent the estimated coefficients from Equation (7). The spikes denote the 95% confidence intervals.
Moreover, this study satisfies the three identification assumptions proposed by Callaway and Sant Anna [6]: (i) multiple time periods, (ii) variation in treatment timing, and (iii) the potential validity of the “parallel trends assumption” after conditioning on observed covariates. Therefore, to further mitigate the potential bias in the estimation from a staggered DID model, additional tests are conducted following the methodology proposed by Callaway and Sant Anna [6]. As shown in Table 4, the Pretrend Test fails to reject the null hypothesis, indicating that all pre-treatment values are equal to 0, thus passing the parallel trends test. Moreover, the Simple Average Treatment Effect is significantly positive at the 10% level, confirming the robustness of baseline results.
Table 4.
Pretrend test and Average Treatment Effect.
4.2.2. Placebo Test
(1) Temporal placebo test: To rule out the possibility that the observed differences in industrial intelligence development between the treatment and control groups are due to time trends, the implementation year of the LCCP policy is brought forward by 1, 2, 3, and 4 years to create pseudo policy timing indicators, denoted did_1, did_2, did_3, and did_4, respectively. The results, presented in Table 5, show that the coefficients for did_1, did_2, did_3, and did_4 are not statistically significant at the 10% level. This indicates that there are no systematic time trends differentiating the treatment and control cities, confirming that local government decarbonization pressures effectively promote urban industrial intelligence.
Table 5.
Temporal placebo test.
(2) City placebo test: To mitigate the influence of unobservable omitted variables on the baseline regression results, this section performs a placebo test by substituting cities in the treatment group. To maintain the same number of cities in the treatment group, 123 cities are randomly selected from the sample as a pseudo treatment group, with the remaining cities serving as the pseudo control group. This procedure estimates the impact of the LCCP policy on industrial intelligence for these placebo cities. The process is repeated 500 times, and the distributions of the estimated coefficients (the x-axis) and their corresponding p-values (the left y-axis) are visualized in Figure 3. The result indicates that the regression coefficients are centered around zero and follow a normal distribution, with 77.4% of results being statistically insignificant. The coefficient from the baseline regression (indicated by the vertical dashed line in the figure) falls in the upper tail of the distribution of placebo regression coefficients, making it a rare event in the city placebo test. This suggests that the baseline estimation results are unlikely to be driven by unobservable factors.
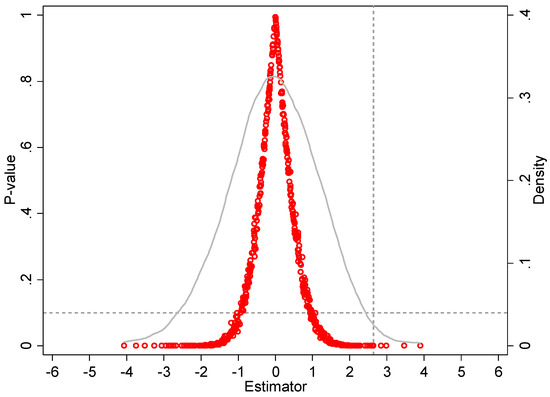
Figure 3.
City placebo test.
4.3. Robustness Test
4.3.1. PSM-DID Robustness Test
The selection of low-carbon pilot cities is likely non-random. To mitigate issues of omitted variable bias or pre-existing selection bias, this study employs the Propensity Score Matching (PSM) method within a PSM-DID framework for robustness testing.
First, covariates are chosen based on balance test results between the treatment and control groups in Table 6. The test results indicate that wage, human, finance, open, industry, and science can serve as covariates for Propensity Score Matching.
Table 6.
Balance test before matching.
In the second step, a logistic regression model and nearest-neighbor matching are applied for Propensity Score Matching, followed by a post-matching balance test. As shown in Table 7 and Figure 4, all covariates have a percentage of bias below 10%, significantly lower than the pre-matching percentage of bias values. At the 5% significance level, the null hypothesis is not rejected, indicating no systematic bias in covariate values between the two groups.
Table 7.
Balance test after matching.
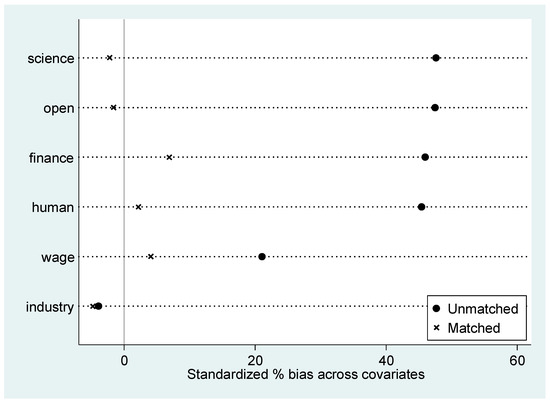
Figure 4.
Balance test after matching.
In the third step, a DID test is conducted based on the Propensity Score Matching results. Columns (1) and (2) in Table 8 present the baseline regression results without and with control variables, respectively, while column (3) shows the PSM-DID robustness test results. These findings indicate that decarbonization pressures from local governments significantly enhance urban industrial intelligence, further corroborating the conclusions of this study.
Table 8.
PSM-DID robustness test.
4.3.2. Confounding Policies
Intelligent manufacturing is a critical method for enterprises to upgrade their industrial intelligence. To accelerate China’s transition to intelligent and digitalized manufacturing, and to comprehensively advance the Made in China 2025 initiative, the Ministry of Industry and Information Technology (MIIT) released a series of announcements from 2015 to 2018, titled Announcement on the List of Intelligent Manufacturing Pilot and Demonstration Projects. Between 2015 and 2018, the MIIT issued a series of announcements titled List of Intelligent Manufacturing Pilot Demonstration Projects. These initiatives employed a phased approach, beginning with pilot projects and subsequently expanded, aiming to promote the development of industrial intelligence across the country.
To eliminate the potential confounding effect of the intelligent manufacturing demonstration projects on the results, an interaction term “whether the city has a pilot intelligent manufacturing enterprise (pilot)” and “post-policy implementation (implement)” is added into the baseline model for empirical testing. The interaction term takes the value of 1 if the city hosts pilot intelligent manufacturing enterprises and the year is greater than or equal to the policy implementation year; otherwise, it is set to 0. Additionally, the number of pilot intelligent manufacturing enterprises in city i during year t (variable quantity) is used to replace the interaction term to further verify the robustness of baseline results.
Column (1) of Table 9 reports the results after including the policy interaction term, and Column (2) presents the results after incorporating the number of pilot enterprises. The coefficients of the treat × post remain significantly positive at 1% levels, respectively. This indicates that, even after accounting for the confounding policy, local government decarbonization pressures still significantly promote urban industrial intelligence.
Table 9.
Robustness tests.
4.3.3. Replacing the Key Variable of Interest
Before 2013, the local government cadre evaluation system primarily relied weakly enforceable “soft target” and qualitative assessments, with a minimal level of quantitative evaluation. The evaluations focused largely on economic performance, while “environmental protection and ecological conditions” is merely a second-order indicator. Consequently, despite the central government’s introduction of numerous laws and regulations and establishment of a top-down environmental management system, the pressure for decarbonization created by the central government’s cadre evaluation system was insufficient. The lack of motivation hindered the effectiveness of relevant environmental policies at the local level.
In 2013, the Organization Department of the CPC Central Committee issued the Notice on Improving the Performance Evaluation of Local Party and Government Leaders. The Notice explicitly stressed the weight of environmental protection indicators, thereby signaling the central government’s commitment to carbon reduction and its policy priorities to local government officials. It marked a significant shift in the central government’s emphasis on local ecological and sustainable development capabilities.
Following the central government’s directives to reform the cadre evaluation system, local governments have progressively enhanced quantitative indicators for performance assessments, elevating environmental protection to a primary category alongside economic, social, and livelihood factors. This shift has notably increased the weight of environmental indicators, such as carbon emissions. With the release of the Notice, the focus of local government cadre evaluations shifted from economic performance to environmental protection and sustainable development. The change has established a direct link between environmental governance performance and officials’ career advancement, transforming decarbonization pressures on local governments from implicit to explicit.
Furthermore, since the Report on the Work of the Government serves as policy documents outlining the agendas of different levels of government, higher decarbonization pressures on a local government is reflected by more frequent mentioning of environmental protection and carbon reduction-related terms in its reports, indicating stronger governmental pressure in this regard.
To assess the impact of the explicit shift in decarbonization pressures on urban industrial intelligence with varying levels of decarbonization pressures, the interaction between the frequency of environmental and carbon reduction-related words in the Reports on the Work of the Government and the policy shift marking the explicit increase in decarbonization pressures (pressure × post2013) is used as the key variable of interest. The results in column (3) of Table 9 indicate that the coefficient of pressure × post2013 is significantly positive at the 1% level, indicating that the intensified decarbonization pressures have significantly accelerated urban industrial intelligence, corroborating the positive effect of decarbonization pressures on urban industrial intelligence.
4.4. Mechanisms
4.4.1. The Implementation of Intelligent Policy
The Report on the Work of the Government, presented annually at municipal People’s Congress meetings, outlines administrative agendas and summarizes achievements and sets economic, social, cultural, and environmental goals for the year. The frequency with which a task is mentioned serves as an indicator of its political priority. Local support for intelligent low-carbon technology is measured using the word count (promotion1) and frequency (promotion2) of industrial intelligence-related keywords in these reports. To control for confounding effects of national intelligent manufacturing policies, a binary variable pilot × implement indicating cities with intelligent manufacturing demonstration projects is included, as specified in column (1) of Table 9.
Panel A of Table 10 reports the results. The coefficients of treat × post reported in columns (1) and (2) are positive and significant. The Report on the Work of the Government includes 0.46 more industrial intelligence-related keywords after the pilot program, revealing that local government decarbonization pressures encourage the introduction of intelligent policies, which further promote the development of industrial intelligence.
Table 10.
Mechanism tests.
4.4.2. The Improvement of Enterprise Environmental Governance
The “Construction in Progress” section of listed enterprises’ annual reports details the expenditures for new project construction, upgrades, and major repairs, especially the environmental project investments. Due to limited data availability of small and medium-sized enterprises, following Sun, Sun, Wang and Wang [18], information for investment on environmental projects is collected from listed enterprises’ annual reports. These investments at the enterprise level are first categorized as total environmental governance investment (lninv), source-based investment (lninvpre), and end-of-pipe investment (lninvend) and then aggregated at the city level to examine the mechanisms of corporate environmental governance. (Note that source-based governance projects include projects related to green industry, clean and renewable energy, low-carbon and efficient energy use, efficient water resource utilization, and comprehensive resource utilization. End-of-pipe governance projects cover projects related to waste gas treatment, wastewater treatment, desulfurization and denitrification, solid waste management, and ecological restoration. A sample of 1750 cities at or above the prefecture level is finally obtained.)
Panel B of Table 10 reports the results. The coefficients of treat × post in columns (1) and (2) are significantly positive at the 1% level, while the coefficient in column (3) is statistically insignificant, suggesting that after the pilot program, source-based investment increases by 54.5%, with no significant impact on end-of-pipe investment. This indicates that local government decarbonization pressures influence urban industrial intelligence primarily through source-based governance, rather than through end-of-pipe measures, because source-based governance primarily leverages intelligent technologies, whereas end-of-pipe governance mainly depends on traditional control measures.
4.5. The Moderating Effect of Fiscal Pressure
As mentioned in the Section 1, fiscal pressure may negatively moderate the promoting effect of local government decarbonization pressures on urban industrial intelligence. This hypothesis is empirically tested in the subsequent analysis. (Note that while fiscal and decarbonization pressures may influence each other, this study does not seek to establish their causal relationship. Instead, it examines the moderating role of fiscal pressure on the effect of local government decarbonization pressures on urban industrial intelligence. The potential endogeneity between these pressures is acknowledged and offers a direction for future research.)
Following Liao and Liu [28], fiscal pressure is measured with the fiscal gap, defined as the difference between general public budget expenditures and revenues, divided by general public budget revenues. A larger fiscal gap indicates a higher level of fiscal pressure. In Table 11, the fiscal gap is interacted with treat × post to measure the heterogeneous effect of fiscal pressure. The coefficient of treat × post × fiscal_gap is significantly negative at the 1% level. Specifically, with each unit increase in the fiscal gap, the positive impact of local government decarbonization pressures on urban industrial intelligence decreases by 1.89 units of industrial robot penetration, which is consistent with the hypothesis that the local fiscal pressure is a constraint to the promotion of urban industrial intelligence.
Table 11.
The moderating effect of fiscal pressure.
5. Heterogeneity Analysis with Causal Forest
To examine heterogeneity in treatment effects, the Causal Forest model is employed to estimate CATEs across subpopulations. Variable importance is determined by the frequency and effectiveness with which each covariate is used for splitting, particularly when appearing at higher tree levels and contributing to variance reduction in treatment effect estimates. Based on this criterion, “openness to foreign trade” and “labor costs” are identified as the most influential factors. Their selection is further supported by theoretical relevance: openness reflects regional integration into global markets, while labor costs affect enterprises’ incentives for automation and industrial upgrading. These two dimensions are therefore used in subsequent subgroup analysis. The relationship between them and CATE is shown in Figure 5.
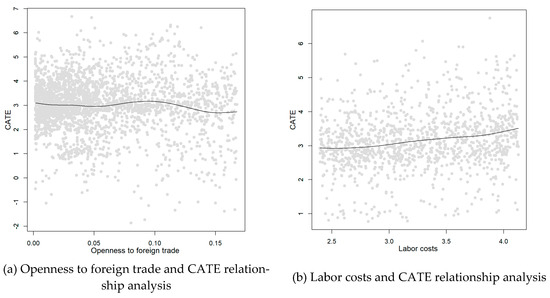
Figure 5.
Heterogeneity analysis results.
The relationship between openness and CATE follows an “inverted U-shaped” curve. One possible reason is that, at lower levels of openness, international trade boosts economic growth and promotes the introduction of intelligent technologies. However, as China’s trade scale expands, intensifying competition in international markets, external technological barriers, and growing challenges of radical innovation constrain further development of intelligent technologies [29], restricting the sustained progress of industrial intelligence.
The relationship between urban labor costs and CATE is positive. This may be due to the rising labor costs accelerating the substitution effect of industrial intelligence for labor [30], effectively “forcing” enterprises to adopt intelligent technologies.
6. Economic Impact Assessment: The Decarbonization
Facing the pressure to reduce carbon emissions, local governments promote industrial intelligence to reduce carbon emissions. Therefore, it is interesting to examine whether the carbon emission is lower after the pilot. The logarithms of carbon dioxide emissions (lnco2) and carbon dioxide emissions per unit area (lnco2_area) are used as the dependent variables. Following Zhou et al. [31], Lin and Xu [32], and Wang et al. [33], variables depicting economic development, population size, industrialization level, wage level, openness, and energy intensity are controlled for.
In Table 12, the coefficient on UII is statistically significant and negative, indicating that industrial intelligence effectively lowers urban carbon intensity.
Table 12.
The decarbonization effect of industrial intelligence.
7. Conclusions
This paper studies how local government decarbonization pressures have affected urban industrial intelligence. Employing a staggered DID approach, it is found that local government decarbonization pressures significantly promote urban industrial intelligence by encouraging local governments to implement intelligent policies while compelling enterprises to adopt source-based environmental management practices, and fiscal pressure moderates the effect negatively. A Causal Forest model reveals an inverted U-shaped relationship between openness to foreign trade and CATE, while labor costs show a positive correlation with CATE. Additionally, it is also confirmed that urban industrial intelligence effectively contributes to decarbonization.
Our results have the following policy implications. First of all, the central government’s performance appraisal system should be enhanced by incorporating specific indicators—such as carbon emission intensity, the share of renewable energy, and the proportion of green buildings—and by linking evaluation outcomes to low-carbon development performance. Incentives such as targeted fiscal support, tax relief, and preferential financing should be provided to encourage local governments to adopt proactive emission reduction measures. For example, Hangzhou has introduced carbon-linked fiscal mechanisms to foster green innovation. Furthermore, local governments should align intelligent technology initiatives with national strategies—such as the dual carbon targets and industrial digitalization—through investment in industrial intelligence and urban innovation. Effective coordination between central and local authorities is essential to prevent fragmented governance and ensure coherent progress. Lastly, enterprises should develop and adopt intelligent source-based emission reduction technologies to optimize production processes, lower emissions, and accelerate intelligent transformation. For instance, real-time carbon monitoring systems, piloted in Jiangsu’s industrial parks, have effectively identified emission hotspots and guided targeted mitigation efforts. Nonetheless, insufficient coordination, limited technological capacity, or weak incentives may undermine these efforts, increasing the risk of policy failure and regional disparities. Thus, future policies should incorporate adaptive mechanisms to manage uncertainty and support a resilient low-carbon transition.
Despite its contributions, this study has the following limitation: the environmental governance data are limited to listed enterprises, which may not fully represent small and medium-sized enterprises (SMEs). Due to significant differences in governance structures, resource allocation, and environmental practices between listed enterprises and SMEs, the findings may not be broadly applicable. Furthermore, while the study emphasizes the benefits of industrial intelligence, it is important to also acknowledge potential downsides, such as technological displacement, employment precarity, and rising inequality. These challenges must be considered when designing policies that promote industrial intelligence. Future research could address the limitation by incorporating SME data to improve the representativeness and generalizability of the results, as well as exploring the trade-offs between industrial intelligence and its socio-economic impacts.
Although this study centers on China, its findings offer broader implications for local-level decarbonization. Unlike China’s centralized governance model, EU municipalities and U.S. local authorities operate within more decentralized, participatory frameworks. EU cities, for instance, participate in transnational initiatives like the Covenant of Mayors, promoting bottom-up commitments and peer benchmarking. In the U.S., cities such as New York and San Francisco have advanced ambitious climate agendas independently of federal mandates. In contrast, Chinese local governments respond primarily to central directives and performance-based incentives. The alignment of top-down pressure with technological upgrading—particularly through industrial intelligence—may inform innovation-driven climate governance in other institutional settings.
Author Contributions
Conceptualization, Z.W. and S.L.; methodology, Z.W.; software, S.L.; validation, S.L.; formal analysis, Z.W. and S.L.; investigation, S.L.; resources, Z.W.; data curation, S.L.; writing—original draft preparation, S.L. and J.L.; writing—review and editing, Z.W. and S.L.; visualization, S.L.; supervision, Z.W.; project administration, Z.W.; funding acquisition, Z.W. All authors have read and agreed to the published version of the manuscript.
Funding
This research was funded by National Social Science Foundation of China “In the new development stage, people-oriented research on integrated development of urban and rural areas is promoted” (grant number: 22BJL081).
Institutional Review Board Statement
Not applicable.
Informed Consent Statement
Not applicable.
Data Availability Statement
Data will be made available upon request.
Conflicts of Interest
The authors declare that there are no conflicts of interest.
References
- Li, Y.; Zhang, Y.; Pan, A.; Han, M.; Veglianti, E. Carbon Emission Reduction Effects of Industrial Robot Applications: Heterogeneity Characteristics and Influencing Mechanisms. Technol. Soc. 2022, 70, 102034. [Google Scholar] [CrossRef]
- Yao, W.; Liu, L.; Fujii, H.; Li, L. Digitalization and Net-Zero Carbon: The Role of Industrial Robots in Carbon Dioxide Emission Reduction. J. Clean. Prod. 2024, 450, 141820. [Google Scholar] [CrossRef]
- Kitchin, R. The ethics of smart cities and urban science. Philos. Trans. R. Soc. A Math. Phys. Eng. Sci. 2016, 374, 20160115. [Google Scholar] [CrossRef]
- Lee, J.; Davari, H.; Singh, J.; Pandhare, V. Industrial Artificial Intelligence for industry 4.0-based manufacturing systems. Manuf. Lett. 2018, 18, 20–23. [Google Scholar] [CrossRef]
- Tao, F.; Qi, Q.; Wang, L.; Nee, A.Y.C. Digital twins and cyber–physical systems toward smart manufacturing and industry 4.0: Correlation and comparison. Engineering 2019, 5, 653–661. [Google Scholar] [CrossRef]
- Callaway, B.; Sant Anna, P.H.C. Difference-in-Differences with Multiple Time Periods. J. Econom. 2021, 225, 200–230. [Google Scholar] [CrossRef]
- Jiang, W.; Li, X.; Liu, R.; Song, Y. Local Fiscal Pressure, Policy Distortion and Energy Efficiency: Micro-Evidence from a Quasi-Natural Experiment in China. Energy 2022, 254, 124287. [Google Scholar] [CrossRef]
- Athey, S.; Wager, S. Estimating Treatment Effects with Causal Forests: An Application. Obs. Stud. 2019, 5, 37–51. [Google Scholar] [CrossRef]
- Acemoglu, D.; Restrepo, P. Robots and Jobs: Evidence from US Labor Markets. J. Political Econ. 2020, 128, 2188–2244. [Google Scholar] [CrossRef]
- Autor, D.H. Why Are There Still So Many Jobs? The History and Future of Workplace Automation. J. Econ. Perspect. 2015, 29, 3–30. [Google Scholar] [CrossRef]
- Bloom, D.E.; McKenna, M.; Prettner, K. Demography, Unemployment, Automation, and Digitalization: Implications for the Creation of (Decent) Jobs, 2010–2030; National Bureau of Economic Research: Cambridge, MA, USA, 2018. [Google Scholar]
- Chiacchio, F.; Petropoulos, G.; Pichler, D. The Impact of Industrial Robots on EU Employment and Wages: A Local Labour Market Approach; Bruegel Working Paper; Bruegel: Brussels, Belgium, 2018. [Google Scholar]
- Dauth, W.; Findeisen, S.; Suedekum, J.; Woessner, N. Adjusting to robots: Worker-level evidence. Oppor. Incl. Growth Inst. Work. Pap. 2018, 13, 1–50. [Google Scholar]
- David, B. Computer technology and probable job destructions in Japan: An evaluation. J. Jpn. Int. Econ. 2017, 43, 77–87. [Google Scholar] [CrossRef]
- Fu, X.M.; Bao, Q.; Xie, H.; Fu, X. Diffusion of Industrial Robotics and Inclusive Growth: Labour Market Evidence from Cross Country Data. J. Bus. Res. 2021, 122, 670–684. [Google Scholar]
- Tian, H.; Zhao, L.; Li, Y.; Wang, W. Can Enterprise Green Technology Innovation Performance Achieve “Corner Overtaking” by Using Artificial Intelligence?—Evidence from Chinese Manufacturing Enterprises. Technol. Forecast. Soc. 2023, 194, 122732. [Google Scholar] [CrossRef]
- Zhang, Y.; Zhang, X. Regulation-Induced Digitalization. China Econ. Rev. 2024, 88, 102262. [Google Scholar] [CrossRef]
- Sun, Z.; Sun, X.; Wang, W.; Wang, W. Source Reduction Strategy or End-of-Pipe Solution? The Impact of Green Merger and Acquisition on Environmental Investment Strategy of Chinese Heavily Polluting Enterprises. J. Clean. Prod. 2023, 413, 137530. [Google Scholar] [CrossRef]
- Yu, J.; Zhou, L.; Zhu, G. Strategic Interaction in Political Competition: Evidence from Spatial Effects Across Chinese Cities. Reg. Sci. Urban. Econ. 2016, 57, 23–37. [Google Scholar] [CrossRef]
- Blanchard, O.; Shleifer, A. Federalism with and Without Political Centralization: China Versus Russia. IMF Staff. Pap. 2001, 48, 171–179. [Google Scholar] [CrossRef]
- Yang, X.; Yan, J. Top-Level Design, Reform Pressures, and Local Adaptations: An Interpretation of the Trajectory of Reform Since the 18th CPC Party Congress. J. Chin. Gov. 2018, 3, 25–48. [Google Scholar] [CrossRef]
- Porter, M.E.; van der Linde, C. Toward a New Conception of the Environment-Competitiveness Relationship. J. Econ. Perspect. 1995, 9, 97–118. [Google Scholar] [CrossRef]
- Wu, G.; Baležentis, T.; Sun, C.; Xu, S. Source Control or End-of-Pipe Control: Mitigating Air Pollution at the Regional Level from the Perspective of the Total Factor Productivity Change Decomposition. Energy Policy 2019, 129, 1227–1239. [Google Scholar] [CrossRef]
- Wei, L.; Lin, B.; Zheng, Z.; Wu, W.; Zhou, Y. Does Fiscal Expenditure Promote Green Technological Innovation in China? Evidence from Chinese Cities. Environ. Impact Assess. 2023, 98, 106945. [Google Scholar] [CrossRef]
- Bernauer, T.; Koubi, V. Are Bigger Governments Better Providers of Public Goods? Evidence from Air Pollution. Public Choice 2013, 156, 593–609. [Google Scholar] [CrossRef]
- Wager, S.; Athey, S. Estimation and inference of heterogeneous treatment effects using random forests. J. Am. Stat. Assoc. 2018, 113, 1228–1242. [Google Scholar] [CrossRef]
- Cheng, Z.; Zhang, J. The Impact of Air Quality on Industrial Intelligence: Evidence from Chinese Industrial Firms. J. Environ. Plan. Manag. 2024, 67, 2420–2441. [Google Scholar] [CrossRef]
- Liao, X.; Liu, Y. Local Fiscal Distress and Investment Efficiency of Local SOEs. China J. Account. Res. 2014, 7, 119–147. [Google Scholar] [CrossRef]
- Chen, X.; Xie, H.; Zhou, H. Incremental versus Radical Innovation and Sustainable Competitive Advantage: A Moderated Mediation Model. Sustainability 2024, 16, 4545. [Google Scholar] [CrossRef]
- Zhang, X.; Sun, M.; Liu, J.; Xu, A. The Nexus Between Industrial Robot and Employment in China: The Effects of Technology Substitution and Technology Creation. Technol. Forecast. Soc. 2024, 202, 123341. [Google Scholar] [CrossRef]
- Zhou, W.; Zhuang, Y.; Chen, Y. How Does Artificial Intelligence Affect Pollutant Emissions by Improving Energy Efficiency and Developing Green Technology. Energy Econ. 2024, 131, 107355. [Google Scholar] [CrossRef]
- Lin, B.; Xu, C. Enhancing Energy-Environmental Performance Through Industrial Intelligence: Insights from Chinese Prefectural-Level Cities. Appl. Energy 2024, 365, 123245. [Google Scholar] [CrossRef]
- Wang, L.; Chen, Q.; Dong, Z.; Cheng, L. The Role of Industrial Intelligence in Peaking Carbon Emissions in China. Technol. Forecast. Soc. 2024, 199, 123005. [Google Scholar] [CrossRef]
Disclaimer/Publisher’s Note: The statements, opinions and data contained in all publications are solely those of the individual author(s) and contributor(s) and not of MDPI and/or the editor(s). MDPI and/or the editor(s) disclaim responsibility for any injury to people or property resulting from any ideas, methods, instructions or products referred to in the content. |
© 2025 by the authors. Licensee MDPI, Basel, Switzerland. This article is an open access article distributed under the terms and conditions of the Creative Commons Attribution (CC BY) license (https://creativecommons.org/licenses/by/4.0/).