1. Introduction
With the rapid development of urban economies, the ecological environment has become increasingly deteriorated, and the status of ecological value protection remains concerning. The protection of ecological values is crucial for the stability of ecosystems and the interdependence between human activities and ecological processes. Although the demand for ecosystem services (e.g., food, fresh water, and clean air) continues to increase, human activities undermine ecosystems’ capacity to provide these services [
1]. The concept of Ecosystem Services (ES) was introduced in the late 1970s to enhance public awareness of biodiversity conservation by highlighting the direct contributions of natural systems to human well-being [
2]. Early studies connected ecosystem functions—such as carbon fixation and soil formation—to essential life-supporting services. For instance, Ehrlich and Mooney proposed the idea of bio-environmental traits, which was later expanded by Daily to encompass indirect benefits including water purification and pollination. This conceptual development laid the foundation for subsequent research in the field [
3]. The conservation and assessment of ecological values are essential for maintaining ecosystems, evaluating the risks of environmental changes to human societies, mitigating the impacts of ecological shifts, and effectively planning for ecological values in urban environments.
Research on ecological value in China began relatively recently, with the measurement of ecological product value initially stemming from ecosystem service value assessments. After decades of development, the foundational theories and technical methods of ecological product value accounting have seen substantial progress [
4]. Currently, research in China focuses on the definition of the concept of ecological products, ecological value accounting methods, and pathways for realizing the value of ecological products [
5], with these concepts being first proposed at the end of the 20th century [
6]. In contrast, a study in the United States did not directly mention “ecological products” [
7], but adopted similar concepts such as “ecosystem services” [
8] and “environmental services” [
9]. Another assessed the value of terrestrial ecosystem services in China, focusing on ecosystem research [
10]. And in the field of ecological value measurement, Luo Huawei quantitatively analyzed the ecological value of rural collective forest assets in Sichuan Province in 2018 based on the Specification for Forest Ecosystem Service Function Assessment [
11]. One study introduced the concept of Gross Ecosystem Product (GEP), defining it as the total value of products and services provided by ecosystems that contribute to human well-being and sustainable economic and social development [
12]. Another was the first to roughly estimate the global ecosystem service function based on biophysical processes combined with global parameters and assessed its value using the engineering alternative value method [
13]. This work provided a preliminary foundation for subsequent quantification and value assessment studies. Another study introduced this method to China, making localized adjustments to derive a table of ecological value coefficients per unit area for various grassland types, thereby providing a crucial data foundation for subsequent research and value assessments [
14].
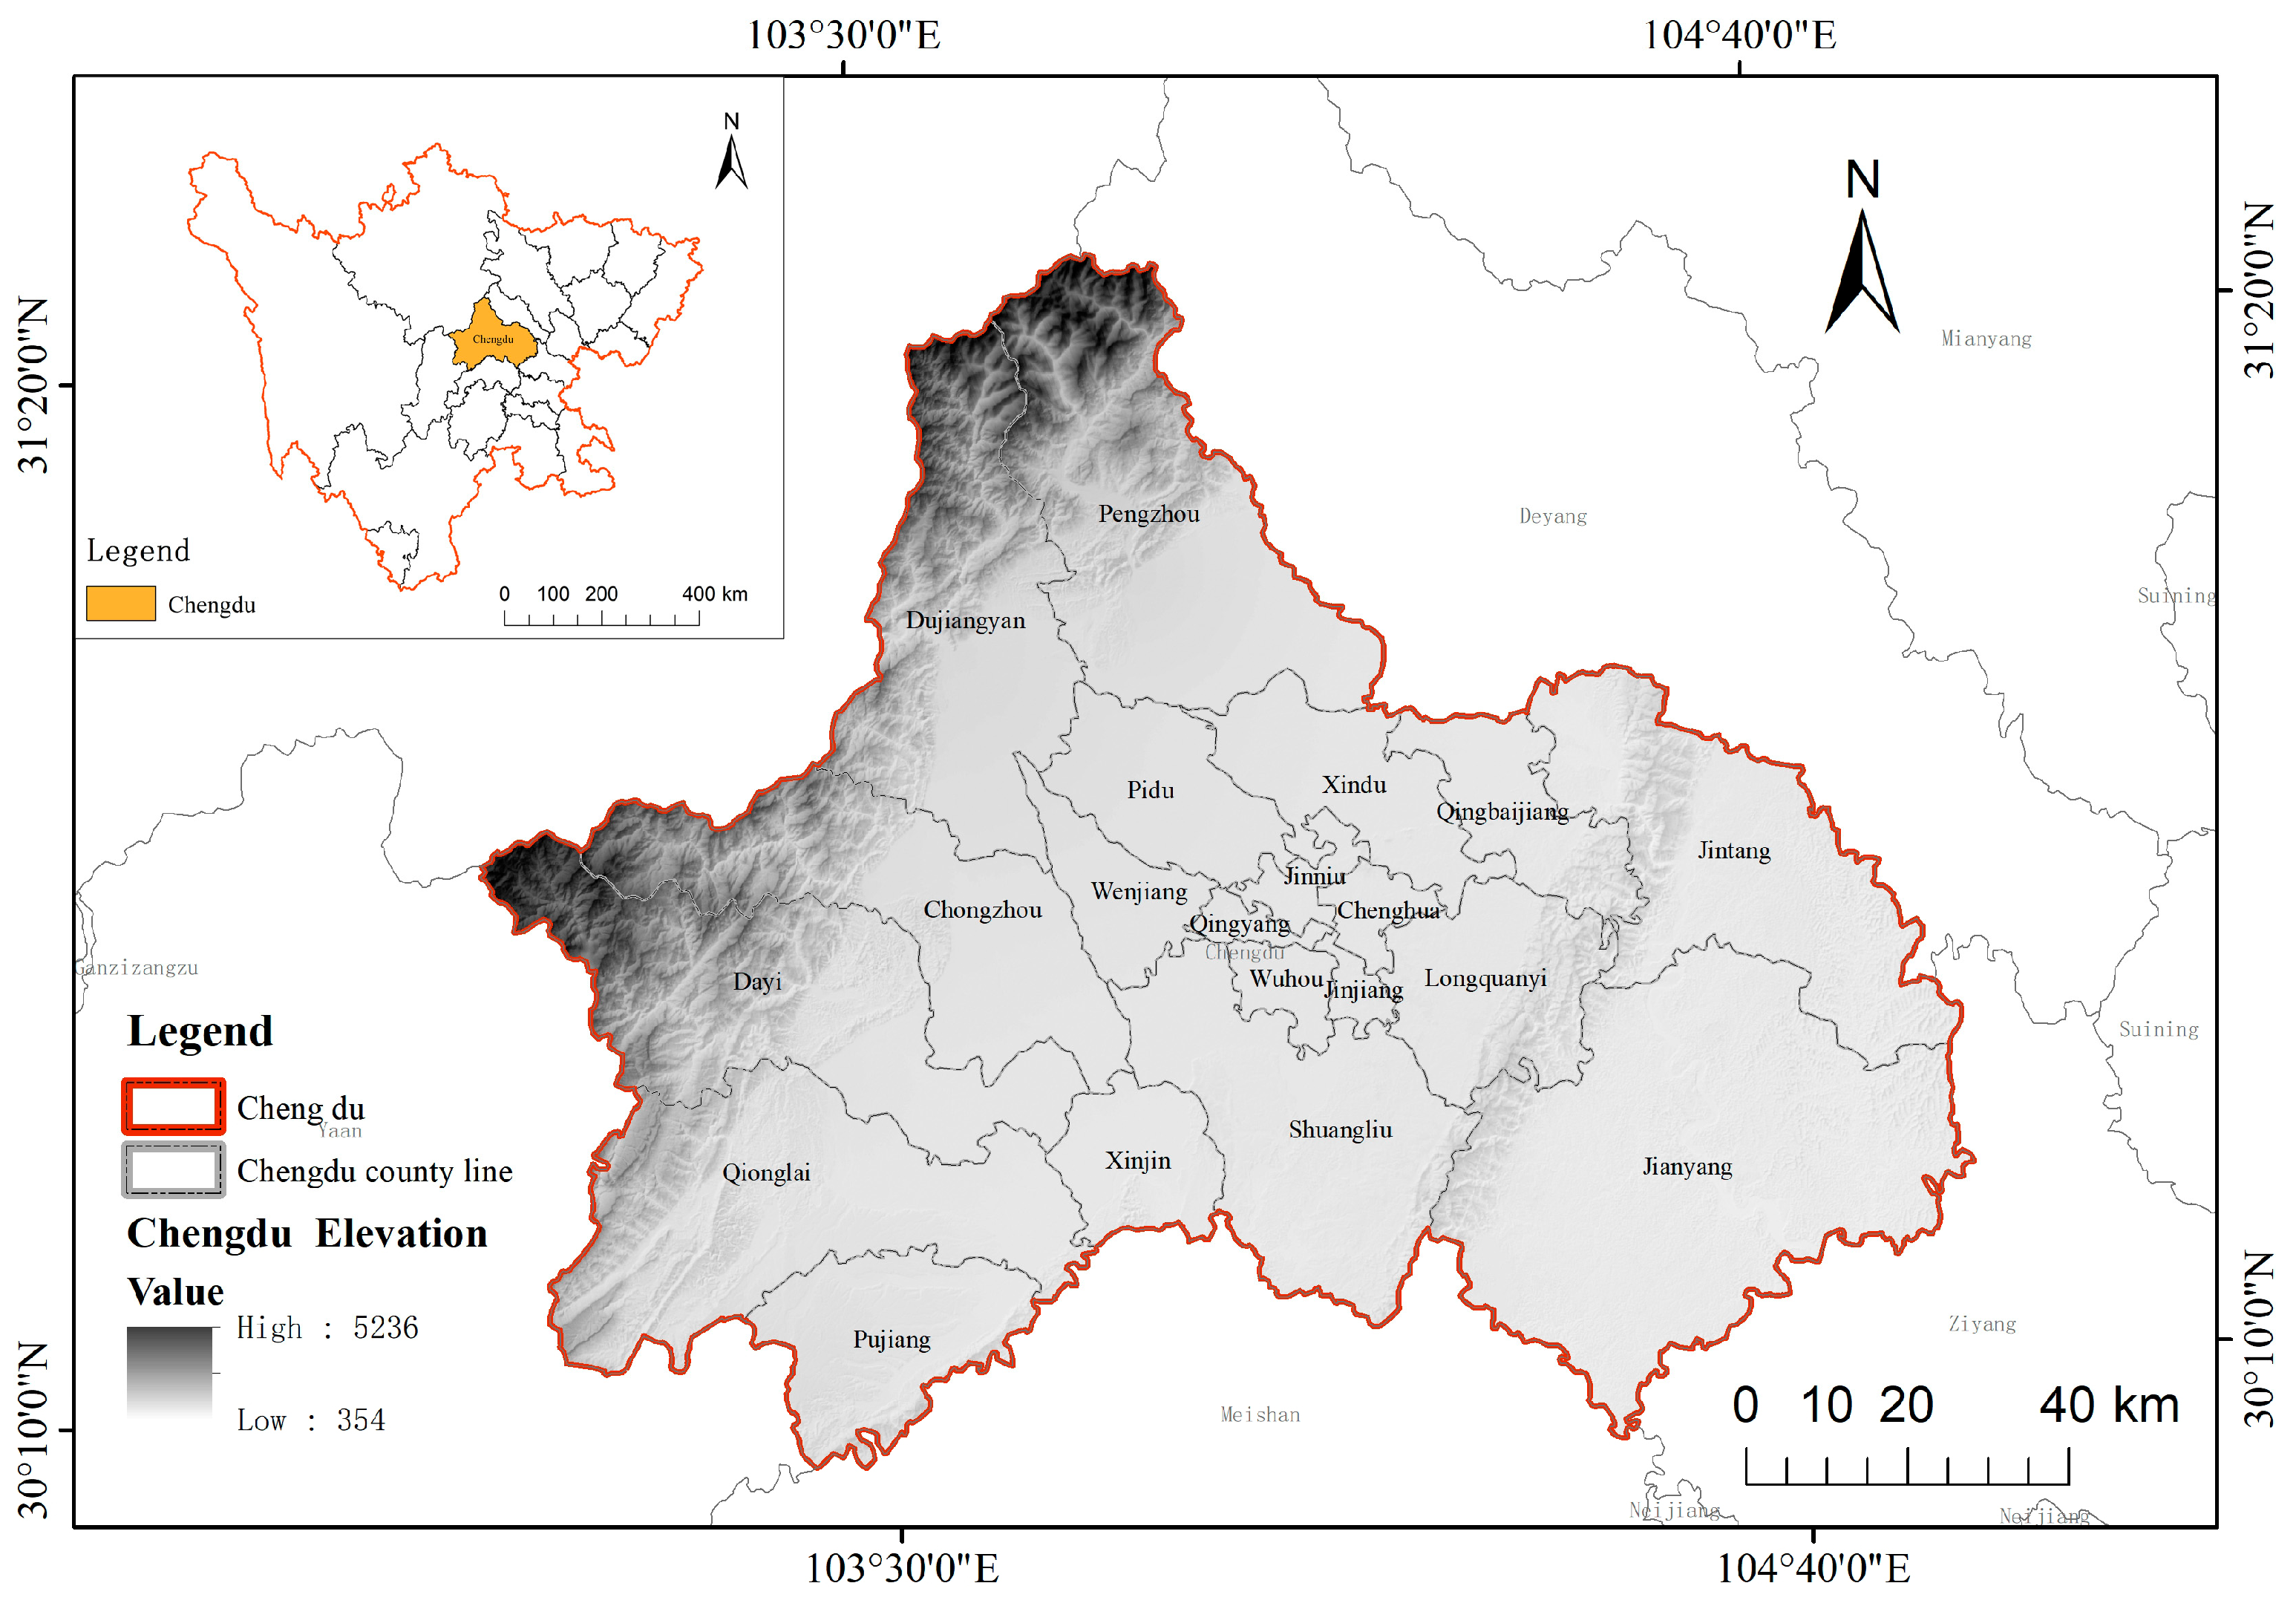
As an economic hub in Southwest China, Chengdu, together with Chongqing, constitutes the Twin Cities Economic Circle, which has a significant influence on the economic development of the entire region [
15]. Ecosystem services are usually categorized into four types: provisioning services, regulating services, cultural services, and supporting services [
16]. In the urban-scale study, in order to more accurately reflect the regional ecological functions, this study subdivided the ecosystem services in Chengdu into eight categories: agriculture, forestry, animal husbandry and fishery, climate regulation, water purification and air freshening, soil and water conservation, pest control, and tourism resources and income. Studies have shown that ecosystem services in arid areas are significantly affected by the interaction of grazing, climate, and biodiversity [
17], which indicates that ecological valuation in urban areas needs to consider the compound effects of natural and anthropogenic factors. Meanwhile, there is a trade-off relationship between the contributions of different ecological restoration modes to ecosystem services and biodiversity [
18], which provides a reference for ecological restoration and land use optimization in Chengdu. The development experience of the PES mechanism reveals the important role of ecological protection policy [
19], which is conducive to improving the local ecological compensation system. Considering the existence of ecological service portfolio differences in different landscape units, in the context of the complex topography of Chengdu City, different regions need to carry out the value assessment according to local conditions. Numerous scholars have conducted assessment studies on the value of ecosystem services in Chengdu, such as the characteristics of spatial and temporal gradient of ecosystem service value [
20], the value of ecosystem service function [
21], and the impact of land use change on the value of ecosystem services [
22], and so on. However, there is still a relative paucity of studies that quantify values and further apply models for prediction. In order to fill the research gap in the field of ecological value quantification and prediction, this study relies on the existing results of ecological value quantification in Chengdu City to conduct in-depth analyses and comparisons of the results of the accounting of the various ecological values in Chengdu City, so as to reveal the trend of changes in the different areas of the city and the value factors. By applying the gray prediction model, the study makes scientific predictions on the trend of ecological value changes in Chengdu City in the next four time periods. By applying the gray prediction model, this study not only provides a new perspective for the ecological value assessment of Chengdu City but also provides data support and theoretical basis for future urban planning and sustainable development decision-making in Southwest China. In summary, existing studies have paid insufficient attention to the dynamic evolution and prediction of ecological value in Chengdu, and lack a systematic analysis of the synergistic effects of multiple indicators. By integrating multi-source geographic data and gray prediction models, this study aims to address the following scientific issues: (1) the spatial and temporal differentiation characteristics of ecological value in Chengdu and its driving mechanism; (2) the synergistic/trade-off relationship between multiple types of ecological service functions; and (3) the scientific prediction of future trends in the evolution of ecological value. The research results will provide theoretical support for the construction of a ‘park city’ in Chengdu and the mechanism of realizing the value of ecological products.
3. Results and Analyses
3.1. Agriculture, Forestry, Fisheries and Ecological Resource Values
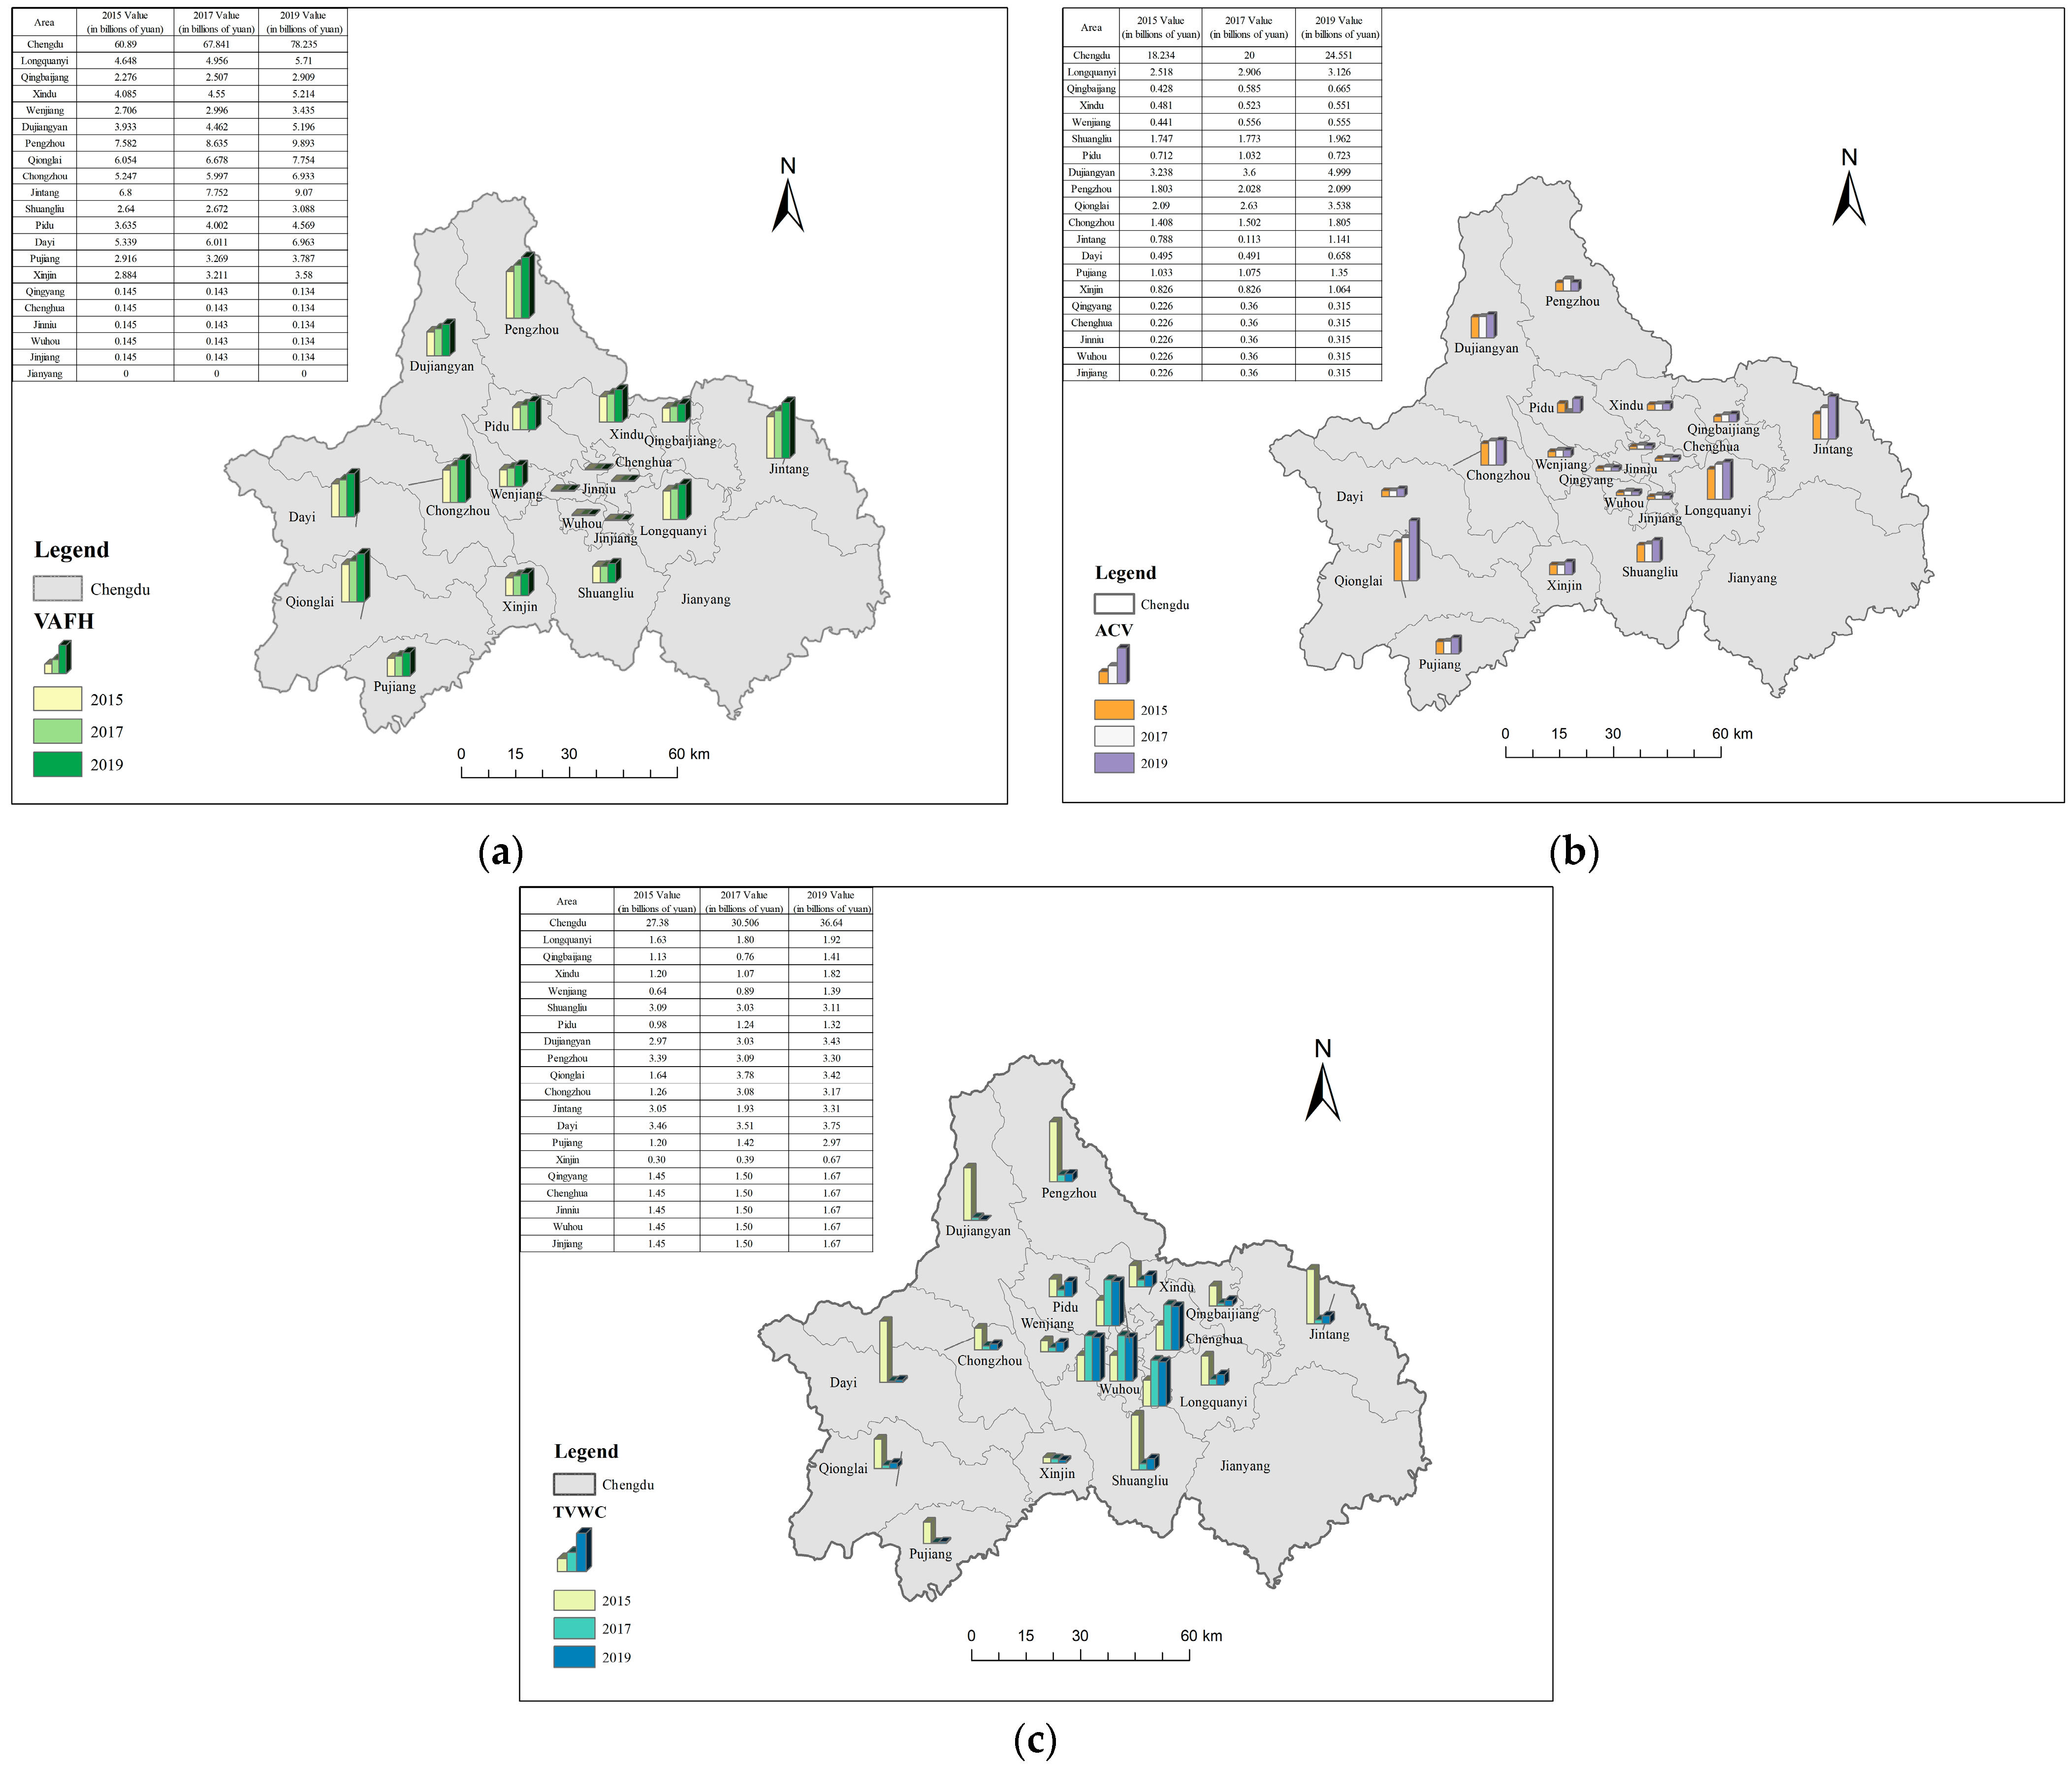
Regarding agriculture, forestry, animal husbandry, and fishery, these industries in Chengdu and its neighboring areas experienced varying degrees of development from 2015 to 2019. As the central city, Chengdu’s total output value in agriculture, forestry, animal husbandry, and fishery increased from CNY 60.89 billion in 2015 to CNY 78.235 billion in 2019, indicating a significant growth trend.
Other districts, such as Pidu District, Dayi, Pujiang, Xinjin, Qingyang, Chenghua, Jinniu, Wuhou, and Jinjiang, although their output values fluctuated in certain years, generally exhibited an overall trend of growth or, at the very least, stability. For instance, Pidu District grew from CNY 3.635 billion in 2015 to CNY 4.569 billion in 2019, while Pujiang County increased from CNY 2.916 billion to CNY 3.787 billion (
Figure 2). Qingyang, Chenghua, Jinniu, Wuhou, and Jinjiang districts and counties also demonstrated some growth or stability in their agriculture, forestry, animal husbandry, and fisheries outputs, though these changes were relatively modest.
Regarding ecological resources, the value contributed by forest resources for climate regulation in Chengdu City amounted to CNY 24.551 billion in 2019, an increase of CNY 6.317 billion compared to 2015. Among the districts and counties, Dujiangyan City contributed the highest value for climate regulation, at CNY 4.999 billion, followed by Qionglai City at CNY 3.538 billion and Longquanyi District at CNY 3.126 billion (
Figure 2).The deterioration of the water environment, coupled with climate warming, has exacerbated water resource issues, with increasing water demand further aggravating the shortage of resources [
29]. In terms of water resources, the value contributed by hydrologic stagnation sources in Chengdu City amounted to CNY 36.640 billion in 2019, an increase of CNY 9.260 billion compared to 2015. Among the districts and counties, Dayi County recorded the highest value of CNY 3.745 billion for hydrologic stagnation in 2019, followed by Dujiangyan with CNY 3.426 billion (
Figure 2).
3.2. Water Quality and Air Quality Values
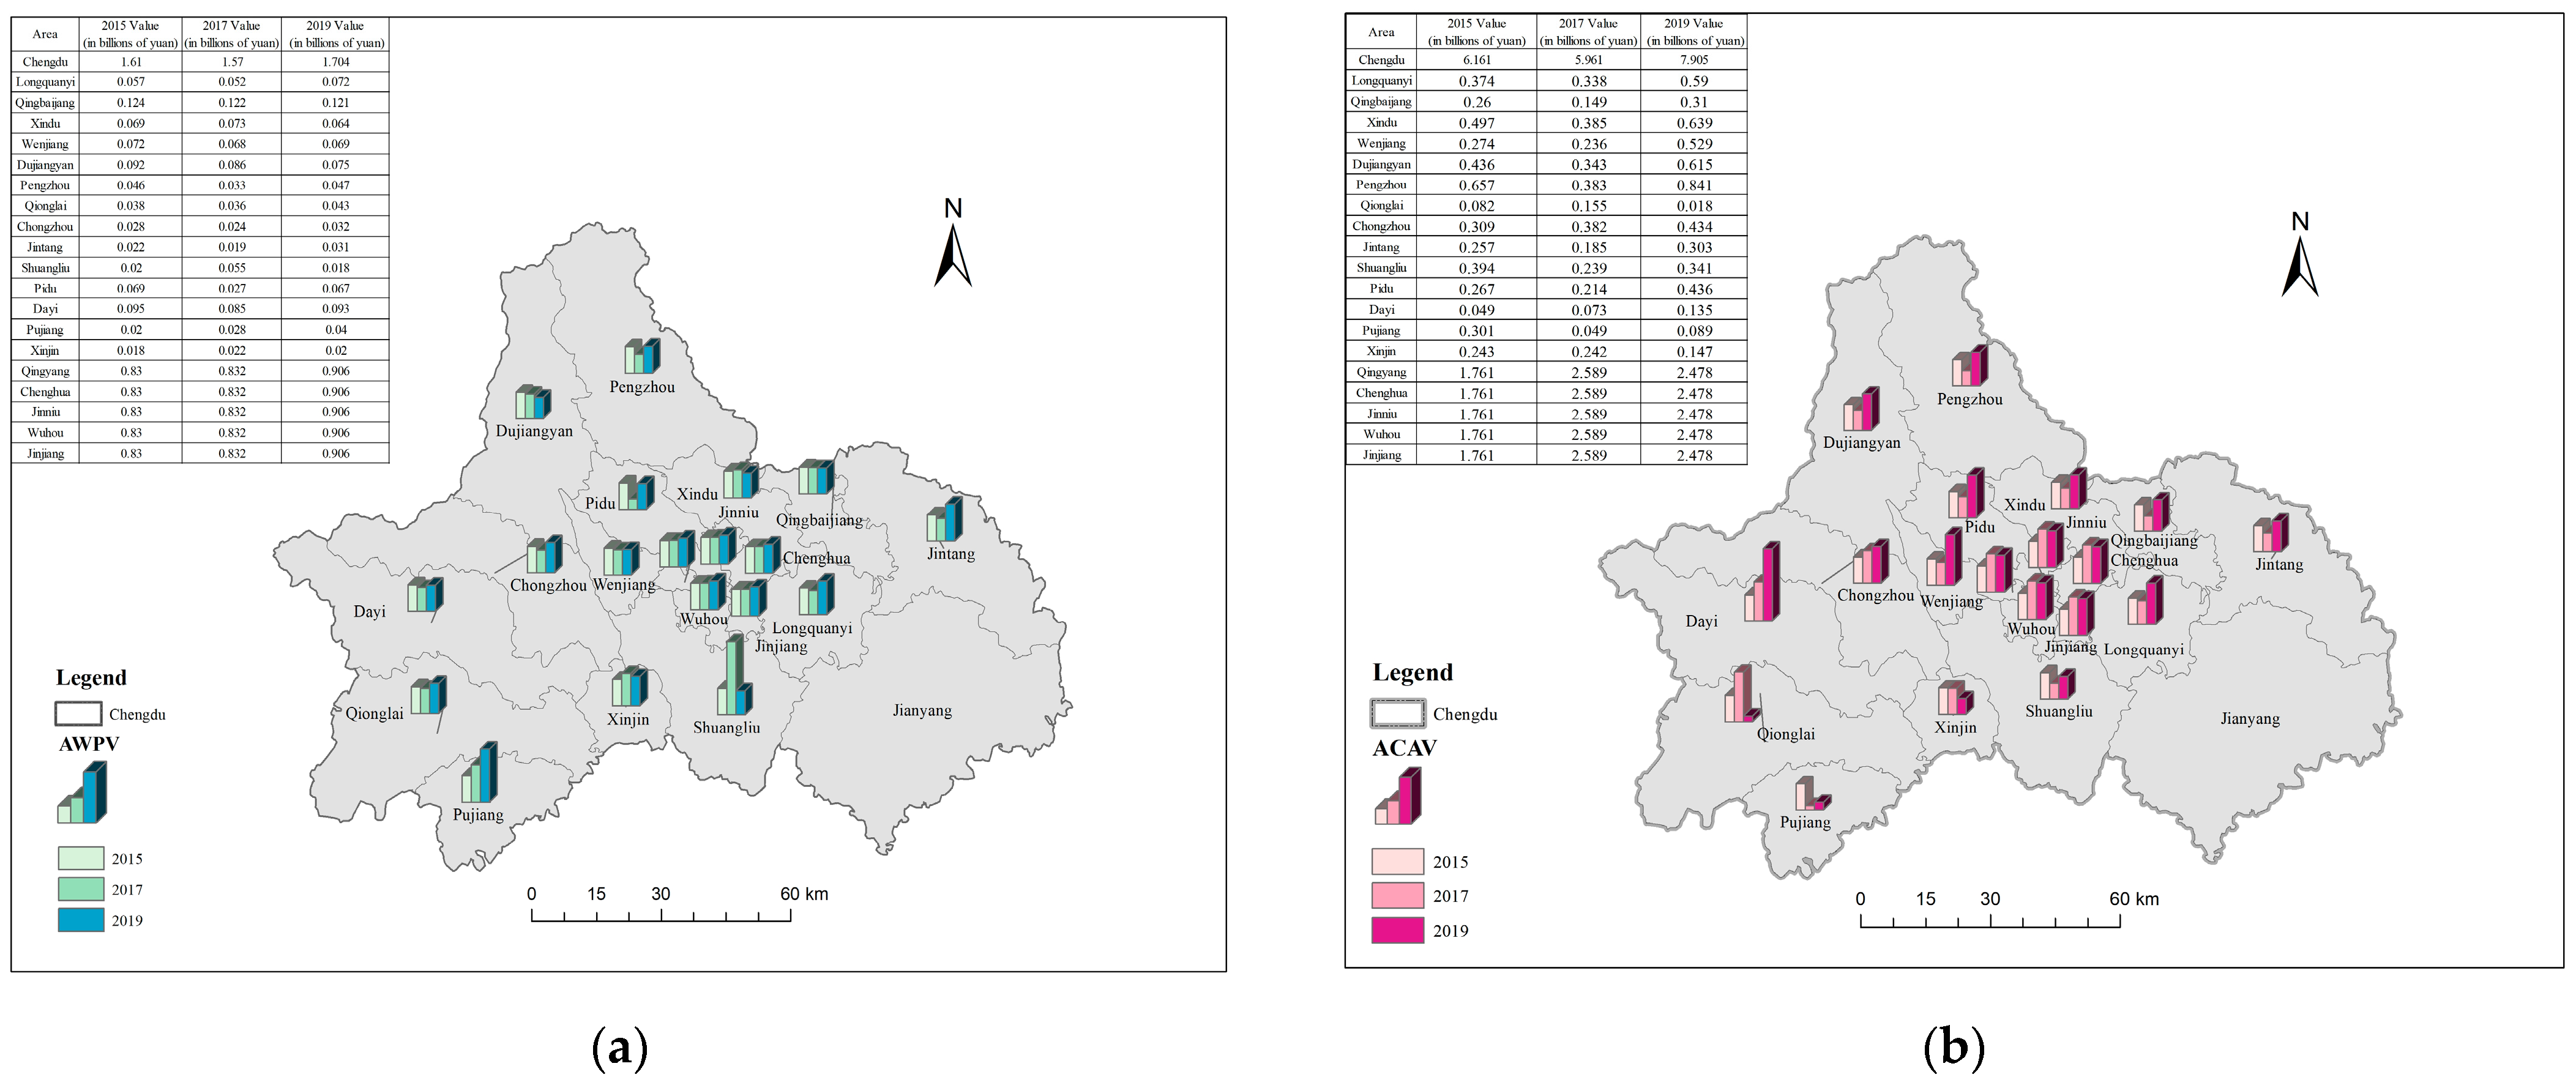
The value of water purification in Chengdu amounted to approximately CNY 1.704 billion in 2019, with Qingbaijiang District leading non-central urban areas at CNY 121 million, while Shuangliu District recorded the lowest value at CNY 18 million. Compared to 2015, the value of water purification in Chengdu City increased by CNY 0.94 billion, whereas Dujiangyan City saw a decrease of CNY 0.17 billion (
Figure 3). Data indicate that the value of water purification in Chengdu City represented 0.53% of the total value of open space services in 2019, while a study in Costa Rica found that the value of forest water purification services accounted for 1.7% of the total value of open space recreation services [
30]. This disparity may be attributed to differences in forest cover and the selection of study areas between the two regions. Chengdu, as the capital of Sichuan, boasts a relatively high value volume of leisure services, including tourism, whereas Costa Rica, being a coastal country, has extensive vegetation cover.
In the air purification sector, the fresh air eco-value in Chengdu City grew significantly in 2019, reaching CNY 7.905 billion, an increase of CNY 1.744 billion compared to 2015, underscoring the substantial positive impact of improved air quality on eco-value. Among the regions in Chengdu, the central city ranked highest, with a fresh air ecological value of CNY 2.478 billion, closely followed by Pengzhou, which recorded a fresh air ecological value of CNY 841 million. However, it is noteworthy that the ecological value of fresh air in Pujiang County decreased by CNY 212 million from 2015 (
Figure 3). Chengdu City calculates the fresh air value based on the key indicator of PM2.5 concentration. In cases of unclear or missing data, green space area and density can serve as alternative indicators for measuring clean air value [
31].
3.3. Amount of Soil Conservation and Pest Control Values
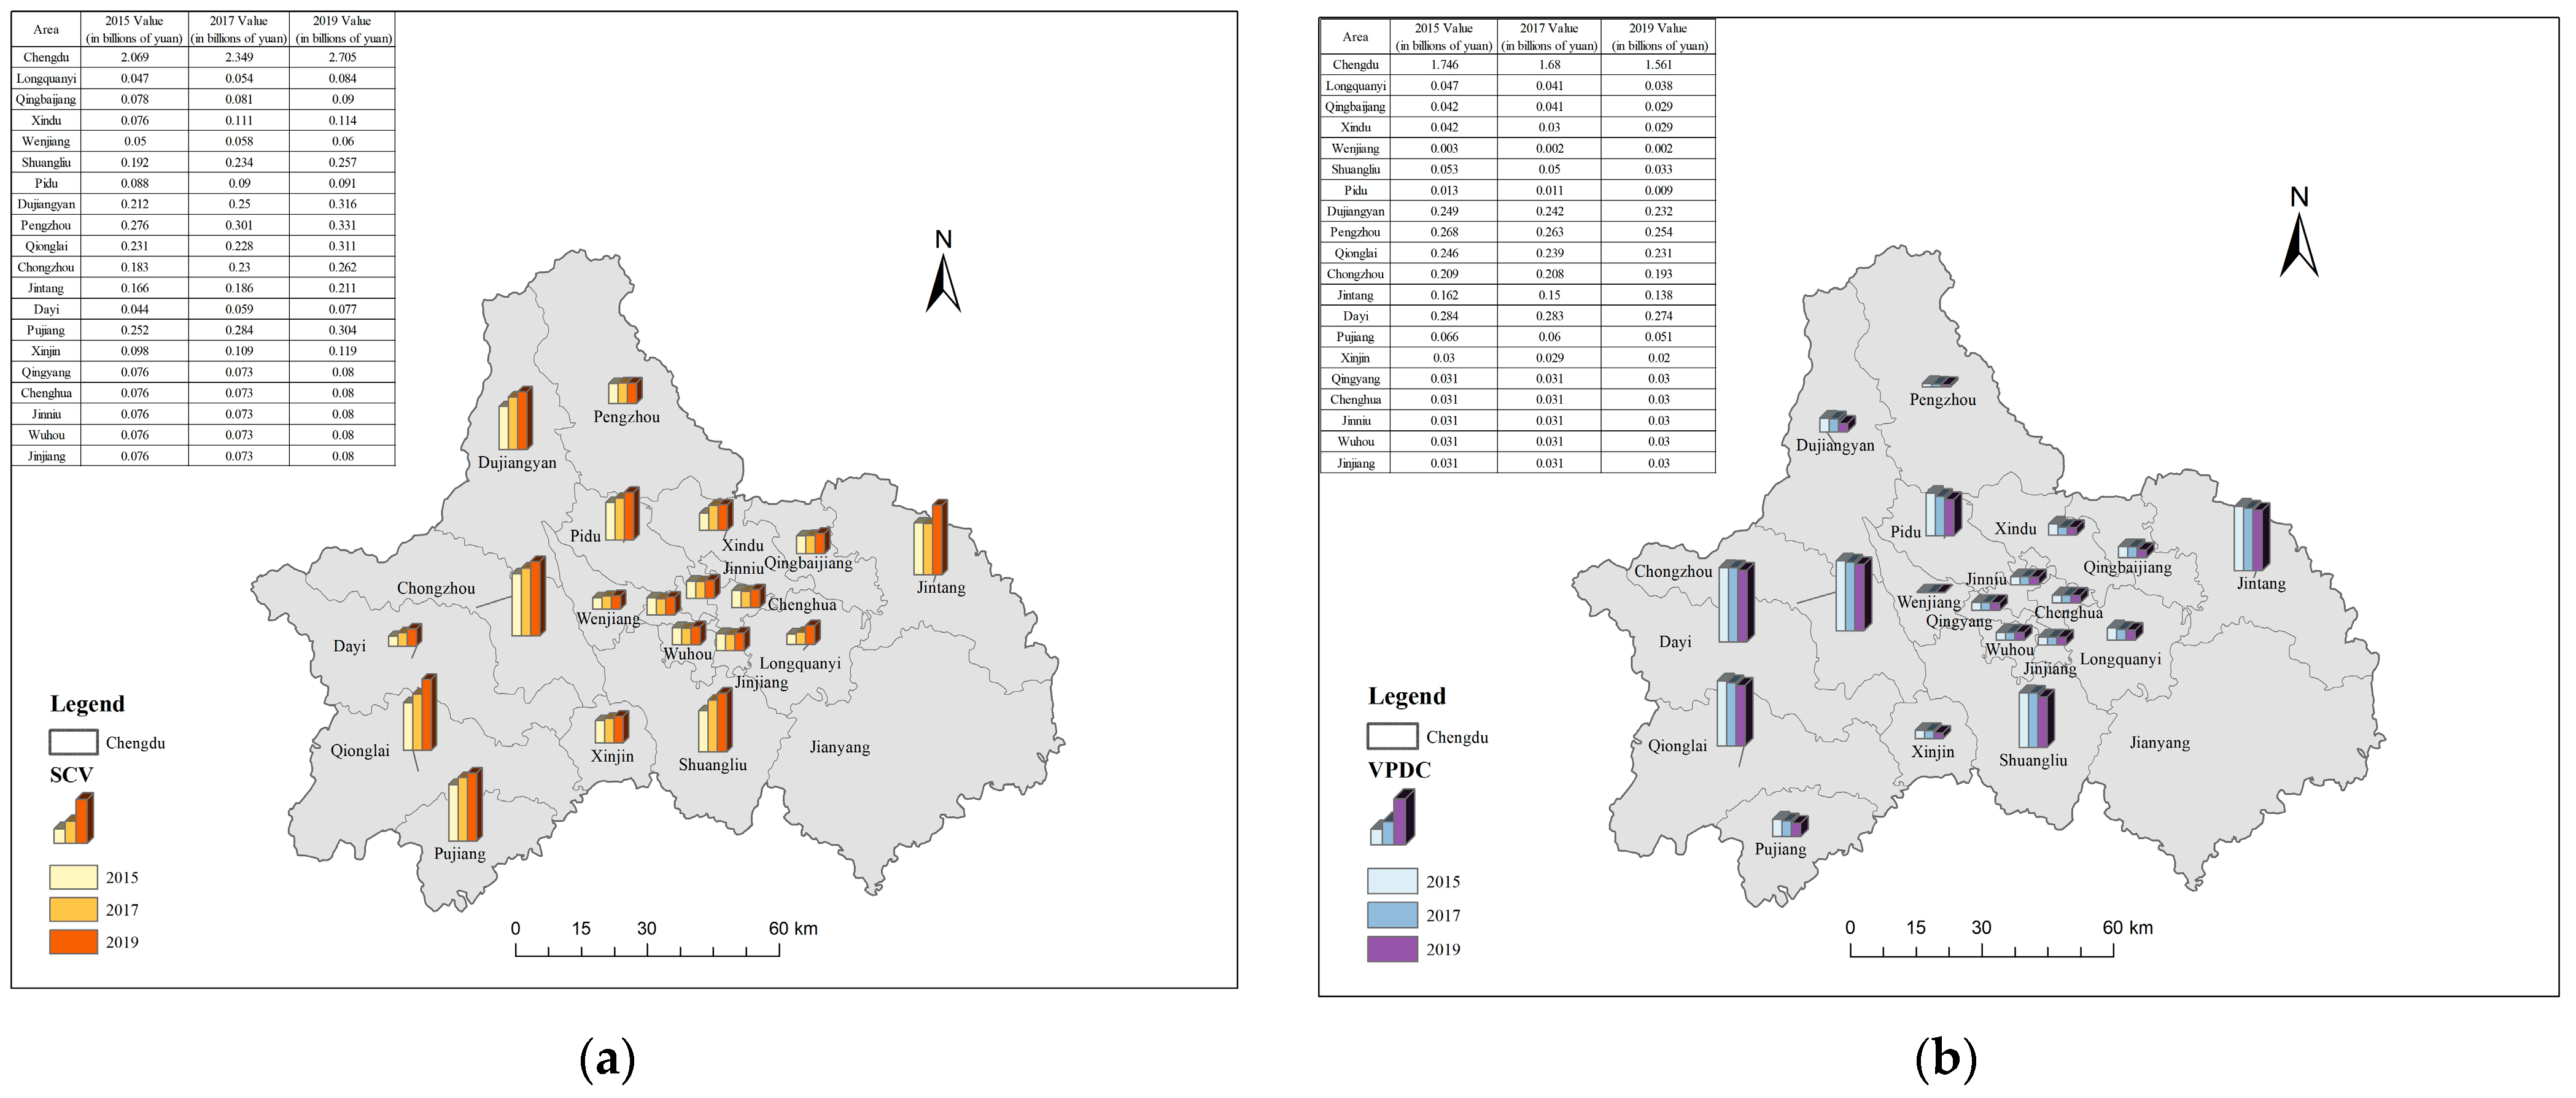
In 2019, the ecological value of soil conservation in Chengdu amounted to CNY 2.705 billion, an increase of CNY 636 million compared to 2015. The value derived from maintaining soil fertility contributed the most to this increase, amounting to CNY 2.018 billion, while the value of mitigating sedimentation, at CNY 687 million, should also be noted. Among the regions in Chengdu, Pengzhou City recorded the highest soil conservation value, at CNY 331 million, while Wenjiang District had a relatively low value of CNY 60 million (
Figure 4). Studies in Chengdu and its neighboring southwestern regions have highlighted the close relationship between soil conservation values and other ecological values, particularly the synergistic effects with regulating and provisioning services [
32]. For instance, improvements in water and air quality may have contributed to the steady increase in soil conservation values. This synergistic relationship suggests that the combined effects of ecological protection and environmental management measures contribute to the enhancement of soil conservation values, thereby improving the stability and productivity of the entire ecosystem.
In 2019, the ecological value of pest control and prevention in Chengdu City was CNY 1.561 billion, a decrease of CNY 185 million compared to 2015. Among the regions in Chengdu, Dayi County had the highest pest control and prevention value, amounting to CNY 274 million, while Wenjiang District had the lowest, at only CNY 2 million (
Figure 4). In this study, the value of pest and disease control was calculated by combining the cost of control, the cost of non-integrated control, and the area under management. Meanwhile, a study in Chile quantified the ecological and economic value by examining the impact of insectivorous bats on grapevine damage [
33]. Different quantification methods and metrics may result in variations in the measurement of pest control values.
3.4. Tourism Resources and the Amount of Income Value
Tourism resources in Chengdu are the primary source of its open space service value. In 2019, the open space service value in Chengdu amounted to CNY 321.304 billion, reflecting an increase of CNY 178.504 billion compared to 2015. Among these, the open space service value in the central city was the highest, amounting to CNY 136.042 billion, while Pujiang County recorded the lowest at only CNY 4.785 billion (
Figure 5). In this study, the value of leisure services in Chengdu City is not only the largest but also the fastest-growing, accounting for 68% of the total value of all study areas by 2019. The value of leisure services is approximated using data related to the tourism industry, reflecting the rich tourism resources and market potential of Chengdu City. Based on the growth trend, the value of leisure services in Chengdu City holds significant potential for further development.
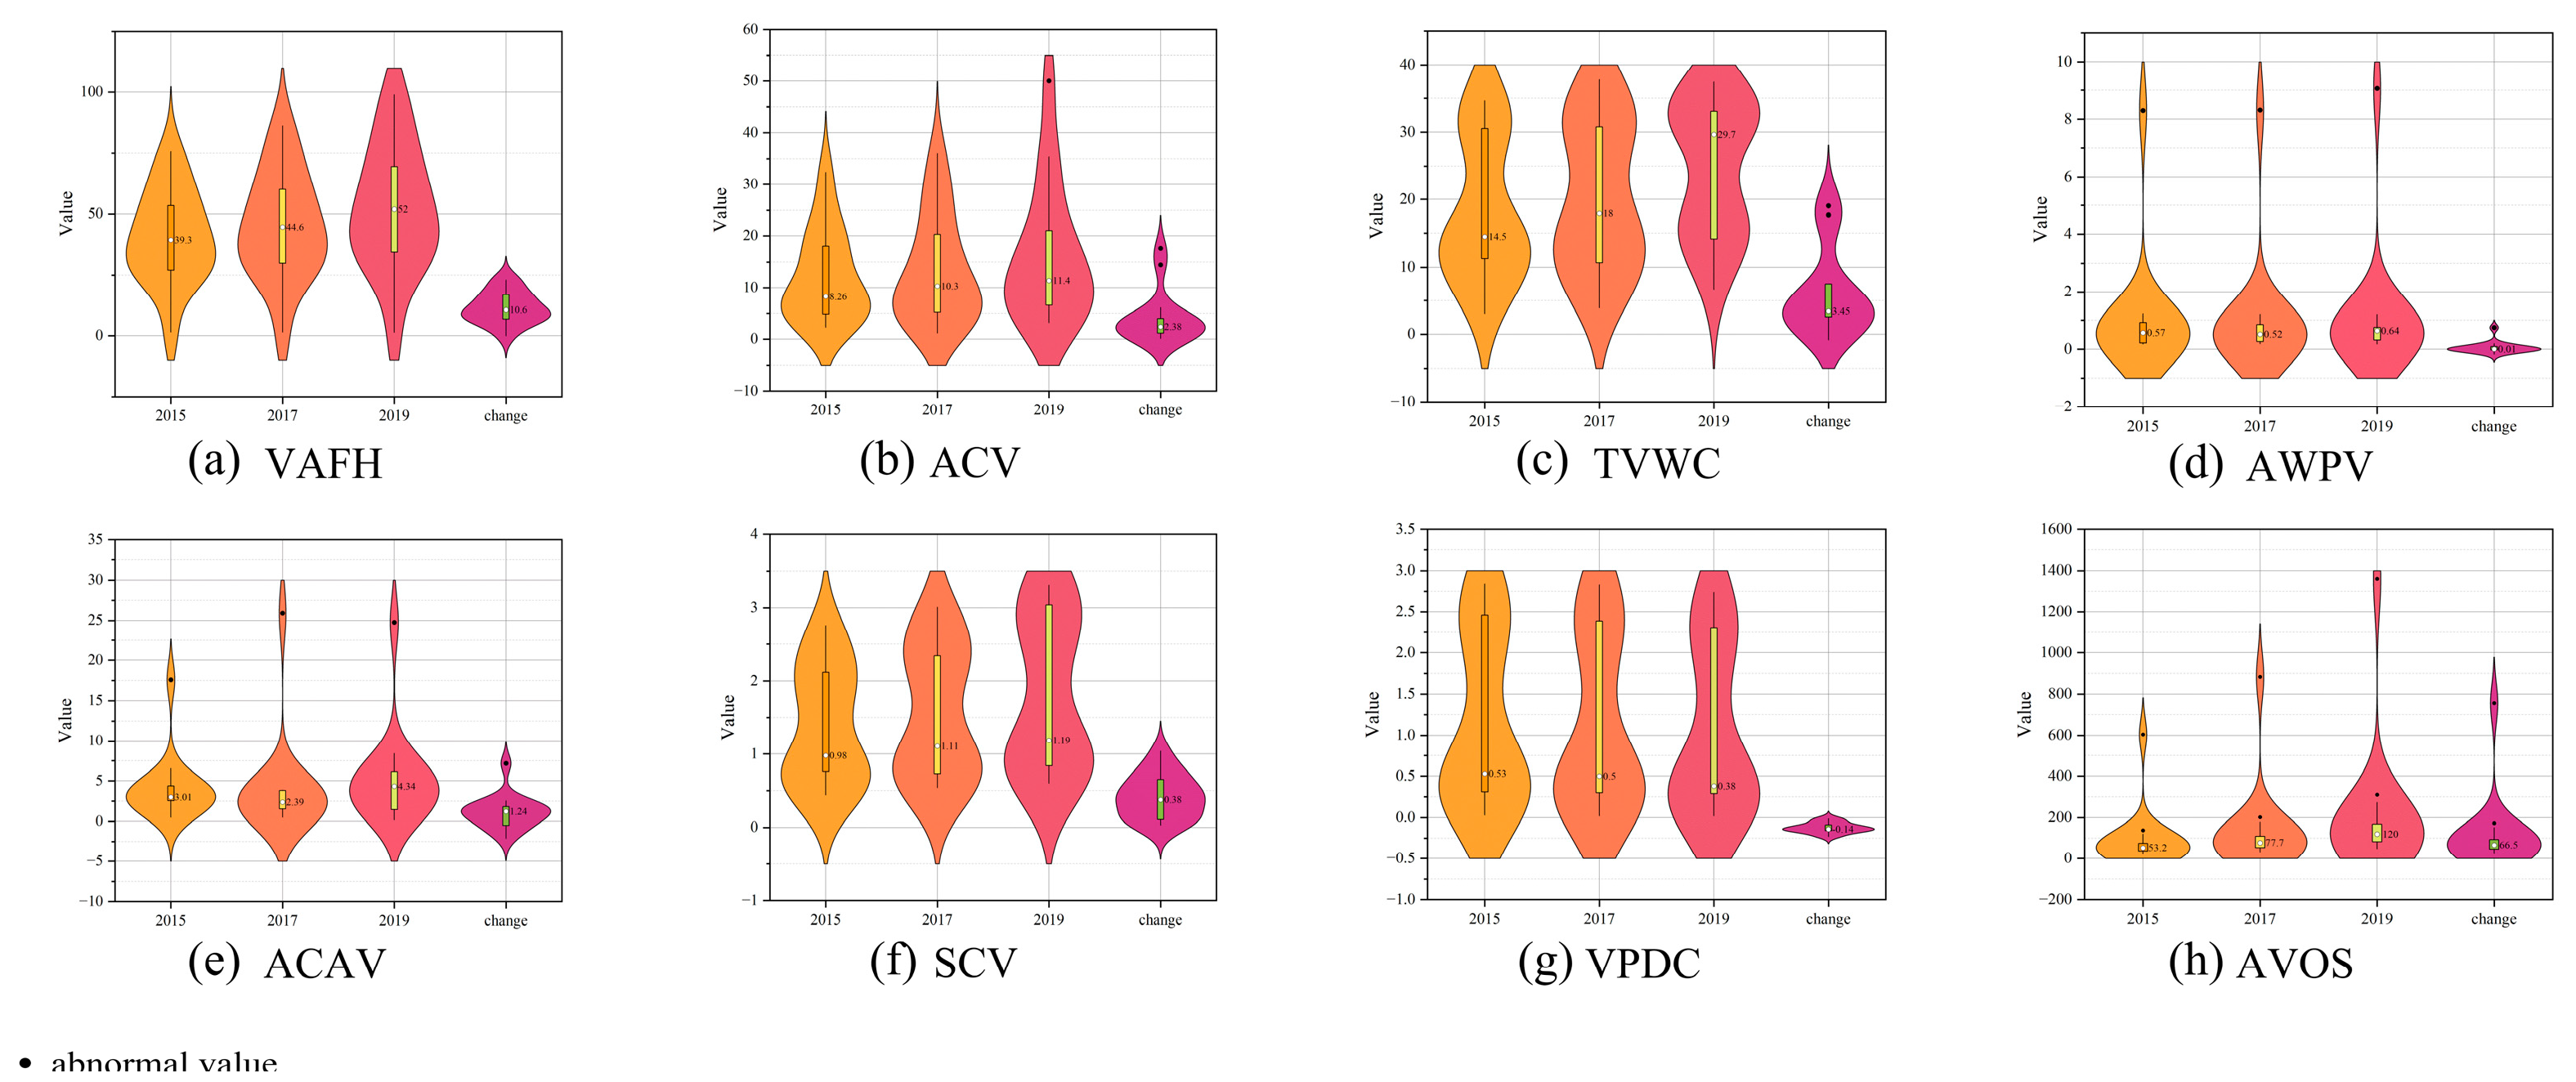
Analysis of the value volume accounting for Chengdu City in 2015, 2017, and 2019 reveals an overall growth trend across the eight selected indicators. The largest increase was seen in open space services, which grew by CNY 178.504 billion, followed by the value of agriculture, forestry, animal husbandry, and fishery, which increased by CNY 32.878 billion compared to 2015. However, three of the eight indicators showed a slight decline in 2017: water purification, air quality, and pest control, with decreases of CNY 40 million, CNY 200 million, and CNY 66 million, respectively. Pest control is the only indicator to show consecutive declines in both 2017 and 2019, with decreases of CNY 66 million and CNY 185 million, respectively.
As shown in the violin charts (
Figure 6a–h), the values for agriculture, forestry, animal husbandry and fishery, climate regulation, water conservation, soil conservation, and leisure services increased steadily from 2015 to 2019, with a substantial rise in the value of leisure services, highlighting the growing contribution of Chengdu’s leisure services industry to the economy. The values for water purification and fresh air declined between 2015 and 2017 but rebounded in 2019. Among the eight indicators, only pest control exhibited consecutive declines from 2015–2017 and 2017–2019, possibly reflecting reduced pest control costs and improved prevention efficiency. Overall, seven of the eight indicators showed increases, with the exception of pest and disease control, indicating an upward trend in the ecological value of Chengdu City.
3.5. Ecological Value Volume Correlation Analysis
This study employed Pearson correlation analysis to examine the relationships between various ecosystem service functions in Chengdu City. The results indicated a significant correlation (1.00,
p < 0.05) between agriculture, forestry, animal husbandry, and fishery activities and water conservation, suggesting that these activities enhance the soil’s water retention capacity. Regulating climate also showed a significant correlation with water conservation (1.00,
p < 0.05), suggesting that effective soil and water conservation can reduce soil erosion and maintain soil moisture. Additionally, significant correlations (1.00,
p < 0.05) were found between soil conservation and agriculture, forestry, and fisheries, as well as between leisure services and both agriculture, forestry, and fisheries, and water conservation (
Figure 7).
3.6. Gray Model Based Predictive Analysis
In constructing the gray forecasting model GM(1,1) for the output value of agriculture, forestry, animal husbandry, and fishery in Chengdu, the data series was initially subjected to the rank-ratio test to evaluate its applicability (
Table 2). This test involves calculating the ratio of data from two consecutive periods (i.e., the value from the previous period divided by the value from the current period). The results of the rank-ratio test showed that all calculated ratios fell within the predefined reasonable interval of [0.607, 1.649]. This suggests that the time series data for the output value of agriculture, forestry, animal husbandry, and fishery in Chengdu demonstrate adequate stability and regularity, making them suitable for further modeling and forecasting using the GM(1,1) model.
The C-value of the post-test difference ratio, as analyzed from the data table, was found to be 0.0001 ≤ 0.35, indicating excellent model accuracy. Additionally, the
p-value for the probability of a small error was greater than 0.95, further confirming the model’s high accuracy (
Table 3).
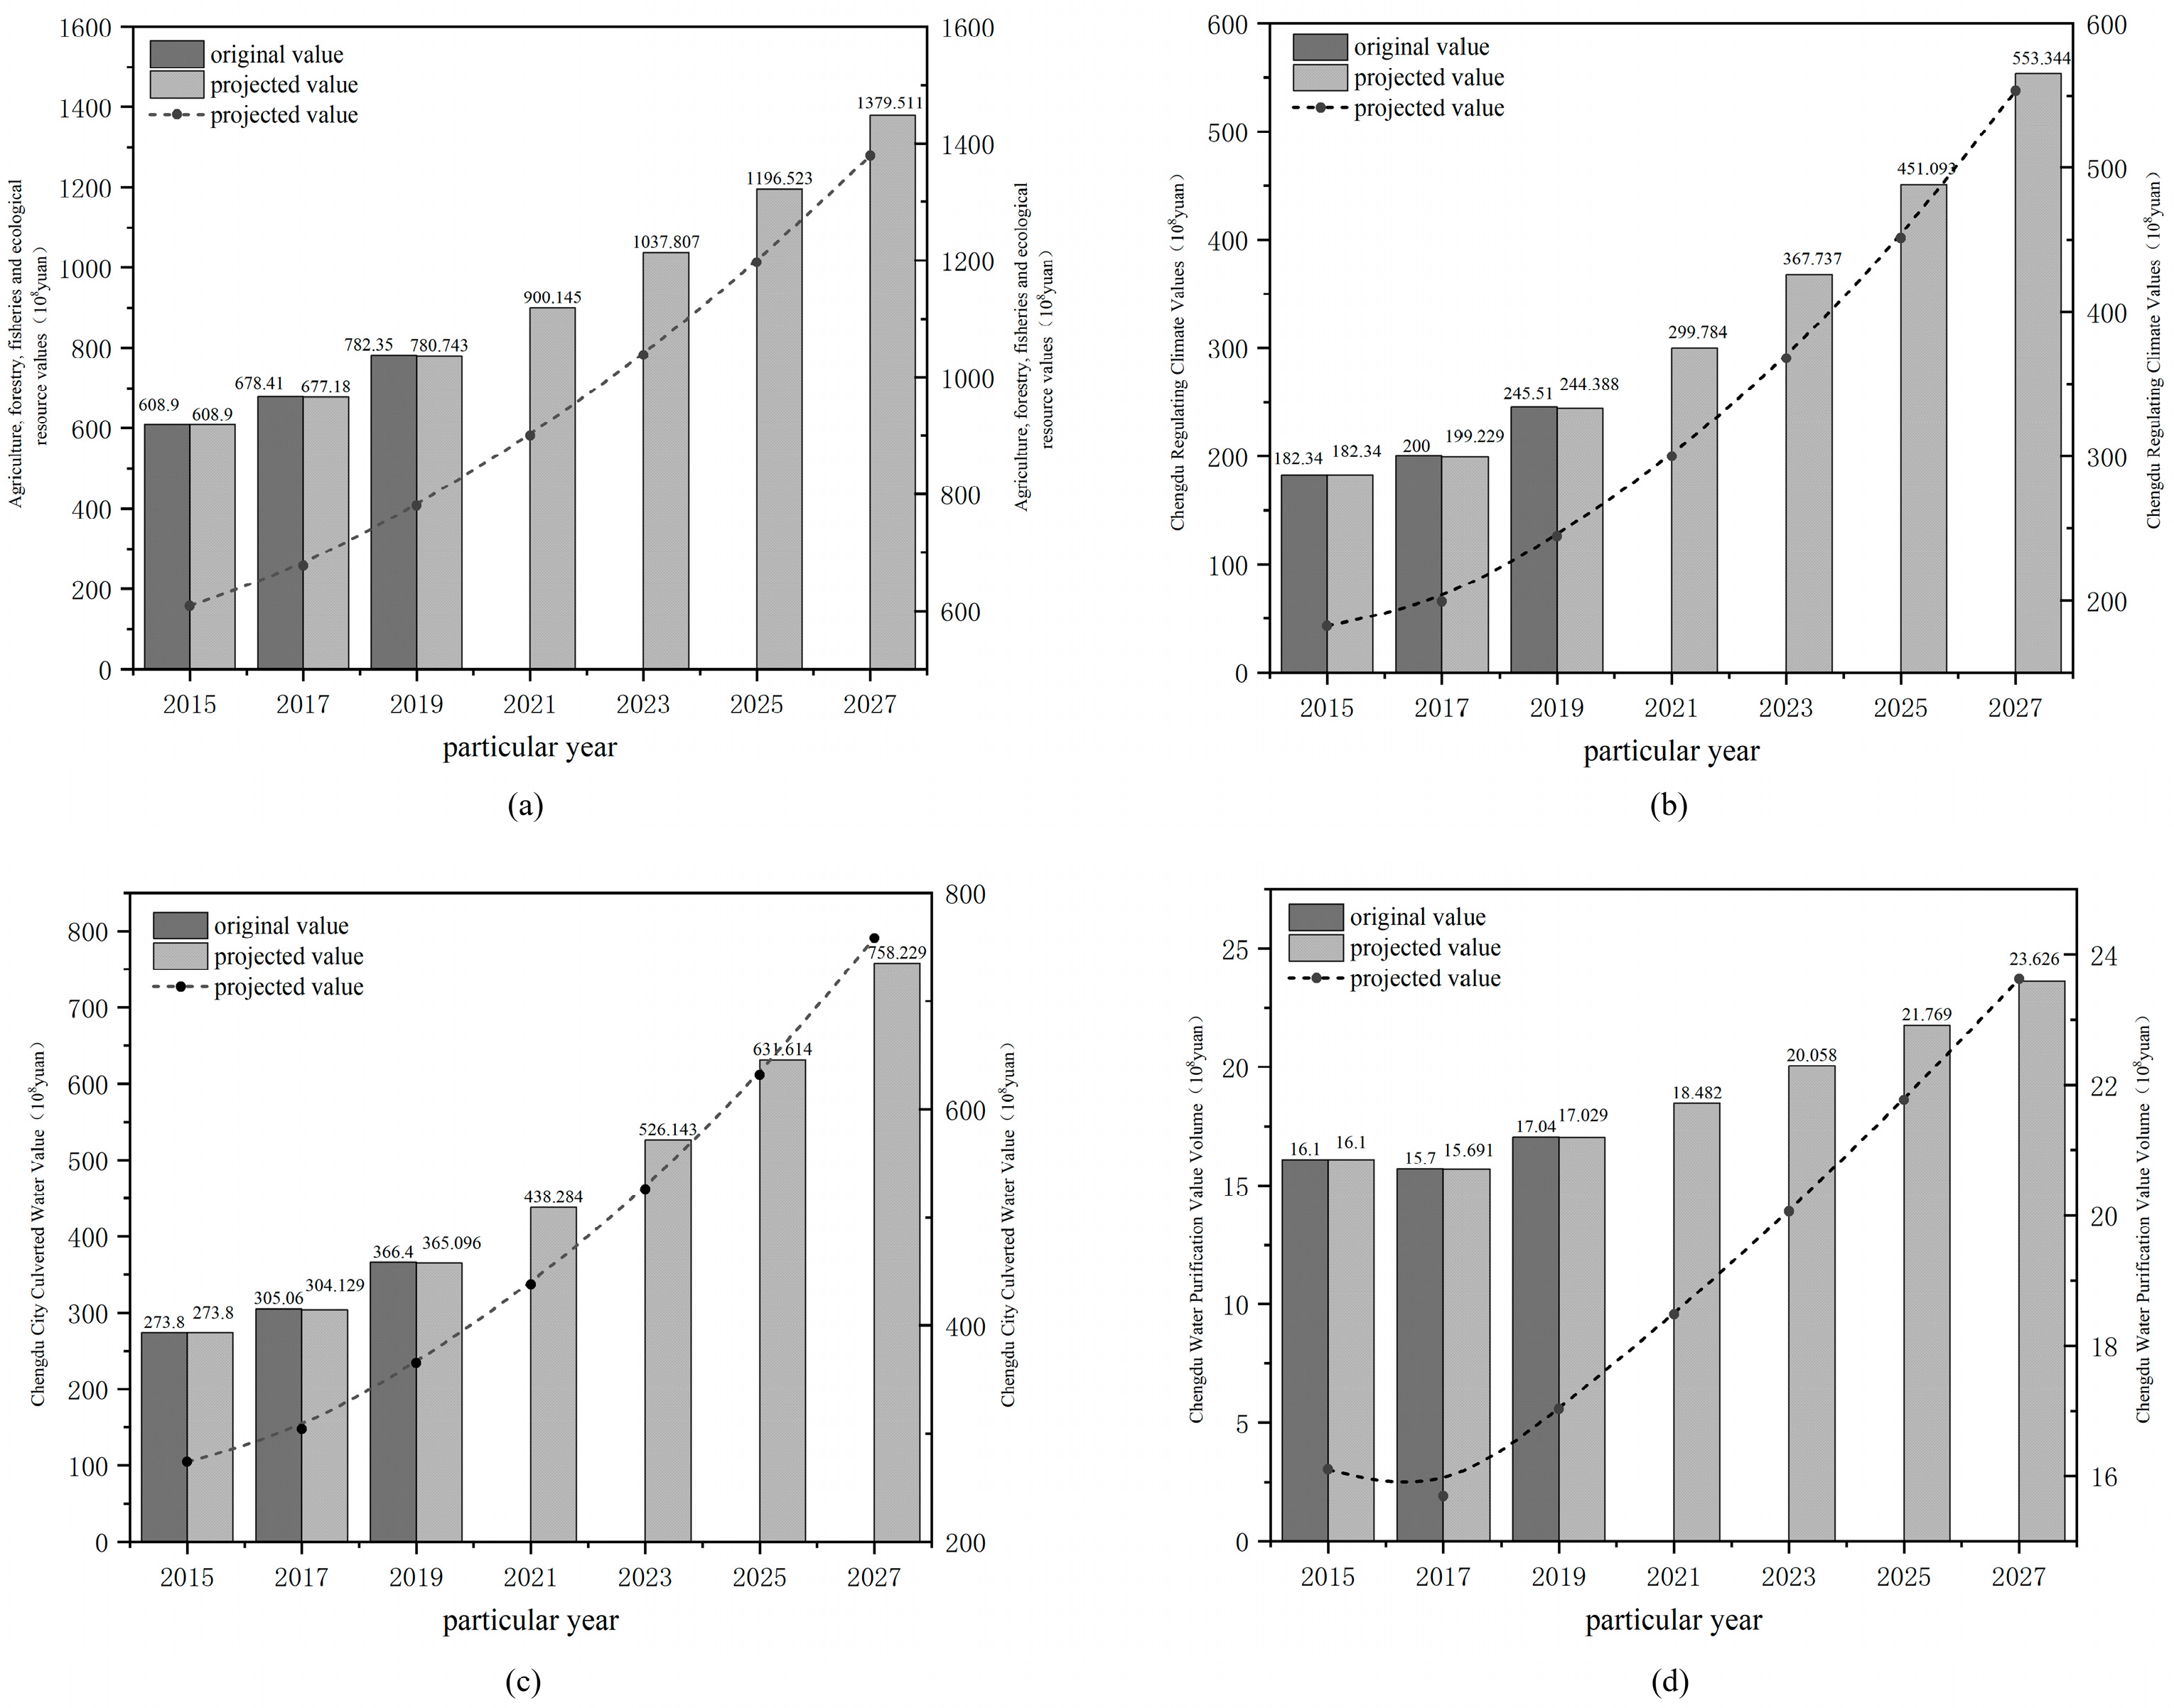
The data were projected for the next four time periods based on the values of agriculture, forestry, livestock, and fisheries in Chengdu for the years 2015, 2017, and 2019, yielding projected values for the years 2021, 2023, 2025, and 2027 (
Table 4).
After constructing the model, the relative error and level deviation values were analyzed to assess the model’s performance. The maximum relative error was 0.002, which is less than 0.1, indicating a high degree of model fitting. Additionally, the level deviation value of 0, which is also less than 0.1, suggests that the model fitting meets high standards (
Table 5).
The gray model prediction method was applied to predict the remaining seven value quantities in the study area, resulting in a summary table of all value quantity predictions (
Table 6 and
Table 7). The predictions show a linear growth trend in all seven value indices except for the pest control value volume, which exhibited a decline (
Figure 8 and
Figure 9).
4. Discussion
4.1. Characteristics of Dynamic Evolution of Ecological Value Volume in Chengdu
The quantification of ecological value plays a crucial role in enhancing the identification and protection of urban ecological environments, thereby significantly contributing to the ecological construction and development of Chengdu City. As a demonstration area for the construction of a “Park City”, Chengdu has assumed a leadership role in advancing green and low-carbon development, promoting the integration of ecological and socio-economic progress, and establishing mechanisms for realizing the value of ecological products. This study analyzes the trends in the growth of ecological values in Chengdu and forecasts the potential changes in these values over the next four periods. The findings indicate that, between 2015 and 2019, the values associated with agriculture, forestry, animal husbandry, and fishery; climate regulation; water conservation; water purification; air purification; soil conservation; and recreational services all showed an increase, with the exception of the value of pest control, which exhibited a consecutive decline. This decline in pest control value may be attributed to improvements in pest control efficiency. Furthermore, in recent years, with the acceleration of the “Park City” initiative, it is projected that by 2022, the forest coverage rate in Chengdu will reach 40.2%, and the greening coverage rate in the built-up areas will rise to 43.9%, further contributing to the enhancement of regulating service values.
4.2. Limitations and Future Prospects
Although this study provides a comprehensive econometric analysis of the ecological value volume in Chengdu, several limitations remain. First, the study is constrained by a limited time span, relying on data from only three years, which does not capture the full temporal variation in ecological value volume. Second, some data may be influenced by discrepancies in statistical standards and data sources, potentially introducing bias into the analysis. Additionally, the absence of data from the city of Jianyang (denoted as 0) may lead to underestimation in the calculated values. Future research could extend the time frame, explore the specific mechanisms through which various factors influence changes in ecological value volume, and incorporate more field research and case studies to enhance the accuracy and practical applicability of the findings.
In China, previous studies on gray prediction models have primarily been applied in the fields of macroeconomic management, mathematics, nonlinear science, and system science, with comparatively fewer studies focusing on the ecological domain. Notable examples include reference [
34], who predicted the evolutionary trend of tourism security in Zhangjiajie, China, by improving the TOPSIS method in conjunction with the GM(1,1) model, and reference [
35], who developed a safety evaluation index system for urban agglomerations in central Yunnan Province to facilitate ecological safety early warning for urban areas. While most ecological research utilizing gray prediction models has centered on ecological early warning and evaluation, there is a notable gap in studies focusing on the measurement and prediction of ecological value.
In the field of ecological value measurement, four primary ecological value measurement methods exist. The unit area value equivalent method [
36,
37] is the most commonly used approach. The expert knowledge modification method refines the Costanza method for the Chinese context through extensive expert surveys, thereby improving the accuracy of ecological value measurement and assessment. The environmental replacement cost method [
38] enhances result accuracy by incorporating cost-based calculations. The multi-indicator comprehensive assessment method [
39,
40] quantifies ecological value by incorporating both direct and indirect ecosystem services. This study employs the multi-indicator comprehensive assessment method to integrate various ecological service indicators, better capturing the overall ecological value. However, the lack of standardized assessment criteria leads to inconsistencies in measurement data across different regions. Future research should establish standardized indicators to minimize errors stemming from methodological discrepancies.
Ecological value prediction primarily employs three methods. The gray GM(1,1) model [
41,
42] forecasts the future development of ecological value in regions such as Poyang Lake, Jiujiang, Jiangxi Province, and Guizhou Province. The FLUS and CA-Markov models [
43,
44] have been applied to assess ecosystem service value (ESV) in Foshan City and Southwest China. The dynamic process model [
45] has been used to analyze ecological value in the Beijing-Tianjin-Hebei region. While studies on ecological early warning and valuation exist, research on the measurement and prediction of ecological value—particularly in Southwest China, including Chengdu—remains limited, especially regarding the application of gray prediction models. To address this gap, future research should further investigate the application of gray prediction models in ecological value measurement and forecasting, contributing to ecosystem protection, resource management, and environmental policy development. Integrating principles from ecology, economics, and systems science, the gray prediction model offers a scientifically robust and precise tool for ecological value assessment and forecasting.
In order to accurately analyze and predict the ecological value volume of Chengdu City, this paper accounts for the statistics of each ecological value volume in Chengdu City and analyzes and predicts it by the construction of a GM(1,1) model and using a gray model. By analyzing the results of value quantity prediction, it provides a data reference for urban construction and planning and policy-making in Chengdu City. The conclusions of this study are mainly applicable to regions with similar urbanization stages and ecological policy orientations (e.g., ‘park city’) to Chengdu. In the future, the generalizability of the model needs to be further validated by extending the observation period and adding multi-region comparisons (e.g., Chongqing, Kunming). The study of ecological value quantity measurement in Chengdu City helps to realize the coordination between ecosystem protection and economic development by studying the impact of ecological protection on economic development through the analysis of ecological value quantity measurement, as well as providing data support for policy-making.
5. Conclusions
In this study, we conducted an in-depth econometric analysis of Chengdu City’s ecological value between 2015 and 2019, covering eight key ecological value indicators: agriculture, forestry, animal husbandry and fishery, climate regulation, water conservation, water purification, air purification, soil conservation, pest and disease control, and recreational services. Using ArcGIS software, we spatially visualized these indicators and systematically analyzed their dynamic trends at three key time points: 2015, 2017, and 2019.
The results of the study indicate that from 2015 to 2019, the ecological value volume indicators of Chengdu City generally exhibited a stable growth trend. By analyzing the eight key indicators of ecological value volume, we observed a clear hierarchical pattern in their changes. Specifically, recreational services, agriculture, forestry, animal husbandry and fishery, and water conservation experienced significant growth over the period, increasing by CNY 178.504 billion, CNY 32.878 billion, and CNY 9.260 billion, respectively, while the value of pest control exhibited a slight decline. Meanwhile, the remaining four ecological value indicators exhibited a consistent upward trend.
On the trend of increase and decrease in the phases of 2015–2017 and 2017–2019, the value volume of water purification, the value volume of fresh air, and the value volume of pest control in Chengdu City showed a small decline in 2017 compared with 2015 to CNY 0.04 billion, CNY 0.20 billion, and CNY 0.66 billion yuan, respectively. Among the eight value volume indices, pest control was the only one to exhibit consecutive decreases during both periods, with a total reduction of CNY 185 million.
Chengdu’s ecological values exhibit pronounced spatial heterogeneity, characterized by core-periphery gradients and dynamic shifts. Key services—agriculture-forestry-animal husbandry-fishery, climate regulation, and soil conservation—follow a “low-central, high-peripheral” pattern, with central-peripheral disparities peaking at CNY 9.759 billion and CNY 4.684 billion in 2019, driven by urban expansion reducing central ecological land versus sustained agricultural and ecological integrity in peripheries. Water conservation transitioned from “low-central, high-peripheral” (2015) to “high-central, low-peripheral” (2019), reflecting central hydrological enhancements via sponge city projects. Recreational services polarized, with the central area surging 125% to CNY 321.3 billion (2019), dwarfing Pujiang County (CNY 4.785 billion), highlighting its dominance in open-space provision. Water purification and air quality remained spatially balanced, while pest control displayed a heterogeneous “low-central, high-east-west-south” distribution, These patterns underscore urbanization-policy interplay in shaping ecosystem service differentiation.
The forecast indicates a generally stable growth trend in Chengdu City’s ecological value volume over the next four periods, with the exception of pest control, which is predicted to continue decreasing. The prediction suggests that by 2027, the value volume of agriculture, forestry, animal husbandry, and fisheries will reach CNY 137.951 billion, twice the 2015 level; climate regulation will reach CNY 55.334 billion, three times the 2015 level; water conservation will increase to CNY 75.823 billion; water purification will reach CNY 2.363 billion; fresh air will grow to CNY 24.038 billion; soil conservation will double to CNY 4.743 billion; pest control will decline by 66%; and open space services will grow most significantly, reaching CNY 1711.337 billion, twelve times the 2015 value. The current and predicted data suggest that Chengdu City’s ecological value volume is generally on a positive trajectory; however, water quality purification and pest control remain underdeveloped. These areas require greater attention in future urban planning and economic development, particularly in terms of water body protection.


