Abstract
Urban minerals are secondary resources with economic value that can be recycled and utilized, including iron and steel, non-ferrous metals, rubber, and others. Accurately estimating the quantities of various components is a critical element in the urban mining operations that support sustainable resource management. To achieve this, ontology construction was employed to systematically define and structure the relationships among different entities in the domain. Knowledge graphs were developed to identify the constituent elements and mineralization process of iron and steel, contributing to improved sustainability in urban resource utilization. The knowledge graphs were constructed using a top-down approach and stored in a Neo4j database. When a knowledge graph of iron and steel components is constructed, the iron and steel products are classified into 5 major categories and 14 subcategories. The knowledge graph of the iron and steel mineralization process is divided into five iron and steel mineralization stages and combines industrialization and urbanization to represent the factors that play a role in the iron and steel mineralization process. By leveraging ontology construction, the knowledge graph can improve the efficiency of refining and analyzing data in urban mineral-related fields. This, in turn, provides an essential data basis for establishing a circular economic system for iron and steel industry resources and advancing sustainability-oriented urban mining practices.
1. Introduction
Iron constitutes approximately 5.6% of the Earth’s crust [1], ranking second after oxygen, silicon, and aluminum. Australia, Brazil, Russia, and China are the top four countries in the world in terms of iron ore reserves [2]. Global iron ore exports grew nearly 2.6 times between 2000 and 2019 [3]. The provinces of Liaoning, Sichuan, and Hebei have identified the largest reserves of iron ore. Hebei province in China produced 232.8t of crude iron and steel in 2018 [4], far exceeding EU and North American production. Due to their high strength and toughness, iron and steel are extensively utilized in various fields such as bridges, automobiles, construction, and machinery manufacturing. They play a vital role as a fundamental material in urbanization and industrialization. From 2011 to 2021, there was a significant rise in global iron and steel consumption, increasing from 1.419 billion tons to 1.834 billion tons. A significant amount of resources is concentrated in cities in the form of products and materials, contributing to the formation of urban minerals. Scrap iron and steel play a crucial role in urban minerals. The complete development and utilization of urban minerals is an effective strategy to address the current challenges of limited resources and environmental concerns. It is crucial to understand the composition and mineralization process of urban minerals. This knowledge is essential for accurately assessing the quantity of iron and steel resources and effectively developing and utilizing them.
Several scholars have already categorized end products containing iron and steel. The main experimental idea is to take a city or country as the study area, delimit the study category or product, and use mathematical or analytical methods to calculate the stock of iron and steel. Pauliuk et al. [5] used dynamic material flows to calculate the stock of iron and steel in construction, machinery, transportation, appliances, and supplies in 200 countries from 1700 to 2008. Differences in per capita stock use were analyzed for countries with different periods of industrialization. Müller et al. [6] established that Germany’s per capita in-use steel stock reached 12 metric tons by 2010, with infrastructure development being the primary driver, reflecting the material intensity characteristic of industrialized nations. Using a bottom-up approach based on geographic information systems (GIS), Kleeman et al. [7] calculated the stock of building materials such as iron and steel in buildings in the city of Vienna, Austria, for the period 1918–2013, and the stock of materials in buildings is an essential source of urban minerals. Similarly, Tanikawa et al. [8] estimated the iron and steel stock in Japanese cities, highlighting that Tokyo’s urban infrastructure contains over 100 million tons of steel, with buildings accounting for more than 60% of the total. Using material flow analysis, Li et al. [9] found that 55% of the iron and steel was used in construction, 19% in machinery manufacturing, and 12% in transportation equipment. In the United States, Graedel et al. [10] analyzed the iron and steel flows in the automotive industry, showing that vehicle manufacturing accounts for approximately 20% of total steel consumption. Yu et al. [11] established a hybrid accounting modeling framework in China. The estimation results showed that China’s per capita iron and steel holdings increased by a factor of 1.96 from 2002 to 2016, that the iron and steel stock in buildings consistently exceeds 50% of the total, and that the period of 2021–2035 is the peak of iron and steel scrap generation in the construction industry. Zhong et al. [12] modeled the in-use iron and steel stock in the Belt and Road region using multi-source night-time lighting, with high-intensity iron and steel use concentrated in China, Russia, and India. Xu et al. [13] used a bottom-up approach to estimate the stock of iron and steel in use for 32 types of infrastructure and vehicles in 31 provinces of China from 1990 to 2019, and the stock of iron and steel in use in China’s transportation system grew to 575 Mt in 2019, with vehicles being the main growth point. Kong et al. [14] estimated the historical iron and steel stock and flow of global ships from 1980 to 2019, and the iron and steel stock of ships grew from 208.4 Mt in 1980 to 542.9 Mt in 2019, with iron and steel from scrapped ships worldwide predicted to increase to reach 40.4–47.3 Mt in 2050.
With the progress of science and technology and the upgrading of consumption, the accumulation of urban minerals has been increasing and has diversified [15]. Therefore, analyzing the metallogenic process of iron and steel is the key to determining urban minerals’ distribution law. Determining the main processes and influencing factors from natural to urban minerals can provide a basis for recycling and utilizing related materials. Yan et al. [1] divided the iron and steel mineralization process into five stages: mining, pig iron smelting and crude iron and steel refining, processing and manufacturing, product use, and scrap management and recycling. The value of each set of iron and steel products was quantitatively analyzed and calculated using the material flow and value chain methods. It was estimated that the recycling stage of crude iron and steel could increase revenue by USD 95 billion. Recycling scrap in the use phase of iron and steel products can enable the entire economic system to recover USD 370.78 billion. On the basis of the BACI database, Nakajima et al. [16] estimated the global iron trade flows embedded in bilateral trade between 231 countries through the trade volume of commodities and the iron content of products. The data show that 35.2% of iron flows to the significant crude iron and steel producers, namely China, Japan, and the United States, and that the BRICS countries’ share of world iron resource imports is only 2.8%. Alessio et al. [17] developed a bottom-up inventory-driven model to study the material demand of the US road network using transportation network expansion as a driver. The results showed that the stockpile of construction mineral materials in the US road network was 1.51 billion tons in 2015, a 21-fold increase since 1905. Chen et al. [18] divided the iron and steel mineralization process into the production, manufacturing, use, and end-of-life stages. They established a composite flow framework to quantitatively analyze the loss of China’s iron resources raw materials’ import and export data and processing. There is a vast potential for secondary utilization of scrap iron. Liu et al. [19] calculated iron, copper, and aluminum inventories in 51 categories of products and infrastructure in 10 Chinese megacities from 1980 to 2016 through a bottom-up approach, then analyzed economic development as the most vital driver of metal inventory growth on the basis of the IPAT equations, with relatively little influence from the population. Using a bottom-up approach, Yue et al. [20] calculated iron and steel in-use stocks in six provinces in China, with Jiangsu province having iron and steel in-use stocks amounting to 462.9 million tons in 2018, and the spatial distribution of municipal steel stocks calculated from the provincial estimates showed that the level of economic development has a significant impact on the density of iron and steel in-use stocks.
Current research on urban minerals focuses on the social accumulation of specific mineral elements. Traditional methods like hierarchical diagrams and table enumeration fragment knowledge and impede information sharing. Material flow diagrams only partially capture relationships and influencing factors. In contrast, knowledge graphs improve data’s usability and readability by representing data through entity relationships. They have been successfully applied in various fields such as electronics [21], healthcare [22,23], and food science [24]. Therefore, the present paper proposes a knowledge graph approach for urban minerals, constructing a knowledge graph of iron and steel constituents. This method organizes information efficiently, visualizes metallogenic processes, converts unstructured data into semantic networks, and enhances data accessibility and computation through machine learning. It overcomes the limitations of traditional methods, providing a robust framework for studying in-use stocks and accumulations. This approach is particularly significant for promoting sustainable resource management and circular economy practices by enabling more efficient and informed decision-making processes related to urban minerals.
2. Materials and Methods
2.1. Knowledge Graph
The knowledge graph is a semantic network for describing concepts, entities, and their relationships in the objective world [25]. It mainly constructs models of the relationships between concepts, where the graph nodes represent entities or concepts and the edges define the relationships between entities/concepts. It can be stored in a simple formal format [26] and has essential applications [27] in areas such as intelligent searching, machine understanding, and predictive decision-making. Knowledge graphs can be divided into early knowledge bases, open knowledge graphs, generic knowledge graphs, and domain knowledge graphs [28]. Early knowledge bases are typically built by experts in related fields and used for information retrieval and question answering, with high accuracy but limitations such as small coverage. The open knowledge graph allows anyone to access, share, and modify it, subject to open-source protocols and principles of openness. The general knowledge graph focuses on fusing more entities with richer semantic connotations and is more commonly used in areas such as intelligent searching. The domain knowledge graphs are used for complex application analysis or decision support in specific domains and have a strict ontology layer model with complex knowledge structures and high expert involvement.
2.1.1. Logical Structure
The knowledge graph logically consists of two parts, namely the data layer and the schema layer [29], and requires certain constraints and specifications to form a logical architecture.
The data layer consists mainly of facts. The facts can be expressed as a triad of “Entity 1, Relation, Entity 2” or “Entity, Attribute, Property Value” in the resource description framework (RDF), which can be expressed as a directed graph structure. RDF is a directed graph structure, resulting in a network of entity–relationship attributes, where entities are specific objects or things, such as specific names of people, places, times, etc. Relationships are semantic links between the entities. Attributes map the relationships between entities and attribute values, which are parameter values specific to the entity or concept. The schema layer is the conceptual model and logical foundation of the knowledge graph that governs and constrains the specific knowledge forms of the data layer [28]. It represents the data structure, the hierarchy, and the definition of classes of knowledge. An ontology can be used as a schema layer to regulate the factual representation of the data layer through rules and axioms defined by the ontology.
2.1.2. Framework
Knowledge graphs can be constructed in three ways: top-down, bottom-up, and a mixture of the two [30]. This paper uses a top-down approach to construct knowledge graphs.
In the top-down approach, ontologies are first learned from open data sources to obtain terms, top-level concepts, synonymy, hierarchical relationships, and the associated rules [31]. Ontology construction is performed to form a concept hierarchy tree, and then entity learning is performed to populate the constructed concept system with entities (Figure 1). Different steps of this approach are explained as follows.
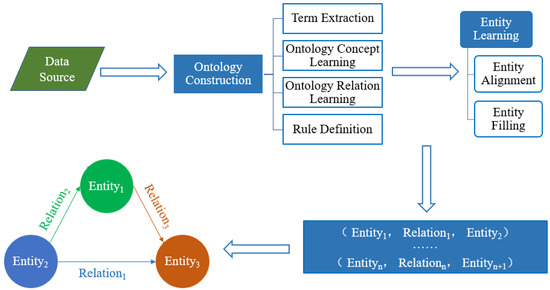
Figure 1.
Top-down construction of a domain-specific knowledge graph.
- (1)
- Ontology construction is a process that involves both structural and logical complexity. It aims to construct conceptual knowledge templates that normatively describe the concepts and relationships between concepts in a specified domain. Relevant terms, concepts, relationships, and rules must be extracted from data sources. Ontology construction methods are divided into automatic, semi-automatic, and manual construction.
- (2)
- Entity learning, also known as entity recognition, involves extracting information about the entities involved from large amounts of raw data. The focus is on accurately normalizing different representations of the same conceptual entity (entity alignment) and distinguishing between various entities of the same term in different contexts (entity padding). There are three main types of recognition methods: rule-based, statistical model-based, and neural network-based.
2.1.3. Knowledge Storage
Currently, knowledge graphs are mainly stored using relational databases or graph databases, or a mixture of the two methods, as follows.
- (1)
- Relational databases
A relational database-based storage solution is one of the main approaches to storing knowledge graph data. This approach involves converting the knowledge graph to an RDF triad form and mapping it to a relational table for storage in a relational database. Current relational-based knowledge graph storage schemes include triad tables, horizontal tables, attribute tables, vertical partitions, sixfold indexes, and DB2RDF [32].
- (2)
- Graph databases
The knowledge graph storage method based on the graph database stores the entity or attribute values of the knowledge graph as nodes in the graph database and the relationships or attributes as edges connecting the nodes. This approach enhances the relational representation and improves the efficiency of data retrieval. The main graph database methods for storing knowledge graphs are Neo4j storage for attribute graphs and gStore storage for RDF graphs.
2.2. Ontology Construction and Knowledge Extraction of Iron and Steel Constituents
The first task in developing and utilizing urban minerals is the determination of the constituent elements and contents. In this paper, the ontology is constructed by defining a classification framework for iron and steel products, ontology relationships, and rules. The required entities and attributes are then extracted from the data sources to store and map using a Neo4j graphical database (https://neo4j.com/, accessed on 14 February 2025) for knowledge graphs of iron and steel constituent elements.
2.2.1. Ontology Construction of Iron and Steel Constituents
The top-level ontology starts from the top-level concept, and then the sub-concepts and relationships are divided in detail. Normalization describes the concepts and relationships within a specified area. This paper defines the relevant concepts, relationships, and rules on the classification framework of iron and steel products.
Definition 1.
Classification framework for iron and steel products: The classification framework is the primary classification structure of the mapping of iron and steel constituents, consisting mainly of primary and secondary category concepts expressed in the following equation
where C1 is products containing iron and steel; C2 is the building category, where C21 is residential and C22 is non-residential; C3 is the infrastructure category, where C31 is roads and bridges, C32 is municipal, and C33 is electrical; C4 is the machinery and equipment category, where C41 is agricultural machinery and C42 is industrial machinery; C5 is the transport category, where C51 is automotive, C52 is urban rail, C53 is ships, C54 is aircraft, and C55 is railway locomotives; C6 is the durable goods category, where C61 is special and C62 is commonly used; C7 is the iron content of the product; and E is the body, mainly the product containing iron and steel.
ON_Concept = {C1, C2{C21, C22}, C3{C31, C32, C33}, C4{C41, C42}, C5{C51, C52, C53, C54, C55}, C6{C61, C62}, C7, E}
Definition 2.
Constituent ontology relationships: Using the example of the ontology relationship between the concept of iron and steel and the related concepts of the subtype, the relationships in the ontology are expressed as follows
where the relationships R1 to R6 are defined as the relationship between the parent and child concept ‘belong to’, R7 is the relationship between the category and the product ‘belong to’, and R8 is defined as the relationship between the product and the iron content ‘Iron_content’.
{R} = {R1(C1, C2~C6), R2(C2, C21~C22), R3(C3, C31~C33), R4(C4, C41~C42), R5(C5, C51~C55), R6(C6, C61~C62), R7(C, E), R8(C7, E)}
Definition 3.
Rule: Define the ontology as e = (E, F, A), where E denotes the entity of the category or product, F means the parent concept, and A is the attribute of E. The rule is that the ontology includes at least two elements, the subcategory, and the parent category, and an entity can belong to only one parent category. To avoid semantic ambiguity, the attribute-value elements are extended on the basis of the ontology according to the actual situation. For example, a car belongs to the transport category, a large passenger car belongs to the car category, and a washing machine belongs to the durable goods category and has an iron and steel content of 18 kg/unit.
2.2.2. Knowledge Extraction
The specific name and category name are extracted from the data source, and the attribute extraction is transformed into relational extraction to obtain the product’s attribute information. The different representations of things or conceptual entities are unified, and the data are converted into a triad format with the category, product, and attribute values as entities, and the linking relationships are defined. The specific details are as follows.
- (1)
- Data sources
The research on iron and steel mainly focuses on the calculation and analysis of the stock and accumulation of related products, and the research objects of related literature converge. To improve the data quality, this paper takes the professional literature and authoritative statistical yearbooks from recent years as data sources. The specific data information are shown in Table 1, from which the knowledge units are extracted, aligned, and filled.

Table 1.
Sources of experimental data in iron and steel research: professional literature and authoritative statistical yearbooks.
- (2)
- Knowledge extraction
Combining the Wikifier API and the open-source relationship extraction toolkit OpenNRE (https://github.com/thunlp/OpenNRE, accessed on 2 March 2025), ontologies are identified and located from the text to extract possible relationships between entities. The recognition results are then classified into predefined categories, and an example of this application is shown in Figure 2.
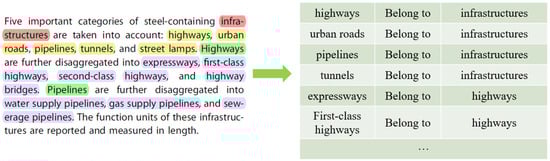
Figure 2.
From text-based ontological identification to predefined relation categorization.
2.3. Ontology Construction of Iron and Steel Mineralization Processes
2.3.1. Entity Learning
The object information is the main processes of iron and steel mineralization and the factors influencing the process of industrialization and urbanization. The relevant structured, unstructured, and semi-structured data are represented in a normalized way. The data are then converted into data in ternary format with the process, element, stage, category, and deposit as entities.
2.3.2. Ontology Construction
Definition 4.
Process ontology of mineralization: this involves mainly process ontology, factor ontology, and related processes, expressed as the following equation
where F1 is iron and steel, F2 is urbanization, F3 is industrialization, F4 is mineral smelting, F5 is chemical production, F6 is processing and manufacturing, F7 is usage, and F8 is the end-of-life and regeneration stage; F4~F8 are the entity nodes of different stages of the iron and steel manufacturing process; V is the ontology of the action factors; X is the various states of the iron and steel manufacturing stage; Y is the related detailed process; Z is the production conditions; and W is the information of the iron and steel use stage categories.
{F} = {F1, F2, F3, F4, F5, F6, F7, F8, V, X, Y, Z, W}
Definition 5.
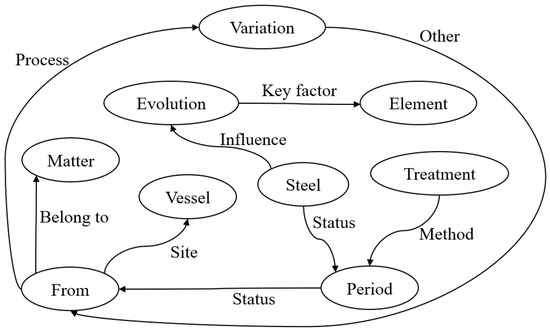
Ontology relationships are defined on the basis of three levels: concept, entity, and relationship. The relationship between the same node and its different status nodes is the ‘status’. The relationship between other status nodes in the same process is defined as the ‘process’. The containment relationship between nodes is denoted by ‘Belong_to’. The relationships between nodes and node-related elements are mainly the location ‘Site’ and the conditions ‘Additive’, ‘Temperature’, ‘Gas’, ‘Energy’, ‘Method’ and so on. The relationship between industrialization and urbanization in the process of iron and steel mineralization is ‘Influence_relation’, in which the relationship between industrialization and urbanization and their influencing factors is defined as the ‘Key factor’, as shown in Figure 3 [43,44].
Figure 3.
Multi-level ontological relationships in iron and steel mineralization; entity status hierarchies, and industrial influence networks.
3. Results
3.1. Knowledge Graph of Iron and Steel Constituents
Relationships among concepts, entities, and attributes are established using triples. Knowledge graphs using Neo4j are drawn with circles to represent concepts, entities, or attribute values, and the edges of linked nodes are represented as relationships or attributes. The knowledge graph of iron and steel constituents is constructed as shown in Figure 4.
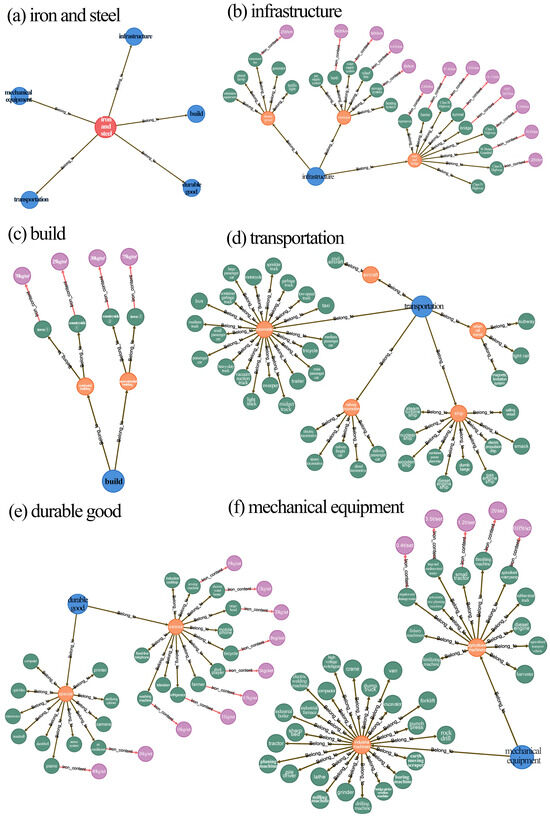
Figure 4.
Comprehensive knowledge graphs centered on iron and steel: 172 nodes and 171 relationships for major steel products.
As can be seen in Figure 4, the steel-centered knowledge graph covers most of the significant steel-containing products and contains 172 nodes with 171 node relationships. Five main categories are included: buildings, infrastructure, machinery and equipment, transport, and durable goods. There are 14 subcategories: residential, non-residential, road girders, municipal, energy, industrial machinery, agricultural machinery, aircraft, automotive, light rail, ships, locomotives, general, and special. In the figure, circles represent concepts, entities, or attribute values, with colors distinguishing the types, where red labels represent the constituent items of iron and steel in urban minerals, blue labels indicate the five key categories, orange labels indicate the subcategories under the key categories, green labels indicate the products containing iron and steel, and purple labels indicate the iron content of the products. Entities or concepts are linked by directed edges, where the edges connecting the green and purple labels represent the ‘attribute’ relationship between entities and the attribute values. The red labels are connected to the blue labels, the blue labels are connected to the orange labels, and the orange labels are related to the green labels. The lines connecting the red labels to the blue labels, the blue labels to the orange labels, and the orange labels to the green labels represent ‘containment’ relationships between parent and child concepts, and between concepts and entities.
3.1.1. Buildings
There is a significant difference between urban and rural areas regarding the iron and steel content of housing buildings, mainly due to the living environment and the level of economic development. In cities and towns, where manufacturing and service industries are developed, and the area is small, the buildings are mostly reinforced concrete structures with high-strength iron and steel. In contrast, in rural areas, where agriculture is mainly developed and the area is open, the buildings are primarily brick and concrete structures. Overall, iron and steel intensity per unit of area is much higher in Beijing, Shanghai, and Guangdong than in provinces such as Tibet and Ningxia. Available research suggests that iron and steel in-use stock is mainly distributed in the construction sector and that scrap from construction will dominate future scrap production [34].
3.1.2. Infrastructure
The infrastructure knowledge graph is divided into three parts: electricity, municipal, and roads and bridges. The iron and steel content in the power sector is not easy to be counted due to case-specific differences, where the attribute values of transmission lines are derived from Wang’s research [45]. The less frequently counted berths and wharf shorelines are added to the municipal sector, and the water supply, gas supply, heat supply, and sewage systems are unified according to the form in the statistical yearbook. Differences in the iron and steel content in roads and bridges are mainly due to differences in natural conditions, where the classification of roads depends on the strength of the iron and steel in the road base and pavement. Natural conditions, such as mountains and water systems, are the main reason for the differences in bridge construction, which leads to a significant difference in the amount of iron and steel used per unit of a bridge in the plains versus the predominantly mountainous western region. Iron and steel stocks in China for bridges account for 93.9% of the iron and steel stocks for road infrastructure.
3.1.3. Machinery
Machinery and equipment are categorized into industrial and agricultural machinery, covering most of the critical instruments. Lathes, tractors, dump trucks, and construction machinery are all commonly used industrial machinery. With the acceleration of industrialization, the amount of related industrial machinery and equipment is overgrowing. Among agricultural machinery, large, medium, and small tractors are often used to calculate the stock of farm machinery and iron and steel. In addition, threshing machines, automatic rice transplanters, and agricultural transporters are also widely used and in high demand as tools in agriculture. The widespread use of advanced machinery is a defining feature of modern industrial economies. Countries with robust industrial systems possess a significant stock of machinery and equipment, which is second only to their reserves of construction iron and steel.
3.1.4. Transportation
The transport knowledge graph defines regionally distinct urban rail categories in addition to cars, ships, planes, and railway locomotives. Light rail has opened in places like Chongqing and Shanghai. Beijing, Shanghai, and Changsha have maglevs. Thirty-eight cities have opened metro operating lines as of 2022. In the automotive category, rubbish trucks, sprinklers, sweepers, vacuum trucks, and containerized rubbish transfer trucks are sanitation vehicles which can play an essential role in urban sanitation and have huge recycling potential. Ships are mainly divided by whether they need a prime mover to operate. Railway locomotives are classified into steam, electric, and internal combustion, according to the power source. Railway coaches and railway wagons are classified according to their use. Vehicles are constantly consumed and renewed in socio-economic systems and are an essential source of iron and steel recycling.
3.1.5. Appliances
In existing studies, the durable goods category is differentiated between urban and rural areas. However, according to China’s current level of economic development and urban–rural integration development policy, the distinction between durable goods owned by towns and villages is gradually narrowing, so there are limitations to this categorization method. Durable goods are classified into ordinary and special categories according to the price and popularity of the items. Products such as treadmills, exercise bikes, and printers, which have yet to be covered in previous studies, were classified in the special category. More popular products such as washing machines, refrigerators, and shower heaters were included in the ordinary category. Although most of the iron and steel content in durable goods is measured in kilograms, the advantages of a relatively short service life and a large base make durable goods vital in the field of iron and steel scrap.
3.2. Knowledge Graph of the Primary Iron Ore Mineralization Process
Primary iron ore must go through the mineralization process of geology, sedimentation, and transformation. However, urban minerals are entirely different from the prior iron ore mineralization law in terms of the mineralization conditions and the mechanism, as it is not a naturally occurring process but a cyclic process closely linked with socio-economic and other factors. This paper draws on the primary iron ore mineralization process, combines material flow and cyclic chemistry theories, explores the iron and steel mineralization process and driving factors in the city, and constructs a knowledge graph of the iron and steel mineralization process.
China is rich in iron ore types. Li et al. [46] classified the iron ore deposits in China into six categories according to their genesis: sedimentary metamorphic, magmatic, volcanic, sillimanite, sedimentary, and weathering and leaching. Among them, the volcanic type can be divided into marine and terrestrial volcanic rocks, and the sedimentary type can be divided into marine and terrestrial sedimentation. Figure 5 shows the knowledge map of the primary iron ore mineralization process in China, including the deposit type, mineralization time, genetic type, and distribution area. The time of mineralization and the genetic type are the most critical time and action factors of the mineralization process.
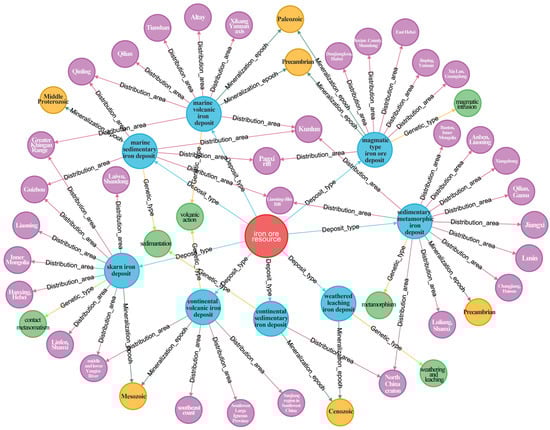
Figure 5.
Spatiotemporal knowledge graph of primary iron mineralization in China by genetic types.
The process of mineralization of primary minerals depends mainly on natural factors. Iron ore is gradually formed and enriched in the parent rock of mineralization by geological action. For example, sedimentary iron ore deposits [47] are formed when iron-bearing rocks or ore bodies exposed on the surface are crushed, transported, and then deposited under the weathering process. In contrast, the mineralization process of urban minerals is more complex, the driving factors are complicated, and a single law cannot describe the mechanism. The mineralization process of urban minerals is similar to that of primary minerals, such as the temperature and pressure conditions during the formation of iron ore deposits. Urban mineralization also requires physical or chemical conditions, but unlike the unidirectional rotation of primary minerals, urban minerals can be recycled. Urban minerals of iron and steel are derived from primary iron ore, as shown in Figure 6, which briefly illustrates the cycling of iron and steel resources from the natural world into human society. Still, the formation mechanisms of urban iron and steel mineral are complex. Therefore, to analyze the process of iron and steel mineralization in urban minerals, it is necessary to first divide the process, define the relationships, and clarify the properties.
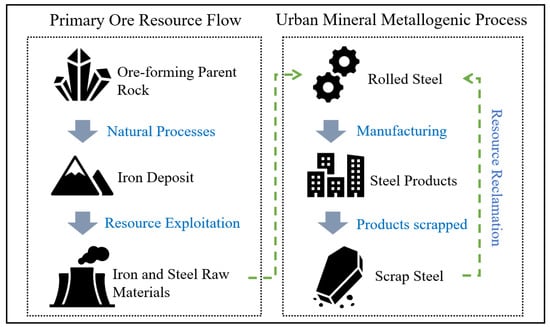
Figure 6.
Cycle of iron and steel resources from natural ore to urban minerals.
3.3. Knowledge Graph of the Iron and Steel Mineralization Processes
According to the material flow of the whole lifecycle of iron and steel minerals from mining to end-of-life recycling, the knowledge graph of the mineralization process of iron and steel was constructed. It is shown in Figure 7. It includes vital technologies and influencing factors in the iron and steel mineralization process and contains a total of 85 key nodes and 110 node relationships. Different colors of the circles are divided according to the node types. The red label is iron and steel. The blue label is the five crucial stages of the whole lifecycle of iron and steel. The green color is the form of iron and steel in different states. Purple is the main product type in the use phase. Light blue is the main manufacturing process. Apricot color is the reaction condition. Yellow and rose represent the influences of industrialization and urbanization, respectively. The colors of the directed edges between the nodes are yellow, orange, brown, blue, grey, and rose, depending on the type of relationship.
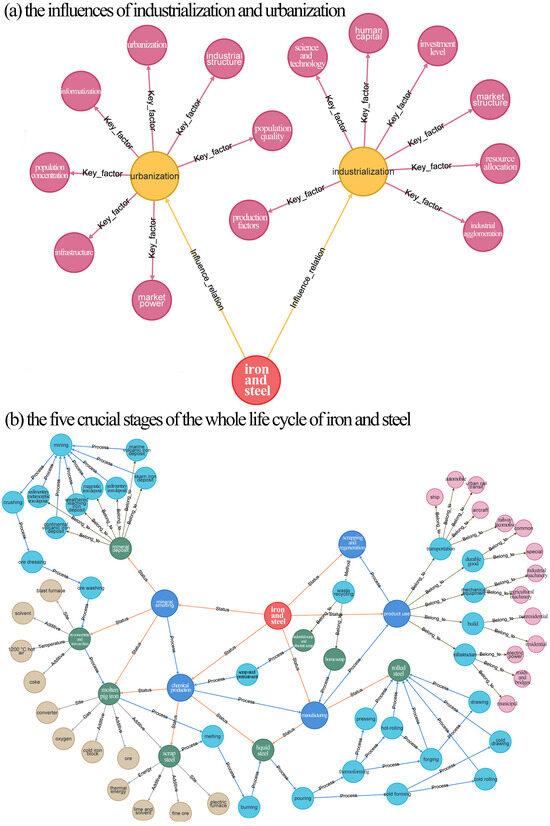
Figure 7.
Knowledge graphs of the iron and steel mineralization process across the full lifecycle: key technologies, node relationships, and influencing factors.
3.3.1. Mineralization Process
Iron and steel formation mainly includes five key stages: mineral smelting, chemical production, processing and manufacturing, usage, and end-of-life and recycling. It must go through the stages of ironmaking, steelmaking, steel casting, steel rolling, using, and recycling.
The main tasks in the mineral smelting stage are mining, crushing, concentrating, washing, sintering, and smelting. Iron ore mined from the deposit is transformed into iron ore concentrate or powder after crushing, beneficiation, and washing. The iron ore concentrate or powder ore is added to coke and solvent, sintered, and then put into a 100 m blast furnace. In hot air for combustion at 1200 °C, the burning coke releases heat, and the temperature rises to 1500 °C. Carbon monoxide from incomplete combustion separates the oxygen from the iron oxide, after which the iron ore melts into a purer pig iron liquid.
Chemical production is a crucial step in steelmaking. It is necessary to remove excessive impurities such as carbon, sulfur, and phosphorus in the pig iron liquid and add an appropriate amount of alloying components. The carbon content of commonly used steel is generally below 1%. Currently, widely used steelmaking methods include converter steelmaking and electric furnace steelmaking. Converter steelmaking involves feeding the pig iron liquid into the combustion converter, blowing in oxygen, and adding the appropriate amount of scrap, a small amount of cold pig iron block, and ore so that the pig iron liquid continues to maintain the melted state. Electric furnace steelmaking is mainly based on scrap as raw material; adding powdered ore, the appropriate amount of lime, and solvent; and smelting alloy steel and carbon steel through the very high heat energy in the electric furnace. Pig iron liquid is transformed into molten steel after melting and burning in the converter and electric furnace.
Fabrication is the process of processing molten steel into solid steel. Steel casting forms steel embryos or ingots that do not meet the dimensions and properties of the actual demand, so they need to be formed and processed in a rolling mill. Rolling includes both hot-forming and cold-forming methods. Hot forming includes hot rolling, forging, and extruding three forms. After hot rolling, steel can also continue to forge and draw. Cold forming includes cold rolling, and cold drawing has two forms. In the rolling mill, after the secondary forming of steel, the process forms the final product.
The product is mainly used for various types of steel-containing products in everyday life. On the basis of the constituent elements’ mapping, steel products are categorized into 5 major categories and 14 subcategories. When all kinds of products reach their end of life, they are piled up in the city, and the resulting urban minerals enter the waste and recycling stage. Processed and depreciated scrap from waste recycling enters the chemical production stage after scrap pre-treatment. The self-produced fraction enters the processing and manufacturing stage.
3.3.2. Driving Factor
After the reform and opening, urbanization process has accelerated in China, and urbanization is an inevitable modernization process. The iron and steel content of buildings is one of the characteristics that clearly distinguish cities from rural areas, and the difference in the growth rate of iron and steel stock in buildings before and after the reform and opening is noticeable. The urbanization strategy has led to the rapid development of urban building stock, resulting in increased mineral smelting and increased imports of crude iron and steel. Industrial restructuring has led to population accumulation and increased the number of durable goods owned by urban residents. The quality of the population changes along with the industrial structure. The related infrastructure and means of transportation have been gradually improved with the cities’ development and updated with the times under the influence of information technology. These factors interact with each other to accelerate the cycle of iron and steel mineralization, from the increase in ore mining to the increasing amount of iron and steel scrapped in cities.
Since the beginning of the Industrial Revolution in the 1870s, industrialization has become the theme of world economic development. Industrialization serves as the primary means of economic growth. The factors of production, resource allocation, and market structure determine the scale and direction of industrial agglomeration. The quantity of machinery and equipment needed for industrial development is directly proportional to human capital, the investment level, and science and technology. When the scale of industrialization development increases, the amount of iron and steel required to manufacture machinery and equipment increases, prompting the transformation of iron and steel into industrial and agricultural machinery. The level of development of machinery and equipment is one of the symbols of the degree of industrialization. The process of industrialization is accompanied by scientific and technological progress, economic development, and optimization of the market structure. In this process, iron and steel is continuously transferred from the mines to machinery and equipment, increasing the stock of urban minerals in use.
The urbanization and industrialization processes influence iron and steel mineralization and are the main factors determining the extent of urban mineral accumulation. The demand for iron and steel varies with urbanization and industrialization, starting with infrastructure development and equipment manufacturing. Iron and steel products continue to accumulate in cities under the influence of supply and demand and technological progress. Iron and steel products provide the material basis for urbanization and industrialization. They are influenced by their level of development in terms of the rate of mineral smelting, chemical production, and processing and manufacturing. The process of iron and steel mineralization interacts with the operations of urbanization and industrialization.
4. Discussion
This study proposes a novel knowledge graph-based approach for visualizing iron and steel products and their mineralization processes. Compared with traditional hierarchical diagrams and material flow frameworks, the knowledge graph method offers several advantages. (1) It clearly expresses hierarchical relationships through a classification framework, addressing the issue of excessive length in traditional methods. (2) It provides a detailed representation of product information through entities and relationships, making it easier to share and inherit knowledge. (3) It complements the details of the mineralization process, offering a more accurate and understandable alternative to the whole life-cycle material flow approach. Furthermore, the knowledge graph can be integrated with machine learning techniques to automate the extraction of the relevant product’s quantities, enabling efficient estimation of in-service iron and steel stocks.
Traditional approaches often face challenges in achieving an optimal balance between detailed representation and concise presentation. The knowledge graph proposed in this study addresses these limitations effectively through its flexible network structure and explicit relationship definitions. The knowledge graph’s flexible network structure clearly delineates the material state changes and correlations between different stages, enabling a more nuanced and comprehensive understanding of material flow processes compared with conventional methods. Unlike traditional material flow diagrams, which often lack explicit definitions of the relationships between nodes, the knowledge graph explicitly defines these relationships, thereby enhancing the accuracy and detail of interactions and dependencies within the material flow system.
Despite its advantages, the proposed methodology has certain limitations that warrant consideration. First, the variability in product design nomenclature over time necessitates the calibration of product names, which relies on known statistical almanacs or design standards. This inconsistency may lead to misclassification of certain steel products in the knowledge graph, particularly for transitional technologies. Second, the scope of data sources, such as recent literature and statistical almanacs, may constrain the generalizability of the results [48]. The predominance of Chinese and European data sources could introduce regional bias, potentially underrepresenting emerging steel production practices in other regions. To address these limitations, future research could incorporate diverse data sources and develop standardized steel classification ontologies to address naming inconsistencies. Furthermore, the methodology could be extended to other urban minerals, offering a broader framework for studying constituent elements and mineralization processes. A pilot application to copper or aluminum recycling systems could validate the framework’s adaptability. These advancements would strengthen the applicability and robustness of the proposed approach.
5. Conclusions
This study builds upon the existing iron and steel classification system and mineralization processes to construct two knowledge graphs: one representing iron and steel’s constituent elements and another depicting the iron and steel mineralization process. These graphs were developed through ontology construction, knowledge extraction, and ternary group representation. The research systematically categorizes iron and steel products, analyzes material flow processes, and examines influencing factors across the lifecycle of iron and steel. The key findings are summarized as follows.
- (1)
- Comprehensive classification system: the iron and steel component knowledge graph introduces an updated product categorization system with iron and steel as the top-level concept, considering regional differences and economic development levels.
- (2)
- Material flow analysis: the study formalizes key processes and material states across various lifecycle stages, including mine smelting, chemical production, processing and manufacturing, product use, and end-of-life recycling.
- (3)
- Identification of driving factors: by integrating the main driving forces of industrialization and urbanization, the research identifies key influences on the iron and steel mineralization process.
- (4)
- Enhanced clarity through the network structure: the knowledge graph’s flexible structure improves the representation of material state changes and correlations between lifecycle stages, addressing the limitations of traditional material flow diagrams.
- (5)
- Multidimensional knowledge expansion: the proposed methodology extends beyond single-element analysis, enabling the construction of an urban mineral knowledge graph encompassing multiple elements and attributes.
- (6)
- Graph database utilization: by leveraging graphical database query languages, the research facilitates knowledge extraction and implicit knowledge mining, offering a novel approach for exploring urban mineral knowledge.
This approach provides a more rigorous and comprehensive representation of lifecycle material flow, presenting significant advancements over conventional frameworks in the study of iron and steel mineralization.
Author Contributions
Conceptualization, Y.C.; formal analysis, L.Z.; funding acquisition, Y.S.; investigation, L.Z.; methodology, Y.C.; supervision, Y.C.; validation, L.C.; writing—original draft, L.C.; writing—review and editing, Y.C. and Y.S. All authors have read and agreed to the published version of the manuscript.
Funding
This research was funded by the High-tech Achievement Transformation and Industrialization Fund of Hunan Provincial Department of Science and Technology, grant number 2020SK2007.
Institutional Review Board Statement
Not applicable.
Informed Consent Statement
Not applicable.
Data Availability Statement
The data underlying the research result presentation are available on request from the corresponding author.
Conflicts of Interest
The authors declare no conflicts of interest.
References
- Yan, L.; Wang, A. Based on material flow analysis: Value chain analysis of China iron resources. Resour. Conserv. Recycl. 2014, 91, 52–61. [Google Scholar] [CrossRef]
- Zhao, Y.M.; Feng, C.Y.; Li, D.X. The Major Ore Clusters of Super-Large Iron Deposits in the World, Present Situation of Iron Resources in China, and Prospect. Acta Geol. Sin. (Engl. Ed.) 2014, 88, 1895–1915. [Google Scholar] [CrossRef]
- Zhao, P.; He, Z.; Yin, L.; Xiao, R.; Chen, J.; Tang, J.; Gong, Z.Y.; Zhang, W. Changes in the geographical distribution of global iron ore shipping flows, 2000–2019. J. Transp. Geogr. 2022, 99, 103277. [Google Scholar] [CrossRef]
- Song, L.; Wang, P.; Hao, M.; Dai, M.; Xiang, K.; Li, N.; Chen, W.-Q. Mapping provincial steel stocks and flows in China: 1978–2050. J. Clean. Prod. 2020, 262, 121393. [Google Scholar] [CrossRef]
- Pauliuk, S.; Wang, T.; Müller, D.B. Steel all over the world: Estimating in-use stocks of iron for 200 countries. Resour. Conserv. Recycl. 2013, 71, 22–30. [Google Scholar] [CrossRef]
- Müller, E.; Hilty, L.M.; Widmer, R.; Schluep, M.; Faulstich, M. Modeling Metal Stocks and Flows: A Review of Dynamic Material Flow Analysis Methods. Environ. Sci. Technol. 2014, 48, 2102–2113. [Google Scholar] [CrossRef]
- Kleemann, F.; Lederer, J.; Rechberger, H.; Fellner, J. GIS-based Analysis of Vienna’s Material Stock in Buildings. J. Ind. Ecol. 2017, 21, 368–380. [Google Scholar] [CrossRef]
- Tanikawa, H.; Fishman, T.; Okuoka, K.; Sugimoto, K. The Weight of Society Over Time and Space: A Comprehensive Account of the Construction Material Stock of Japan, 1945–2010. J. Ind. Ecol. 2015, 19, 778–791. [Google Scholar] [CrossRef]
- Li, Q.; Gao, T.; Wang, G.; Cheng, J.; Dai, T.; Wang, H. Dynamic analysis of iron flows and in-use stocks in China: 1949–2015. Resour. Policy 2019, 62, 625–634. [Google Scholar] [CrossRef]
- Graedel, T.E.; Harper, E.M.; Nassar, N.T.; Reck, B.K. On the materials basis of modern society. Proc. Natl. Acad. Sci. USA 2015, 112, 6295–6300. [Google Scholar] [CrossRef]
- Yu, B.; An, R.; Zhao, G. Spatial and temporal disparity of the in-use steel stock for China. Resour. Conserv. Recycl. 2020, 155, 104667. [Google Scholar] [CrossRef]
- Zhong, L.; Liu, X.; Yang, P.; Zhong, X.; Zeng, X.; Zou, C.; Xu, X. Quantifying the spatiotemporal evolution of the in-use steel stock in countries along the Belt and Road. Resour. Conserv. Recycl. 2022, 181, 106226. [Google Scholar] [CrossRef]
- Xu, S.; Wang, H.; Tian, X.; Wang, T.; Tanikawa, H. From efficiency to equity: Changing patterns of China’s regional transportation systems from an in-use steel stocks perspective. J. Ind. Ecol. 2021, 26, 548–561. [Google Scholar] [CrossRef]
- Kong, X.; Feng, K.; Wang, P.; Wan, Z.; Lin, L.; Zhang, N.; Li, J. Steel stocks and flows of global merchant fleets as material base of international trade from 1980 to 2050. Glob. Environ. Change 2022, 73, 102493. [Google Scholar] [CrossRef]
- Chen, Y.; Quan, Y.; Karimian, H.; Yang, X. Mapping Provincial Stocks and Wastes of Passenger-Vehicle Plastics in China Based on Dynamic Material Flow Analysis and GIS: 1985–2019. Sustainability 2023, 15, 7230. [Google Scholar] [CrossRef]
- Nakajima, K.; Nansai, K.; Matsubae, K.; Nagasaka, T. Material Flow of Iron in Global Supply Chain. ISIJ Int. 2014, 54, 2657–2662. [Google Scholar] [CrossRef]
- Miatto, A.; Schandl, H.; Wiedenhofer, D.; Krausmann, F.; Tanikawa, H. Modeling material flows and stocks of the road network in the United States 1905–2015. Resour. Conserv. Recycl. 2017, 127, 168–178. [Google Scholar] [CrossRef]
- Chen, X.; Mao, J.; Yu, G. Analysis of iron composite flow in China. Environ. Sci. Pollut. Res. 2022, 29, 65613–65624. [Google Scholar] [CrossRef]
- Liu, Q.; Cao, Z.; Liu, X.; Liu, L.; Dai, T.; Han, J.; Duan, H.; Wang, C.; Wang, H.; Liu, J.; et al. Product and Metal Stocks Accumulation of China’s Megacities: Patterns, Drivers, and Implications. Environ. Sci. Technol. 2019, 53, 4128–4139. [Google Scholar] [CrossRef]
- Yue, Q.; Chai, X.; Zhao, F.; He, J.; Li, Y.; Wang, H. Analysis of iron in-use stocks: Evidence from the provincial and municipal levels in China. Resour. Policy 2023, 80, 103291. [Google Scholar] [CrossRef]
- Liu, R.; Fu, R.; Xu, K.; Shi, X.; Ren, X. A Review of Knowledge Graph-Based Reasoning Technology in the Operation of Power Systems. Appl. Sci. 2023, 13, 4357. [Google Scholar] [CrossRef]
- Qu, J. A review on the application of knowledge graph technology in the medical field. Sci. Program. 2022, 2022, 3212370. [Google Scholar] [CrossRef]
- Wang, H.; Zu, Q.; Lu, M.; Chen, R.; Yang, Z.; Gao, Y.; Ding, J. Application of medical knowledge graphs in cardiology and cardiovascular medicine: A brief literature review. Adv. Ther. 2022, 39, 4052–4060. [Google Scholar] [CrossRef] [PubMed]
- Min, W.; Liu, C.; Xu, L.; Jiang, S. Applications of knowledge graphs for food science and industry. Patterns 2022, 3, 100484. [Google Scholar] [CrossRef]
- Riet, R.v.d. Linguistic Instruments in Knowledge engineering (LIKE). Data Knowl. Eng. 1992, 8, 187–189. [Google Scholar] [CrossRef]
- Ji, S.; Pan, S.; Cambria, E.; Marttinen, P.; Yu, P.S. A Survey on knowledge Graphs: Representation, acquisition, and applications. IEEE Trans. Neural Netw. Learn. Syst. 2022, 33, 494–514. [Google Scholar] [CrossRef]
- Chen, X.; Jia, S.; Xiang, Y. A review: Knowledge reasoning over knowledge graph. Expert Syst. Appl. 2020, 141, 112948. [Google Scholar] [CrossRef]
- Tian, L.; Zhou, X.; Wu, Y.-P.; Zhou, W.-T.; Zhang, J.-H.; Zhang, T.-S. Knowledge graph and knowledge reasoning: A systematic review. J. Electron. Sci. Technol. 2022, 20, 100159. [Google Scholar] [CrossRef]
- Xu, Z.; Sheng, Y.; He, L.; Wang, Y. Review on Knowledge Graph Techniques. J. Univ. Electron. Sci. Technol. China 2016, 45, 589–606. [Google Scholar] [CrossRef]
- Huang, H.; Yu, J.; Liao, X.; Xi, Y. Review on Knowledge Graphs. Comput. Syst. Appl. 2019, 28, 1–12. [Google Scholar] [CrossRef]
- Li, T.; Wang, C.; Li, H. Development and construction of knowledge graph. J. Nanjing Univ. Sci. Technol. 2017, 41, 22–34. [Google Scholar] [CrossRef]
- Wang, X.; Zou, L.; Wang, C.-K.; Peng, P.; Feng, Z.-Y. Research on Knowledge Graph Data Management: A Survey. Ruan Jian Xue Bao/J. Softw. 2019, 30, 2139–2174. [Google Scholar] [CrossRef]
- Hao, M.; Song, L.; Dai, M.; Liu, Y.; Dai, T.; Chen, W.-Q. Urban mining assessment of copper, iron and aluminum in Fujian province. Resour. Ind. 2020, 22, 66–74. [Google Scholar]
- Han, Z.; Wen, B.; Dai, T.; Li, Q.; Wang, H.; Feng, X. Temporal and spatial changes of iron stocks in China’s housing construction. Resour. Sci. 2018, 40, 2351–2359. [Google Scholar] [CrossRef]
- Ding, Y.Q.; Ma, G.T.; Tang, D. Analysis of the regional differences of highway steel stocks in China. China Min. Mag. 2020, 29, 34–41. [Google Scholar]
- Chen, L.Q.; Tang, L.L.; Jiang, L.; Gao, L.S.; Hu, B.; Guo, L. In-use iron and steel stock estimation and driving force analysis in Chongqing. Resour. Sci. 2018, 40, 2341–2350. [Google Scholar] [CrossRef]
- Song, L.; Chen, W.; Dai, M. Stocks and flows of steel in automobiles, vessels and household appliances in China. J. Nat. Resour. 2020, 35, 895–907. [Google Scholar] [CrossRef]
- Yu, L.; Lei, S. Analyzing Iron and Aluminum Stocks in Handan City in 2005. Resour. Sci. 2008, 30, 147–152. [Google Scholar]
- Xiao, L.; Qin, R.; Deng, L.Y.; Tang, D.; Jiang, W.B.; Xu, W.M. Metabolic process of mechanical products iron resources based on material flow analysis in China. Resour. Sci. 2018, 40, 2329–2340. [Google Scholar] [CrossRef]
- Song, L.; Zhang, C.; Han, J.; Chen, W.-Q. In-use product and steel stocks sustaining the urbanization of Xiamen, China. Ecosyst. Health Sustain. 2019, 5, 110–123. [Google Scholar] [CrossRef]
- Changsha Bureau of Statistics. Changsha Statistical Yearbook; China Statistics Press: Beijing, China, 2021; p. 360.
- National Bureau of Statistics of China. China Statistical Yearbook; China Statistics Press: Beijing, China, 2021; p. 945.
- Brewster, C. Ontology learning from text: Methods, evaluation and applications. Comput. Linguist. 2006, 32, 569–572. [Google Scholar] [CrossRef]
- Dossett, J. ASM Handbook Volume 4D-Heat Treating of Irons and Steels; ASM International: Materials Park, OH, USA, 2014. [Google Scholar]
- Wang, T.; Müller, D.B.; Hashimoto, S. The Ferrous Find: Counting Iron and Steel Stocks in China’s Economy. J. Ind. Ecol. 2015, 19, 877–889. [Google Scholar] [CrossRef]
- Li, H.-M.; Wang, D.-H.; Li, L.-X.; Chen, J.; Yang, X.-Q.; Liu, M.-J. Metallogeny of iron deposits and resource potential of major iron minerogenetic units in China. Geol. China 2012, 39, 559–580. [Google Scholar]
- Cui, L.W.; Xia, H.D.; Wang, C.; Yi, J.J.; Kong, L.H.; Chen, J. Current status of iron-ore resources in China and screening of object iron-ore geological data. Dizhi Yu Kantan 2012, 48, 894–905. [Google Scholar]
- Cao, Q.; Beden, S.; Beckmann, A. A core reference ontology for steelmaking process knowledge modelling and information management. Comput. Ind. 2022, 135, 103574. [Google Scholar] [CrossRef]
Disclaimer/Publisher’s Note: The statements, opinions and data contained in all publications are solely those of the individual author(s) and contributor(s) and not of MDPI and/or the editor(s). MDPI and/or the editor(s) disclaim responsibility for any injury to people or property resulting from any ideas, methods, instructions or products referred to in the content. |
© 2025 by the authors. Licensee MDPI, Basel, Switzerland. This article is an open access article distributed under the terms and conditions of the Creative Commons Attribution (CC BY) license (https://creativecommons.org/licenses/by/4.0/).