Article

Crop Technology, Cultivation System, and Maize Production Characteristics

1
Faculty of Agriculture, University of Agricultural Sciences and Veterinary Medicine Cluj-Napoca, 3-5 Calea Mănăștur, 400372 Cluj-Napoca, Romania
2
Faculty of Silviculture and Cadaster, University of Agricultural Sciences and Veterinary Medicine Cluj-Napoca, 3-5 Calea Mănăștur, 400372 Cluj-Napoca, Romania
*
Authors to whom correspondence should be addressed.
Sustainability 2025, 17(9), 4132; https://doi.org/10.3390/su17094132
Submission received: 18 March 2025 / Revised: 18 April 2025 / Accepted: 29 April 2025 / Published: 2 May 2025
(This article belongs to the Section Environmental Sustainability and Applications)

Abstract

:
The maize crop is an essential contributor to food security. At a global level, it is the cereal with the highest production, and the second imported commodity. This study evaluates the impact of precision agriculture on the morpho-productive traits and agronomic efficiency of the Turda 201 maize hybrid under distinct cultivation systems. A bifactorial field trial was conducted in Cojocna, Transylvania (Romania), using two factors: the farming system (organic vs. conventional) and the cultivation technology (standard vs. precision). The work hypothesis is that precision agriculture can enhance maize performance compared to standard methods. The results indicated that morphological traits such as plant height (197 cm), cob length (17.20 cm), and leaf number (10.60) were significantly higher in the conventional system, particularly under precision technology. In the organic system, while improvements were observed with precision input, overall growth and yield remained lower. The same trends are seen in production traits, which are lower in an organic system compared with conventional (6464.22 kg/ha vs. 9204 kg/ha, when precision technology was used). Agronomic efficiency has a spectacular increase in the conventional–precision experimental variant (4.92 kg/kg) compared with the organic–standard experimental variant (0.002 kg/kg). Crude protein, dry matter, nitrogen-free matter, and starch content are the main qualitative maize characteristics influenced by the cropping system and technology. The conventional–precision experimental variant led to the highest values of the above-mentioned parameters compared with the organic–standard experimental variant (86.90% vs. 83.60% dry matter; 10.75% vs. 8.65% crude protein; 72.60% vs. 64.40% nitrogen-free matter; 83.15% vs. 79.50% starch). Principal Component Analysis revealed that the crop system (PC1) was the dominant factor influencing morpho-productive traits, while environmental factors (PC2) contributed mainly to the variability of the characteristics. These findings support the use of precision agriculture as a tool for enhancing sustainable maize production, particularly in conventional systems.

1. Introduction

Zea mays L. (maize) is a key crop involved in supplying sources and raw material for food security worldwide. In the world, it is the second imported commodity (over 196 million tons) after wheat, and the fourth exported (over 61 million tons), after soya beans, food, and wheat [1]. According to the last FAO reports, in the world, maize production had the fastest increase from 2000 up to 2023 compared to other cereals. In 2022, it was cereal with the highest production, about 1.200 billion tons [2]. In EU27, maize production (61.03 million tons in 2023) occupies the second place after wheat (about 133 million tons in 2023) [3,4]. Even though the actual context of global climate change is an opportunity for installing maize crops in regions that are traditionally not suitable for culture like those located at high altitudes, or Northwestern Europe, it still represents a real challenge for both maize production and productivity [5,6]. The amplitude of negative effects of climatic change on maize yield and production quality, but also on maize economic value, has been challenging [7]. For this reason, preoccupations for solutions to promote maize production sustainability and mitigate climate change’s influence have been numerous at a global level [8,9]. The solution to this problem depends greatly on the maize cultivation system, but implementing precision agriculture seems to be a solution for both approaches.
Organic and conventional maize farming systems differ in terms of technology, environmental impact, productivity, and sustainability [10,11]. Organic farming promotes natural methods of fertilizing and protecting crops, promoting biodiversity and soil health, and thus reducing the negative impact on ecosystems [12]. However, yields are generally lower than in conventional farming due to limited nutrient availability and greater risks related to pests and adverse weather conditions [13]. The results of a comparative study of maize growing in conventional versus organic systems conducted by Archer et al. in 2007 showed an increase in production in a conventional system with more than 30% [14]. In contrast, conventional farming focuses on the intensive use of synthetic inputs to maximize production and effectively control stress factors; the use of advanced mechanization helps optimize agricultural processes, reducing labor costs and increasing harvesting efficiency [10].
The maize cultivation technologies in conventional and precision agriculture aim to optimize production through different methods and levels of agricultural intensification. Conventional agriculture uses chemical inputs and advanced mechanization to maximize yield and efficiency [10]. Precision agriculture, a subset of modern conventional data-driving agricultural practices, integrates digital and precision technologies to optimize resource use and increase the efficiency of agricultural production [15,16]. It involves the use of sensors, satellite imagery, drones, and connected equipment to monitor soil, plant, and weather parameters in real time [17]. Artificial intelligence-based agricultural management applications analyze the collected data to recommend precise doses of agricultural inputs, reducing environmental impact and production costs [18,19]. An essential aspect of precision agriculture is the use of optical sensors, which are based on the ability of vegetation to reflect incident electromagnetic radiation, which allows the establishment of correlations between qualitative and quantitative data characterizing the agricultural crop. Green plants absorb a large part of the wavelengths of the visible spectrum, namely blue and red light, but reflect to a greater extent the wavelengths of green light. Determining the spectral response (vegetation reflectance) in the wavelength range characteristic of green light is an indicator of the relative amount of chlorophyll in the leaves [20,21,22,23]. To assess the degree of crop development, the normalized difference vegetation index (NDVI) is used, since a significant static correlation has been established between this index and the leaf area index, respectively, for the degree of vegetative development or biomass production [24,25].
Our study was carried out to assess and rank the impact of crop technology (standard and precision agricultural) and cultivation system (organic and conventional) on maize production characteristics in specific climatic conditions. The study focuses on morpho-productive and qualitative maize traits, agronomic efficiency, and the interaction between crop technology and cultivation systems expressed in morpho-productive and qualitative maize performances in site-specific environmental conditions. While conventional agriculture remains dominant due to its accessibility and large-scale applicability, precision agriculture is becoming increasingly attractive, offering innovative solutions for sustainable and efficient agriculture [9,14].

2. Materials and Methods

2.1. Location

The experiment was carried out in 2023. Two experimental fields were organized in Cojocna Commune (46°44′54″ N 23°50′0″ E), Cluj County, Romania. One of these was organized within the Cojoncna Experimental Didactic Station of USAMV Cluj-Napoca, on an area of 25 Ha and was cultivated in an organic system, and the other cultivated in a conventional system was organized in a private farm located in the same commune on an area of 17 Ha. Luvosol is the soil category in both locations [26].
The average annual temperature in the area is of 9.6 °C, while precipitation averages about 866 mm. The averages of relative air humidity frames within 60–80% and wind velocity in an interval of 5–10 km/h [27]. The climatic characterization of the experimental period April–September 2023 was possible because of mobile meteorological stations installed in the experimental fields.

2.2. Experimental Design

A bifactorial experiment (2 × 2) was conducted to quantify the influence of the cultivation system and crop technology on maize morpho-productive and qualitative characteristics and interactions between them and climatic factors (Figure 1). Factor 1 is the crop system, with two grades, organic and conventional. Factor 2 is crop technology, also with two grades, standard and precision agricultural technology, that involves the use of precision agriculture tools, which allows the calculation of NDVI. The trial was organized according to randomized blocks design, with 6 variants (12 plants/variant), in 3 replicates R (4 plants/replicate), 4 experimental, and 2 controls (for assessing the agronomic use efficiency). Turda 201 mid-early maize hybrid produced at the Research&Development Station Turda, Romania, was used [28].

2.3. Crop Management

Regardless of experimental factor, sowing was carried out at a density of 65,000 grains/ha, depth of 5 cm, with a spacing of 70 cm × 22 cm row to row, and plant to plant, respectively. Common agricultural practices were applied for crop establishment and maintaining function of the technology or system adopted. Watering was administered based on the plants’ requirements. Harvesting was conducted mechanically.
Fertilization. In both conventional and organic systems, solid fertilization was administered in the autumn, and liquid fertilization during plant development. In the organic system, manure was applied (8 t/ha), and 4 L/ha and 2.77 L/ha liquid fertilizer doses were administered when standard and precision agricultural technologies were used. The dose levels were established considering the national organic farming guidelines [29] and previous practices indicating optimal organic matter input for maize cultivation. The liquid fertilizer is based on seaweed, vegetable oils, paraffin, and medicinal plant oils (Hechenbichler, Innsbruck, Austria). In the conventional system, 250 kg/ha N15:P15:K15+7SO3+Zn–Borealis solid fertilizer was used, and 2 L/ha foliar fertilizer based on Laminaria digitata, NPK, and microelements (Aectra, București, Romania) was usedfor maize cultivated with standard technology (1.3 L/ha in precision agricultural system).
Phytosanitary measures for organically grown maize were based on preventive actions, but also on treatments with Bordeaux mixture. In the conventional maize crop, the herbicide Adengo 465 SC (Bayer) with active ingredients 225 g/L isoxaflutole, 90 g/L thiencarbazone-methyl, and 150 g/L cyprosulfamide was applied pre- and post-emergence (0.4 L/ha and 0.35 L/ha, respectively). Fungicide Opera (BASF, Midrand, South Africa) with active ingredients 50 g/L epoxiconazole and 133 g/L pyraclostrobin was applied post-emergence (1.5 L/ha) and Karate Zeon 5 CS (Syngenta, Basel, Switzerland) with active ingredient 50 g/L lambda-cyhalothrin for fighting against pests (0.15 L/ha).
Monitoring and Precision Technology Application. In the conventional system, crop development was monitored throughout its evolution through direct observations. In the case of using precision technology, the crop development was estimated with the GreenSeeker system, active online, which operates by measuring in the red and near-infrared light range, with a frequency of 100 measurements/s, corresponding to each sensor. With its help, zoning maps were recorded using the Santinel system, through which photographs of the crops were taken. This allowed for the automated calculation of NDVI (normalized difference vegetation index), which is one of the most popular indices for evaluating plant biomass, and in graphic representations, where the green areas indicate dense and healthy vegetation, and yellow and red areas indicate sparse or damaged vegetation [30]. Fertilizers were applied based on the measured NDVI values, according to the mechanism by which the Greenseeker software, v. 2013 calculates the application rates and sends commands to the fertilizer distribution equipment.
Morpho-productive and qualitative assessments. The observations were carried out on both morphological and productive characteristics of maize plants, depending on the crop system (organic or conventional) and the applied technology (standard or precision). The morphological traits assessed are as follows: number of leaves, plant height, cob length, cob diameter, and rachis diameter. The productive characteristics are as follows: cob weight, grain weight, hectoliter mass, and yield. The analyzed nutritional components are as follows: crude protein, crude cellulose, crude fat, crude ash, nitrogen-free extractives, and starch content. Based on the results obtained, the effectiveness of the tested crop technologies in each crop system, respectively, conventional and organic, was evaluated. The agronomic efficiency was calculated according to the following formula [31]:
A g r o n o m i c   u s e   e f f i c i e n c y   A E , k g / k g = G r a i n   y i e l d   i n   t r e a t e d   p l o t G r a i n   y i e l d   i n   c o n t r o l   p l o t T o t a l   n u t r i e n t   a p p l i e d
Laboratory analyses were conducted to quantify the nutritional content of the maize grains. Dry matter content was determined using the gravimetric method, which involves weighing a known amount of fresh maize grain sample, followed by drying in a laboratory oven at a constant temperature of 105 °C until a constant weight was achieved. The sample was then cooled in a desiccator to prevent moisture absorption and reweighed. Crude protein content was determined using the Kjeldahl method, which involves three main steps: digestion, distillation, and titration. In the digestion phase, the maize grain samples were mineralized using concentrated sulfuric acid (H2SO4) in the presence of a catalyst mixture (potassium sulfate and copper) to convert organic nitrogen into ammonium sulfate. During the distillation step, the digest was neutralized with a strong base (sodium hydroxide), releasing ammonia, which was then distilled into a boric acid solution. Finally, the amount of nitrogen was determined by automatic titration with a standard acid (sulfuric acid). Crude fat content was determined using the Soxhlet extraction method. A known quantity of finely ground, dried maize grain sample was placed in a porous cellulose extraction thimble, which was then inserted into the Soxhlet apparatus. The extraction was carried out using petroleum ether, which repeatedly washed the sample through reflux and condensation cycles. The fat-soluble components were gradually dissolved and collected in a pre-weighed flask. After a sufficient number of cycles (usually 6 h), the solvent was evaporated, and the remaining fat residue was dried and weighed. Crude fiber was quantified using a gravimetric method, which involved double hydrolysis of the sample—first with a dilute sulfuric acid solution to remove soluble carbohydrates, followed by treatment with a dilute sodium hydroxide solution to eliminate proteins and remaining soluble organic matter. The residue was then filtered, dried, incinerated (calcined) at high temperature in a furnace, and finally weighed. The nitrogen-free extractives were calculated by difference. Starch content was determined through a volumetric method involving acid hydrolysis, followed by automatic titration. Initially, a known weight of ground maize grain sample was subjected to acid hydrolysis using dilute hydrochloric acid. The mixture was then neutralized and clarified by filtration. The resulting solution, containing reducing sugars, was titrated using an automatic titrator with a standard Fehling’s solution (a copper sulfate-based reagent). Titration was carried out under controlled temperature conditions, and the endpoint was detected automatically, based on a colorimetric signal [32]. Chlorophyll content was quantified using a non-destructive optical method. The assessment was performed using a chlorophyll meter (SPAD), which operates based on light absorbance at specific wavelengths—typically in the red (around 650 nm) and near-infrared (around 940 nm) regions. Readings were taken directly from fully expanded, healthy leaves at a consistent position on the plant to ensure accuracy and reproducibility [33,34].

2.4. Statistics

Raw data processing was performed with “XLSTAT” 2024.3 software. Averages, dispersion parameters, and simple Spearman correlations were calculated for the morpho-productive characteristics of the maize plants, on one hand, and between environmental factors and morpho-productive characteristics, on the other hand. The non-parametric Spearman test was chosen because the linearity of the dependencies was found to be lacking [35]. The significance of differences between the averages of the maize plant characteristics was obtained by using ANOVA on the basis of t-test. The Spearman non-parametric test was used to calculate the simple correlations between the analyzed maize characteristics. To find the interrelationships between the maize morpho-productive characteristics and environmental factors, PCA (Principal Components Analysis) was conducted. For testing the suitability of PCA application, the Bartlett (p < 0.01) and Keiser–Meyer–Olkin (KMO) tests (with threshold value above 0.500) were implemented [35].

3. Results

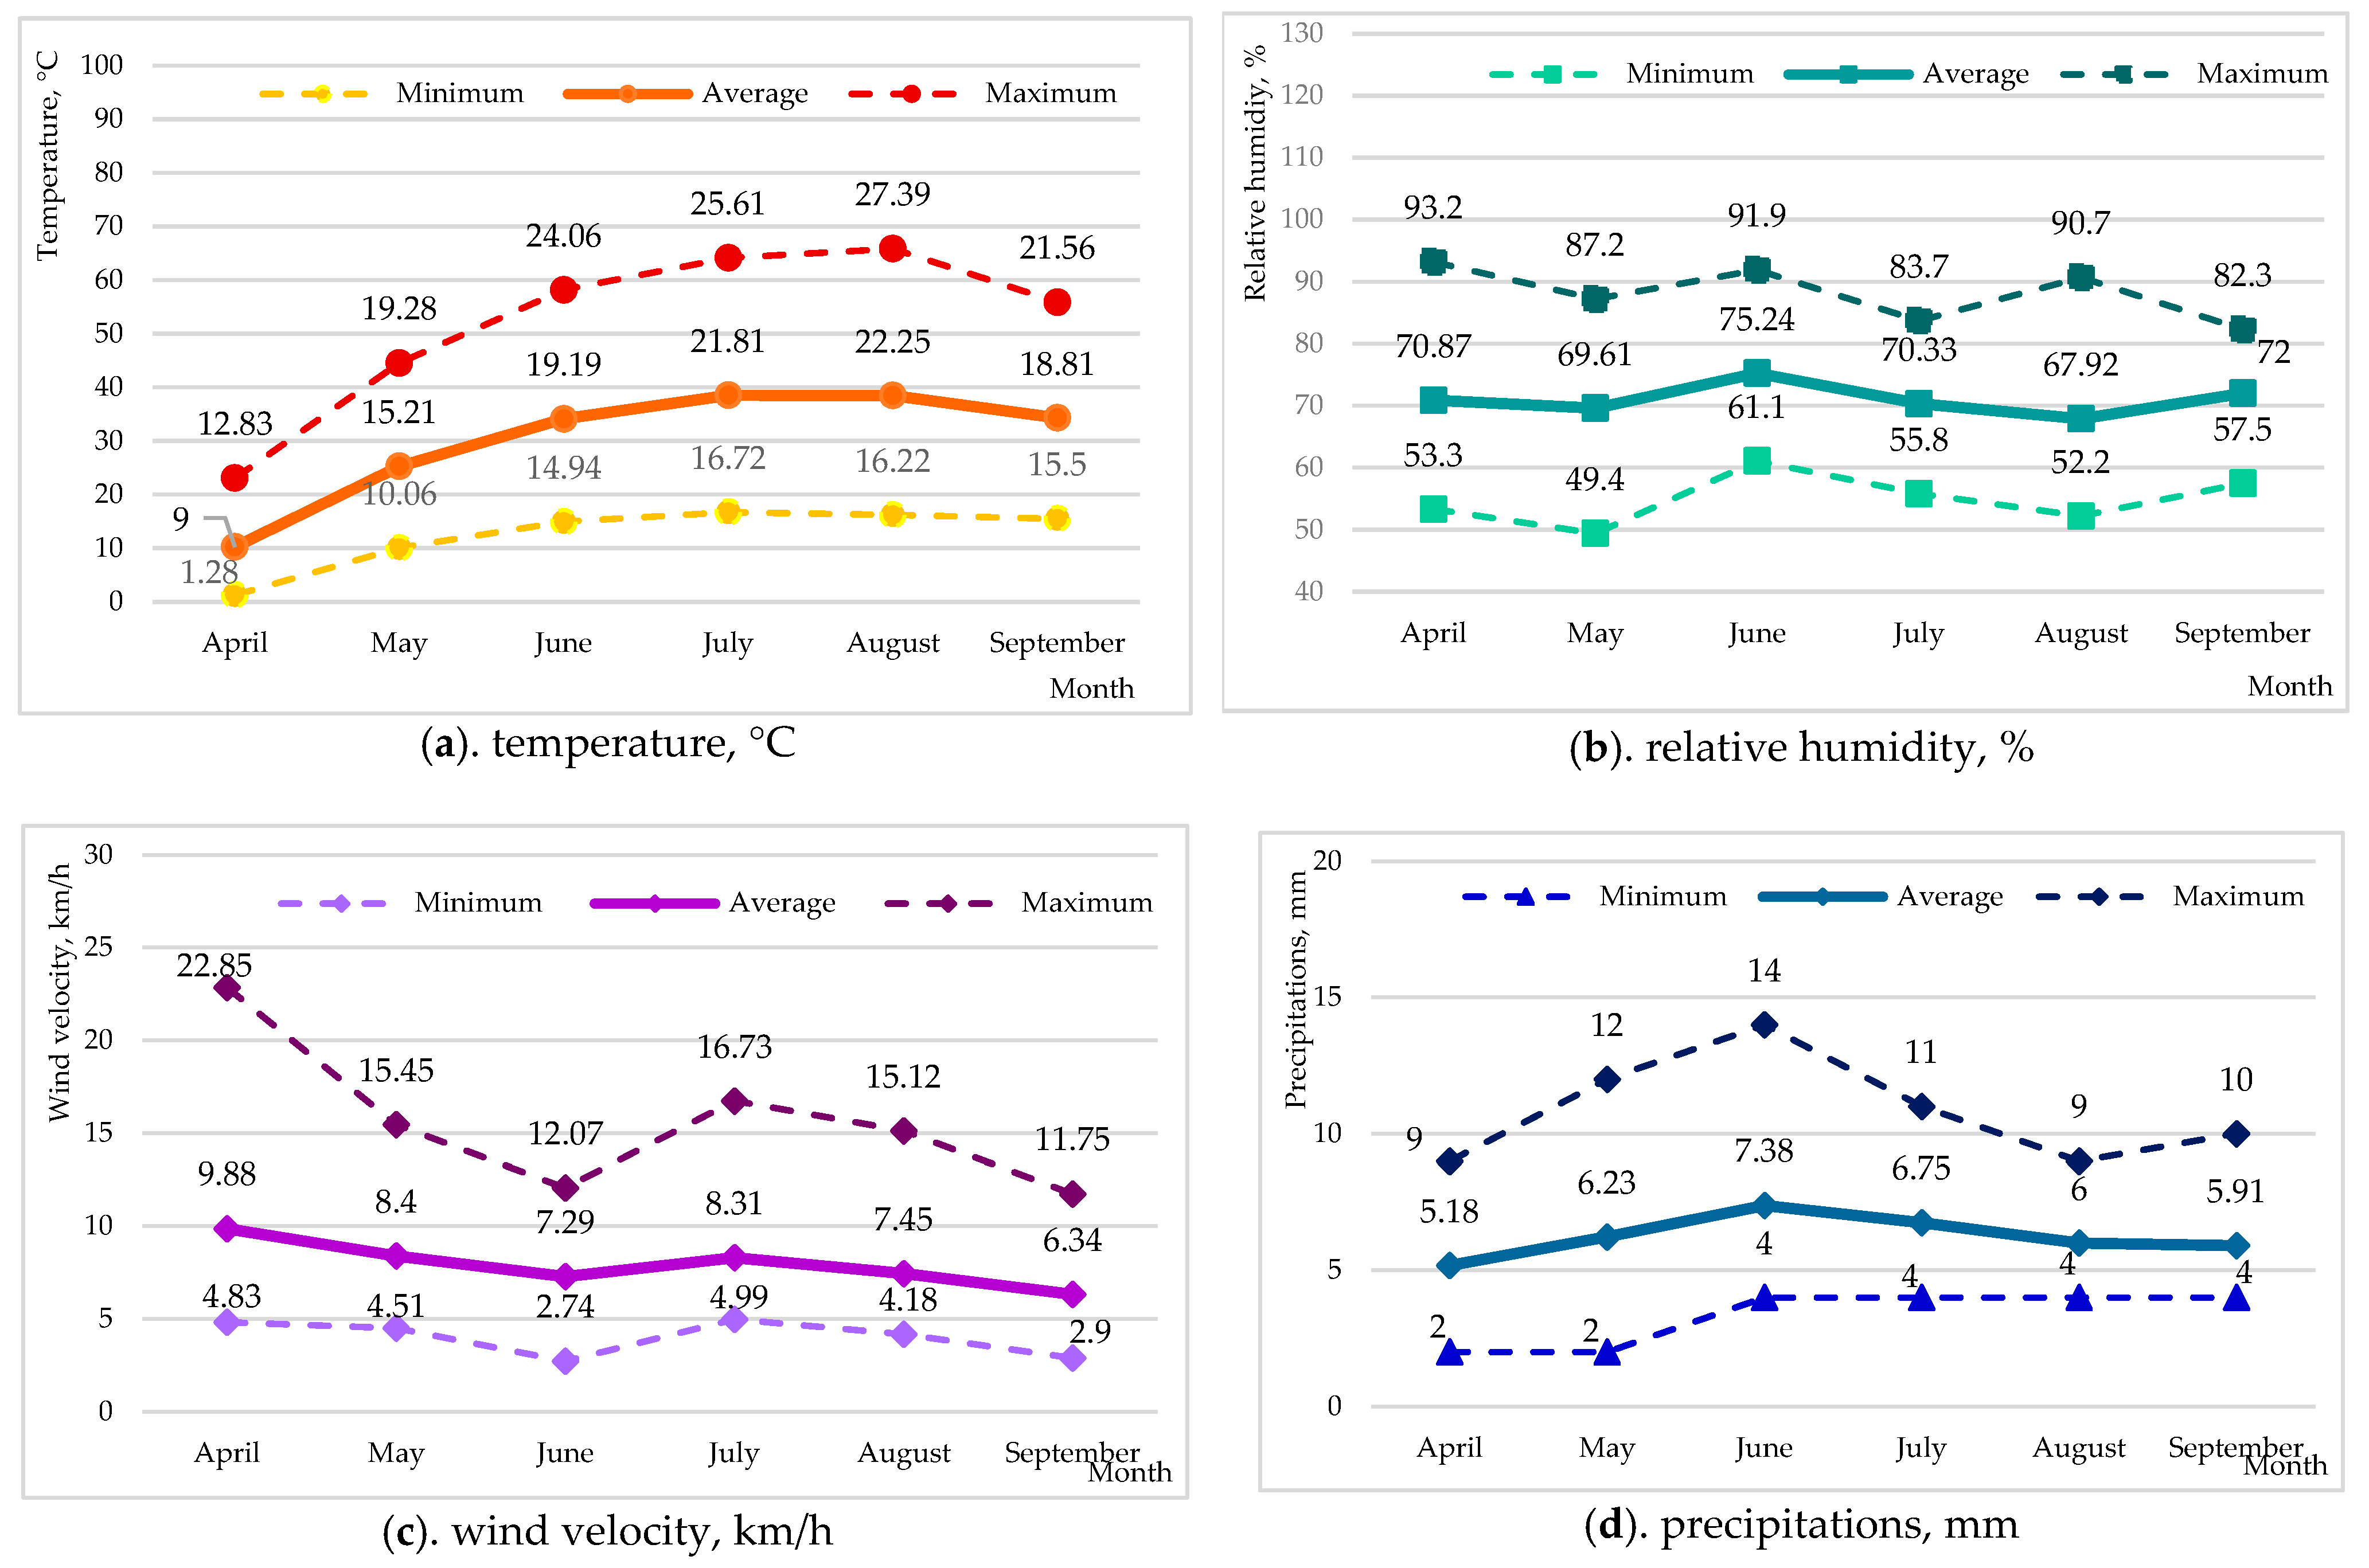
3.1. The Evolution of the Environmental Factors in the Experimental Area

Overall, by the 6 month period, the average temperature was 17.25 °C, with a minimum of 1.28 °C in April, and a maximum of 27.39 °C in August. An average of 66.11% corresponds to relative humidity, which recorded a minimum of 49.40% in May, and a maximum of 93.20% in April. The wind velocity has an average of 8.84 km/h, with a minimum of 2.74 km/h in June, and a maximum of 22.85 km/h in April. A total amount of 386 mm precipitations was reported in the experimental area, with an average of 5.49 mm, with a minimum of 2 mm in April and May, and a maximum of 14 mm in June (Figure 2).

3.2. The Impact of Standard and Precision Agricultural Technologies on Maize Crop in Organic and Conventional Systems

The morphological characteristics of Turda 201 maize hybrid show a lower development in the organic system regardless of crop technology (Table 1).
In the organic cropping system, the leaf number and the cob length were significantly greater when precision agriculture technology was applied. Similarly, plant height increased with technological input. Cob diameter was lowest in the control group, while standard and precision technologies led to higher values. No significant differences were observed in the rachis diameter function of the cropping technology.
In the conventional system, the leaf number of the maize plants was higher than in the organic cropping system. Cob length followed a similar pattern, with the highest values under precision agriculture. Plant height also showed a significant increase with the application of precision techniques. Cob and rachis diameters were larger when using precision treatment (Table 1).
In the organic system (Table 2), cob and grain weights showed a slight increase from the control to the standard crop technology, and a statistically significant increase when precision agriculture technology was applied. The hectoliter mass remained relatively constant across experimental variants, showing no significant differences. Yield ranged from 6134.47 kg/ha in the control to 6464.22 kg/ha resulted in the precision crop technology.
In the conventional system, cob weight, grain weight, and hectoliter mass were all significantly higher than in the organic system. Yield was also substantially higher.
Agronomic use efficiency increased when precision crop technology was applied compared to standard technology. All observed differences between treatments were statistically significant (Figure 3).
A very strong positive linear correlation is observed between the leaves’ chlorophyll content and yield in organic system, regardless or cultivation technology or control. A weaker interrelation between the above-mentioned maize variables is seen in the crop developed in the conventional system (Figure 4).
Within the organic system, dry matter and crude protein contents increased significantly from the control to the precision agriculture cropping (8.65%). Crude fiber, fat, and ash varied slightly between the experimental variants, but without statistical significance. Nitrogen-free matter was lower when standard (62.30%) and precision (64.40%) agricultural technologies were used compared to the control. Starch content significantly increased under precision agriculture technology (Table 3).
In the conventional system, dry matter, crude protein, and crude fiber contents were generally higher than in the organic system, especially when the precision technology was used. Crude fat and ash were slightly higher but not significantly different. Nitrogen-free matter was lower when standard and precision technologies were applied, while starch content remained relatively stable (Table 3).

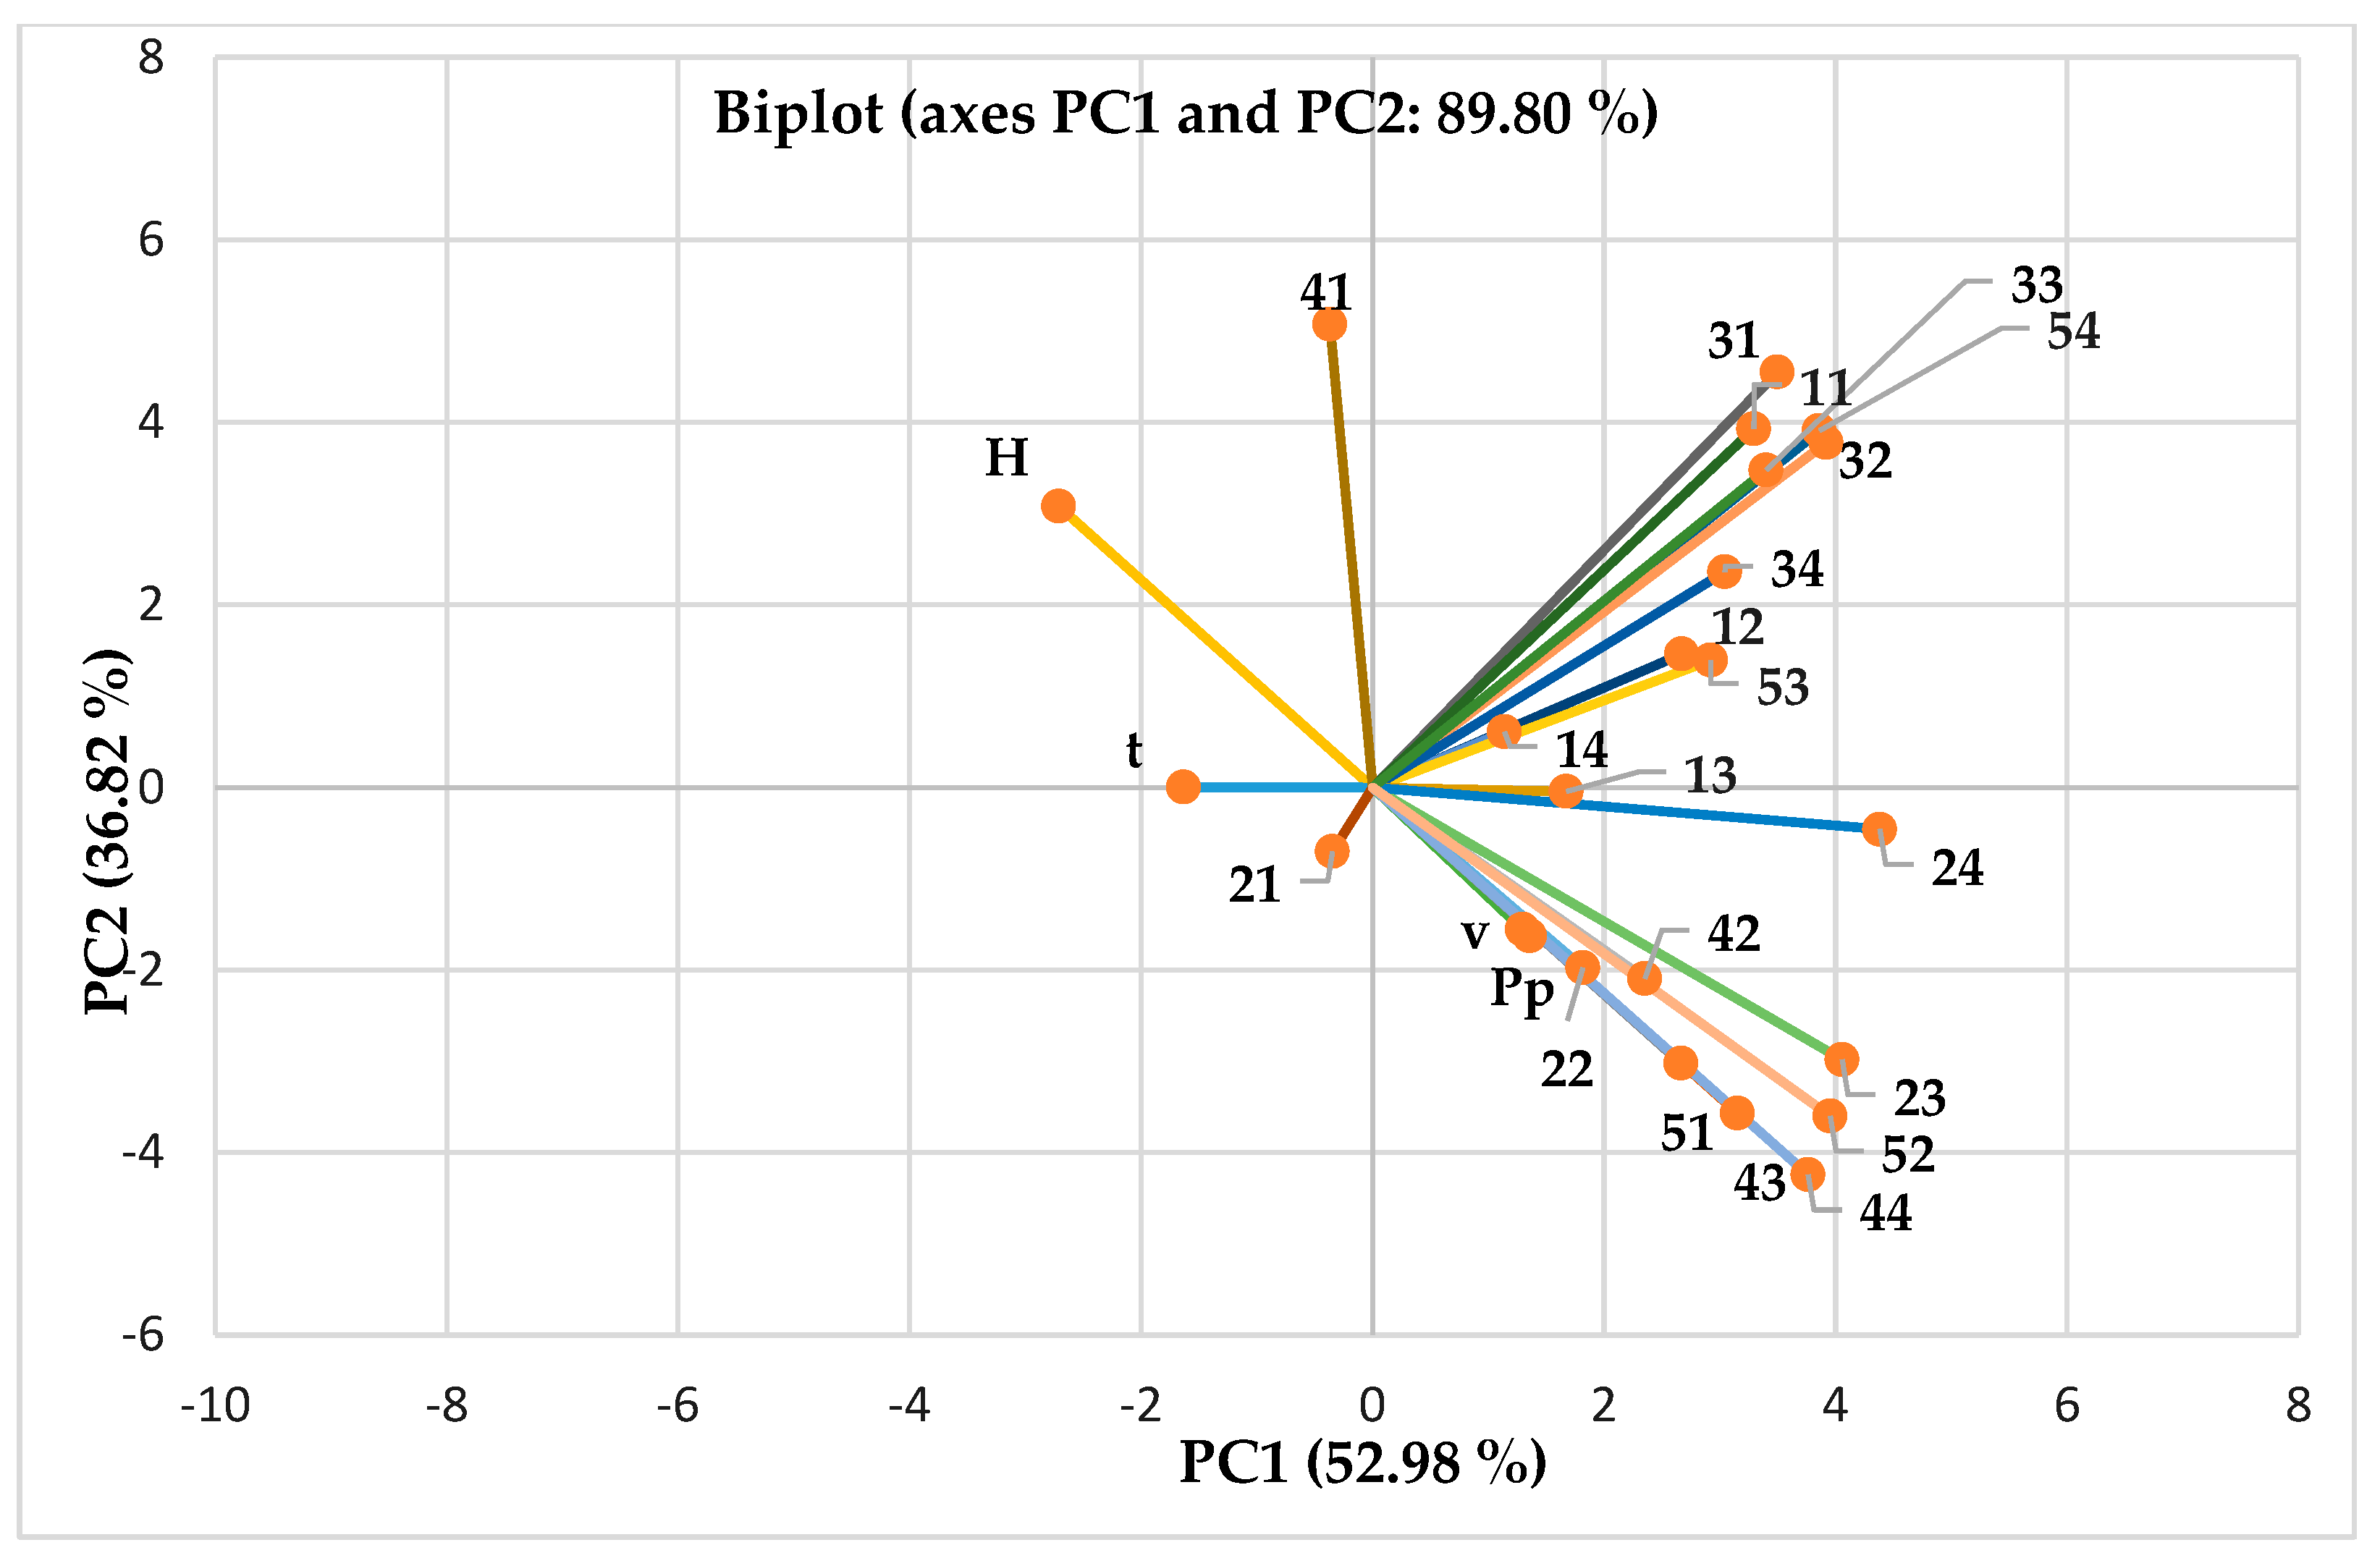
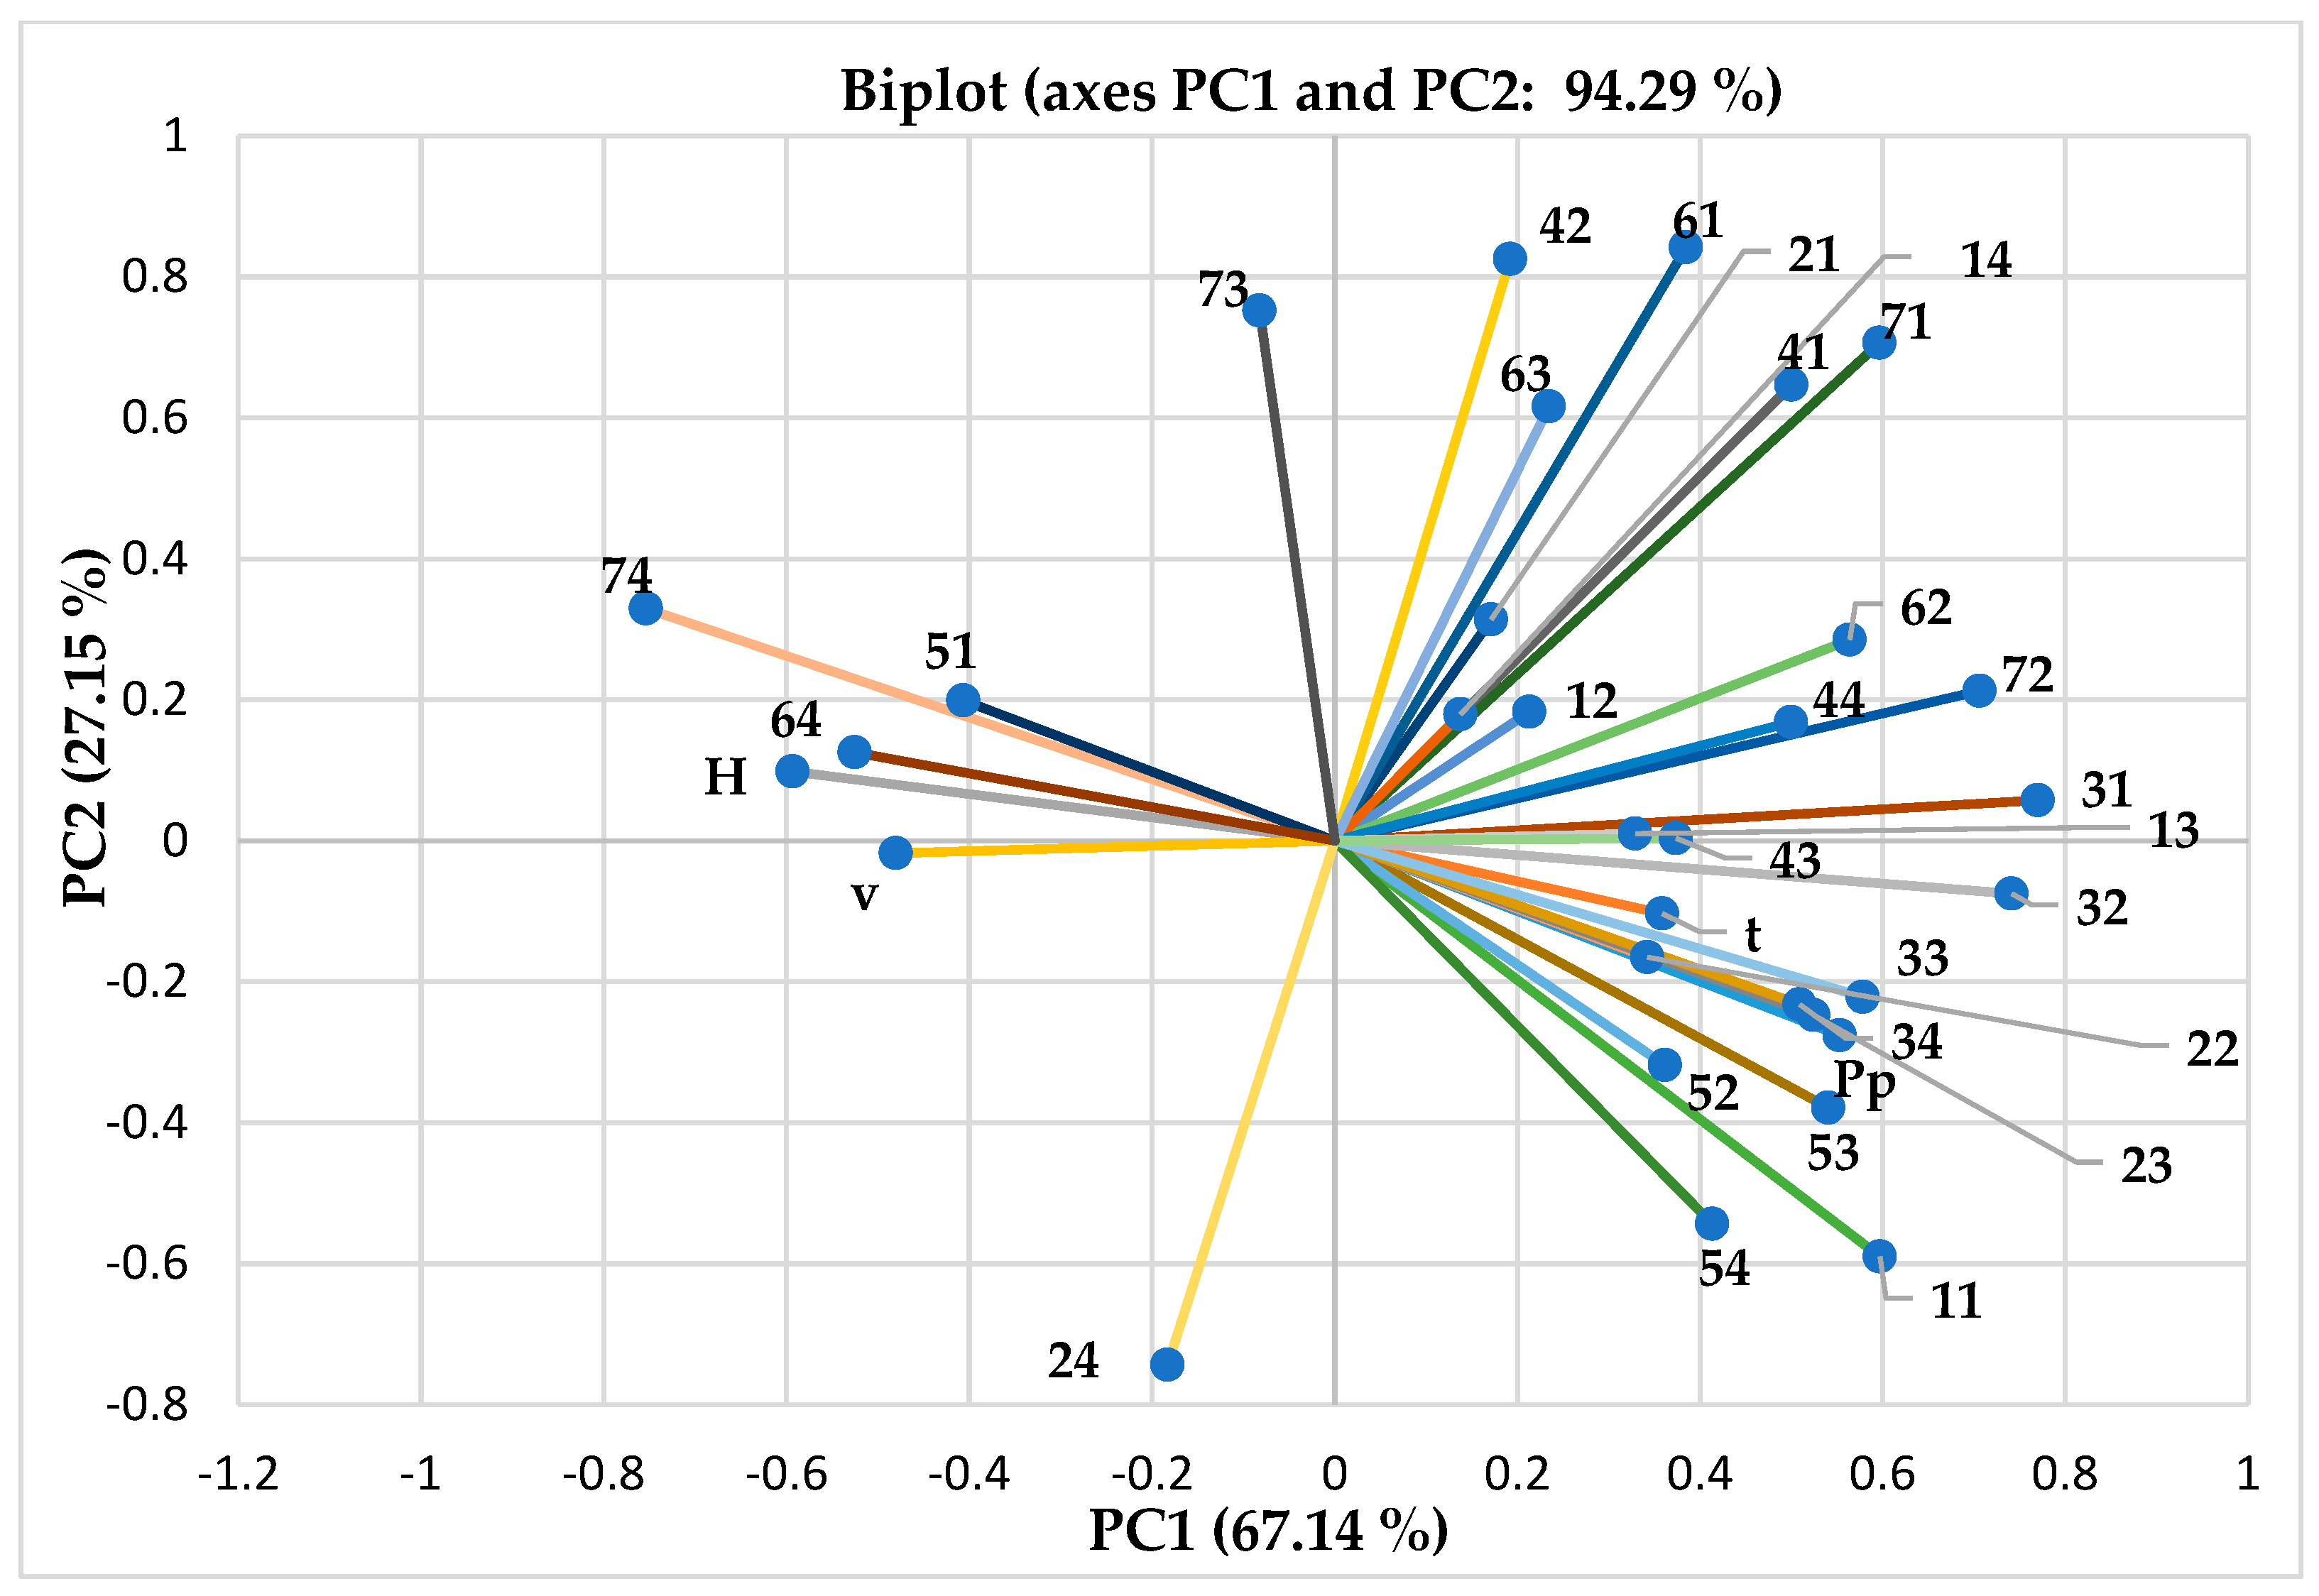
3.3. The Interaction Between Crop Technology and Cultivation Systems Expressed in Morpho-Productive Maize Performances in Site-Specific Environmental Conditions

The Spearman correlation matrices reveal complex relationships between environmental factors and morpho-productive and qualitative characteristics in the maize hybrid Turda 201. Temperature shows negative correlations with all analyzed characteristics, regardless of the crop cultivation system or technology. The relative humidity and precipitations are negatively correlated with the majority of the traits, while wind velocity is positively correlated with almost all traits (Table 4, Table 5 and Table 6).
The matrix shows weak and weak–moderate influences of certain environmental conditions on the analyzed morphological expressions. Moderate to strong and strong correlations are observed between cob and rachis diameters within the same experimental variant, except V1 (Table 4). A strong negative correlation is observed between the temperature and hectoliter mass obtained in V2 and V4. Weak and weak to moderate correlations are seen between productive characteristics (Table 5). Dry matter (11–14) is strongly positively correlated only with nitrogen-free extractives (61–64) and starch content (71–74), as shown in Table 6.
The Principal Components Analysis (PCA) was conducted for the morpho-productive traits of Turda 201 maize hybrids and emphasizes three principal components (PC): PC 1, crop system; PC 2, climatic environmental traits; and PC 3, crop technology. Concerning all crop traits analyzed, only the first two factors have eigenvalues bigger than one, so only those were considered in our analysis [8].
The PCA biplot illustrates the relationship between PC1 and PC2, which together explain 89.80% of the total variance, with PC1 accounting for 52.98% and PC2 for 36.82%. PC1 is primarily associated with plant morphological variation influenced by the crop system. PC2 captures variability linked to climatic and environmental factors. It is positively correlated with leaf number and cob length across systems and technologies, with cob diameter in the organic system when standard technology was used, and with rachis diameter in the conventional system when precision technology was applied (Figure 5).
PC1 (crop system) explains 62.65% of the total variance, while PC2 (environmental and climatic traits) accounts for 34.74%. Together, they capture 97.39% of the total variability. All analyzed production traits, except for the hectoliter mass from organically grown maize, align along PC1, indicating that the crop system is the primary driver of productivity variation. The wide dispersion of yield-related vectors suggests a strong influence of environmental factors on yield variability.
Temperature and precipitation are positively associated with yield, cob, and grain weight in the conventional system, as well as with hectoliter mass in the organic system, regardless of technology. In contrast, relative humidity appears to have a lower influence on production traits. Wind velocity is notably linked to traits in organic crops, regardless of the applied technology (Figure 6).
The PCA of qualitative maize production traits reveals that crop system (PC1) accounts for 67.14% of the total variance, while environmental factors (PC2) explain 27.15%. Dry matter, crude protein (except in the experimental variant conventional system–precision technology), crude fiber, fat, and ash across all systems and technologies are positively associated with PC1. This suggests that the crop system is the main factor influencing these qualitative traits (Figure 7).
In contrast, starch and nitrogen-free matter from maize grown under the experimental variant corresponding to conventional system–precision agricultural technology, along with crude protein in the same context, are negatively associated with PC1, indicating a distinct response pattern.
Temperature and precipitation align closely with most qualitative traits, whereas relative humidity and wind velocity follow different vector directions, implying they may have separate or less consistent effects on the measured characteristics (Figure 7).

4. Discussions

The morphological characteristics of the Turda 201 maize hybrid show clear differences in development based on cultivation system and technology level. In the organic system, a gradual improvement in morphological traits as the performance level of technology increases is seen, even though overall plant growth remains limited, regardless of technology. This suggests that organic practices may constrain growth due to reduced nutrient availability and slower nutrient cycling, as noted by Friedel et al. (2020) and Lori et al. (2017) [36,37].
Cob diameter increased significantly when standard and precision technologies were used compared to the control, indicating that this trait is particularly responsive to technological inputs. In contrast, rachis diameter showed minimal variation, possibly due to genetic factors or lower sensitivity to agronomic conditions. The reduced growth observed in organic systems is likely linked to limited soil nutrients, lower microbial activity, and slower mineralization processes typical of organic farming. Similar constraints have been reported in studies comparing organic and conventional maize systems [36,37].
On the other hand, the conventional system showed markedly better morphological development. This can be attributed to the use of synthetic fertilizers, improved pest control, and optimized soil management, all of which support stronger vegetative growth. These findings are consistent with previous research, which highlights the enhanced morphological performance of maize in conventional systems [38,39]. Księżak et al. (2017) obtained Polish maize varieties with superior plant height (261 cm), cob length (20.6 cm), and cob diameter (48.4 mm) in conventional system vs. organic, where they obtained 261 cm plant height, 20.2 cm cob length, and 46.6 mm cob diameter [39].
In the conventional system, both cob and grain weights were consistently higher than those in the organic system. This aligns with findings from other studies, highlighting the superior performance of conventional practices due to better nutrient availability and input efficiency [40,41].
In the organic system, although gains were more modest, cob and grain weights still increased under precision agriculture technology compared to the control and standard technology. This indicates that even within organic frameworks, advanced agronomic strategies, such as targeted fertilization, can enhance productivity. These results support the growing body of research promoting precision organic management to close the yield gap. Manu et al. (2024) obtained, in different yield zones of Ghana, superior yields using precision agriculture, with an average production of 4900 kg/ha as the best output, which is much lower compared with our results for the Turda 201 hybrid (9204 kg/ha) [41].
The hectoliter mass remained relatively stable across treatments, suggesting that grain density may be less influenced by technological inputs, particularly within the organic system. The yield is markedly improved as a consequence of the impact of optimized input use, confirming that precision technologies can significantly enhance input efficiency and overall productivity. Our findings are in line with other studies showing how precision practices improve yield outcomes by better synchronizing nutrient supply with crop demand [42]. Agronomic use efficiency is low in the organic system, regardless of technological level, but much higher in the conventional system using precision technology, emphasizing its role in maximizing returns on input investment.
The strong positive correlation between chlorophyll content and yield, in the organic system, suggests a consistent physiological response across technologies. In the conventional system, this correlation was slightly weaker, likely due to greater variability introduced by higher input levels. These findings are supported by previous research demonstrating strong associations between chlorophyll levels and maize yield across various cultivation conditions. Argenta et al. (2004) identified strong correlations (R = 0.89–0.86; R2 = 0.80–0.74) between chlorophyll content and maize yield, which is lower compared with our findings in the conventional system (R = 0.981; R2 = 0.962), but if compared with the organic system (R = 0.734; R2 = 0.962), they are stronger [43].
In both organic and conventional systems, dry matter and crude protein contents increased significantly with the application of precision agriculture, suggesting improved biomass quality and more efficient nitrogen assimilation. The values remained higher in the conventional system, likely due to greater nutrient availability and uptake efficiency. Our findings are consistent with previous studies on input-driven improvements in crop quality [44]. Sannino et al. (2020), using a HarvestLab sensor method obtained a crude protein content ranging between 7.6 and 7.7%, lower compared with our findings (8.65–10.57%), but we determined these differences to be caused by the particularities of biological material [45]. In the organic system, using standard technology, Șonea et al. (2020) [46] obtained higher dry matter (86.14% vs. 80.80%) and crude protein (10.18% vs. 7.70%) contents compared with our results, but, in this case, too, we may explain these differences by differences in maize biological material.
Unlike, crude fiber, crude fat, and crude ash contents remained relatively stable across treatments, which suggest that these traits are more sensitive to the interaction between farming system and applied technology, possibly influenced by soil conditions, microbial activity, and plant genetics [47]. Șonea et al. (2020), investigating the quality of maize grains obtained in organic farms, obtained higher nutritional content compared with our results (4.26% crude fat, 1.36 crude ash, 2.39% crude fibers, 67.15% nitrogen-free matter) [46].
The reduction in nitrogen-free matter across all treatments compared to the control may reflect changes in nutrient partitioning due to enhanced metabolic activity under precision inputs. It may be the result of a reallocation of energy and nutrients, possibly favoring structural and protein components over simple storage compounds. This is an effect also noted by [48] in similar studies. Șonea et al. (2020) obtained in organic maize 67.15% nitrogen-free matter [46], compared with our findings, which emphasize contents raging between 62.30 and 64.40%, a function of the applied technology.
The increase in starch content in maize grown under precision agriculture, regardless of the system, reinforces the idea that precise nutrient management not only enhances productivity but also improves grain quality by stabilizing energy reserves [48].
The negative correlation of temperature with all plant characteristics suggests that higher temperatures may act as a stressor, limiting optimal development, yield, and qualitative maize analyzed traits, regardless of cultivation practices. This finding of the detrimental influence of high temperatures on maize development is confirmed by Shim et al. (2017), who found significant negative correlations between kernel number and temperature increase [48]. The negative associations of plant characteristics with relative humidity and precipitation may indicate the potential impact of excess moisture on them, while the positive correlation with wind velocity indicates a potential stimulating effect, but very weak. Thus, the results are that environmental conditions have a low influence on maize analyzed characteristics. Most morpho-productive traits are weak or weak to moderately correlated. Dry matter is strongly positively correlated with starch content, and nitrogen-free extractives, confirming that these components play a key role in dry matter formation. Khan et al. (2015) found a strong positive relationship between dry matter and starch content in maize silages, also confirming the substantial role played by starch in dry matter formation [49]. The weak correlations of dry matter with crude protein and crude fiber indicate the variability in structural tissue development while the very weak ones with crude fat and crude ash suggest they contribute less significantly to total biomass changes.
The Principal Component Analysis (PCA) highlights the dominant roles of the crop system (PC1) and climatic environmental traits (PC2) in influencing maize morpho-productive characteristics.
For morphological traits (Figure 5), the biplot suggests that specific environmental variables have a targeted regulatory effect on different aspects of plant growth. Similar relationships have been observed in prior studies showing that microclimate factors significantly shaped maize morphological development [50].
When examining productive traits (Figure 6), the results indicate that while environmental factors are important, their impact is mediated more by the type of cultivation system than by the technology used. These observations are supported by previous findings, which emphasize the system-dependent response of yield components to climate variability [51].
The orientation of vectors suggests that agronomic improvements targeting one trait may positively affect others aligned in the same direction. For instance, enhancing cob development under favorable temperature and wind conditions may also improve rachis diameter. The conventional system appears to buffer certain environmental stresses, such as wind and humidity, leading to more stable yield and grain traits. On the other hand, the organic system may offer better resilience against variability in temperature and precipitation.
Concerning the maize nutritional traits (Figure 7), the biplot shows that in the conventional system, starch, nitrogen-free matter, and crude protein (under precision technology) appear less influenced by the crop system and more by environmental variability. Unlike in the organic system, starch content is strongly associated with PC1, suggesting higher sensitivity to cultivation practices. The crude protein content maintains a unique position across all treatments, implying that it may be more responsive to specific climatic conditions than to the farming system or technology. This aligns with earlier research showing temperature’s influence on protein synthesis during grain filling [52].
The grouping of dry matter and crude fat within the same quadrant further indicates a shared physiological response, and ash content consistently aligned with PC1 across all treatments, suggesting that mineral accumulation in grains is more system-dependent and less affected by environmental fluctuations or technological inputs.
The PCA conducted on morpho-productive and qualitative maize traits show that temperature and precipitation are closely connected to most qualitative characteristics, suggesting their role in maize grain composition. An explanation could be the one suggested by Maitah et al. (2019), which shows that higher temperatures and adequate moisture could promote metabolic processes essential to grain development [53]. In the meantime, relative humidity and wind velocity show distinct, less coordinated effects, potentially acting independently.

5. Conclusions

This present study shows that the cultivation system plays a decisive role in shaping the morpho-productive and qualitative characteristics in Turda 201 maize hybrid, reinforcing the importance of adapting agronomic strategies to environmental context for future-ready, sustainable agriculture. The conventional cropping system consistently surpasses the organic one due to enhanced input availability and environmental stress mitigation. Organic farming, regardless of technological approach, showed, in maize, limited morphological development, low production performances, inferior qualitative characteristics, and lower agronomic efficiency. The precision agricultural practices within both organic and conventional cropping systems improved productivity, particularly in yield, cob, and grain weights. The integration of precision technologies into organic practices supports more efficient resource use, reduces input waste, and can mitigate the environmental footprint of intensive farming, expressing, in the meantime, sustainable support for maize cropping under varying agronomic conditions. We presume that sustainable maize production will increasingly rely on innovative, data-driven interventions that balance yield performance with long-term environmental resilience. PCA confirmed the dominant influence of the crop system on the variability of the characteristics, while environmental factors such as temperature and precipitation primarily affected grain quality parameters like protein, starch, and dry matter. The study contributes to the broader goals of sustainable development by approaching challenges related to balancing productivity with environmental stewardship.

Author Contributions

Conceptualization, D.P. and A.C.M.O.; methodology, D.P., H.P. and I.O.; software, P.B. and C.M.; validation, I.O. and A.C.M.O.; writing—draft preparation, D.P., P.B. and O.A.; supervision, A.C.M.O. All authors have read and agreed to the published version of the manuscript.

Funding

This research received no external funding.

Institutional Review Board Statement

Not applicable.

Informed Consent Statement

Not applicable.

Data Availability Statement

Data is contained within the article.

Conflicts of Interest

The authors declare no conflicts of interest.

References

  1. Available online: https://www.fao.org/faostat/en/#rankings/commodities_by_regions_imports (accessed on 4 March 2025).
  2. FAO. Agricultural Production Statistics 2000–2022; FAOSTAT Analytical Briefs, No. 79; FAO: Rome, Italy, 2023. [CrossRef]
  3. Available online: https://agriculture.ec.europa.eu/farming/crop-productions-and-plant-based-products/cereals_ro (accessed on 4 March 2025).
  4. Available online: https://www.fao.org/faostat/en/#data/QCL (accessed on 4 March 2025).
  5. Miedaner, T.; Juroszek, P. Global warming and increasing maize cultivation demand comprehensive efforts in disease and insect resistance breeding in north-western Europe. Plant Pathol. 2021, 70, 1032–1046. [Google Scholar] [CrossRef]
  6. Hakala, K.; Hannukkala, A.O.; Huusela-Veistola, E.; Jalli, M.; Peltonen-Sainio, P. Pests and diseases in a changing climate: A major challenge for Finnish crop production. Agric. Food Sci. 2011, 20, 3–14. [Google Scholar] [CrossRef]
  7. He, Q.J.; Zhou, G.S. The climatic suitability for maize cultivation in China. Chin. Sci. Bull. 2012, 57, 395–403. [Google Scholar] [CrossRef]
  8. Gao, Y.; Zhang, A.; Yue, Y.; Wang, J.; Su, P. Predicting Shifts in Land Suitability for Maize Cultivation Worldwide Due to Climate Change: A Modeling Approach. Land 2021, 10, 295. [Google Scholar] [CrossRef]
  9. Bend’áková, V.; Nagy, H.; Turčeková, N.; Adamičková, I.; Bielik, P. Assessing the Climate Change Impacts on Maize Production in the Slovak Republic and Their Relevance to Sustainability: A Case Study. Sustainability 2024, 16, 5573. [Google Scholar] [CrossRef]
  10. Efthimiadou, A.; Bilalis, D.; Karkanis, A.; Froud-Williams, B.; Eleftherochorinos, I. Effects of cultural system (organic and conventional) on growth, photosynthesis and yield components of sweet corn (Zea mays L.) under semi-arid environment. Not. Bot. Horti Agrobot. Cluj-Napoca 2009, 37, 104–111. [Google Scholar]
  11. Posner, J.L.; Baldock, J.O.; Hedtcke, J.L. Organic and conventional production systems in the Wisconsin Integrated Cropping Systems Trials: I. Productivity 1990–2002. Agron. J. 2008, 100, 253–260. [Google Scholar] [CrossRef]
  12. Czarnecka, D.; Czubacka, A.; Agacka-Mołdoch, M.; Trojak-Goluch, A.; Księżak, J. The Occurrence of Fungal Diseases in Maize in Organic Farming Versus an Integrated Management System. Agronomy 2022, 12, 558. [Google Scholar] [CrossRef]
  13. Seufert, V.; Ramankutty, N.; Floey, J.A. Comparing the yields of organic and conventional agriculture. Nature 2012, 485, 229–232. [Google Scholar] [CrossRef]
  14. Archer, D.W.; Jaradat, A.A.; Johnson, J.M.F.; Lachnicht-Weyers, S.; Gesch, R.W.; Forcella, F.; Kludze, H.K. Crop Productivity and Economics during the Transition to Alternative Cropping Systems. Agron. J. 2007, 99, 1538–1547. [Google Scholar] [CrossRef]
  15. Vullaganti, N.; Ram, B.G.; Sun, X. Precision agriculture technologies for soil site-specific nutrient management: A comprehensive review. Artif. Intell. Agric. 2025, 15, 147–161. [Google Scholar] [CrossRef]
  16. Barbosa Júnior, M.R.; Moreira, B.R.D.A.; Carreira, V.D.S.; de Brito Filho, A.L.; Trentin, C.; de Souza, F.L.P.; Tedesco, D.; Setiyono, T.; Flores, J.P.; Ampatzidis, Y.; et al. Precision Agriculture in the United States: A Comprehensive Meta-Review Inspiring Further Research, Innovation, and Adoption. Comput. Electron. Agric. 2024, 221, 108993. [Google Scholar] [CrossRef]
  17. Kumar, R.; Mishra, R.; Gupta, H.P.; Dutta, T. Smart Sensing for Agriculture: Applications, Advancements, and Challenges. IEEE Consum. Electron. Mag. 2021, 10, 51–56. [Google Scholar] [CrossRef]
  18. Sharma, R.; Kamble, S.S.; Gunasekaran, A.; Kumar, V.; Kumar, A. A systematic literature review on machine learning applications for sustainable agriculture supply chain performance. Comput. Oper. Res. 2020, 119, 104926. [Google Scholar] [CrossRef]
  19. Pallottino, F.; Violino, S.; Figorilli, S.; Pane, C.; Aguzzi, J.; Colle, G.; Nemmi, E.N.; Montaghi, A.; Chatzievangelou, D.; Antonucci, F.; et al. Applications and perspectives of Generative Artificial Intelligence in agriculture. Comput. Electron. Agric. 2025, 230, 109919. [Google Scholar] [CrossRef]
  20. Lucas de Arruda, V.; Campos Tomaz, D.; Martins, R.N.; Rosas, J.T.F.; Lima dos Santos, F.F.; Portes, M.F. Optical Sensors for Precision Agriculture: An Outlook. J. Exp. Agric. Int. 2019, 35, 1–9. [Google Scholar] [CrossRef]
  21. Sishodia, R.P.; Ray, R.L.; Singh, S.K. Applications of Remote Sensing in Precision Agriculture: A Review. Remote Sens. 2020, 12, 3136. [Google Scholar] [CrossRef]
  22. Khanal, S.; Fulton, J.; Shearer, S. An overview of current and potential applications of thermal remote sensing in precision agriculture. Comput. Electron. Agric. 2017, 139, 22–32. [Google Scholar] [CrossRef]
  23. Haboudane, D.; Miller, J.R.; Tremblay, N.; Zarco-Tejada, P.J.; Dextraze, L. Integrated narrow-band vegetation indices for prediction of crop chlorophyll content for application to precision agriculture. Remote Sens. Environ. 2002, 81, 416–426. [Google Scholar] [CrossRef]
  24. Houborg, R.; McCabe, M.F. High-Resolution NDVI from Planet’s Constellation of Earth Observing Nano-Satellites: A New Data Source for Precision Agriculture. Remote Sens. 2016, 8, 768. [Google Scholar] [CrossRef]
  25. Kassa, A.K.; Zeng, H.; Wu, B.; Zhang, M.; Tsehai, K.K.; Qin, X.; Gebremicael, T.G. Integrating Climate Data and Remote Sensing for Maize and Wheat Yield Modelling in Ethiopia’s Key Agricultural Region. Remote Sens. 2025, 17, 491. [Google Scholar] [CrossRef]
  26. Mihalache, M.; Ilie, L. Agricultural Land Scoring; Dominor Publishing House: Bucharest, Romania, 2006; pp. 111–123. (In Romanian) [Google Scholar]
  27. Available online: https://comunacojocna.ro/comuna-cojocna/? (accessed on 4 March 2025).
  28. Available online: https://scdaturda.ro/turda-201/ (accessed on 4 March 2025).
  29. Information Guide for Beneficiaries of Rural Development Interventions DR-04 and DR-05—Organic Farming from the CAP Strategic Plan (CAP SP) 2023–2027, 2nd ed.; Romanian Payments and Intervention Agency for Agriculture: Bucharest, Romania, 2025. (In Romanian)
  30. Xue, J.; Su, B. Significant Remote Sensing Vegetation Indices: A Review of Developments and Applications. J. Sens. 2017, 2017, 1353691. [Google Scholar] [CrossRef]
  31. Sharma, L.K.; Bali, S.K. A review of methods to improve nitrogen use efficiency in agriculture. Sustainability 2018, 10, 51. [Google Scholar] [CrossRef]
  32. Șara, A.; Odagiu, A. Determination of Fodder Quality; Academic Press Publishing House: Cluj-Napoca, Romania, 2002; pp. 60–72. (In Romanian) [Google Scholar]
  33. Camen, D. Research Methods in Vegetal Physiology; Eurobit Publishing House: Timișoara, Romania, 2014; pp. 45–50. (In Romanian) [Google Scholar]
  34. Grudnicki, M.; Ianovici, N. Theoretical and Practical Notions of Vegetal Physiology; Mirton Publishing House: Timișoara, Romania, 2014; pp. 17–25. (In Romanian) [Google Scholar]
  35. Merce, E.; Merce, C. Statistics-Established and Fulfilling Paradigms; Academic Press Publishing House: Cluj-Napoca, Romania, 2009; pp. 178–190. (In Romanian) [Google Scholar]
  36. Friedel, J.K.; Ardakani, M.R. Soil nutrient dynamics and plant-induced nutrient mobilisation in organic and low-input farming systems: Conceptual framework and relevance. Biol. Agric. Hortic. 2020, 37, 1–24. [Google Scholar] [CrossRef]
  37. Lori, M.; Symnaczik, S.; Mäder, G.; De Deyn, G.; Gattinger, A. Organic farming enhances soil microbial abundance and activity—A metaanalysis and meta-regression. PLoS ONE 2017, 12, e0180442. [Google Scholar] [CrossRef] [PubMed]
  38. Laskari, M.; Menexes, G.C.; Kalfas, I.; Gatzolis, I.; Dordas, C. Effects of Fertilization on Morphological and Physiological Characteristics and Environmental Cost of Maize (Zea mays L.). Sustainability 2022, 14, 8866. [Google Scholar] [CrossRef]
  39. Ksiezak, J.; Staniak, M.; Bojarszczuk, J. Productivity of selected varieties of maize (Zea mays L.) in organic and integrated systems. Acta Sci. Pol. Agric. 2017, 16, 131–138. [Google Scholar]
  40. Mosheim, R.; Schimmelpfennig, D. Nutrient Use and Precision Agriculture in Corn Production in the USA. In Advances in Efficiency and Productivity Analysis. NAPW 2018; Parmeter, C.F., Sickles, R.C., Eds.; Springer Proceedings in Business and Economics; Springer: Cham, Switzerland, 2021. [Google Scholar] [CrossRef]
  41. Manu, A.; McDanel, J.; Brummel, D.; Avornyo, V.K.; Lawler, T. Using Unmanned Aerial Systems Technology to Characterize the Dynamics of Small-Scale Maize Production Systems for Precision Agriculture. Drones 2024, 8, 633. [Google Scholar] [CrossRef]
  42. Yost, M.A.; Kitchen, N.R.; Sudduth, K.A.; Massey, R.E.; Sadler, E.J.; Drummond, S.T.; Volkmann, M.R. A long-term precision agriculture system sustains grain profitability. Precis. Agric. 2019, 20, 1177–1198. [Google Scholar] [CrossRef]
  43. Argenta, G.; da Silva, P.R.F.; Sangoi, L. Leaf relative chlorophyll content as an indicator parameter to predict nitrogen fertilization in maize. Ciência Rural 2004, 34, 1379–1387. [Google Scholar] [CrossRef]
  44. Galani, Y.J.H.; Ligowe, I.S.; Martin, K.; Donwell, K.; Mexon, K.A.; Pamela, K.; Christian, T.; Andrew, D.; Yun, G.Y.; Caroline, O. Conservation Agriculture Affects Grain and Nutrient Yields of Maize (Zea mays L.) and Can Impact Food and Nutrition Security in Sub-Saharan Africa. Front. Nutr. 2022, 8, 804663. [Google Scholar] [CrossRef] [PubMed]
  45. Sannino, M.; Piscopo, R.; Serrapica, F.; Masucci, F.; di Francia, A.; Assirelli, A.; Cervelli, E.; Faugno, S. On farm evaluation of maize biomass, dry matter and crude protein by using yield monitor equipment. In Proceedings of the 28th European Biomass Conference and Exhibition, Virtual, 6–9 July 2020. [Google Scholar]
  46. Șonea, C.; Toader, M.; Năstase, I.P. The quality of maize grains in organic farming system. Rom. Biotechnol. Lett. 2020, 25, 1781–1789. [Google Scholar] [CrossRef]
  47. Miao, Y.; Mulla, D.J.; Hernandez, J.A.; Wiebers, M.; Robert, P.C. Potential Impact of Precision Nitrogen Management on Corn Yield, Protein Content, and Test Weight. Soil Sci. Soc. Am. J. 2007, 71, 1490–1499. [Google Scholar] [CrossRef]
  48. Shim, D.; Lee, K.-J.; Lee, B.-W. Response of phenology- and yield-related traits of maize to elevated temperature in a temperate region. Crop J. 2017, 59, 305–316. [Google Scholar] [CrossRef]
  49. Khan, N.A.; Yu, P.; Ali, M.; Conea, J.W.; Hendriks, W.H. Nutritive value of maize silage in relation to dairy cow performance and milk quality. J. Sci. Food Agric. 2015, 95, 238–252. [Google Scholar] [CrossRef]
  50. Ren, H.; Liu, M.; Zhang, J.; Liu, P.; Liu, C. Effects of agronomic traits and climatic factors on yield and yield stability of summer maize (Zea mays L.) in the Huang-Huai-Hai Plain in China. Front. Plant Sci. 2022, 13, 1050064. [Google Scholar] [CrossRef] [PubMed]
  51. Lobell, D.B.; Schlenker, W.; Costa-Roberts, J. Climate Trends and Global Crop Production Since 1980. Science 2021, 3339, 616–620. [Google Scholar] [CrossRef]
  52. Shirley, R.; Pope, E.; Bartlett, M.; Oliver, S.; Quadrianto, N.; Hurley, P.; Duivenvoorden, S.; Rooney, P.; Barrett, A.B.; Kent, C.; et al. An empirical, Bayesian approach to modelling the impact of weather on crop yield: Maize in the US. arXiv 2020, arXiv:2001.02614. [Google Scholar] [CrossRef]
  53. Maitah, M.; Malec, K.; Maitah, K. Influence of precipitation and temperature on maize production in the Czech Republic from 2002 to 2019. Sci. Rep. 2021, 11, 10467. [Google Scholar] [CrossRef]
Figure 1. The experimental design.
Sustainability 17 04132 g001
Figure 2. The climatic parameters reported in the experimental field, during April–July 2023.
Sustainability 17 04132 g002
Figure 3. The agronomic use efficiency observed in the experimental fields’ function of crop system and agricultural technology. OSST—organic system, standard technology; OSPAT—organic system, smart agricultural technology; CSST—conventional system, standard technology; CSPAT—organic system, precision agricultural technology; differences between any two averages are significant if their values are followed by letters or groups of different letters (p < 0.05).
Sustainability 17 04132 g003
Figure 4. The relationships between the number of maize leaves and chlorophyll content (SPAD). (a) Organic cultivation system. (b) Conventional cultivation system. C—control; ST—standard technology; PAT—precision agricultural technology.
Sustainability 17 04132 g004
Figure 5. The representation in PC1 × PC2 plans of the variables corresponding to principal factors in context, emphasizing the interaction between environmental factors and morphological characteristics in maize hybrid Turda 201 morphological traits. 11—leaf number V1; 12— leaf number V2; 13— leaf number V3; 14— leaf number V4; 21—cob length V1; 22—cob length V2; 23—cob length V3; 24—cob length V4; 31—plant height V1; 32—plant height V2; 33—plant height V3; 34—plant height V4; 41—cob diameter V1; 2—cob diameter V2; 43—cob diameter V3; 44—cob diameter V4; 51—rachis diameter V1; 52—rachis diameter V2; 53—rachis diameter V3; 54—rachis diameter V4; t—temperature; H—relative humidity; v—wind velocity; Pp—precipitations. The length and direction of the vectors indicate the strength and direction of the correlations; the traits that have vectors pointing in similar directions exhibit strong positive correlations, while those oriented in opposite directions suggest negative relationships.
Sustainability 17 04132 g005
Figure 6. The representation in PC1 × PC2 plans of the variables corresponding to principal factors in context, emphasizing the interaction between environmental factors and productive characteristics. 11—cob weight V1; 12—cob weight V2; 13—cob weight V3; 14—cob weight V4; 21—grain weight V1; 22—grain weight V2; 23—grain weight V3; 24—grain weight V4; 31—hectoliter mass V1; 32—hectoliter mass V2; 33—hectoliter mass V3; 34—hectoliter mass V4; 41—yield V1; 42—yield V2; 43—yield V3; 44—yield V4; t—temperature; H—relative humidity; v—wind velocity; Pp—precipitations.
Sustainability 17 04132 g006
Figure 7. The representation in PC1 × PC2 plans of the variables corresponding to principal factors in context, emphasizing the interaction between environmental factors and qualitative production characteristics. 11—dry matter V1; 12—dry matter V2; 13—dry matter V3; 14—dry matter V4; 21—crude protein V1; 22—crude protein V2; 23—crude protein V3; 24—crude protein V4; 31—crude fiber V1; 32—crude fiber V2; 33—crude fiber V3; 34—crude fiber V4; 41—crude fat V1; 42—crude fat V2; 43—crude fat V3; 44—crude fat V4; 51—crude ash V1; 52—crude ash V2; 53—crude ash V3; 54—crude ash V4; 61—NFM V1; 62—NFM V2; 63—NFM V3; 64—NFM V4; 71—starch V1; 72—starch; V2; 73—starch V3; 74—starch V4; t—temperature; H—relative humidity; v—wind velocity; Pp—precipitations.
Sustainability 17 04132 g007
Table 1. The morphological characteristics of maize function based on the crop system and technology.
CharacteristicCrop SystemTechnologyNXSDCV (%)
Leaf numberOrganicControl126.30 a0.9515.06
Standard127.00 a1.2517.82
Precision agricultural127.70 a1.1615.06
The cob length, cmControl1212.80 b1.4811.53
Standard1213.70 b1.4210.35
Precision agricultural1214.90 a0.885.88
The plant height, cmControl12163.00 c13.378.21
Standard12171.00 b11.977.00
Precision agricultural12177.70 a9.295.23
The cob diameter, mmControl1235.80 b3.7110.35
Standard1239.60 a1.263.19
Precision agricultural1240.50 a1.433.54
The rachis diameter, mmControl1218.70 a2.4513.11
Standard1220.50 a1.356.60
Precision agricultural1221.50 a1.517.02
Leaf numberConventionalControl128.60 b1.5117.51
Standard129.50 a0.9710.23
Precision agricultural1210.60 a1.1711.07
The cob length, cmControl1214.50 b1.9613.50
Standard1215.70 a0.956.04
Precision agricultural1217.20 a1.7510.18
The plant height, cmControl12184.90 c5.152.79
Standard12188.30 b5.272.80
Precision agricultural12197.00 a9.754.95
The cob diameter, mmControl1241.00 b2.586.30
Standard1242.50 ab1.583.72
Precision agricultural1244.50 a2.275.11
The rachis diameter, mmControl1220.80 b2.4911.95
Standard1222.70 ab1.958.57
Precision agricultural1224.10 a1.666.90
N—number of plants; X—average; s—standard deviation; CV—coefficient of variation; t-test (p < 0.05); differences between any two averages are significant if their values are followed by letters or groups of different letters.
Table 2. The production characteristics of maize function based on the crop system and technology.
CharacteristicCrop SystemTechnologyNXSDCV (%)
Cob weight, gOrganicControl12147.27 b32.6322.16
Standard12149.25 b34.9823.44
Precision agricultural12154.57 a34.1422.08
Grain weight, gControl12117.21 b27.3023.29
Standard12120.68 b27.9823.19
Precision agricultural12124.31 ab27.2721.94
Hectoliter mass, kg/hLControl1269.70 a4.746.80
Standard1271.30 a2.112.96
Precision agricultural1272.50 a2.373.27
Yield, kg/haControl126134.47 c1509.4724.61
Standard126275.10 b1455.0923.19
Precision agricultural126464.22 a1418.1921.94
Cob weight, gConventionalControl12190.70 b13.136.89
Standard12193.80 b15.077.78
Precision agricultural12208.40 a11.745.63
Grain weight, gControl12149.10 c19.5213.09
Standard12154.70 b13.528.74
Precision agricultural12177.00 a14.598.24
Hectoliter mass, kg/hLControl1274.10 b4.706.34
Standard1278.60 b3.924.99
Precision agricultural1284.20 a5.556.60
Yield, kg/haControl127960.20 c652.178.19
Standard128044.40 b703.258.74
Precision agricultural129204.00 a758.728.24
N—number of plants; X—average; s—standard deviation; CV—coefficient of variation; differences between any two averages are significant if their values are followed by letters or groups of different letters (p < 0.05).
Table 3. The production qualitative characteristics of maize function based on the crop system and technology.
CharacteristicCrop SystemTechnologyNXSDCV (%)
Dry matter, %OrganicControl1279.00 a4.375.53
Standard1280.80 a2.823.49
Precision agricultural1283.60 b2.222.66
Crude protein, %Control127.10 a1.2016.86
Standard127.70 a0.9512.32
Precision agricultural128.65 b1.0011.58
Crude fiber, %Control123.22 a0.6319.52
Standard123.43 a0.4513.04
Precision agricultural123.89 a0.8421.69
Crude fat, %Control121.12 a0.3228.48
Standard121.25 a0.5140.49
Precision agricultural121.47 a0.3020.29
Crude ash, %Control120.92 a0.2729.35
Standard120.97 a0.3334.38
Precision agricultural121.09 a0.2421.82
Nitrogen-Free Matter, %Control1287.79 a1.331.52
Standard1262.30 b2.163.47
Precision agricultural1264.40 b1.963.04
Starch, %Control1274.51 b2.583.47
Standard1275.65 b3.254.30
Precision agricultural1279.50 a2.853.59
Dry matter, %ConventionalControl1284.20 b2.042.43
Standard1285.40 ab1.261.48
Precision agricultural1286.90 a2.132.45
Crude protein, %Control128.90 b1.2013.45
Standard129.55 ab1.0711.16
Precision agricultural1210.75 a1.2711.86
Crude fiber, %Control123.57 a0.8222.95
Standard124.12 a0.7518.08
Precision agricultural124.55 a0.6915.06
Crude fat, %Control121.56 a0.4327.73
Standard121.85 a0.2513.78
Precision agricultural121.96 a0.2814.47
Crude ash, %Control121.03 a0.2625.50
Standard121.17 a0.2218.49
Precision agricultural121.59 a0.4628.97
Nitrogen-Free Matter, %Control1284.74 a1.461.73
Standard1271.00 b1.832.57
Precision agricultural1272.60 b1.351.86
Starch, %Control1281.03 a2.803.45
Standard1282.44 a1.682.04
Precision agricultural1283.15 a1.441.73
N—number of plants; X—average; s—standard deviation; CV—coefficient of variation; t-test (p < 0.05); differences between any two averages are significant if their values are followed by letters or groups of different letters.
Table 4. Simple Spearman correlations between environmental factors and morphological characteristics in maize hybrid Turda 201.
tHvPp1112131421222324313233344142434451525354
t1.00−0.060.05−0.09−0.20−0.23−0.38−0.11−0.32−0.18−0.17−0.22−0.23−0.23−0.29−0.36−0.25−0.40−0.32−0.40−0.18−0.40−0.28−0.36
H−0.061.00−0.52−0.160.12−0.02−0.010.360.120.21−0.220.14−0.100.24−0.21−0.230.15−0.22−0.160.05−0.17−0.10−0.43−0.18
v0.05−0.521.00−0.11−0.080.240.02−0.12−0.020.100.14−0.110.12−0.200.120.110.140.110.060.020.16010.200.21
Pp−0.09−0.16−0.111.000.15−0.060.130.30−0.19−0.070.46−0.31−0.44−0.33−0.14−0.10−0.13−0.22−0.260.33−0.180.11−0.24−0.32
11−0.200.12−0.080.151.000.110.100.280.120.520.320.360.110.200.010.310.200.11−0.090.250.370.030.20−0.05
12−0.23−0.020.24−0.060.111.00−0.240.17−0.29−0.030.38−0.210.050.030.030.260.260.02−0.40−0.14−0.19−0.010.270.11
13−0.38−0.010.020.130.10−0.241.000.240.310.440.140.34−0.030.220.010.150.380.050.170.230.440.32−0.150.04
14−0.110.36−0.120.300.280.170.241.000.130.450.250.27−0.160.17−0.12−0.230.26−0.29−0.400.05−0.120.29−0.39−0.44
21−0.320.12−0.02−0.190.12−0.290.310.131.000.46−0.150.750.020.390.030.160.410.070.290.110.230.33−0.070.18
22−0.180.210.10−0.070.22−0.030.440.450.461.000.310.390.160.44−0.010.250.500.12−0.010.040.120.20−0.03−0.09
23−0.17−0.220.140.460.320.380.140.25−0.150.311.000.010.20−0.10−0.030.190.310.25−0.290.240.080.370.20−0.01
24−0.220.14−0.11−0.310.36−0.210.340.270.750.390.011.000.150.190.070.150.350.160.160.030.380.44−0.070.09
31−0.23−0.100.12−0.440.110.05−0.03−0.160.020.160.200.151.000.120.220.26−0.110.270.36−0.080.300.110.430.32
32−0.230.24−0.20−0.330.200.030.220.170.390.44−0.100.190.121.00−0.070.110.130.290.18−0.120.300.180.150.19
33−0.29−0.210.12−0.140.010.030.01−0.120.03−0.01−0.030.070.22−0.071.000.210.250.090.040.190.070.100.480.28
34−0.36−0.230.11−0.100.310.260.15−0.230.160.250.190.150.260.110.211.000.420.230.410.380.270.180.320.22
41−0.250.150.14−0.130.200.260.380.260.410.500.310.35−0.110.130.250.421.000.15−0.040.340.250.460.150.12
42−0.40−0.220.11−0.220.110.020.05−0.290.070.120.250.160.270.290.090.230.151.000.380.240.480.700.330.34
43−0.32−0.160.06−0.26−0.09−0.400.17−0.400.29−0.01−0.290.160.360.180.040.41−0.040.381.000.280.240.090.680.38
44−0.200.050.020.330.25−0.140.230.050.110.040.240.03−0.08−0.120.190.380.340.240.281.000.250.23−0.050.74
51−0.18−0.170.16−0.180.37−0.190.44−0.120.230.120.080.380.300.300.070.270.250.480.240.251.000.450.380.22
52−0.40−0.100.100.110.03−0.010.320.290.330.200.370.440.110.180.100.180.460.700.090.230.451.000.120.24
53−0.28−0.430.20−0.240.200.27−0.15−0.39−0.07−0.030.20−0.070.430.150.480.320.150.330.68−0.050.380.121.000.10
54−0.36−0.180.21−0.32−0.050.110.04−0.440.18−0.09−0.010.090.320.190.280.220.120.340.380.740.220.240.101.00
11—leaf number V1; 12—leaf number V2; 13—leaf number V3; 14—leaf number V4; 21—cob length V1; 22—cob length V2; 23—cob length V3; 24—cob length V4; 31—plant height V1; 32—plant height V2; 33—plant height V3; 34—plant height V4; 41—cob diameter V1; 42—cob diameter V2; 43—cob diameter V3; 44—cob diameter V4; 51—rachis diameter V1; 52—rachis diameter V2; 53—rachis diameter V3; 54—rachis diameter V4; t—temperature; H—relative humidity; v—wind velocity; Pp—precipitations. The background color emphasizes the perfect positive linear relationship because it is calculated between identical variables.
Table 5. Simple Spearman correlations between environmental factors and productive characteristics in maize hybrid Turda 201.
tHvPp11121314212223243132333441424344
t1.00−0.060.05−0.09−0.18−0.11−0.02−0.11−0.13−0.13−0.09−0.13−0.33−0.70−0.44−0.73−0.39−0.35−0.17−0.14
H−0.061.00−0.52−0.16−0.04−0.03−0.28−0.03−0.020.03−0.020.040.080.120.040.16−0.22−0.180.030.48
v0.05−0.521.00−0.110.250.260.050.260.250.230.030.230.160.01−0.170.02−0.010.180.17−0.13
Pp−0.09−0.16−0.111.00−0.15−0.21−0.22−0.21−0.25−0.27−0.11−0.27−0.24−0.240.12−0.11−0.14−0.430.02−0.42
11−0.18−0.040.25−0.151.000.37−0.180.370.380.230.470.330.320.350.100.270.030.160.340.24
12−0.11−0.030.26−0.210.971.00−0.180.020.350.370.400.370.380.310.100.290.010.150.420.21
13−0.02−0.280.05−0.22−0.18−0.181.00−0.18−0.16−0.180.35−0.18−0.09−0.05−0.410.280.120.01−0.28−0.17
14−0.11−0.030.26−0.210.370.02−0.181.000.350.370.400.370.480.410.100.290.010.150.420.21
21−0.13−0.020.25−0.250.380.35−0.160.351.000.350.260.350.340.220.110.230.010.250.340.34
22−0.130.030.23−0.270.230.37−0.180.370.351.000.480.010.380.330.180.300.010.220.470.31
23−0.09−0.020.03−0.110.470.400.350.300.260.481.000.480.330.10−0.090.02−0.050.020.030.24
24−0.130.040.23−0.270.230.37−0.180.370.350.010.481.000.380.330.180.300.010.220.470.31
31−0.330.080.16−0.240.320.48−0.090.380.340.380.330.381.000.370.020.26−0.030.170.340.29
32−0.700.120.01−0.240.350.41−0.050.310.220.330.100.330.371.000.310.300.090.320.280.43
33−0.440.04−0.170.120.100.10−0.410.100.110.18−0.090.180.020.311.000.140.280.440.320.29
34−0.730.160.02−0.110.270.290.280.290.230.300.020.300.560.300.141.000.090.260.200.30
41−0.39−0.22−0.01−0.140.030.010.120.010.010.01−0.050.01−0.030.090.280.091.000.490.27−0.12
42−0.35−0.180.18−0.430.160.150.010.150.250.220.020.220.170.320.440.260.491.00−0.030.39
43−0.170.030.170.020.340.42−0.280.420.340.470.030.470.340.280.320.200.27−0.031.00−0.04
44−0.140.48−0.13−0.420.240.21−0.170.210.340.310.240.310.290.430.290.30−0.120.39−0.041.00
11—cob weight V1; 12—cob weight V2; 13—cob weight V3; 14—cob weight V4; 21—grain weight V1; 22—grain weight V2; 23—grain weight V3; 24— grain weight V4; 31—hectoliter mass V1; 32—hectoliter mass V2; 33—hectoliter mass V3; 34—hectoliter mass V4; 41—yield V1; 42—yield V2; 43—yield V3; 44—yield V4; t—temperature; H—relative humidity; v—wind velocity; Pp—precipitations. The background color emphasizes the perfect positive linear relationship because it is calculated between identical variables.
Table 6. Simple Spearman correlations between environmental factors and qualitative production characteristics in maize hybrid Turda 201.
tHvPp11121314212223243132333441424344515253546162636471727374
t1.00−0.060.05−0.090.18−0.21−0.18−0.340.03−0.27−0.20−0.100.080.01−0.21−0.01−0.24−0.21−0.21−0.150.080.020.05−0.180.06−0.04−0.070.19−0.22−0.30−0.120.10
H−0.061.00−0.12−0.16−0.20−0.28−0.180.02−0.190.10−0.08−0.35−0.22−0.300.12−0.10−0.16−0.230.070.26−0.27−0.25−0.110.28−0.01−0.25−0.19−0.18−0.200.21−0.050.24
v0.05−0.121.00−0.110.400.310.05−0.160.21−0.100.040.110.18−0.12−0.160.190.420.350.120.13−0.16−0.020.06−0.22−0.030.080.190.090.260.060.20−0.28
Pp−0.09−0.16−0.111.000.190.270.02−0.11−0.220.160.15−0.09−0.040.320.01−0.44−0.20−0.13−0.330.130.210.24−0.06−0.16−0.220.08−0.090.170.320.02−0.22−0.12
110.18−0.200.400.191.000.020.180.160.31−0.240.13−0.140.060.030.030.050.020.020.030.010.020.010.01−0.020.680.740.860.850.820.860.890.79
12−0.21−0.280.310.270.021.000.120.22−0.220.420.320.460.140.110.25−0.310.180.200.440.08−0.270.15−0.030.150.050.33−0.04−0.050.32−0.050.070.02
13−0.18−0.180.050.020.180.121.000.460.270.420.290.020.020.350.380.220.380.470.070.400.370.390.230.36−0.250.390.020.320.21−0.16−0.46−0.17
14−0.340.02−0.16−0.110.160.220.461.000.220.340.380.02−0.150.420.380.140.220.220.160.070.140.42−0.140.35−0.17−0.02−0.350.090.07−0.01−0.150.26
210.03−0.190.21−0.220.31−0.220.270.221.00−0.130.03−0.270.380.08−0.150.320.350.42−0.150.300.130.040.58−0.05−0.36−0.300.340.09−0.01−0.47−0.25−0.20
22−0.270.10−0.100.16−0.240.420.420.74−0.131.000.130.21−0.070.220.35−0.150.410.410.180.07−0.090.27−0.300.72−0.020.07−0.45−0.110.240.03−0.040.41
23−0.20−0.080.040.150.130.320.290.780.030.131.000.260.030.370.38−0.050.500.220.280.19−0.040.36−0.110.65−0.170.19−0.300.010.30−0.08−0.140.24
24−0.10−0.350.11−0.09−0.140.460.020.02−0.270.210.261.000.400.14−0.03−0.260.200.270.44−0.05−0.020.29−0.020.040.020.24−0.360.280.23−0.270.050.23
310.08−0.220.18−0.040.060.140.02−0.150.38−0.070.030.401.00−0.03−0.240.390.390.240.260.04−0.05−0.200.41−0.33−0.030.06−0.110.010.08−0.53−0.210.25
320.01−0.30−0.120.320.030.110.350.420.080.220.370.14−0.031.000.14−0.110.190.340.070.280.810.230.130.14−0.380.42−0.100.330.27−0.10−0.42−0.25
33−0.210.12−0.160.010.030.250.380.38−0.150.350.38−0.03−0.240.141.00−0.100.350.310.22−0.04−0.150.15−0.440.610.120.01−0.39−0.160.040.22−0.040.36
34−0.01−0.100.19−0.440.05−0.310.220.140.82−0.15−0.05−0.260.39−0.11−0.101.000.340.38−0.070.06−0.05−0.120.64−0.10−0.08−0.370.30−0.13−0.22−0.39−0.25−0.05
41−0.24−0.160.42−0.200.020.180.380.220.350.410.200.200.390.190.350.341.000.160.160.280.020.230.090.17−0.26−0.04−0.200.240.25−0.060.060.03
42−0.21−0.230.35−0.130.020.200.470.220.420.410.220.270.240.340.310.380.161.000.210.290.150.240.200.12−0.340.05−0.210.300.26−0.20−0.100.06
43−0.210.070.12−0.330.030.440.070.16−0.150.180.280.440.260.070.22−0.070.160.211.000.12−0.15−0.20−0.120.140.030.33−0.090.03−0.19−0.10−0.210.13
44−0.150.260.130.130.010.080.400.070.300.070.19−0.050.040.28−0.040.060.280.290.121.000.120.050.290.12−0.330.300.140.480.400.07−0.24−0.46
510.08−0.27−0.160.210.02−0.270.370.140.13−0.09−0.04−0.02−0.050.31−0.15−0.050.020.15−0.150.121.000.340.170.04−0.320.23−0.040.28−0.02−0.04−0.19−0.24
520.02−0.25−0.020.240.010.150.390.420.040.270.360.29−0.200.230.15−0.120.230.24−0.200.050.341.00−0.020.21−0.350.25−0.340.360.24−0.27−0.28−0.04
530.05−0.110.06−0.060.01−0.030.23−0.140.28−0.30−0.11−0.020.410.13−0.440.340.090.20−0.120.290.17−0.021.00−0.31−0.41−0.170.380.05−0.03−0.42−0.18−0.23
54−0.180.28−0.22−0.16−0.020.150.360.35−0.050.320.350.04−0.330.140.31−0.100.170.120.140.120.040.21−0.311.00−0.110.22−0.26−0.060.020.220.020.19
610.06−0.01−0.03−0.220.680.05−0.25−0.17−0.36−0.02−0.170.02−0.03−0.380.12−0.08−0.26−0.340.03−0.33−0.32−0.35−0.41−0.111.00−0.35−0.07−0.03−0.370.060.330.48
62−0.04−0.250.080.080.740.330.39−0.02−0.300.070.190.540.060.420.01−0.37−0.040.050.330.300.230.25−0.170.22−0.351.00−0.220.010.340.15−0.27−0.16
63−0.07−0.190.19−0.090.86−0.040.02−0.350.34−0.45−0.30−0.36−0.11−0.10−0.390.30−0.20−0.21−0.090.14−0.04−0.340.38−0.26−0.07−0.221.00−0.23−0.180.040.19−0.77
640.19−0.180.090.170.85−0.050.320.090.09−0.110.010.280.010.33−0.16−0.130.240.300.030.480.280.360.05−0.06−0.030.01−0.231.000.43−0.14−0.32−0.33
71−0.22−0.200.260.620.820.320.210.07−0.010.240.300.230.080.270.04−0.220.250.26−0.190.40−0.020.24−0.030.02−0.370.34−0.180.431.000.05−0.29−0.24
72−0.300.210.060.020.86−0.05−0.16−0.01−0.470.03−0.08−0.27−0.53−0.100.22−0.39−0.06−0.20−0.100.07−0.04−0.27−0.420.220.060.150.04−0.140.051.000.44−0.28
73−0.12−0.050.20−0.220.890.07−0.46−0.15−0.25−0.04−0.140.05−0.21−0.42−0.04−0.250.06−0.10−0.21−0.24−0.19−0.28−0.180.020.33−0.270.19−0.32−0.290.441.00−0.10
740.100.24−0.28−0.120.790.02−0.170.26−0.200.410.240.230.25−0.250.36−0.050.030.060.13−0.46−0.24−0.04−0.230.190.48−0.16−0.77−0.33−0.24−0.28−0.101.00
11—dry matter V1; 12—dry matter V2; 13—dry matter V3; 14—dry matter V4; 21—crude protein V1; 22—crude protein V2; 23—crude protein V3; 24—crude protein V4; 31—crude fiber V1; 32—crude fiber V2; 33—crude fiber V3; 34—crude fiber V4; 41—crude fat V1; 42—crude fat V2; 43—crude fat V3; 44—crude fat V4; 51—crude ash V1; 52—crude ash V2; 53—crude ash V3; 54—crude ash V4; 61—NFM V1; 62—NFM V2; 63—NFM V3; 64—NFM V4; 71—starch V1; 72—starch; V2; 73—starch V3; 74—starch V4; t—temperature; H—relative humidity; v—wind velocity; Pp—precipitations. The background color emphasizes the perfect positive linear relationship because it is calculated between identical variables.
Disclaimer/Publisher’s Note: The statements, opinions and data contained in all publications are solely those of the individual author(s) and contributor(s) and not of MDPI and/or the editor(s). MDPI and/or the editor(s) disclaim responsibility for any injury to people or property resulting from any ideas, methods, instructions or products referred to in the content.

