Abstract
The BRICS countries (Brazil, Russia, India, China, and South Africa) are responsible for forty-two per cent of global carbon emissions. These rapidly industrializing and economically growing countries are dependent on fossil fuels, which can lead to increased emissions. This research analyses the impact of economic growth, globalization, and renewable energy (RE) use on CO2 using a unique dataset of 155 observations and a practical model. Using panel data for 1990–2020, this study examines the relationships between CO2 emissions, GDP, RE use, and the KOF Globalization Index based on the Environmental Kuznets Curve (EKC) theory. Cointegration, unit root test, panel data analysis, and FGLS regression methods were used in this study. The results show that economic growth and globalization increase CO2, while RE is insufficient to reduce these effects. Moreover, it is determined that globalization has an increasing effect on CO2. This study makes a prominent contribution to the literature by examining the combined effects of globalization and economic growth on environmental sustainability. The findings emphasize the need for sustainable energy policies in BRICS countries.
1. Introduction
The BRICS countries—Brazil, Russia, India, China, and South Africa—have significantly contributed to the global rise in CO2 emissions due to their rapid economic expansion and accelerated industrialization. Their intensive industrialization strategies, particularly in energy-intensive sectors such as manufacturing, mining, and construction, have led to a substantial increase in CO2 emissions, collectively accounting for approximately 42% of global emissions [1,2,3]. Empirical studies conducted in BRICS countries reveal a unidirectional causal relationship running from economic growth to CO2 emissions [4].
The significant contribution of BRICS countries to global CO2 stresses the fact that it is imperative for environmental policies to be coercive. The continuous industrialization of these nations may worsen the environmental deterioration caused by economic activities, which might make it more difficult for nations to achieve their global climate targets. According to studies, the continued economic increase in these nations could aggravate environmental issues, akin to climate change, if they fail to execute efficient environmentally friendly policies [2,5]. To diminish the negative effects of industrialization and foster the shift to greener economies, it is critical to put comprehensive sustainability initiatives into place. In this regard, mechanisms like carbon trading schemes and energy efficiency incentives might be productive.
A valuable factor in lowering CO2 emissions in the BRICS nations is renewable energy. Since RE sources inherently have less impact on the environment, it is assumed that turning to RE sources from non-renewable ones will minimize overall emissions [6,7]. As RE sources generally emit less pollution than fossil fuels, studies support that increasing the energy mix share might largely help reduce emissions [6,7,8].
Economic growth and CO2 have become closely linked due to the processes of globalization in the BRICS countries. On the one hand, globalization facilitates the use and spread of cleaner practices and technology, which might cause emission reductions. Although the increasing trade and investment, the growth of industrial activity, and the energy consumption cause economic progress, they can result in higher emissions as well [9,10]. With respect to the BRICS countries, a sophisticated balance should be obtained among globalization, economic growth, and CO2 emissions. Nevertheless, it is certain that there are not many research reviews in the literature discussing the long-term consequences of the relationships among globalization, economic growth, and CO2 emissions in the BRICS countries. In this context, more research is required in order to understand how the use of RE particularly completes this relationship.
The correlations among CO2, GDP, RE use, and globalization levels are extensively used to build the policies related to climate change in the BRICS nations. Elevating GDP usually results in higher energy consumption, while growth in the economy regularly corresponds to higher emissions [11]. Fu et al. [11] and Hasanov et al. [6] affirm that the policies may allow RE to separate economic growth from CO2 emissions as well as lessen this effect due to the integration of RE sources into energy demand. In addition to that, the globalization level has an impact on energy policies because nations with greater economic integration will face pressure from other nations to perform more severe regulations regarding the environment [9,10].
Seeking to keep a balance between the harmful consequences of economic growth on the environment is a challenging task since the demands for environmental sustainability and economic development are contradictory. Reducing CO2 emissions and achieving economic growth at the same time is troublesome, which requires massive investments in RE and clean technology [5,12]. Taking into consideration the fact that economic growth might raise emissions, the literature restates the significance of strategic policy interventions and contends that turning to RE sources may offer a means to mitigate this effect [6,11,12].
Even though there are studies documenting the correlation between economic growth and rising CO2 emissions, green energy sources have been predicted to substantially reduce the impact of rising CO2. Moreover, studies show that moving to RE sources can greatly cut emissions while they generally display less of an impact on the environment than fossil fuels [6,7,8]. RE technologies must be continuously unified and formulated if the BRICS nations are to achieve their long-term sustainability targets along with tackling climate change concerns [6,12].
The impacts of globalization on energy policy and emission reduction initiatives of the BRICS nations remain complex for a number of reasons. There are some basic factors impacting this relationship including quite distinct levels of economic complexity, wealth inequality, and the particular energy policies that each nation has implemented [7,9]. In fact, in order to convey how well globalization promotes cleaner technology and practices, it is necessary that local circumstances, legal frameworks, and degrees of dedication to environmental sustainability be surveyed [9,10]. As for this complexity, in order to clarify the mechanisms at play in the process and create focused plans for reducing emissions in the context of globalization, more research is required.
In order to address this issue, research on the variables influencing CO2 emissions in the BRICS nations have typically concentrated on the connection between economic expansion and the use of energy from renewable sources. For example, Fu et al. [11] used different econometric models such as DOLS and FMOLS together to reveal the bidirectional causality relationship between economic growth and RE consumption but did not include the globalization effect in the model. Similarly, Sebri and Ben-Salha [13] attempted to explain the causality between RE consumption and economic growth with ARDL bounds testing and VECM methods. In this context, they only examined the explanatory variables of energy and trade. In another study, Lin et al. [14] used panel data methods to evaluate the effects of globalization and renewable electricity production on carbon neutral targets. However, they approached globalization in a one-dimensional manner. The influence of economic globalization on the deployment of clean energy has been researched by Majeed et al. [15] by employing sophisticated panel data methodologies, but they did not focus on its direct impact on CO2. Alternatively, Venkatraja [16] examined the impact of clean energy on economic growth using a panel regression model, framing the analysis exclusively within the context of the growth hypothesis. As a result of the interchange among quick economic growth, industrialization, and CO2, both major potential and struggles for sustainability in the BRICS countries are awaiting. Developing measures to support RE and address the environmental impacts of economic activities are seriously pursued. A sustainable future and the accomplishment of climate targets will depend on the capacity of these nations to incorporate sustainability into their growth strategies as they keep grappling with the challenges of globalization and economic advancement.
Recent studies have highlighted various policy- and technology-based mechanisms that contribute to carbon efficiency and sustainability. In particular, the emerging literature emphasizes the role of digital trade and financial technologies (Fintech) in reducing CO2 emissions within the framework of sustainable development goals [17,18]. For instance, spatially differentiated analyses based on China’s cross-border e-commerce pilot zones demonstrate that digital trade contributes to emission reductions both directly and through spatial spillover effects. Similarly, Fintech development has been found to enhance corporate environmental, social, and governance (ESG) performance by promoting green innovation, alleviating financial frictions, and reducing environmental uncertainties. Furthermore, infrastructure investments such as high-speed railways have been shown to exert positive spatial spillover effects on urban carbon efficiency [19], while tax reforms—such as China’s VAT reform—have significantly improved carbon efficiency by incentivizing technological upgrading and industrial restructuring [20]. Lastly, smart manufacturing technologies have been empirically proven to support corporate ESG performance, thereby contributing to more sustainable production strategies [21].
To tackle each of the problems described above, panel data analysis was used in this study, which also involved looking into the relationships among CO2 emissions and globalization, economic growth, and the usage of RE. The panel data model considers the variations across nations and changes over time, and it enables the data to be evaluated in both the cross-sectional and time dimensions. The conceptual structure for the current research is the Environmental Kuznets Curve (EKC) that is presented in the literature. Whereas environmental degradation grows worse during the early stages of economic growth, the EKC theory anticipates that after an income limit has been met, environmental quality will commence to improve. Although economic growth is typically viewed as a contributing cause, RE use is indispensable to lessen the impact of environmental degradation. Based on the conditions such as access to energy regulations and technology transfer, the globalization level may affect environmental implications positively and negatively. In this study, suggestions embracing more sustainable energy policy among BRICS nations have been provided after conducting an empirical evaluation of the effect of these factors on CO2 emissions.
2. Theoretical Framework and Hypotheses Development
2.1. The Relationship Between Economic Growth and Carbon Emissions
The relationship between economic growth and environmental degradation produces a contentious issue, most notably in the BRICS nations. EKC theory puts forward the idea that growth in an economy quickens environmental degradation in its initial stages but that the quality of the environment improves after a certain income level is obtained [22]. Contrary to this idea, it is argued that this idea may not be applicable owing to the industrialization and urbanization processes occurring in the BRICS nations. The data by the World Bank exhibit the primary role of BRICS nations in international environmental policies, indicating that they generate 42% of global CO2 emissions [2]. This is a considerably high percentage, and it showcases how powerful BRICS nations are in terms of creating a considerable impact on global sustainability and climate change efforts. Moreover, it highlights the necessity of international cooperation and strong regulations regarding the environment.
Developed by Grossman and Krueger [22], EKC theory posits that during the first stages of economic augmentation, environmental degradation will increase and will later fall once a particular income level is achieved as a result of more environmental awareness and tougher regulations. The urbanization and industrialization processes of BRICS countries, on the other side, cast doubt on the viability of the idea. The EKC theory has been controversial in BRICS countries because of the rise in environmental deterioration that accompanies economic growth. The environmental impact of economic growth has intensified in the BRICS nations due to the rise in CO2 emissions through urbanization and industrialization [23,24,25]. However, according to some research results, these adverse effects may be weakened by the application of RE sources and technology advancements [26,27,28].
The fast industrialization process of BRICS countries casts doubt on the EKC theory [29,30]. This is because BRICS nations often neglect environmental issues during economic progress, which means that CO2 emissions are high even when the income levels advance [8,31]. Yet, public awareness may rise, allowing legislative measures targeted at lowering CO2 emissions and facilitating the transition to sustainability once these economies grow up. It is believed that the principal drivers of this shift may be investments in RE sources and technical advancements [5,32,33].
Still, a noticeable amount of international collaboration and policy commitment must be demonstrated to direct the shift to a green economy, particularly in high-carbon emitting nations like the BRICS [34,35]. To start with, the intricate relationship among economic growth, industrialization, and environmental degradation in the BRICS nations draws attention to the pivotal role of global environmental policies that are forceful in handling the environmental issues caused by urbanization and industrialization while also promoting sustainable economic growth. The hypothesis that economic growth initially increases CO2 emissions reflects the first part of the EKC theory. This theory underlines that as income levels increase, environmental degradation first increases, and after a certain income threshold, it begins to decrease [22]. For that reason, the increasing effect of economic growth on CO2 emissions in BRICS countries includes the main relationship, which is tested through Hypothesis 1 (H1).
H1:
GDP in BRICS countries increases CO2 emissions.
2.2. The Relationship Between RE Consumption and CO2 Emissions
It is widely accepted that carbon related emissions are profoundly impacted by business growth and distinctly so among emerging nations. A key characteristic of the causal link between economic growth and CO2 emissions is that the growth is primarily driven by rising energy consumption, particularly from fossil fuel sources. For example, it has been documented by an array of research that economies in countries like China, which are very reliant on coal and other fossil fuels for energy production, are closely connected with rising CO2 emissions [36,37]. Considering that the BRICS countries have additionally witnessed the state, which is not the case with China, in which fossil fuels use improves economic expansion and raises CO2 emissions at the same time [24,38]. Empirical data indicate the clear relationship between economic growth and CO2 emissions, with a 1% rise in economic growth resulting in a 0.79% increase in CO2 emissions [32].
Marked by their dependence on fossil fuels, the BRICS nations’ growing economies have an immense effect on their production of CO2. As they progress, these nations require more fossil fuels as a result of their growing energy needs. For instance, because of rising coal consumption which is outpacing production, emissions have surged in India. Nonetheless, the overall tendency is still concerning owing to the ongoing reliance on fossil fuels for economic activity in spite of the fact that certain BRICS nations, like China and Brazil, have started to cut back on their coal usage [24]. This example demonstrates the difficulty of attaining a balance between environmental sustainability and economic expansion since the extension model that relies on fossil fuels tends to sustain CO2 in higher levels.
The shift to RE may be regained by the help of sustainable development, which has the potential to distinguish economic expansion from CO2 emissions. Research findings display that a higher ratio of the energy mix involving clean energy sources could end up in a notable reduction in greenhouse gas emissions [39,40]. Erdoğan et al. [40] assert that nations employing RE technologies both alleviate their carbon footprint and improve energy security while generating economic opportunities. This process of change is required to achieve long-term sustainability objectives and combat climate change.
Depending on the energy infrastructure and legislation of the countries, the amount of RE used to bring down CO2 emissions varies. Even though robust policies and investments have the potential to decrease CO2 emissions, weak policies retain the reliance on fossil fuels. What is more, investments in RE may contribute in many ways such as boosting economic growth, strengthening energy independence and the nation’s standing in the energy market, and assisting in the alleviation of emissions globally [39,40].
The subsequent step of the EKC theory is in line with the BRICS countries’ adoption of RE, which lessens CO2 emissions. According to the EKC theory, when economic growth exceeds a certain level, environmental awareness and technology investments increase. At this stage, the use of sustainable energy becomes widespread, contributing to the reduction in emissions [22]. Considering the BRICS nations, the correlation involving economic growth, the use of fossil fuels, and CO2 emissions is positioned to be more intricate. Although emissions often rise in response to economic growth, the shift to RE sources promises a means of reversing this tendency. National policies and infrastructure hold a relevant impact on how prosperous these transitions are, which underscores how central strategic investments in RE are to achieving sustainable enlargement objectives. Hence, the potential use of energy from renewables in BRICS countries to reduce CO2 emissions forms another key relationship that our study will test through Hypothesis 2 (H2).
H2:
RE consumption in BRICS countries reduces CO2 emissions.
2.3. The Relationship Between Globalization (KOF Index) and CO2 Emissions
Extensive empirical evidence supports the conclusion that the use of clean energy contributes to a reduction in CO2 emissions. Several studies indicate that shifting from fossil fuels to renewable energy sources leads to a significant decline in CO2 levels. Another example by Ulucak et al. [7] stress that turning to RE not only brings down production costs but also the costs associated with pollution, and this might enable opportunities for the BRICS countries to cut their CO2 emissions. Furthermore, Dong and Pan [41] report that the development of green energy yields positive outcomes. An example of this is that developing nations can adjust the energy systems to reduce CO2 emissions successfully. The study by Koengkan and Fuinhas [42] affirmed this finding, ascertaining that there is a negative relationship between the use of clean energy and CO2 emissions in South American nations. Also, they asserted that the results of this study hold a wider range of applications.
The literature review including the BRICS nations steadily exhibits that a climb in the use of energy from clean sources has been connected to a decrease in CO2 emissions. The study findings by Chhabra et al. indicate that rising political stability and efficiency in these nations greatly boosts the potential of RE to decrease emissions [43]. Additionally, Hasanov et al. [6] highlight the substantial contributions of BRICS nations to the generation of RE worldwide. Favoring the hypotheses, the findings of Fu et al.’s research verify that there is a unidirectional causal link between rising sustainable energy use and dropping CO2 emissions in the BRICS economies [11].
In the literature, there are various approaches to assess how well investments in RE reduce carbon footprints while upgrading environmental sustainability. For instance, Kırıkkaleli et al. [44] conducted a study including thorough research of 66 developing nations, and the results uncovered that renewable energy use greatly decreased CO2 emissions, reinforcing the case for more funding in the selected zone. Also, the research carried out by Banday and Aneja [24] marks that the smart policies may promote environmental sustainability without blocking economic growth, incorporating tax breaks for the development of RE. Similarly, the study findings by Paramati et al. [45] argue that laws that foster green energy generation in order to attain sustainable economic growth and lower emissions should be encouraged.
According to the theory of globalization, international collaboration, access to energy policy, and technological transfer have become decisive to reducing CO2 emissions. The prominence of technical innovation is remarkably foregrounded as this tends to render it less challenging to deploy cleaner energy technologies and boosts the effectiveness of RE systems [46]. In addition to trade openness, foreign direct investment has been registered to exert an influence on CO2 emissions, with clean energy use serving as a mitigating element in developing nations [47]. Based on the findings and results given above, it may be comprehended that by leveraging international cooperation and the sharing of technological advancements, global efforts to reduce emissions may be greatly facilitated.
However, in addition to the economic expansion and industrialization processes, the possibility of increasing fossil fuel use creates one of the biggest obstacles to environmental sustainability. Because of the recent surge in economic activity, energy demands are amplified and mostly met by fossil fuels, increasing CO2 emissions [29]. Apart from that, a paradox crops up as long as the dependency on non-RE sources continues. This is because environmental objectives are undermined by economic growth, negating the advantages of investments in RE [48]. To resolve this contradiction, the policies implemented should simultaneously promote both environmental sustainability and economic development. Likewise, the reduction in CO2 emissions by RE consumption is related to the structural transformation process in the high-income stage of the EKC theory. In this stage, thanks to increasing environmental awareness and technological developments, countries tend to reduce environmental damage while continuing economic growth by shifting from fossil fuels to renewable resources [22]. Therefore, Hypothesis 3 (H3) has been developed under the light of the information.
H3:
Globalization in BRICS countries (KOF Index) increases CO2 emissions.
The relationship between globalization and CO2 emissions is complex and multidimensional, particularly in the context of BRICS countries. Moreover, industrialization and economic expansion in these nations are widely recognized as the primary factors intensifying the impact of globalization on CO2 emissions. Relying repeatedly on fossil fuels, manufacturing and energy-intensive industries are flourishing in these nations as they become more integrated in the global economy. Research into the environmental cost of globalization-driven economic growth has disclosed that a 1% increase in research and development in the BRICS region is associated with an impressive increase in emissions [28]. Further, as the environmental cost is essentially passed to these developing nations, the export of industrial output from industrialized nations to low-middle income nations exacerbates CO2 emissions [49].
Globalization-related economic expansion elevates energy consumption, especially that of fossil fuels. To illustrate, about 87% of the energy needs of China include fossil fuels [50]. Although the financial gains in the short-term from fossil fuel use repeatedly exceed long-term sustainability objectives, this dependence on carbon-intensive energy sources makes the efforts to transition to RE even harder [5].
The literature includes a body of research that has explored the impact of economic growth on the use of fossil fuel-based energy in developing nations, particularly in the BRICS countries. This phenomenon has been blamed to be the result of the swift industrialization and urbanization processes that these nations are going through. Manufacturing, mining, and construction, known to be energy-intensive industries, are some of the fundamental agents of soaring energy consumption whilst the economies make progress [1]. There is a fact that these investments and infrastructure have a tight connection with fossil fuels, whereas the rise in CO2 introduces considerable troubles to the switch to RE sources [51]. Plus, the economic growth trajectory of BRICS nations appears to pursue a format in which high emissions distinguish the first steps of development owing to their reliance on inexpensive fossil fuels. Similar to that, the economic growth trajectory of BRICS countries tends to adjust to a design in which high emissions are characteristic of the initial development stages due to reliance on inexpensive fossil fuels. Since the current economic structures do not verify swift adjustments to sustainability, this makes the transition to cleaner energy more demanding [27].
BRICS countries’ economic growth frequently restricts the use of these green power technologies although it appears to have a tendency for RE development. According to the literature, even though the RE investments are rising, it is growing increasingly challenging to fulfill the industrialization-caused rise in energy demand [11]. As for the foreign direct investment, this has become particularly visible, by which the expected immediate economic benefits, at times, direct capital flows to fossil fuel projects in place of RE technologies [10]. The investments in RE often lag behind employing fossil fuels. In other words, the high initial costs of RE technologies and the absence of supportive government legislations may hinder investment into cleaner energy sources [30]. Since BRICS countries are heavily dependent on fossil fuels for economic growth, even though they have continued contributing significantly to global RE leadership, the overall CO2 emissions are on the rise [33].
The intricate interplay between economic growth, CO2, RE usage, and globalization in BRICS countries presents both significant opportunities and challenges in the pursuit of sustainable development goals. While economic expansion in these nations often leads to increased CO2 due to reliance on fossil fuels, the transition to RE is anticipated to mitigate this trend. Achieving climate-related objectives within the BRICS context—especially given the dual environmental effects of globalization—now necessitates global cooperation, strategic sustainability-oriented policies, and innovative energy solutions. Within this framework, a fundamental initial step in shaping policy recommendations for a more sustainable energy future involves utilizing panel data analysis to examine the interrelations among CO2 emissions, globalization, economic growth, and the adoption of RE.
3. Materials and Methods
The study used panel data consisting of 155 observation values (referred to as Obs), and they were gathered annually between 1990 and 2020 from the founding five nations of BRICS (Brazil, Russia, India, China, and the Republic of South Africa). The analyses were conducted using STATA 17.0 for statistical modeling and Microsoft Excel 365 for data organization and preprocessing.
The period analyzed in this study, 1990–2020, represents a time period in which significant economic, environmental, and technological transformations took place in the BRICS countries. The dissolution of the Soviet Union in 1991 accelerated the transition to a market economy, especially in Russia, and triggered comprehensive economic reforms. [52]. Likewise, China, India, Brazil, and South Africa have implemented economic liberalization policies since the early 1990s and increased their integration into the global economy [53]. During this period, there were also important developments in global environmental policies. For example, the adoption of the Kyoto Protocol in 1997 set greenhouse gas emission reduction targets for developed countries but did not impose binding obligations on developing countries [54]. With the signing of the Paris Agreement in 2015, all countries declared their national contributions towards the goal of keeping global warming below 2 °C [55]. Plus, China’s rapid progress in the digital economy and tax reforms, especially the Value Added Tax reform that encouraged the digital transformation of enterprises, have led to significant changes in the economic structure during this period [56]. Therefore, the period 1990–2020 is a critical time period for analyzing the interaction of economic growth, environmental policies, and technological innovation in BRICS countries.
This research aims to model how annual average per capita CO2 emissions in BRICS countries are affected by GDP, the share of renewable energy, and globalization, which is considered an economic indicator.
Equation (1) shows the linear function, which helps obtain this purpose.
In this model, all the relationships among carbon dioxide emissions (CO2), Gross Domestic Product (GDP), renewable energy consumption (RE), and the KOF Globalization Index (KOF) have been displayed. On account of economic growth, energy consumption and globalization CO2 emissions may go up. GDP explains the economic intensity of the activities and is often reviewed in the literature as an element that increases the environmental impact [22]. In addition to that, by using more environmentally friendly alternatives in energy consumption, CO2 emissions may be reduced thanks to the use of renewable energy consumption (RE) [57]. The degree of countries’ integration in the global economy is represented in the KOF Globalization Index (KOF). The KOF can play a consequential role in how this integration affects CO2 emissions through technology transfer, energy policies, and environmental regulations [58].
The regression model of the function written in Equation (1) may be seen in Equation (2).
In Equation (2), CO2 stands for the dependent variable in the model, while the remaining GDP, RE, and KOF variables denote the explanatory variables. Moreover, has been used to represent the error terms.
Analysis Process
Figure 1 portrays the course of the 10-stage empirical technique utilized during this investigation.
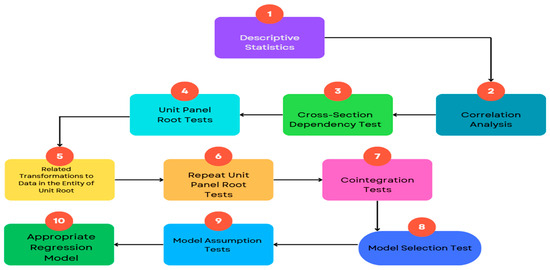
Figure 1.
Flow diagram of this study.
4. Results
The mean, standard deviation, minimum and maximum values, and data sources of the 155 observation values (referred to as Obs) of the independent (GDP, RE, and KOF) and dependent (CO2) variables utilized in this study are supplied in Table 1, Table 2 and Table 3. Descriptive statistics are also brought about, with differences measured at the level.

Table 1.
Variable descriptions (compiled by the authors).
Table 2.
Descriptive statistics.
Table 3.
Descriptive statistics (levels).
All data used in the study were obtained from widely used institutional data sources (World Bank [59] and KOF Swiss Economic Institute [60]) whose reliability is recognized in the international literature. However, it has been taken into account that there may be limited deviations in the data due to differences in reporting methods across countries. Findings should be evaluated within the framework of these limitations.
Figure 2, Figure 3, Figure 4 and Figure 5 exhibits the trend of the BRICS countries’ CO2, GDP, RE, and KOF values from 1990 to 2020.
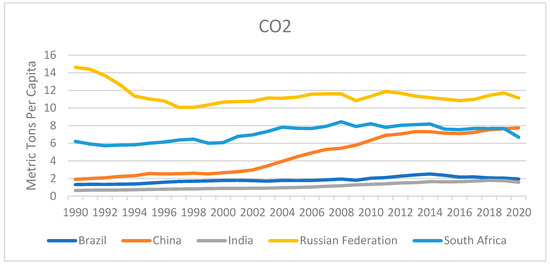
Figure 2.
CO2 Emissions in BRICS countries (1990–2020).

Figure 3.
GDP values of BRICS countries between 1990 and 2020.
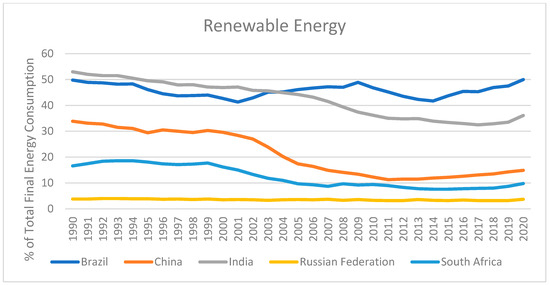
Figure 4.
RE values of BRICS countries between 1990 and 2020.
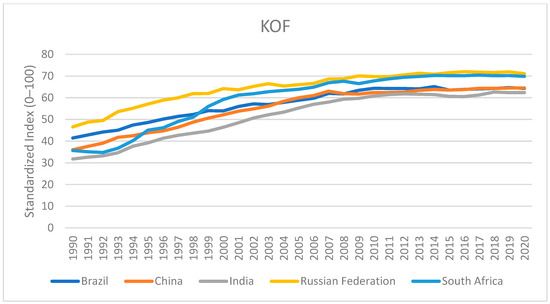
Figure 5.
KOF values of BRICS countries between 1990 and 2020.
The correlation coefficients among the independent variables included in the model are presented in Table 4. A positive correlation coefficient indicates that the associated variables move in the same direction, whereas a negative coefficient signifies an inverse relationship. For example, while KOF and GDP exhibit a positive association, GDP and RE consumption show a negative correlation. Moreover, all correlation coefficients reported in the analysis were found to be statistically significant at the 95% confidence level.
Table 4.
Correlation matrix of variables.
The correlation coefficient serves as a fundamental tool for evaluating the linear association between two variables. However, it may fall short in identifying the exact origin of this association. Although statistically significant correlation coefficients indicate a connection between variables, they do not sufficiently clarify the underlying drivers of this relationship [61]. To uncover the foundational factors behind such associations, a more in-depth investigation is essential. Analytical methods such as regression analysis, causality testing, and cointegration analysis are necessary to gain a more comprehensive understanding of these interactions [62]. Rather than merely capturing linear linkages, these approaches allow for a deeper exploration of dynamic relationships and potential temporal interactions.
4.1. Unit Root Tests for Panel Data
Cross-sectional dependence is among the most important methodological concerns in panel data analysis, as neglecting this issue may result in biased and inconsistent estimations. The literature provides various diagnostic tests to identify cross-sectional dependence, with the Breusch–Pagan LM test and the Pesaran CD test being the most widely recognized [63]. These tests are typically conducted before model estimation and unit root testing to verify the existence of cross-sectional dependence [64]. Table 5 reports the results of the Breusch–Pagan LM and Pesaran CD tests, based on the dataset employed in this study.
Table 5.
Cross-sectional dependence test.
Null hypothesis (H0):
there is a cross-sectional independence (namely, there is independence among countries).
Alternative hypothesis (H1):
there is a cross-sectional dependence (namely, there is dependency among countries).
Cross-sectional dependence may be observed from both tests (Sig. < 0.05). Since first-generation panel unit root tests are based on the assumption of cross-sectional independence, they become unsuitable under conditions where such independence is violated. In consequence, it would be more accurate to enlist the unit root tests for the second-generation panel to ascertain whether a unit root exists.
4.2. Second-Generation Unit Panel Root Tests
Unit root tests are applied to assess whether panel data series exhibit stationarity. Establishing stationarity is essential for multiple reasons: it prevents misleading inferences, enhances the credibility of hypothesis testing, ensures the stability and consistency of econometric models, and enables more accurate interpretation of results.
The Cross-Sectionally Augmented Dickey–Fuller (CADF) and the widely accepted Cross-Sectionally Augmented IPS (CIPS) tests are among the most prominent second-generation unit root tests [65]. In this study, both CADF and CIPS were employed to examine the stationarity properties of the variables, and the corresponding results are presented in Table 6 and Table 7.
Table 6.
CADF test results.
Table 7.
Results of the CIPS unit root test.
As a result of the second-generation panel unit root tests—namely CADF and CIPS—it was found that all variables, with the exception of GDP, were stationary. Ensuring stationarity in the series used is essential, as applying models to non-stationary data can produce inconsistent outcomes and lead to misinterpretations. To address this, several stabilization procedures were applied. Following differencing, which acted as the primary transformation method, logarithmic transformation was performed. Subsequently, the CADF and CIPS tests were re-applied, and the results are presented in Table 8, Table 9, Table 10 and Table 11. These findings revealed that, after the appropriate transformations, the series no longer exhibited unit roots.
Table 8.
CIPS unit root test results (first-differenced variables).
Table 9.
CIPS test results (after Ln is taken).
Table 10.
CADF test results (after Ln is taken).
Table 11.
CADF unit root test results (first-differenced variables).
4.3. Cointegration Tests
Cointegration testing is widely used in time series and panel data analysis to deter-mine whether two or more variables share a long-term equilibrium relationship. Even if each variable is individually stationary, they may still move together over time, indicating the presence of a stable long-run association. This equilibrium is identified through the application of cointegration tests [66].
H0:
no cointegration.
H1:
all panels are cointegrated.
According to the results presented in Table 12 (Sig. < 0.05), a strong and statistically significant cointegration relationship exists among the variables. This indicates that, in the long run, the variables exhibit co-movement and maintain a stable association over time.
Table 12.
Cointegration test results.
4.4. Model Selection Test
Model selection is fundamental to panel data analysis, depending on the objectives of the study or the specifics of the data format. When choosing a model, the choice between fixed effects and random effects models typically comes down to this [62].
The Hausman test [67] commonly employed in model selection, evaluates the differences between fixed and random effects models to determine which is more appropriate. Its results provide insights into the consistency of parameter estimates under the random effects specification. When unit-specific fixed effects are substantial and cannot be overlooked, the fixed effects model is deemed more suitable.
Based on the test results presented in Table 13 (Sig. > 0.05), the random effects model was deemed appropriate for implementation.
Table 13.
Hausman and Sargan–Hansen test.
To find the best estimation technique for panel data analysis, both fixed effects and random effects models were evaluated. The coefficient estimates and significance levels derived from the two models have been displayed in comparison in the Table 14.
Table 14.
Comparative results table (fixed vs. random effects).
As can be seen, Ln_GDP and Ln_Renew variables are statistically significant in both models and their coefficient values are quite similar. However, the Ln_KOF variable was not found to be significant in both models. This shows that the relationship between the independent variables and Ln_CO2 does not change significantly depending on the model selection.
The Hausman test applied for model selection showed that individual effects were unrelated to the explanatory variables, and, accordingly, this test disclosed that the random effects model should be preferred (p > 0.05). In addition, the random effects model is more compatible with the objectives of this study in that it allows the inclusion of time-invariant (time constant) variables in the model and provides more efficient estimates.
Together with that, Levene, Durbin–Watson, Pesaran, and Friedman tests were applied to assess whether the assumptions regarding the random effects model were met, and it was determined that the assumptions of this model were met to a large extent. These findings support the fact that the use of the random effects model in this study is appropriate both statistically and theoretically.
4.5. Hypothesis Testing for the Random Effects Model
As with other econometric models, the random effects model relies on specific underlying assumptions. The most critical among these is the assumption that the model’s error terms are uncorrelated with the independent variables. This condition corresponds to the independent and identically distributed nature of the unit-specific error components [68]. The model estimations will be inconsistent if this assumption is invalidated. Conversely, alternative assumptions embody that the error terms include constant variance, meaning that there should not be any autocorrelation or homoskedasticity between units [69]. The literature-based tests, the results of which are displayed in Table 15, Table 16, Table 17 and Table 18, have been applied to evaluate these hypotheses.
Table 15.
Levene and Brown–Forsythe test.
Table 16.
Durbin–Watson and Bhargava–Franzini–Narendranathan (Baltagi–Wu) test results.
Table 17.
Pesaran test.
Table 18.
Friedman test.
Table 15 offers the results of the Levene and Brown–Forsythe test. The results denote that the assumption of homogeneity of variances among groups has not been overlooked. Nevertheless, it is evident from the test results in Table 16, Table 17 and Table 18 that further assumptions are disregarded. The estimating model will produce inconsistent and inaccurate findings if this neglect is skipped over. In order to account for the negation of these assumptions, another appropriate regression model should be constructed. Following the completion of the literature research, it is noticeable that FGLS model—which encompasses both homoskedasticity and autocorrelation—should be put into practice.
4.6. Regression Model
In this study, the Feasible Generalized Least Squares (FGLS) method was employed to address issues of heteroskedasticity and autocorrelation within the panel data structure. However, a comparison of the results from several panel regression techniques has been conducted in order to assess how robust the final product of the model was (fixed effects and random effects). As seen in the Table 19, the variables Ln_GDP and Ln_Renew are statistically significant in all three models, and the direction of their coefficients is consistent. This instance demonstrates the reliability of the FGLS model’s output. On the other side, the Ln_KOF variable was determined to be significant only in the FGLS model, and the significance level was not obtained in the other models. This difference can be explained by the variability of the model assumptions and should be interpreted with caution. Overall, the findings from this study indicate that the FGLS regression results are robust. Furthermore, the findings show that the independent variables used in this study reliably reflect their effects on CO2 emissions.
Table 19.
Comparing different panel data models.
The regression technique commonly referred to as FGLS (Feasible Generalized Least Squares) has been implemented to panel data analysis to deal with the issues of autocorrelation and heteroskedasticity. The goal of this approach is to yield estimates that are more accurate and consistent when the data incorporates time series and cross-sectional dimensions. When the assumptions of homoscedasticity (constant variances) and independence of series are broken, traditional OLS approaches generate biased and inconsistent findings. When these presumptions fail to apply, FGLS estimates the variance–covariance structure of the error elements to account for inter-series dependence (autocorrelation) and heteroskedasticity [70].
Table 20 displays the results of a cross-sectional time series regression using the FGLS method, including the determined parameter estimates, standard errors, t-values, p-values, and confidence intervals. It was discovered that every regression coefficient was significant based on the data gathered from the analysis. The table additionally covers the importance levels. Furthermore, it was calculated that there is a positive and significant relationship between CO2 and GDP, a significant and negative relationship between CO2 emissions and the usage of green energy, and a positive and significant correlation between CO2 emissions and KOF. Equation (3) unveils the complete regression model.
Table 20.
FGLS regression for panel data (cross-sectional time-series).
Table 21 outlines the extent to which this study’s three hypotheses were supported by the empirical findings. Based on the analysis, it was concluded that all three hypotheses were validated by the data.
Table 21.
Summary of hypothesis test results.
5. Discussion
The results of this study demonstrate that the BRICS countries’ economic development and globalization have a growing impact on CO2, while the use of RE successfully reduces emissions. Plenty of studies in the body of current literature are in agreement with these conclusions.
In their study, Sebri and Ben-Salha [13] determined that the BRICS countries’ economic expansion enhances their energy consumption and thus increases CO2 emissions and emphasized that this situation is a risk in terms of sustainability. In the same study, it was expressed that RE consumption has a CO2 reducing effect and the importance of transforming the energy structure within the framework of environmental sustainability was underlined by the researchers.
Similarly, Fu et al. [11] asserted that the use of green power in BRICS is in a reciprocal relationship with economic growth and detected that it has an unfavorable effect on CO2. This result shows that clean energy not only reduces environmental damage but can also support growth. This current study also supports this view and indicates that energy policies should be structured in this direction.
Through their research, Lin et al. [14] explored how globalization affected CO2 in the BRICS nations and informed that economic and financial integration caused increasing environmental pressures. This finding overlaps with the “globalization-emission increase” relationship identified in our study. In this context, it can be testified that not only economic growth but also globalization elements such as global capital flows and trade integration have environmental effects.
Majeed et al. [15] argued that financial globalization exerts a positive influence on green energy consumption in BRICS countries, suggesting that this effect may indirectly contribute to the reduction in emissions. Indeed, when considered together with the finding that globalization directly increases CO2 in our study, it reveals that the nature and direction of globalization are decisive in terms of environmental impacts.
Chen, Xiao, and Jiang [56] showed that VAT reforms implemented in the case of China accelerated digitalization and firm transformation. This finding suggests that environmental sustainability can be contributed to if technology and innovation-based transformations in BRICS countries are supported by tax and incentive policies. In this context, this study underscores the need for transforming not only energy sources but also institutional frameworks and policy mechanisms to effectively address the environmental consequences of economic growth and globalization.
The results of this study also align with the Environmental Kuznets Curve (EKC) theory. Based on this theory, while CO2 increases in the initial industrialization periods, this effect decreases over time once income levels increase [22,23]. This study provides findings that support the EKC theory. Moreover, the study results also coincide with studies such as Balsalobre-Lorente et al. [4] and Banday and Aneja [24]. CO2 levels have been reported to remain considerable due to the swift increase in energy consumption, primarily in nations like China, India, and Brazil [1,3].
The reducing effect of RE consumption on CO2 is one of the notable findings of this study. Panel data regression results show that a 10% increase in green energy consumption reduces CO2 emissions by approximately 6.8%. This result implies that clean power is an effective policy tool in mitigating the environmental impacts of economic growth [6,7]. Numerous studies in the literature provide evidence in favor of this argument. As an illustration, Dong and Pan [41] stated that the development of RE technologies supports environmental sustainability, while Koengkan and Fuinhas [42], in their analysis of South American countries, identified a strong negative relationship between RE consumption and CO2 emissions. Paramati et al. [45] similarly emphasized that RE investments not only reduce environmental impacts but also support economic growth. In this regard, enhancing investments in green power in the BRICS nations will be crucial to accomplishing long-term sustainable development objectives.
According to the study findings, globalization has a positive effect on CO2. While technology transfer and the implementation of creative energy policies could help globalization minimize emissions, globalization increases emissions due to increased trade volume and industrial activities [9,10]. The positive relationship found between the KOF Globalization Index and CO2 reflects the impact of globalization on economic growth and energy-intensive industrialization [28,43]. However, the direction and severity of the environmental impacts of globalization largely depend on the regulatory capacity and environmental policy preferences of countries [5,30]. Wen et al. [46] signified that the dissemination of technological innovations and international cooperation can be effective in reducing emissions at this point.
In addition, Al-Mulali et al. [39] evaluated the bond between economic growth and CO2 emissions through the consumption of fossil fuels and uttered that this relationship can be shaped by energy policies. On the other hand, Erdoğan et al. [40] unveil that sustainable energy policies in countries like the BRICS countries can reduce emissions while observing economic growth, which also supports the findings obtained by this study.
Although BRICS countries are categorized as similar developing economies, they have significant structural differences in terms of their economic size, energy resource structures, and environmental policy practices. In this study, general trends are analyzed by using the panel data method, and separate models are not constructed on a country basis. This may lead to the limitation that heterogeneity across countries cannot be fully controlled. In future research, separate model estimations for each country or differentiating between countries with similar structures by using cluster methods will contribute to a more precise interpretation of the results.
The overall index value of the KOF Globalization Index was used to measure the level of globalization. However, this index consists of different sub-dimensions such as economic, social, and political globalization, and the impact of each sub-dimension on CO2 may differ. Due to the scope of this study, sub-indices are not disaggregated, and the concept of globalization is considered in a holistic manner. This leads to the limitation that different effects of globalization on a component basis cannot be examined in detail. In future research, examining the sub-dimensions of the KOF Index separately will provide more in-depth findings on the environmental impacts of economic, social, and political globalization.
In this study, some institutional and technical variables such as the stringency of environmental regulations, the quality of governance, and energy efficiency are not included in the model. The main reason for the exclusion of these variables is the lack of long-term and cross-country comparable data sets. In particular, data on indicators such as environmental regulations, governance quality, and energy efficiency are available for limited years in many BRICS countries and do not provide a holistic and homogenous structure covering the 1990–2020 period. However, it should not be ignored that such structural factors may have significant effects on CO2. Factors such as the effectiveness of environmental regulations, the extent of technological adaptation, and the efficiency of energy use may shape the direction and severity of emissions to different extents. Designing future studies to include such variables will provide more holistic and in-depth conclusions on the determinants of CO2.
Moreover, as the scope of this study is limited to the BRICS countries, the generalizability of the findings to other regional or economic contexts may be limited. Although the BRICS countries constitute a meaningful case for examining the relationships between globalization, economic growth, and CO2 emissions, caution should be exercised to say whether these results are valid for other developing or developed countries. For this reason, it is suggested that a wider group of countries should be included in future research, and the universality of the obtained relationships can be tested in a more reliable way.
6. Conclusions
Using panel data analysis, this study explored how economic growth, renewable energy usage, and globalization affect CO2 emissions in BRICS nations, demonstrating that each variable exerts a statistically significant influence on emission outcomes. The regression results suggest that effective regulation of economic growth, clean energy use, and globalization dynamics plays a critical role in mitigating CO2 emissions. For instance, the positive impact of economic growth on CO2 emissions (β = 0.102, p < 0.01) may be attributed to the continued reliance on fossil fuel-based energy systems. In contrast, the statistically significant negative association between renewable energy use and emissions (β = −0.68, p < 0.01) emphasizes the critical role of sustainable energy strategies in mitigating environmental degradation. The model employed in this study serves as a robust analytical framework to forecast how adjustments in these variables could help countries reduce their carbon footprints.
The panel data model used in this study provides a strong policy framework on how countries can manage CO2 with structural changes in these three dynamics. In particular, it should be supported by measures such as increasing the use of green energy, modernizing energy infrastructure, removing fossil fuel subsidies, and tax incentives. At the same time, regulations such as environmental taxation and corporate reporting systems should be put into effect. Technology and information sharing should be increased through international cooperation, and social costs should be minimized through just transition policies.
More specialized policy measures are required in light of the structural variations among the BRICS nations. To handle the fast urbanization in China and India, for example, efforts should concentrate on developing renewable energy infrastructure. In South Africa and Russia, however, it is more important to invest in modernizing old energy infrastructures and lowering reliance on fossil fuels. Furthermore, certain decarbonization tactics, such as technological advancements and more stringent environmental regulations, are needed in industries like heavy industry and transportation. The long-term environmental and economic benefits, such as enhanced public health, energy security, and green job opportunities, are anticipated to greatly exceed the short-term financial burdens, despite the fact that the initial implementation costs of these measures may be high, particularly in nations with limited fiscal space.
However, there are also some structural and institutional obstacles to this transformation process. Old energy infrastructures make it difficult to integrate renewable resources into the grid. Additionally, access to financing poses a serious obstacle to long-term investment projects. On top of that, policy uncertainties and instability of environmental regulations in some BRICS countries negatively affect private sector investments. In this context, BRICS countries should make long-term strategic energy plans, place environmental sustainability at the center of their development strategies, and integrate social stakeholders into decision-making processes. Institutional reforms, international technical collaborations, and inclusive governance approaches are critical to the success of this process.
While this study utilized panel data analysis to explore the impact of economic growth, globalization, and RE consumption on CO2 emissions in BRICS nations, certain methodological and data-related limitations should be acknowledged. First of all, since the analysis is limited to BRICS countries only, the generalizability of the findings to other country groups is limited. The model used did not include substantial variables such as environmental regulations, governance quality, and energy efficiency. This rendered it impossible to conduct a more thorough examination of the factors influencing emissions. Over and above, globalization was represented by a single index, and the separate effects of its subcomponents could not be evaluated. Obtaining data from secondary sources should be considered as a potential limitation that may affect the analysis results, especially due to reporting differences in some countries. Finally, the quantitative nature of this study cannot deeply examine country-based contextual differences. Therefore, it would be useful to support future research with qualitative methods.
The findings of this study also offer various directions for future research. First, comparative analyses with developing and developed countries outside of BRICS can be conducted to increase the generalizability of the findings. Moreover, the inclusion of new variables such as the stringency of environmental regulations, green technology investments, energy efficiency, environmental awareness, and governance quality in the model will allow for more in-depth analyses of the determinants of CO2. Using spatial econometric methods, the geographical distribution of emissions and their cross-border impacts can be examined. Qualitative data analyses and country-based case studies can be useful to assess in detail the differences in the content and implementation levels of energy policies. What is more, social dimensions such as just transition policies, green employment, and energy poverty should also be taken into greater consideration in future studies.
Author Contributions
All authors collaborated together to reveal this research, and they each made an equal contribution to the phases of this study. Altogether, E.E., C.G., and E.Ö.Ü. conceived this study, created the methodology, produced the first draft of this manuscript, and carried out a thorough literature review. The research hypotheses were developed collaboratively by all authors, who also completed the sections on discussion, recommendations, limitations, and conclusion. They kept a strict internal supervision system in place during the planning stage, keeping an eye on one another to prevent any difficulties and guarantee the quality of the assignment. All authors have read and agreed to the published version of this manuscript.
Funding
No external funding has been received to do this research.
Institutional Review Board Statement
Not applicable.
Informed Consent Statement
Not applicable.
Data Availability Statement
The datasets utilized in this study are available from the authors upon reasonable request [E.E., C.G., and E.Ö.Ü.].
Acknowledgments
To enhance the quality of the translation during manuscript preparation, the authors utilized AI-based tools such as DeepL, Grammarly, and QuillBot for translation and paraphrasing support.
Conflicts of Interest
No conflict of interest has been declared by the authors.
Abbreviations
The following abbreviations are used in this manuscript:
| CO2 | Carbon Dioxide |
| BRICS | Brazil, Russia, India, China, South Africa |
| EKC | Environmental Kuznets Curve |
| GDP | Gross Domestic Product |
| KOF | KOF Globalization Index |
| RE | Renewable Energy |
References
- Liu, J.-L.; Ma, C.-Q.; Ren, Y.-S.; Zhao, X.-W. Do Real Output and Renewable Energy Consumption Affect CO2 Emissions? Evidence for Selected BRICS Countries. Energies 2020, 13, 960. [Google Scholar] [CrossRef]
- Liu, S.; Gao, L.; Hu, X.; Shi, J.; Mohsin, M.; Naseem, S. Does Industrial Eco-Innovative Development and Economic Growth Affect Environmental Sustainability? New Evidence from BRICS Countries. Front. Environ. Sci. 2022, 10, 955173. [Google Scholar] [CrossRef]
- Adebayo, T.S.; Akadiri, S.S.; Akanni, E.O.; Sadiq-Bamgbopa, Y. Does Political Risk Drive Environmental Degradation in BRICS Countries? Evidence from Method of Moments Quantile Regression. Environ. Sci. Pollut. Res. 2022, 29, 32287–32297. [Google Scholar] [CrossRef] [PubMed]
- Balsalobre-Lorente, D.; Driha, O.M.; Halkos, G.; Mishra, S. Influence of Growth and Urbanization on CO2 Emissions: The Moderating Effect of Foreign Direct Investment on Energy Use in BRICS. Sustain. Dev. 2022, 30, 227–240. [Google Scholar] [CrossRef]
- Rahman, H.U.; Zaman, U.; Górecki, J. The Role of Energy Consumption, Economic Growth and Globalization in Environmental Degradation: Empirical Evidence from the BRICS Region. Sustainability 2021, 13, 1924. [Google Scholar] [CrossRef]
- Hasanov, F.J.; Khan, Z.; Hussain, M.; Tufail, M. Theoretical Framework for the Carbon Emissions Effects of Technological Progress and Renewable Energy Consumption. Sustain. Dev. 2021, 29, 810–822. [Google Scholar] [CrossRef]
- Ulucak, R.; Danish; Zhang, Y.; Chen, R.; Qiu, Y. Income Inequality, Economic Complexity, and Renewable Energy Impacts in Controlling Consumption-Based Carbon Emissions. Eval. Rev. 2024, 48, 119–142. [Google Scholar] [CrossRef]
- Baloch, M.A. Danish The Nexus between Renewable Energy, Income Inequality, and Consumption-Based CO Emissions: An Empirical Investigation. Sustain. Dev. 2022, 30, 1268–1277. [Google Scholar] [CrossRef]
- Haseeb, A.; Xia, E.; Danish; Baloch, M.A.; Abbas, K. Financial Development, Globalization, and CO2 Emission in the Presence of EKC: Evidence from BRICS Countries. Environ. Sci. Pollut. Res. Int. 2018, 25, 31283–31296. [Google Scholar] [CrossRef]
- Apergis, N.; Pinar, M.; Unlu, E. How Do Foreign Direct Investment Flows Affect Carbon Emissions in BRICS Countries? Revisiting the Pollution Haven Hypothesis Using Bilateral FDI Flows from OECD to BRICS Countries. Environ. Sci. Pollut. Res. 2023, 30, 14680–14692. [Google Scholar] [CrossRef]
- Fu, Q.; Álvarez-Otero, S.; Sial, M.S.; Comite, U.; Zheng, P.; Samad, S.; Oláh, J. Impact of Renewable Energy on Economic Growth and CO2 Emissions—Evidence from BRICS Countries. Processes 2021, 9, 1281. [Google Scholar] [CrossRef]
- Abbas, S.; Gui, P.; Chen, A.; Ali, N. The Effect of Renewable Energy Development, Market Regulation, and Environmental Innovation on CO2 Emissions in BRICS Countries. Environ. Sci. Pollut. Res. Int. 2022, 29, 59483–59501. [Google Scholar] [CrossRef]
- Sebri, M.; Ben-Salha, O. On the Causal Dynamics between Economic Growth, Renewable Energy Consumption, CO2 Emissions and Trade Openness: Fresh Evidence from BRICS Countries. Renew. Sustain. Energy Rev. 2014, 39, 14–23. [Google Scholar] [CrossRef]
- Lin, J.; Li, X.; Hasnaoui, A. BRICS Carbon Neutrality Target: Measuring the Impact of Electricity Production from Renewable Energy Sources and Globalization. J. Environ. Manag. 2021, 298, 113460. [Google Scholar] [CrossRef]
- Majeed, A.; Ahmad, M.; Rasheed, M.F.; Khan, M.K.; Popp, J.; Oláh, J. The Dynamic Impact of Financial Globalization, Environmental Innovations and Energy Productivity on Renewable Energy Consumption: Evidence From Advanced Panel Techniques. Front. Environ. Sci. 2022, 10, 894857. [Google Scholar] [CrossRef]
- Venkatraja, B. Does Renewable Energy Affect Economic Growth? Evidence from Panel Data Estimation of BRIC Countries. Int. J. Sustain. Dev. World Ecol. 2020, 27, 107–113. [Google Scholar] [CrossRef]
- Gao, D.; Tan, L.; Chen, Y. Unlocking Carbon Reduction Potential of Digital Trade: Evidence from China’s Comprehensive Cross-Border E-Commerce Pilot Zones. Sage Open 2025, 15, 21582440251319966. [Google Scholar] [CrossRef]
- Gao, D.; Tan, L.; Duan, K. Forging a Path to Sustainability: The Impact of Fintech on Corporate ESG Performance. Eur. J. Financ. 2024, 1–19. [Google Scholar] [CrossRef]
- Gao, D.; Wang, G. Does the Opening of High-Speed Rails Improve Urban Carbon Efficiency? Evidence from a Spatial Difference-in-Difference Method. Environ. Sci. Pollut. Res. 2023, 30, 101873–101887. [Google Scholar] [CrossRef]
- Gao, D.; Mo, X.; Xiong, R.; Huang, Z. Tax Policy and Total Factor Carbon Emission Efficiency: Evidence from China’s VAT Reform. Int. J. Environ. Res. Public Health 2022, 19, 9257. [Google Scholar] [CrossRef]
- Gao, D.; Tan, L.; Chen, Y. Smarter Is Greener: Can Intelligent Manufacturing Improve Enterprises’ ESG Performance? Humanit. Soc. Sci. Commun. 2025, 12, 529. [Google Scholar] [CrossRef]
- Grossman, G.M.; Krueger, A.B. Economic Growth and the Environment. Q. J. Econ. 1995, 110, 353–377. [Google Scholar] [CrossRef]
- He, F.; Chang, K.-C.; Li, M.; Li, X.; Li, F. Bootstrap ARDL Test on the Relationship among Trade, FDI, and CO2 Emissions: Based on the Experience of BRICS Countries. Sustainability 2020, 12, 1060. [Google Scholar] [CrossRef]
- Banday, U.J.; Aneja, R. Renewable and Non-Renewable Energy Consumption, Economic Growth and Carbon Emission in BRICS: Evidence from Bootstrap Panel Causality. Int. J. Energy Sect. Manag. 2019, 14, 248–260. [Google Scholar] [CrossRef]
- Udeagha, M.C.; Muchapondwa, E. Investigating the Moderating Role of Economic Policy Uncertainty in Environmental Kuznets Curve for South Africa: Evidence from the Novel Dynamic ARDL Simulations Approach. Environ. Sci. Pollut. Res. Int. 2022, 29, 77199–77237. [Google Scholar] [CrossRef] [PubMed]
- Leitão, N.C.; Balsalobre-Lorente, D.; Cantos-Cantos, J.M. The Impact of Renewable Energy and Economic Complexity on Carbon Emissions in BRICS Countries under the EKC Scheme. Energies 2021, 14, 4908. [Google Scholar] [CrossRef]
- Zhang, H. Technology Innovation, Economic Growth and Carbon Emissions in the Context of Carbon Neutrality: Evidence from BRICS. Sustainability 2021, 13, 11138. [Google Scholar] [CrossRef]
- Ganda, F. The Impact of Health Expenditure on Environmental Quality: The Case of BRICS. Dev. Stud. Res. 2021, 8, 199–217. [Google Scholar] [CrossRef]
- Zoaka, J.D.; Ekwueme, D.C.; Güngör, H.; Alola, A.A. Will Financial Development and Clean Energy Utilization Rejuvenate the Environment in BRICS Economies? Bus. Strategy Environ. 2022, 31, 2156–2170. [Google Scholar] [CrossRef]
- Kayani, U.N.; Nasim, I.; Aysan, A.F.; Bashir, F.; Iqbal, U. Emerging Trends of Carbon Emissions and Foreign Direct Investment: Accounting for Ecological Footprints, Renewable Energy, Globalization, and Technological Innovations in BRICS. Environ. Sci. Pollut. Res. 2024, 31, 41586–41599. [Google Scholar] [CrossRef]
- Chishti, M.Z.; Sinha, A. Do the Shocks in Technological and Financial Innovation Influence the Environmental Quality? Evidence from BRICS Economies. Technol. Soc. 2022, 68, 101828. [Google Scholar] [CrossRef]
- Erdoğan, S.; Yıldırım, D.Ç.; Gedikli, A. Investigation of Causality Analysis between Economic Growth and CO2 Emissions: The Case of BRICS—T Countries. Int. J. Energy Econ. Policy 2019, 9, 430–438. [Google Scholar] [CrossRef]
- Du, J.; Cheng, J.; Ali, K. Modelling the Green Logistics and Financial Innovation on Carbon Neutrality Goal, a Fresh Insight for BRICS-T. Geol. J. 2023, 58, 2742–2756. [Google Scholar] [CrossRef]
- Bodas Freitas, I.M.; Dantas, E.; Iizuka, M. The Kyoto Mechanisms and the Diffusion of Renewable Energy Technologies in the BRICS. Energy Policy 2012, 42, 118–128. [Google Scholar] [CrossRef]
- Sampene, A.; Li, C.; Agyeman, F.; Brenya, R. Analysis of the BRICS Countries’ Pathways towards a Low-Carbon Environment. BRICS J. Econ. 2021, 2, 77–102. [Google Scholar] [CrossRef]
- Wang, M.L.; Wang, W.; Du, S.Y.; Li, C.F.; He, Z. Causal Relationships between Carbon Dioxide Emissions and Economic Factors: Evidence from China. Sustain. Dev. 2019, 28, 73–82. [Google Scholar] [CrossRef]
- Zhao, X.; Jiang, M.; Zhang, W. Decoupling between Economic Development and Carbon Emissions and Its Driving Factors: Evidence from China. Int. J. Environ. Res. Public Health 2022, 19, 2893. [Google Scholar] [CrossRef] [PubMed]
- Kurniadi, A.P.; Aimon, H.; Amar, S. Analysis of Green Economic Growth, Biofuel Oil Consumption, Fuel Oil Consumption and Carbon Emission in Asia Pacific. Int. J. Sustain. Dev. Plan. 2022, 17, 2247–2254. [Google Scholar] [CrossRef]
- Al-Mulali, U.; Ozturk, I.; Lean, H.H. The Influence of Economic Growth, Urbanization, Trade Openness, Financial Development, and Renewable Energy on Pollution in Europe. Nat. Hazards 2015, 79, 621–644. [Google Scholar] [CrossRef]
- Erdoğan, E.; Serin Oktay, D.; Manga, M.; Bal, H.; Algan, N. Examining the Effects of Renewable Energy and Economic Growth on Carbon Emission in Canada: Evidence from the Nonlinear ARDL Approaches. Eval. Rev. 2024, 48, 63–89. [Google Scholar] [CrossRef]
- Dong, F.; Pan, Y. Evolution of Renewable Energy in BRI Countries: A Combined Econometric and Decomposition Approach. Int. J. Environ. Res. Public Health 2020, 17, 8668. [Google Scholar] [CrossRef] [PubMed]
- Koengkan, M.; Fuinhas, J.A. The Impact of Renewable Energy Consumption on Carbon Dioxide Emissions—The Case of South American Countries. Rev. Bras. Energ. Renov. 2018, 7, 280–293. [Google Scholar] [CrossRef]
- Chhabra, M.; Giri, A.K.; Kumar, A. Do Trade Openness and Institutional Quality Contribute to Carbon Emission Reduction? Evidence from BRICS Countries. Environ. Sci. Pollut. Res. 2023, 30, 50986–51002. [Google Scholar] [CrossRef]
- Kirikkaleli, D.; Güngör, H.; Adebayo, T.S. Consumption-Based Carbon Emissions, Renewable Energy Consumption, Financial Development and Economic Growth in Chile. Bus. Strategy Environ. 2022, 31, 1123–1137. [Google Scholar] [CrossRef]
- Paramati, S.R.; Sinha, A.; Dogan, E. The Significance of Renewable Energy Use for Economic Output and Environmental Protection: Evidence from the Next 11 Developing Economies. Environ. Sci. Pollut. Res. Int. 2017, 24, 13546–13560. [Google Scholar] [CrossRef]
- Wen, Y.; Onwe, J.C.; Haseeb, M.; Saini, S.; Matuka, A.; Sahoo, D. Role of Technological Innovation, Renewable and Non-Renewable Energy, and Economic Growth on Environmental Quality. Evidence from African Countries. Front. Energy Res. 2022, 10, 958839. [Google Scholar] [CrossRef]
- Khan, H.; Weili, L.; Khan, I.; Khamphengxay, S. Renewable Energy Consumption, Trade Openness, and Environmental Degradation: A Panel Data Analysis of Developing and Developed Countries. Math. Probl. Eng. 2021, 2021, 6691046. [Google Scholar] [CrossRef]
- Wu, Z.; Hou, G.; Xin, B. The Causality between Participation in GVCs, Renewable Energy Consumption and CO2 Emissions. Sustainability 2020, 12, 1237. [Google Scholar] [CrossRef]
- Wang, Q.; Zhang, F. The Effects of Trade Openness on Decoupling Carbon Emissions from Economic Growth—Evidence from 182 Countries. J. Clean. Prod. 2021, 279, 123838. [Google Scholar] [CrossRef]
- Chen, J.; Yang, F.; Liu, Y.; Usman, A. The Asymmetric Effect of Technology Shocks on CO2 Emissions: A Panel Analysis of BRICS Economies. Environ. Sci. Pollut. Res. 2022, 29, 27115–27123. [Google Scholar] [CrossRef]
- Hafeez, M.; Yuan, C.; Khelfaoui, I.; Sultan Musaad O, A.; Waqas Akbar, M.; Jie, L. Evaluating the Energy Consumption Inequalities in the One Belt and One Road Region: Implications for the Environment. Energies 2019, 12, 1358. [Google Scholar] [CrossRef]
- Shleifer, A.; Vishny, R.W. Reversing the Soviet Economic Collapse. Brook. Pap. Econ. Act. 1991, 1991, 341. [Google Scholar] [CrossRef][Green Version]
- Fischer, S.; Summers, L.; Nordhaus, W. Stabilization and Economic Reform in Russia. Brook. Pap. Econ. Act. 1992, 1992, 77. [Google Scholar] [CrossRef]
- United Nations. Kyoto Protocol to the United Nations Framework Convention on Climate Change; United Nations: New York, NY, USA, 1998. [Google Scholar]
- United Nations. Paris Agreement; United Nations: New York, NY, USA, 2015. [Google Scholar]
- Chen, Z.; Xiao, Y.; Jiang, K. The Impact of Tax Reform on Firms’ Digitalization in China. Technol. Forecast. Soc. Change 2023, 187, 122196. [Google Scholar] [CrossRef]
- Apergis, N.; Payne, J.E. Renewable Energy Consumption and Economic Growth: Evidence from a Panel of OECD Countries. Energy Policy 2010, 38, 656–660. [Google Scholar] [CrossRef]
- Omri, A.; Nguyen, D.K. On the Determinants of Renewable Energy Consumption: International Evidence. Energy 2014, 72, 554–560. [Google Scholar] [CrossRef]
- World Bank Open Data. Available online: https://data.worldbank.org (accessed on 25 April 2025).
- KOF Time Series Database. Available online: https://kof.ethz.ch/en/data/kof-time-series-database.html (accessed on 25 April 2025).
- Granger, C.W. Investigating Causal Relations by Econometric Models and Cross-Spectral Methods. Econom. J. Econom. Soc. 1969, 37, 424–438. [Google Scholar] [CrossRef]
- Wooldridge, J.M. Econometric Analysis of Cross Section and Panel Data; MIT Press: Cambridge, MA, USA, 2010. [Google Scholar]
- Pesaran, M.H. General Diagnostic Tests for Cross Section Dependence in Panels. Cambridge Working Papers. Economics 2004, 1240, 1. [Google Scholar]
- Breusch, T.S.; Pagan, A.R. The Lagrange Multiplier Test and Its Applications to Model Specification in Econometrics. Rev. Econ. Stud. 1980, 47, 239–253. [Google Scholar] [CrossRef]
- Pesaran, M.H. A Simple Panel Unit Root Test in the Presence of Cross-section Dependence. J. Appl. Econom. 2007, 22, 265–312. [Google Scholar] [CrossRef]
- Engle, R.F.; Granger, C.W. Co-Integration and Error Correction: Representation, Estimation, and Testing. Econom. J. Econom. Soc. 1987, 55, 251–276. [Google Scholar] [CrossRef]
- Hausman, J.A. Specification Tests in Econometrics. Econom. J. Econom. Soc. 1978, 46, 1251–1271. [Google Scholar] [CrossRef]
- Greene, W.H. Econometric Analysis, 7th ed.; Pearson: Boston, MA, USA, 2012; ISBN 978-0-13-139538-1. [Google Scholar]
- Baltagi, B.H. (Ed.) Econometric Analysis of Panel Data, 3rd ed.; Wiley: Chichester, UK, 2005; ISBN 978-0-470-01456-1. [Google Scholar]
- Parks, R.W. Efficient Estimation of a System of Regression Equations When Disturbances Are Both Serially and Contemporaneously Correlated. J. Am. Stat. Assoc. 1967, 62, 500–509. [Google Scholar] [CrossRef]
Disclaimer/Publisher’s Note: The statements, opinions and data contained in all publications are solely those of the individual author(s) and contributor(s) and not of MDPI and/or the editor(s). MDPI and/or the editor(s) disclaim responsibility for any injury to people or property resulting from any ideas, methods, instructions or products referred to in the content. |
© 2025 by the authors. Licensee MDPI, Basel, Switzerland. This article is an open access article distributed under the terms and conditions of the Creative Commons Attribution (CC BY) license (https://creativecommons.org/licenses/by/4.0/).