

The Impact of Data Element Marketization on Green Total Factor Energy Efficiency: Empirical Evidence from China


Abstract
1. Introduction
- (1)
- A multi-period difference-in-differences (DID) model was employed to examine both the short-term and long-term effects of DEM on enhancing urban GTFEE, based on the development of China’s data trading platform as a quasi-natural experiment. Additionally, the heterogeneous effects of DEM on urban GTFEE were comprehensively analyzed from the perspectives of city type, urban energy intensity, the new-energy pilot policy, and urban governance capacity.
- (2)
- This study explored the mechanisms by which DEM influences urban GTFEE through multiple pathways, including data elements, and the integration of data elements and AI. Furthermore, it reveals how DEM can enhance urban GTFEE by fostering the integration of data elements and AI.
- (3)
- Spatial econometric models were applied within the frameworks of the economic distance matrix and economic geography nested matrix to investigate the potential digital divide arising from DEM. By revealing the spatial heterogeneity of the effects of differences in digital infrastructure and economic development on the policy of DEM, this study provides a practical foundation for promoting balanced urban development and targeted policy implementation.
2. Theoretical Analysis
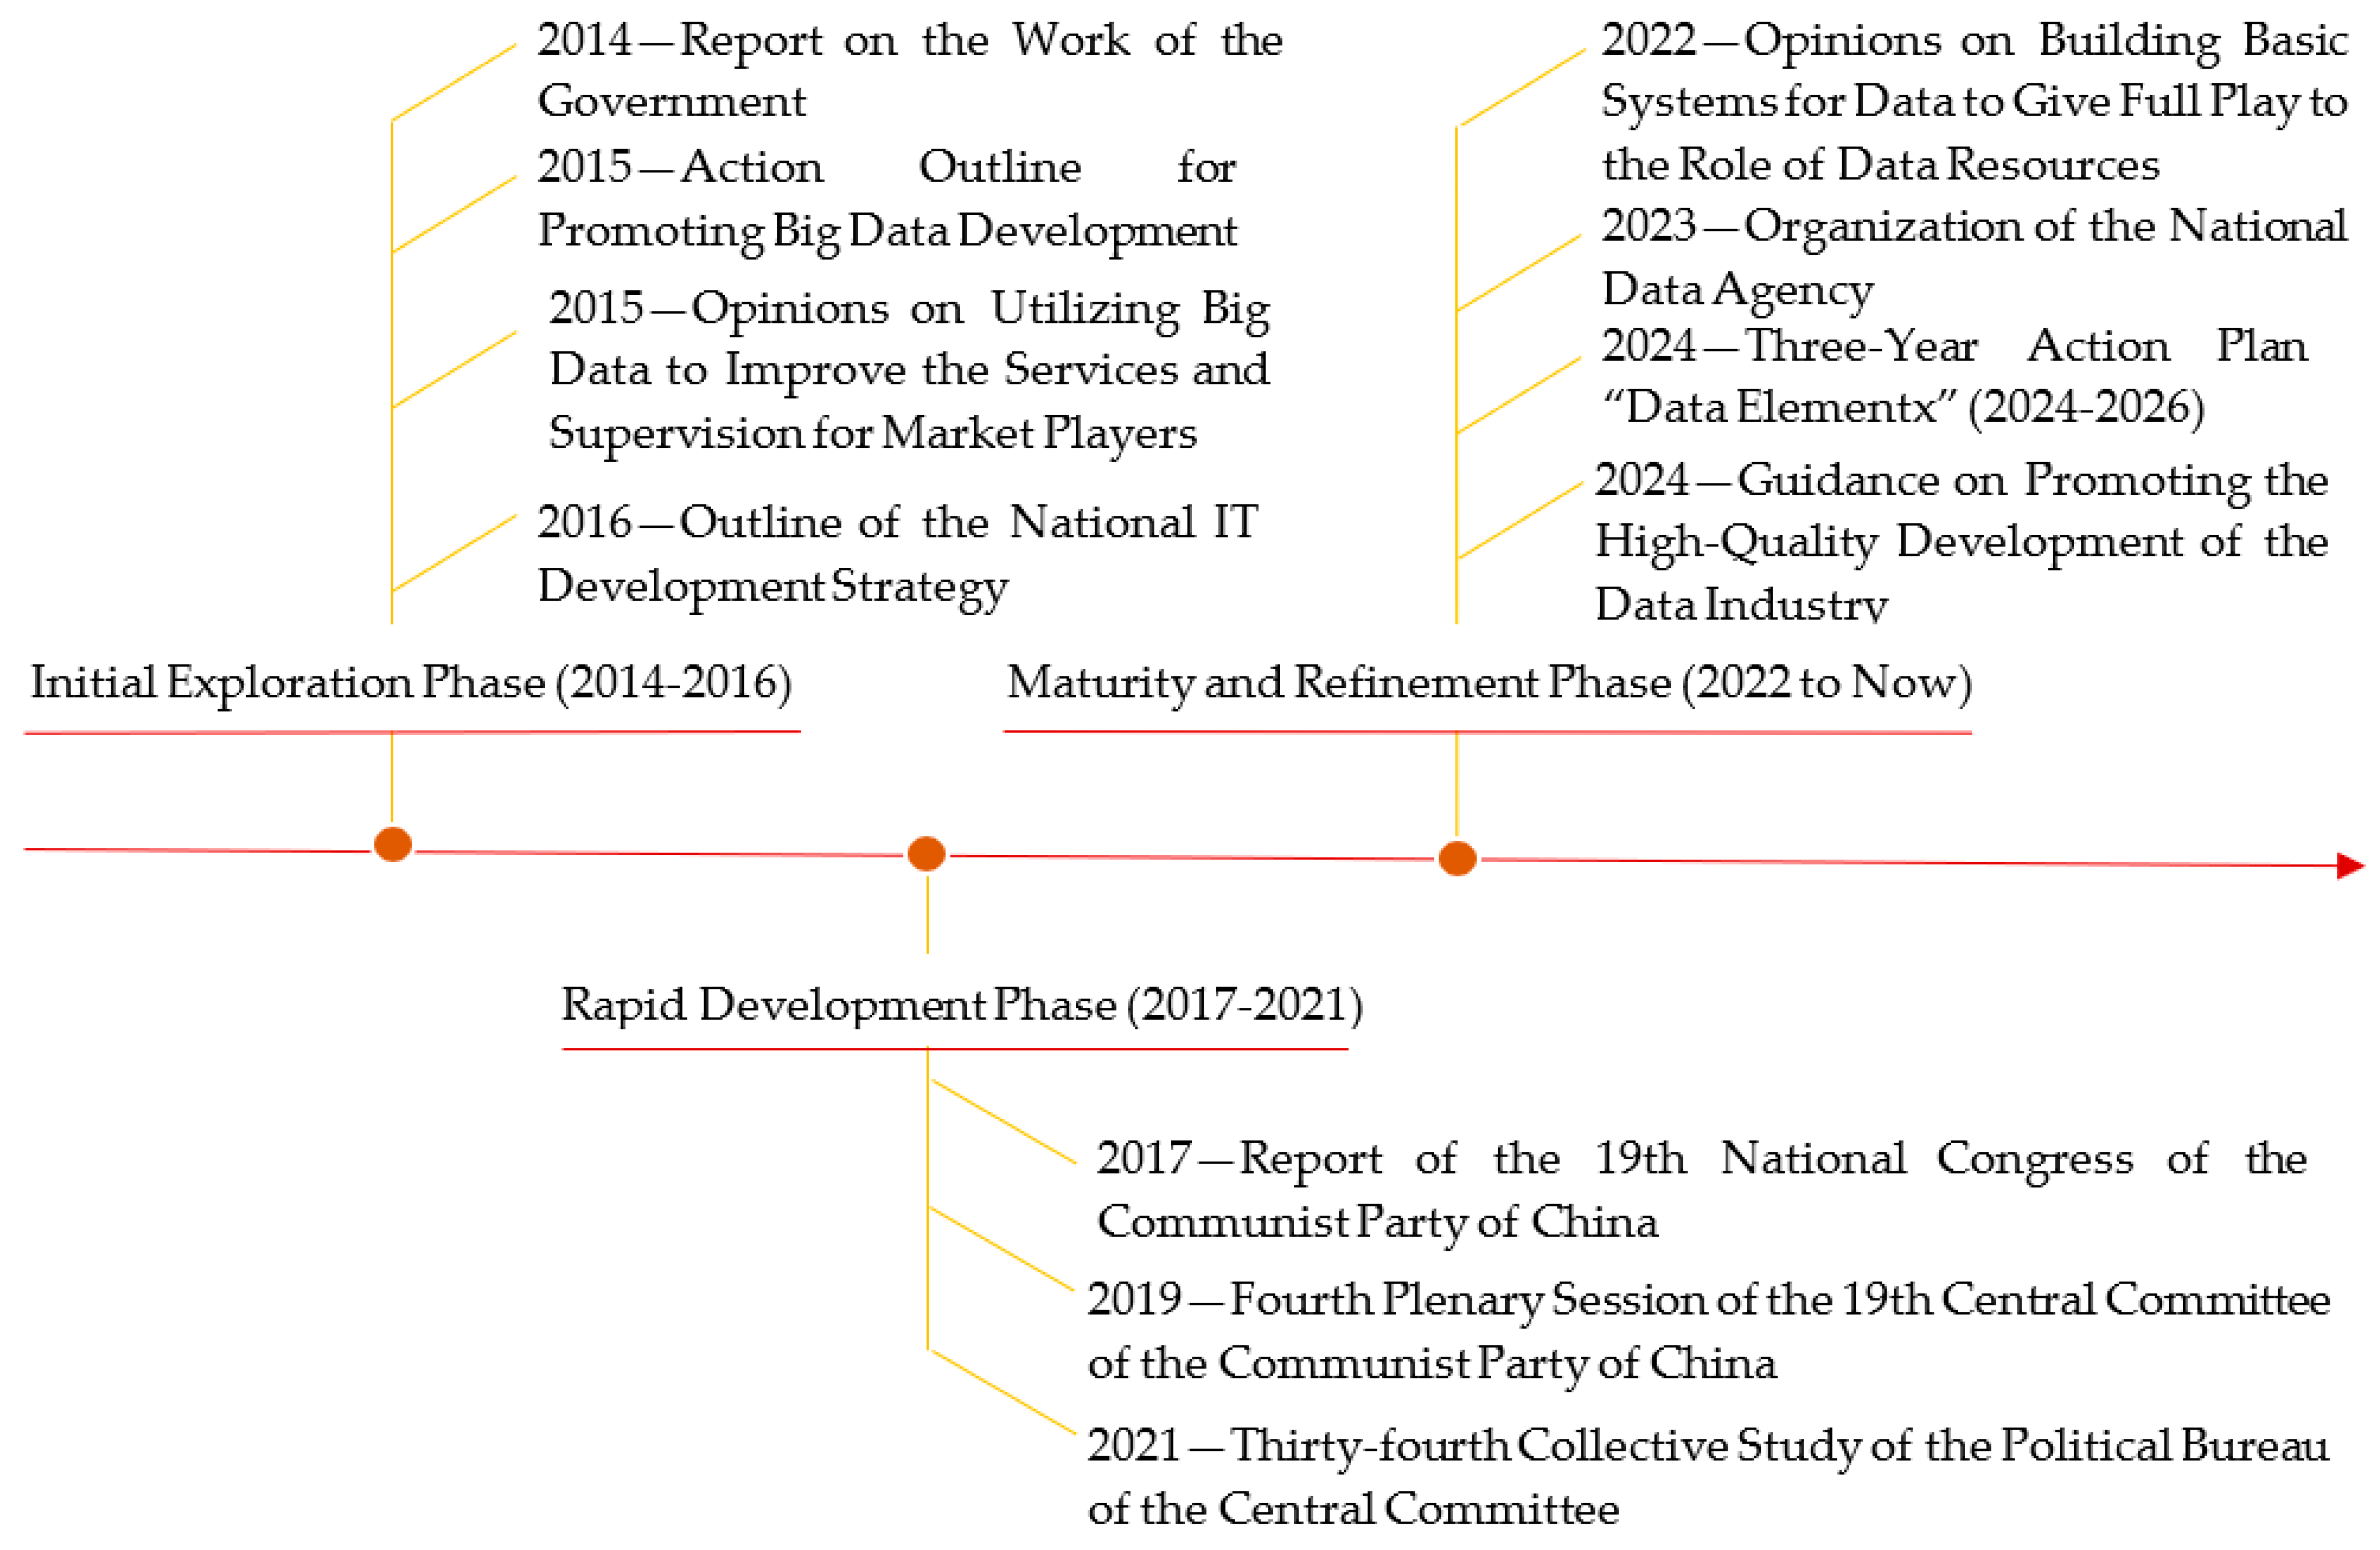
2.1. Background of the DEM Policy
2.2. Research Hypotheses
3. Models and Variables
3.1. Model
3.2. Variables
3.2.1. Dependent Variable
3.2.2. Independent Variable
3.2.3. Mechanism Variable
3.2.4. Control Variable
- (1)
- Financial development (FD): this is measured by the ratio of the year-end deposit and loan balances of financial institutions to the city’s gross regional product.
- (2)
- Openness (OPEN): the degree of openness is indicated by the ratio of the total value of imports and exports of goods to the city’s GDP.
- (3)
- Government intervention (GI): this is characterized by the proportion of local government expenditure from the general budget relative to regional GDP.
- (4)
- Industrialization (IND): the level of industrialization is measured by the ratio of the value added by the secondary industry to regional GDP.
- (5)
- Infrastructure (INF): the development of urban infrastructure is reflected by the logarithm of urban road area per capita.
- (6)
- Environmental regulation (ER): the intensity of urban environmental regulation is determined according to the logarithm of investment in environmental pollution control.
3.3. Data Sources
4. Empirical Results
4.1. Baseline Results
4.2. Robustness Test
4.2.1. Parallel Trend Test
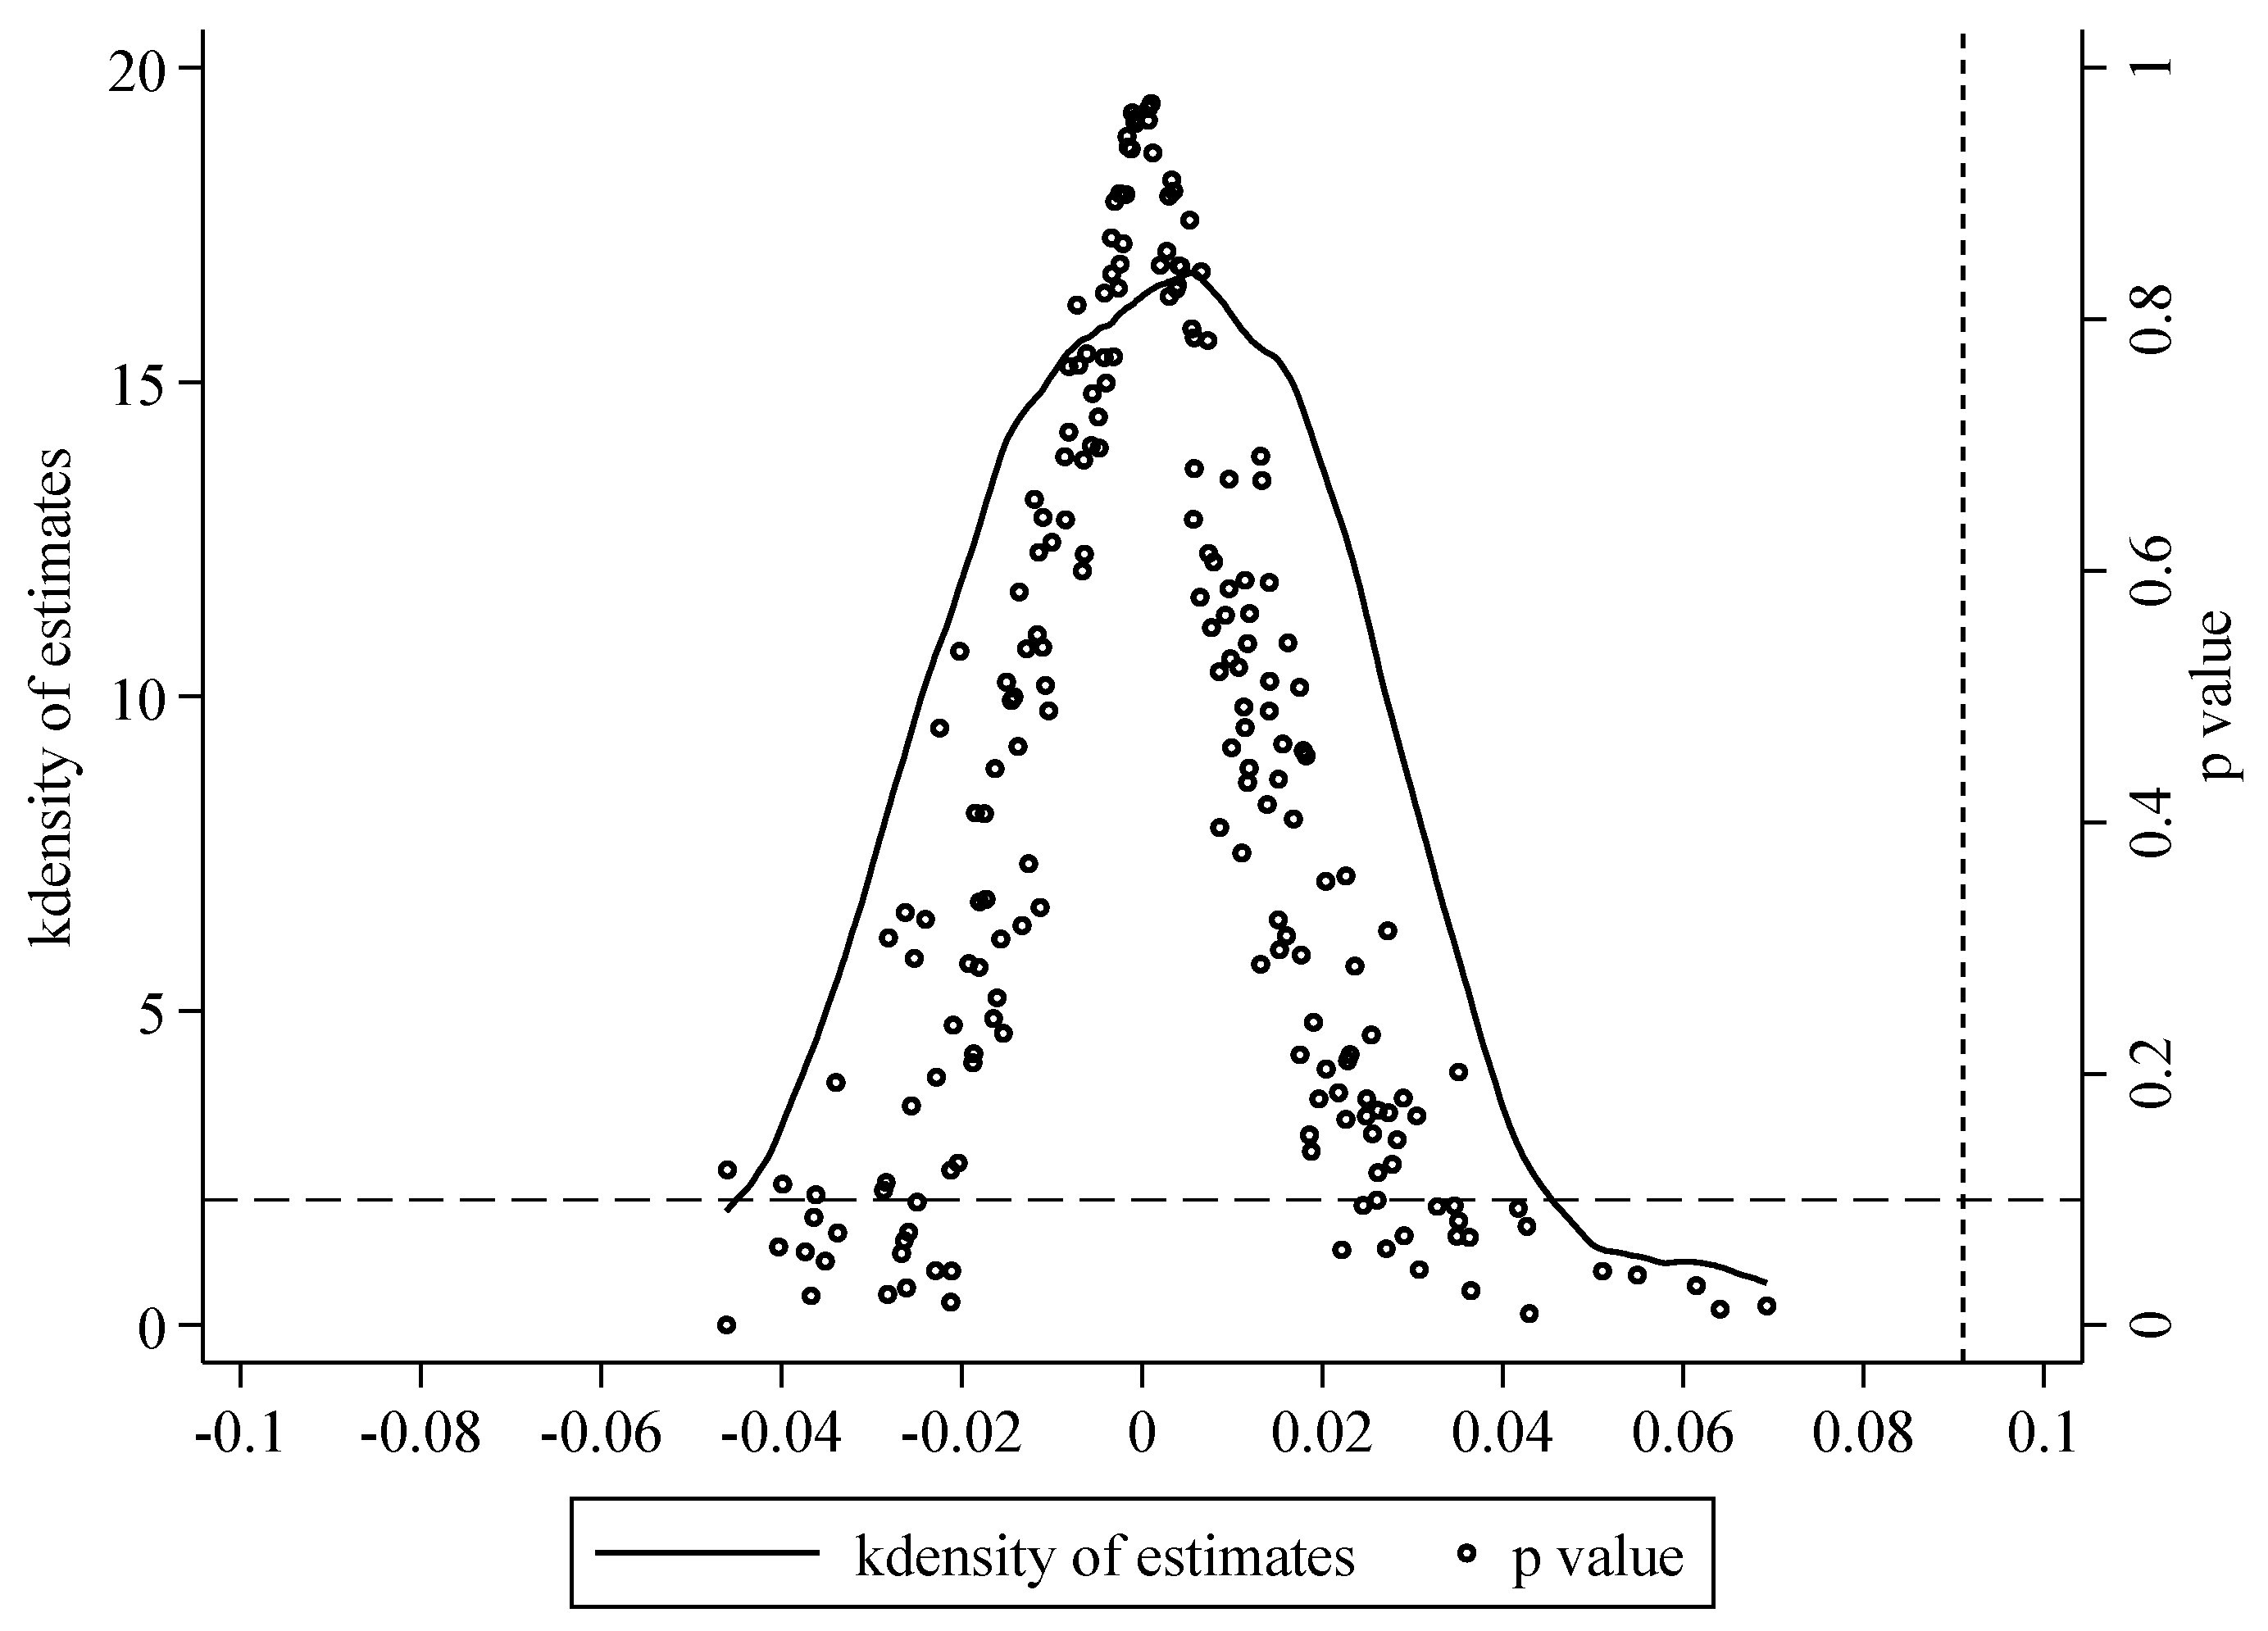
4.2.2. Placebo Test
4.2.3. Robustness and Endogeneity Tests
4.3. Heterogeneity Analysis
4.3.1. City Type Heterogeneity Tests
4.3.2. Urban Energy Intensity and New-Energy Pilot Heterogeneity Tests
4.3.3. Government Governance Capacity Heterogeneity Tests
5. Further Research
5.1. Mechanism Analysis
5.2. Spatial Effect
6. Research Summary and Outlook
6.1. Conclusions
6.2. Policy Recommendations
6.3. Research Outlook
Author Contributions
Funding
Institutional Review Board Statement
Informed Consent Statement
Data Availability Statement
Acknowledgments
Conflicts of Interest
References
- Guilhot, L. An Analysis of China’s Energy Policy from 1981 to 2020: Transitioning towards to a Diversified and Low-Carbon Energy System. Energy Policy 2022, 162, 112806. [Google Scholar] [CrossRef]
- National Bureau of Statistics of China. Statistical Communiqué of the People’s Republic of China on the 2024 National Economic and Social Development. Available online: https://www.stats.gov.cn/sj/zxfb/202502/t20250228_1958817.html (accessed on 28 February 2025).
- Shen, J.; Zhang, Y.; Chen, X. Environmental Regulation and Energy Consumption Transition of Rural Residents: A Case of China. Energy 2024, 310, 133195. [Google Scholar] [CrossRef]
- Yuan, K.; Zhang, T.; Xie, X.; Du, S.; Xue, X.; Abdul-Manan, A.F.; Huang, Z. Exploration of Low-Cost Green Transition Opportunities for China’s Power System under Dual Carbon Goals. J. Clean. Prod. 2023, 414, 137590. [Google Scholar] [CrossRef]
- Wang, J.; Liu, Y.; Wang, W.; Wu, H. How Does Digital Transformation Drive Green Total Factor Productivity? Evidence from Chinese Listed Enterprises. J. Clean. Prod. 2023, 406, 136954. [Google Scholar] [CrossRef]
- Wu, H.; Hao, Y.; Ren, S. How Do Environmental Regulation and Environmental Decentralization Affect Green Total Factor Energy Efficiency: Evidence from China. Energy Econ. 2020, 91, 104880. [Google Scholar] [CrossRef]
- Ma, X.; Sun, T. Does China’s Low-Carbon City Pilot Policy Effectively Enhance Urban Ecological Efficiency? Sustainability 2025, 17, 368. [Google Scholar] [CrossRef]
- Xue, Y. Evaluation Analysis on Industrial Green Total Factor Productivity and Energy Transition Policy in Resource-Based Region. Energy Environ. 2022, 33, 419–434. [Google Scholar] [CrossRef]
- Ren, Z.; Bo, Y.; Lei, Y. Green Financial Policy, Environmental Regulation, and Energy Use Efficiency. Financ. Res. Lett. 2025, 74, 106711. [Google Scholar] [CrossRef]
- Wang, Y.; Shi, M.; Zhao, Z.; Liu, J.; Zhang, S. How Does Green Finance Improve the Total Factor Energy Efficiency? Capturing the Mediating Role of Green Management Innovation and Embodied Technological Progress. Energy Econ. 2025, 142, 108157. [Google Scholar] [CrossRef]
- Radulescu, M.; Cifuentes-Faura, J.; Mohammed, K.S.; Alofaysan, H. Energy Efficiency and Environmental Regulations for Mitigating Carbon Emissions in Chinese Provinces. Energy Effic. 2024, 17, 67. [Google Scholar] [CrossRef]
- Li, H.; Du, X.; Yan, X.-W.; Xu, N. Digital Transformation and Urban Green Development: Evidence from China’s Data Factor Marketization. Sustainability 2024, 16, 4511. [Google Scholar] [CrossRef]
- Shen, N.; Zhou, J.; Zhang, G.; Wu, L.; Zhang, L. How Does Data Factor Marketization Influence Urban Carbon Emission Efficiency? A New Method Based on Double Machine Learning. Sustain. Cities Soc. 2025, 119, 106106. [Google Scholar] [CrossRef]
- Long, Y.; Liu, L.; Yang, B. The Effects of Enterprise Digital Transformation on Low-Carbon Urban Development: Empirical Evidence from China. Technol. Forecast. Soc. Change 2024, 201, 123259. [Google Scholar] [CrossRef]
- Fang, Y.; Wei, W.; Su, R. Data Element Investment Strategy: How Can Leaders and Followers Innovate in Dynamic Market Environments. PLoS ONE 2024, 19, e0309659. [Google Scholar] [CrossRef]
- Feng, Y.; Gao, Y.; Hu, S.; Sun, M.; Zhang, C. How Does Digitalization Affect the Green Transformation of Enterprises Registered in China’s Resource-Based Cities? Further Analysis on the Mechanism and Heterogeneity. J. Environ. Manag. 2024, 365, 121560. [Google Scholar] [CrossRef] [PubMed]
- Wu, H.; Hao, Y.; Ren, S.; Yang, X.; Xie, G. Does Internet Development Improve Green Total Factor Energy Efficiency? Evidence from China. Energy Policy 2021, 153, 112247. [Google Scholar] [CrossRef]
- Liu, X.; Liu, F.; Ren, X. Firms’ Digitalization in Manufacturing and the Structure and Direction of Green Innovation. J. Environ. Manag. 2023, 335, 117525. [Google Scholar] [CrossRef]
- Lan, H. The Role of Data Elements in Driving Socio-Economic Development. Inf. Syst. Econ. 2023, 4, 93–98. [Google Scholar] [CrossRef]
- Wang, Y.; Kang, X.; Chen, Z. A Survey of Digital Twin Techniques in Smart Manufacturing and Management of Energy Applications. Green Energy Intell. Transp. 2022, 1, 100014. [Google Scholar] [CrossRef]
- Golroudbary, S.R.; Makarava, I.; Kraslawski, A.; Repo, E. Global Environmental Cost of Using Rare Earth Elements in Green Energy Technologies. Sci. Total Environ. 2022, 832, 155022. [Google Scholar] [CrossRef]
- Tao, C.-Q.; Yi, M.-Y.; Wang, C.-S. Coupling Coordination Analysis and Spatiotemporal Heterogeneity between Data Elements and Green Development in China. Econ. Anal. Policy 2023, 77, 1–15. [Google Scholar] [CrossRef]
- Mishra, P.; Singh, G. Energy Management Systems in Sustainable Smart Cities Based on the Internet of Energy: A Technical Review. Energies 2023, 16, 6903. [Google Scholar] [CrossRef]
- Katal, A.; Dahiya, S.; Choudhury, T. Energy Efficiency in Cloud Computing Data Centers: A Survey on Software Technologies. Clust. Comput. 2023, 26, 1845–1875. [Google Scholar] [CrossRef] [PubMed]
- Wu, T.; Xu, W.; Kung, C.-C. The Impact of Data Elements on Urban Sustainable Development: Evidence from the Big Data Policy in China. Technol. Soc. 2025, 81, 102800. [Google Scholar] [CrossRef]
- Gao, D.; Li, G.; Yu, J. Does Digitization Improve Green Total Factor Energy Efficiency? Evidence from Chinese 213 Cities. Energy 2022, 247, 123395. [Google Scholar] [CrossRef]
- Wang, D.; Liao, H.; Liu, A.; Li, D. Natural Resource Saving Effects of Data Factor Marketization: Implications for Green Recovery. Resour. Policy 2023, 85, 104019. [Google Scholar] [CrossRef]
- Xiao, J.; Tan, Z.; Han, J. The Power of Big Data: The Impact of Urban Digital Transformation on Green Total Factor Productivity. Systems 2023, 12, 4. [Google Scholar] [CrossRef]
- Jia, X.; Lin, S. A Factor Market Distortion Research Based on Enterprise Innovation Efficiency of Economic Kinetic Energy Conversion. Sustain. Energy Technol. Assess. 2021, 44, 101021. [Google Scholar] [CrossRef]
- Zhao, Y.; Chen, X. The Relationship between the Withdrawal of the Digital Economy’s Innovators, Government Interventions, the Marketization Level and Market Size Based on Big Data. J. Enterp. Inf. Manag. 2022, 35, 1202–1232. [Google Scholar] [CrossRef]
- Huang, P.; Chen, X. The Impact of Data Factor-Driven Industry on the Green Total Factor Productivity: Evidence from the China. Sci. Rep. 2024, 14, 25377. [Google Scholar] [CrossRef]
- Wang, J.; Feng, L. Improving the Regional Science and Technology Innovation Ability under the Background of Data Element Marketization: Insights from the Yunnan Province. Sustainability 2024, 16, 7113. [Google Scholar] [CrossRef]
- Liu, B.; Wang, Y.; Jiang, N.; Zhang, X. The Impact of Digital Industrialization and Industrial Digitalization on Regional Green Innovation Efficiency in China -From the Perspective of the Innovation Value Chain. J. Clean. Prod. 2024, 478, 144015. [Google Scholar] [CrossRef]
- Cui, L.; Wang, Z.; Liu, Y.; Cao, G. How Does Data-Driven Supply Chain Analytics Capability Enhance Supply Chain Agility in the Digital Era? Int. J. Prod. Econ. 2024, 277, 109404. [Google Scholar] [CrossRef]
- Ma, S.; Ding, W.; Liu, Y.; Ren, S.; Yang, H. Digital Twin and Big Data-Driven Sustainable Smart Manufacturing Based on Information Management Systems for Energy-Intensive Industries. Appl. Energy 2022, 326, 119986. [Google Scholar] [CrossRef]
- Tupayachi, J.; Xu, H.; Omitaomu, O.A.; Camur, M.C.; Sharmin, A.; Li, X. Towards Next-Generation Urban Decision Support Systems through AI-Powered Construction of Scientific Ontology Using Large Language Models—A Case in Optimizing Intermodal Freight Transportation. Smart Cities 2024, 7, 2392–2421. [Google Scholar] [CrossRef]
- Marinakis, V. Big Data for Energy Management and Energy-Efficient Buildings. Energies 2020, 13, 1555. [Google Scholar] [CrossRef]
- Ahmad, T.; Madonski, R.; Zhang, D.; Huang, C.; Mujeeb, A. Data-Driven Probabilistic Machine Learning in Sustainable Smart Energy/Smart Energy Systems: Key Developments, Challenges, and Future Research Opportunities in the Context of Smart Grid Paradigm. Renew. Sustain. Energy Rev. 2022, 160, 112128. [Google Scholar] [CrossRef]
- Rojek, I.; Mikołajewski, D.; Mroziński, A.; Macko, M. Green Energy Management in Manufacturing Based on Demand Prediction by Artificial Intelligence—A Review. Electronics 2024, 13, 3338. [Google Scholar] [CrossRef]
- Ahmad, T.; Zhang, D.; Huang, C.; Zhang, H.; Dai, N.; Song, Y.; Chen, H. Artificial Intelligence in Sustainable Energy Industry: Status Quo, Challenges and Opportunities. J. Clean. Prod. 2021, 289, 125834. [Google Scholar] [CrossRef]
- Huang, C.; Lin, B. Digital Economy Solutions towards Carbon Neutrality: The Critical Role of Energy Efficiency and Energy Structure Transformation. Energy 2024, 306, 132524. [Google Scholar] [CrossRef]
- Cao, S.; Nie, L.; Sun, H.; Sun, W.; Taghizadeh-Hesary, F. Digital Finance, Green Technological Innovation and Energy-Environmental Performance: Evidence from China’s Regional Economies. J. Clean. Prod. 2021, 327, 129458. [Google Scholar] [CrossRef]
- Zeng, P.; Wang, Y.; Tian, Z. Regional Differences, Source Decomposition and Formation Mechanism of Urban Digital Economy and Energy Market Integration in China. J. Clean. Prod. 2024, 451, 141960. [Google Scholar] [CrossRef]
- Luo, K.; Lee, C.-C.; Zhuo, C. A Pathway to Coordinated Regional Development: Energy Utilization Efficiency and Green Development—Evidence from China’s Major National Strategic Zones. Energy Econ. 2024, 131, 107402. [Google Scholar] [CrossRef]
- Yang, Y.; Gu, R.; Ma, S.; Chen, W. How Does Digital Technology Empower Urban Green Development Efficiency in the Beijing-Tianjin-Hebei Region—Mechanism Analysis and Spatial Effects. Environ. Sci. Pollut. Res. 2022, 30, 31471–31488. [Google Scholar] [CrossRef] [PubMed]
- Tian, Z.; Hu, G.; Mu, X. Urban Green Total Factor Energy Efficiency and Its Decomposition under a Multidimensional Heterogeneity Framework: A Case Study of the Yellow River Basin, China. Environ. Sci. Pollut. Res. 2024, 31, 48999–49025. [Google Scholar] [CrossRef]
- Shao, J.; Wang, L. Can New-Type Urbanization Improve the Green Total Factor Energy Efficiency? Evidence from China. Energy 2023, 262, 125499. [Google Scholar] [CrossRef]
- Zhang, H.; Song, Y.; Zhang, M.; Duan, Y. Land Use Efficiency and Energy Transition in Chinese Cities: A Cluster-Frontier Super-Efficiency SBM-Based Analytical Approach. Energy 2024, 304, 132049. [Google Scholar] [CrossRef]
- Gu, J.; Zeng, S.; Chen, W.; Balezentis, T.; Sapolaite, V. Tracking Sustainable Development from the Dual Perspective of Environmental and Economic Performance: A Dynamic Framework and Coupling Coordination Degree. Sustain. Dev. 2024, 32, 2962–2975. [Google Scholar] [CrossRef]
- Wang, Q.; Ge, Y.; Li, R. Does Improving Economic Efficiency Reduce Ecological Footprint? The Role of Financial Development, Renewable Energy, and Industrialization. Energy Environ. 2025, 36, 729–755. [Google Scholar] [CrossRef]
- Yang, Y.; Liang, Q. Digital Economy, Environmental Regulation and Green Eco-Efficiency—Empirical Evidence from 285 Cities in China. Front. Environ. Sci. 2023, 11, 1113293. [Google Scholar] [CrossRef]
- Wang, X.; Zhong, M. Can Digital Economy Reduce Carbon Emission Intensity? Empirical Evidence from China’s Smart City Pilot Policies. Environ. Sci. Pollut. Res. 2023, 30, 51749–51769. [Google Scholar] [CrossRef]
- Li, Y.; Zhang, J. Research on the Carbon Emission Reduction Effect of the Dual Pilot Policy of Low-Carbon Cities and New Energy Demonstration Cities. Sustainability 2024, 16, 9572. [Google Scholar] [CrossRef]
- He, G.; Jiang, H.; Zhu, Y. The Effect of Digital Technology Development on the Improvement of Environmental Governance Capacity: A Case Study of China. Ecol. Indic. 2024, 165, 112162. [Google Scholar] [CrossRef]
- Bibri, S.E.; Krogstie, J. Environmentally Data-Driven Smart Sustainable Cities: Applied Innovative Solutions for Energy Efficiency, Pollution Reduction, and Urban Metabolism. Energy Inform. 2020, 3, 29. [Google Scholar] [CrossRef]
- Khunakornbodintr, S. Examining the Impact of Green Technological Specialization and the Integration of AI Technologies on Green Innovation Performance: Evidence from China. Front. Artif. Intell. 2024, 6, 1237285. [Google Scholar] [CrossRef]
- Shirazi, F.; Hajli, N. IT-Enabled Sustainable Innovation and the Global Digital Divides. Sustainability 2021, 13, 9711. [Google Scholar] [CrossRef]
- Dong, L.; Zhu, X.; Yang, L.; Jiang, G. Unleashing the Power of Data Element Markets: Driving Urban Green Growth through Marketization, Innovation, and Digital Finance. Int. Rev. Econ. Financ. 2025, 99, 104070. [Google Scholar] [CrossRef]
- Yu, Z.; Liu, S.; Zhu, Z. Has the Digital Economy Reduced Carbon Emissions?: Analysis Based on Panel Data of 278 Cities in China. Int. J. Environ. Res. Public Health 2022, 19, 11814. [Google Scholar] [CrossRef]
- Zhong, C.; Zhang, C. Can Data Elements Enhance Urban Innovation? Evidence from China. China Econ. Rev. 2024, 88, 102307. [Google Scholar] [CrossRef]
- Zhou, W.; Zhuang, Y.; Chen, Y. How Does Artificial Intelligence Affect Pollutant Emissions by Improving Energy Efficiency and Developing Green Technology. Energy Econ. 2024, 131, 107355. [Google Scholar] [CrossRef]
- Jiao, Z.; Xia, Z. Is the Digital Divide Inhibiting Urban Energy Transitions?—Evidence from China. Energies 2025, 18, 905. [Google Scholar] [CrossRef]


| Year | Energy Consumption Total (10,000 Tons of SCE) | Proportion of Coal in Total Energy Consumption (%) | Proportion of Petroleum in Total Energy Consumption (%) | Proportion of Natural Gas in Total Energy Consumption (%) |
|---|---|---|---|---|
| 2009 | 336,126 | 71.6 | 16.4 | 3.5 |
| 2010 | 360,648 | 69.2 | 17.4 | 4 |
| 2011 | 387,043 | 70.2 | 16.8 | 4.6 |
| 2012 | 402,138 | 68.5 | 17 | 4.8 |
| 2013 | 416,913 | 67.4 | 17.1 | 5.3 |
| 2014 | 428,334 | 65.8 | 17.3 | 5.6 |
| 2015 | 434,113 | 63.8 | 18.4 | 5.8 |
| 2016 | 441,492 | 62.2 | 18.7 | 6.1 |
| 2017 | 455,827 | 60.6 | 18.9 | 6.9 |
| 2018 | 471,925 | 59 | 18.9 | 7.6 |
| 2019 | 487,488 | 57.7 | 19 | 8 |
| 2020 | 498,314 | 56.9 | 18.8 | 8.4 |
| 2021 | 525,896 | 55.9 | 18.6 | 8.8 |
| 2022 | 540,956 | 56 | 18 | 8.4 |
| 2023 | 572,000 | 55.3 | 18.3 | 8.5 |
| 2024 | 596,000 | 53.2 | 17.4 | 8.8 |
| Type of Indicator | Indicators | Measurement Indicators | Unit |
|---|---|---|---|
| Input | Labor | Number of employees in the unit at the end of the year | Ten thousand people |
| Capital | Fixed capital stock | Ten thousand dollars | |
| Energy | Total energy consumption | Billion tons of standard coal | |
| Land | Built-up area | Square kilometers | |
| Desired output | Economic benefits | Real GDP (real GDP at constant 2008 prices) | Ten thousand dollars |
| Ecological benefits | Green area of parks | Hectares | |
| Undesired output | Environmental pollution | Composite index of industrial wastewater emissions, sulfur dioxide emissions, and dust and fume emissions | - |
| Carbon emission | Carbon dioxide emissions | Ten thousand tons |
| City | Year Established | City | Year Established |
|---|---|---|---|
| Beijing | 2014 | Urumqi | 2016 |
| Guiyang | 2015 | Qingdao | 2017 |
| Hangzhou | 2015 | Xinxiang | 2017 |
| Shenzhen | 2015 | Zhengzhou | 2017 |
| Shijiazhuang | 2015 | Changchun | 2018 |
| Wuhan | 2015 | Hefei | 2020 |
| Xianyang | 2015 | Jinan | 2020 |
| Yancheng | 2015 | Nanning | 2020 |
| Chongqing | 2015 | Taiyuan | 2020 |
| Guangzhou | 2016 | Deyang | 2021 |
| Harbin | 2016 | Foshan | 2021 |
| Lanzhou | 2016 | Haikou | 2021 |
| Shanghai | 2016 | Suzhou | 2021 |
| Indicators | Type of Indicator | Measurement Indicators | Unit |
|---|---|---|---|
| Data Elements | Data element generation and access | Internet users per 100 population | Households/ 100 persons |
| Cell phone subscribers per 100 population | Households/100 persons | ||
| Total telecommunication services per capita | Ten thousand Chinese yuan/person | ||
| Data element processing and sharing | Percentage of employees in computer services and software | % | |
| Telecommunications revenue per capita | Ten thousand Chinese yuan/person | ||
| Data element applications and benefits | Level of utilization of data elements | - | |
| Digital Inclusive Finance Index | - | ||
| AI | Technology foundation and support | Robot mounting density | Unit |
| Technology practice and application | Number of AI companies | Pieces |
| Variable | Obs | Mean | Std. Dev. | Min | Max |
|---|---|---|---|---|---|
| GTFEE | 3575 | 0.228 | 0.179 | 0.014 | 1.311 |
| DEM | 3575 | 0.035 | 0.184 | 0.000 | 1.000 |
| FD | 3575 | 1.010 | 0.622 | 0.120 | 9.556 |
| OPEN | 3575 | 0.226 | 0.414 | 0.000 | 5.075 |
| GI | 3575 | 0.198 | 0.106 | 0.044 | 1.485 |
| IND | 3575 | 0.459 | 0.112 | 0.000 | 1.256 |
| INF | 3575 | 2.772 | 0.440 | 0.315 | 4.096 |
| ER | 3575 | 5.477 | 0.954 | 1.932 | 9.793 |
| Data Elements | 3575 | 0.145 | 0.062 | 0.014 | 0.554 |
| Integration of Data Elements and AI | 3575 | 0.152 | 0.072 | 0.026 | 0.608 |
| Variable | GTFEE | GTFEE | L. GTFEE | L2. GTFEE | L3. GTFEE |
|---|---|---|---|---|---|
| (1) | (2) | (3) | (4) | (5) | |
| DEM | 0.107 *** | 0.091 *** | 0.090 *** | 0.085 *** | 0.064 *** |
| (6.36) | (5.43) | (5.59) | (5.59) | (5.41) | |
| FD | 0.036 *** | 0.031 *** | 0.011 | 0.006 | |
| (3.10) | (2.99) | (1.19) | (0.78) | ||
| OPEN | −0.015 | −0.004 | 0.008 | 0.028 | |
| (−1.43) | (−0.24) | (0.33) | (1.03) | ||
| GI | −0.193 *** | −0.158 *** | −0.025 | 0.055 | |
| (−3.95) | (−3.07) | (−0.37) | (0.90) | ||
| IND | 0.168 ** | 0.060 | −0.000 | −0.114 ** | |
| (2.32) | (0.87) | (−0.00) | (−2.12) | ||
| INF | −0.015 | −0.023 ** | −0.020 * | −0.013 | |
| (−1.53) | (−2.41) | (−1.85) | (−1.36) | ||
| ER | −0.008 | −0.006 | 0.012 * | 0.004 | |
| (−1.35) | (−0.92) | (1.81) | (0.71) | ||
| City FE | YES | YES | YES | YES | YES |
| Year FE | YES | YES | YES | YES | YES |
| N | 3575 | 3575 | 3300 | 3025 | 2750 |
| R2 | 0.652 | 0.659 | 0.665 | 0.688 | 0.713 |
| Variable | GTFEE | GTFEE | GTFEE |
|---|---|---|---|
| (1) | (2) | (3) | |
| DEM | 0.211 ** | 0.091 *** | 0.091 *** |
| (2.45) | (5.43) | (5.28) | |
| IV | |||
| Controls | YES | YES | YES |
| City FE | YES | YES | YES |
| Year FE | YES | YES | YES |
| N | 180 | 3575 | 3575 |
| R2 | 0.918 | 0.664 | 0.660 |
| Variable | DEM | GTFEE | GTFEE | GTFEE |
|---|---|---|---|---|
| (1) | (2) | (3) | (4) | |
| DEM | 0.075 *** | 0.081 *** | 0.114 *** | |
| (4.04) | (4.32) | (3.58) | ||
| IV | 0.013 *** | |||
| (43.37) | ||||
| Controls | YES | YES | YES | YES |
| City FE | YES | YES | YES | YES |
| Year FE | YES | YES | YES | YES |
| N | 2532 | 2532 | 3025 | 3575 |
| R2 | 0.707 | 0.679 | ||
| Cragg–Donald Wald F statistic | 1880.545 | |||
| Anderson canon. corr. LM statistic | 1138.159 | |||
| Variable | Diversified-Industry Cities | Resource Cities |
|---|---|---|
| (1) | (2) | |
| DEM | 0.101 *** | −0.094 *** |
| (5.78) | (−4.99) | |
| Controls | YES | YES |
| City FE | YES | YES |
| Year FE | YES | YES |
| N | 2171 | 1404 |
| R2 | 0.647 | 0.674 |
| Variable | Low-Energy-Intensity Cities | High-Energy-Intensity Cities | Non-New-Energy Pilot Cities | New-Energy Pilot Cities |
|---|---|---|---|---|
| (1) | (2) | (3) | (4) | |
| DEM | 0.170 *** | 0.044 *** | 0.085 *** | 0.138 ** |
| (4.62) | (3.34) | (4.58) | (2.46) | |
| Controls | YES | YES | YES | YES |
| City FE | YES | YES | YES | YES |
| Year FE | YES | YES | YES | YES |
| N | 1768 | 1807 | 3087 | 488 |
| R2 | 0.587 | 0.760 | 0.646 | 0.779 |
| Variable | Low GDG | High GDG | Low GEEG | High GEEG |
|---|---|---|---|---|
| (1) | (2) | (3) | (4) | |
| DEM | 0.009 | 0.117 *** | 0.155 *** | 0.033 * |
| (0.30) | (5.94) | (5.86) | (1.84) | |
| Controls | YES | YES | YES | YES |
| City FE | YES | YES | YES | YES |
| Year FE | YES | YES | YES | YES |
| N | 1677 | 1898 | 1768 | 1807 |
| R2 | 0.621 | 0.679 | 0.732 | 0.559 |
| Variable | Data Elements | Integration of Data Elements and AI |
|---|---|---|
| (1) | (2) | |
| DEM | 0.105 *** | 0.073 *** |
| (7.95) | (6.00) | |
| Controls | YES | YES |
| City FE | YES | YES |
| Year FE | YES | YES |
| N | 3575 | 3575 |
| R2 | 0.890 | 0.941 |
| Year | Moran’s I | Z-Value | p-Value | Year | Moran’s I | Z-Value | p-Value |
|---|---|---|---|---|---|---|---|
| 2009 | 0.030 *** | 6.379 | 0.000 | 2016 | 0.025 *** | 5.194 | 0.000 |
| 2010 | 0.030 *** | 6.314 | 0.000 | 2017 | 0.035 *** | 7.143 | 0.000 |
| 2011 | 0.037 *** | 7.488 | 0.000 | 2018 | 0.013 *** | 3.017 | 0.001 |
| 2012 | 0.031 *** | 6.419 | 0.000 | 2019 | 0.018 *** | 3.896 | 0.000 |
| 2013 | 0.026 *** | 5.505 | 0.000 | 2020 | 0.030 *** | 6.223 | 0.000 |
| 2014 | 0.013 *** | 3.070 | 0.001 | 2021 | 0.030 *** | 6.177 | 0.000 |
| 2015 | 0.021 *** | 4.473 | 0.000 |
| Variable | Geographic Distance Matrix | Economic Distance Matrix | ||||||
|---|---|---|---|---|---|---|---|---|
| GTFEE | Direct | Indirect | Total | GTFEE | Direct | Indirect | Total | |
| (1) | (2) | (3) | (4) | (5) | (6) | (7) | (8) | |
| DEM | 0.094 *** | 0.090 *** | −1.135 * | −1.045 | 0.100 *** | 0.098 *** | −0.097 ** | 0.001 |
| (6.93) | (6.25) | (−1.67) | (−1.53) | (7.18) | (6.85) | (−2.07) | (0.02) | |
| W * DEM | −0.375 ** | −0.103 *** | ||||||
| (−2.29) | (−2.82) | |||||||
| ρ | 0.741 *** | 0.243 *** | ||||||
| (15.55) | (7.76) | |||||||
| Controls | YES | YES | YES | YES | YES | YES | YES | YES |
| City FE | YES | YES | YES | YES | YES | YES | YES | YES |
| Year FE | YES | YES | YES | YES | YES | YES | YES | YES |
| N | 3575 | 3575 | 3575 | 3575 | 3575 | 3575 | 3575 | 3575 |
| R2 | 0.137 | 0.137 | 0.137 | 0.137 | 0.102 | 0.102 | 0.102 | 0.102 |
Disclaimer/Publisher’s Note: The statements, opinions and data contained in all publications are solely those of the individual author(s) and contributor(s) and not of MDPI and/or the editor(s). MDPI and/or the editor(s) disclaim responsibility for any injury to people or property resulting from any ideas, methods, instructions or products referred to in the content. |
© 2025 by the authors. Licensee MDPI, Basel, Switzerland. This article is an open access article distributed under the terms and conditions of the Creative Commons Attribution (CC BY) license (https://creativecommons.org/licenses/by/4.0/).
Share and Cite
Peng, Y.; Wang, X.; Gao, W. The Impact of Data Element Marketization on Green Total Factor Energy Efficiency: Empirical Evidence from China. Sustainability 2025, 17, 4099. https://doi.org/10.3390/su17094099
Peng Y, Wang X, Gao W. The Impact of Data Element Marketization on Green Total Factor Energy Efficiency: Empirical Evidence from China. Sustainability. 2025; 17(9):4099. https://doi.org/10.3390/su17094099
Chicago/Turabian StylePeng, Ying, Xinyue Wang, and Weilong Gao. 2025. "The Impact of Data Element Marketization on Green Total Factor Energy Efficiency: Empirical Evidence from China" Sustainability 17, no. 9: 4099. https://doi.org/10.3390/su17094099
APA StylePeng, Y., Wang, X., & Gao, W. (2025). The Impact of Data Element Marketization on Green Total Factor Energy Efficiency: Empirical Evidence from China. Sustainability, 17(9), 4099. https://doi.org/10.3390/su17094099