Article

Research on the Coordinated Development Path of Rural Energy Supply and Demand Under the Context of Rural Revitalization Based on the Asia-Pacific Integrated Model

1
Planning & Research Center for Power Grid, Yunnan Power Grid Corp., Kunming 650011, China
2
Guangzhou Institute of Energy Conversion, Chinese Academy of Sciences, Guangzhou 510640, China
3
Energy Development Research Institute, China Southern Power Grid, Guangzhou 510663, China
*
Authors to whom correspondence should be addressed.
Sustainability 2025, 17(9), 4055; https://doi.org/10.3390/su17094055
Submission received: 19 March 2025 / Revised: 23 April 2025 / Accepted: 28 April 2025 / Published: 30 April 2025

Abstract

:
The rural revitalization strategy serves as a powerful engine, driving the coordinated development of urban and rural areas while propelling the modernization and increasing the quality of China’s construction. Based on the Asia-Pacific Integrated Model (AIM/Enduse model), this study constructed a Rural Areas in Guangdong model (RG-Enduse model) applicable to rural areas in Guangdong Province, China. The model includes 18 types of terminal technological equipment which are subdivided into 5 types of service needs for rural residents on the demand side. Through a supply-side analysis, this study explores the coordinated development paths of energy supply and demand in rural areas under the rural revitalization strategy across three distinct scenarios. The results show that energy consumption in the baseline (BL) scenario and the low-carbon (CM1) scenario will both peak in 2025 at 17.46 million tce and 14.35 million tce, respectively, and also show a continuous downward trend in the green low-carbon (CM2) scenario, falling to 9.77 million tce by 2060. Electricity will be the dominant energy resource in the carbon neutral path to 2060, with CM2 and CM2, accounting for 78.78% and 80.61% of green electricity consumption, respectively. In addition, the utilization of carbon capture, utilization, and storage (CCUS) for thermal power will be indispensable to ensure the stability of the green power supply.

1. Introduction

China’s rural population is vast, accounting for 34.78% of the national total, reaching 490 million in 2022. The integration of rural revitalization with the “dual carbon” goals is significant for China’s modernization [1]. Rural areas are comprehensive regional entities with natural, social, and economic characteristics, serving multiple functions such as production, living, and ecology. They interact with urban areas in a mutually reinforcing and coexisting manner, collectively forming the primary space for residents’ activities. Although rural energy consumption in China accounts for only 15% of the national total, it amounts to 230 million tce, making it a crucial component of China’s energy system [2,3]. Implementing the rural revitalization strategy is a necessary requirement for achieving the Chinese Dream, with substantial practical and historical significance [4,5].
Renewable energy in rural China is abundant and has significant potential for development and utilization. Although some regions have utilized renewable energy sources like wind and solar power, development and utilization rates remain low due to technical and financial constraints. Rural renewable energy is crucial for China’s “dual carbon” goals and plays a significant role in building a rural ecological civilization and promoting rural revitalization. The rural revitalization strategy was first proposed in the report of 19th National Congress of the Communist Party of China in 2017, which emphasized prioritizing agricultural and rural development in the new development stage [6]. The “Rural Revitalization Promotion Law of the People’s Republic of China” officially implemented in 2021 provides a legal basis for promoting rural revitalization. By 2024, the “Thousand Villages Demonstration, Ten Thousand Villages Renovation” project proposed by the Chinese government is expected to be a powerful experience to effectively advance comprehensive rural revitalization, accelerate agricultural and rural modernization to better promote Chinese-style modernization. The promulgation of these policies represents China’s determination to promote rural modernization and make full use of the potential of green and low-carbon development in rural areas. As a major energy-consuming province in China, rural areas in Guangdong have significant levels of energy consumption and carbon emissions, with both showing an upward trend from 2010 to 2020 and rural buildings accounting for 61.3% of energy consumption. As a frontier of China’s reform and opening-up, Guangdong Province has proposed the “High-Quality Development Project for One Hundred Counties, One Thousand Towns, and Ten Thousand Villages”, aiming to overcome the imbalance in urban–rural regional development and promote coordinated development between urban and rural areas and the modernization of agriculture and rural areas. However, rural renewable energy utilization in Guangdong is low, with abundant biomass resources underutilized or wasted. Much of the crop straw is still used for direct combustion, and there is a large amount of waste biomass resources that have not been fully utilized. This unclean energy consumption pattern poses challenges for Guangdong to achieve high-quality green and low-carbon development.
In recent years, researchers have conducted in-depth research on rural energy issues from various perspectives and achieved certain results. The energy consumption growth and carbon emission reduction potential of rural areas have gradually attracted the attention of researchers. Yao [7] focused on household energy consumption in rural China and its impact on climate change, finding that although the total rural household energy consumption has grown slowly, per capita CO2 emissions have increased significantly, primarily driven by rising farmer incomes and strong rural energy policies. Zhang [8] analyzed the contribution of rural energy consumption to China’s carbon emissions and explored its potential in climate change and carbon reduction. Coal and electricity are the primary sources of carbon emissions, with rural carbon emissions showing an inverted U-shaped trend in their contribution to China’s total emissions. Zhang [9] developed a Rural Energy Sustainability Development Index (RESDI) using an improved group principal component analysis (GPCA) method to assess the status and progress of sustainable development of rural household energy in China. This revealed three stages of sustainable development in rural household energy, indicating a gradual improvement in sustainability. L.X. Zhang [10] used lifecycle assessment methods to systematically account for both direct and indirect carbon emissions from rural energy consumption, highlighting the significant contribution of rural energy consumption to China’s total carbon emissions. The above research indicates that the increase in energy consumption demand in China’s rural areas cannot be ignored and has certain emission reduction potential.
Some researchers analyze the main driving factors that promote the growth of energy consumption in rural areas, aiming to explore the main directions of energy conservation and carbon reduction in rural areas. Based on a comprehensive survey of 1450 households in 26 provinces in China, Zheng [11] provided the first comprehensive overview of household energy consumption in China. The study revealed characteristics and potential drivers of household energy consumption in China and highlighted the significant gap between urban and rural areas in terms of energy sources and end-use activities. By developing a series of regression models, Han Chen [12] simulated the monthly variations in electricity and fuel consumption in the global residential sector and predicted the resulting air pollutant emissions. The study found that climate warming leads to a net increase in residential electricity consumption while reducing fuel consumption. In addition, regional climate characteristics also cause differences in energy consumption requirements, such as heating and cooling. Wang Shanshan [13] conducted a study on the demand and utilization patterns of domestic hot water in China, combining survey interviews and engineering test results. The study found that the demand for domestic hot water is below or close to the lower limits in various standards, and there are substantial differences in water use across different climatic regions. Zhang Nannan [14] studied the spatiotemporal evolution and driving factors of agricultural carbon emissions in county-level areas of Guangdong Province from 2000 to 2022. Based on machine learning methods, it was found that agricultural carbon emissions in Guangdong showed an overall fluctuating downward trend, with obvious spatial heterogeneity and agglomeration characteristics.
Further, some researchers evaluate the energy-saving and carbon reduction effects of clean fuel substitution and energy-saving facilities in rural areas. Yilin Chen [15] quantified the transformation of household cooking fuels using household tracking survey data, revealing that while the transformation leads to a slight increase in carbon emissions, emissions of other pollutants are significantly reduced. Zhou, M. [16] evaluated the environmental benefits and household costs of clean heating options in northern China, and analyzed the impact of different heating technologies on air quality, health, carbon emissions, and household costs. Shen, G. [17] revealed the current situation and changing trends of energy use in rural households in China through a nationwide survey. The proportion of clean cooking energy usage is increasing, but traditional solid fuels still dominate in heating. The research by Lu, C. [18] focuses on gas emissions and health benefits in household energy use. Hu Xudong [19] used data from five provinces and regions under the jurisdiction of Southern Power Grid from 2011 to 2020 to evaluate the trend of electricity carbon emissions using the STIRPAT model. These studies provide good guidance and suggestions for specific low-carbon development measures in rural areas.
Previous research focused on the carbon reduction potential and driving factors of household energy consumption in rural China, with a generally macro perspective. While some studies explore the carbon emissions associated with hot water and cooking demands, they lack a systematic examination of all the needs covered by rural residents’ daily lives and lack detailed research on the various technological devices used by rural residents. At the same time, the complementary development of the energy system is often ignored. Based on the above issues, this study builds a comprehensive evaluation model for rural energy consumption and carbon emission prediction based on Asia-Pacific Integrated Model (AIM/Enduse model), which focuses on the demand for various technical equipment and services. Taking Guangdong Province as a study case, different scenarios are set for the services need and terminal technological equipment to optimize and evaluate the development model with the greatest future emission reduction potential. Further, the power consumption module is coupled with the power supply module to evaluate the matching relationship between rural renewable energy power supply and energy demand, aiming to explore the development path of the power system to meet the low-carbon development of rural areas under different policy and technology development scenarios, and the demand for renewable energy for rural carbon green development is assessed. Through the above methods, the carbon neutral development path of rural areas is discussed from the perspective of supply integration. This study offers a new perspective on the interplay between supply and demand to address energy consumption and carbon emissions in rural areas, providing scientific support for high-quality, low-carbon development paths and proposing relevant policy recommendations for rural Guangdong.
The subsequent sections of this paper are as follows: Section 2 introduces the Rural Areas in Guangdong model (RG-Enduse model), including demand forecasting, model objective functions, and constraints; Section 3 provides a detailed description of the model parameters, including energy consumption in rural areas, energy technology parameters, service demands, and energy prices, as well as different scenarios for energy transition development; Section 4 presents a comparative analysis of the optimization results for each scenario; and finally, Section 5 offers the conclusions.

2. Methods

The AIM/Enduse model is a bottom-up model that provides a detailed technological choice framework within a country’s or region’s energy–economic–environmental system [20,21]. It selects a combination of technologies that minimizes system costs while satisfying service demands, carbon emission constraints, and other system constraints within a linear optimization framework to meet the energy needs of the target year. Total costs include fixed costs, technology operation costs, energy costs, and taxes, among others. The AIM/Enduse model is also a recursive dynamic model, capable of performing multiple scenario and multi-year calculations simultaneously [22,23].

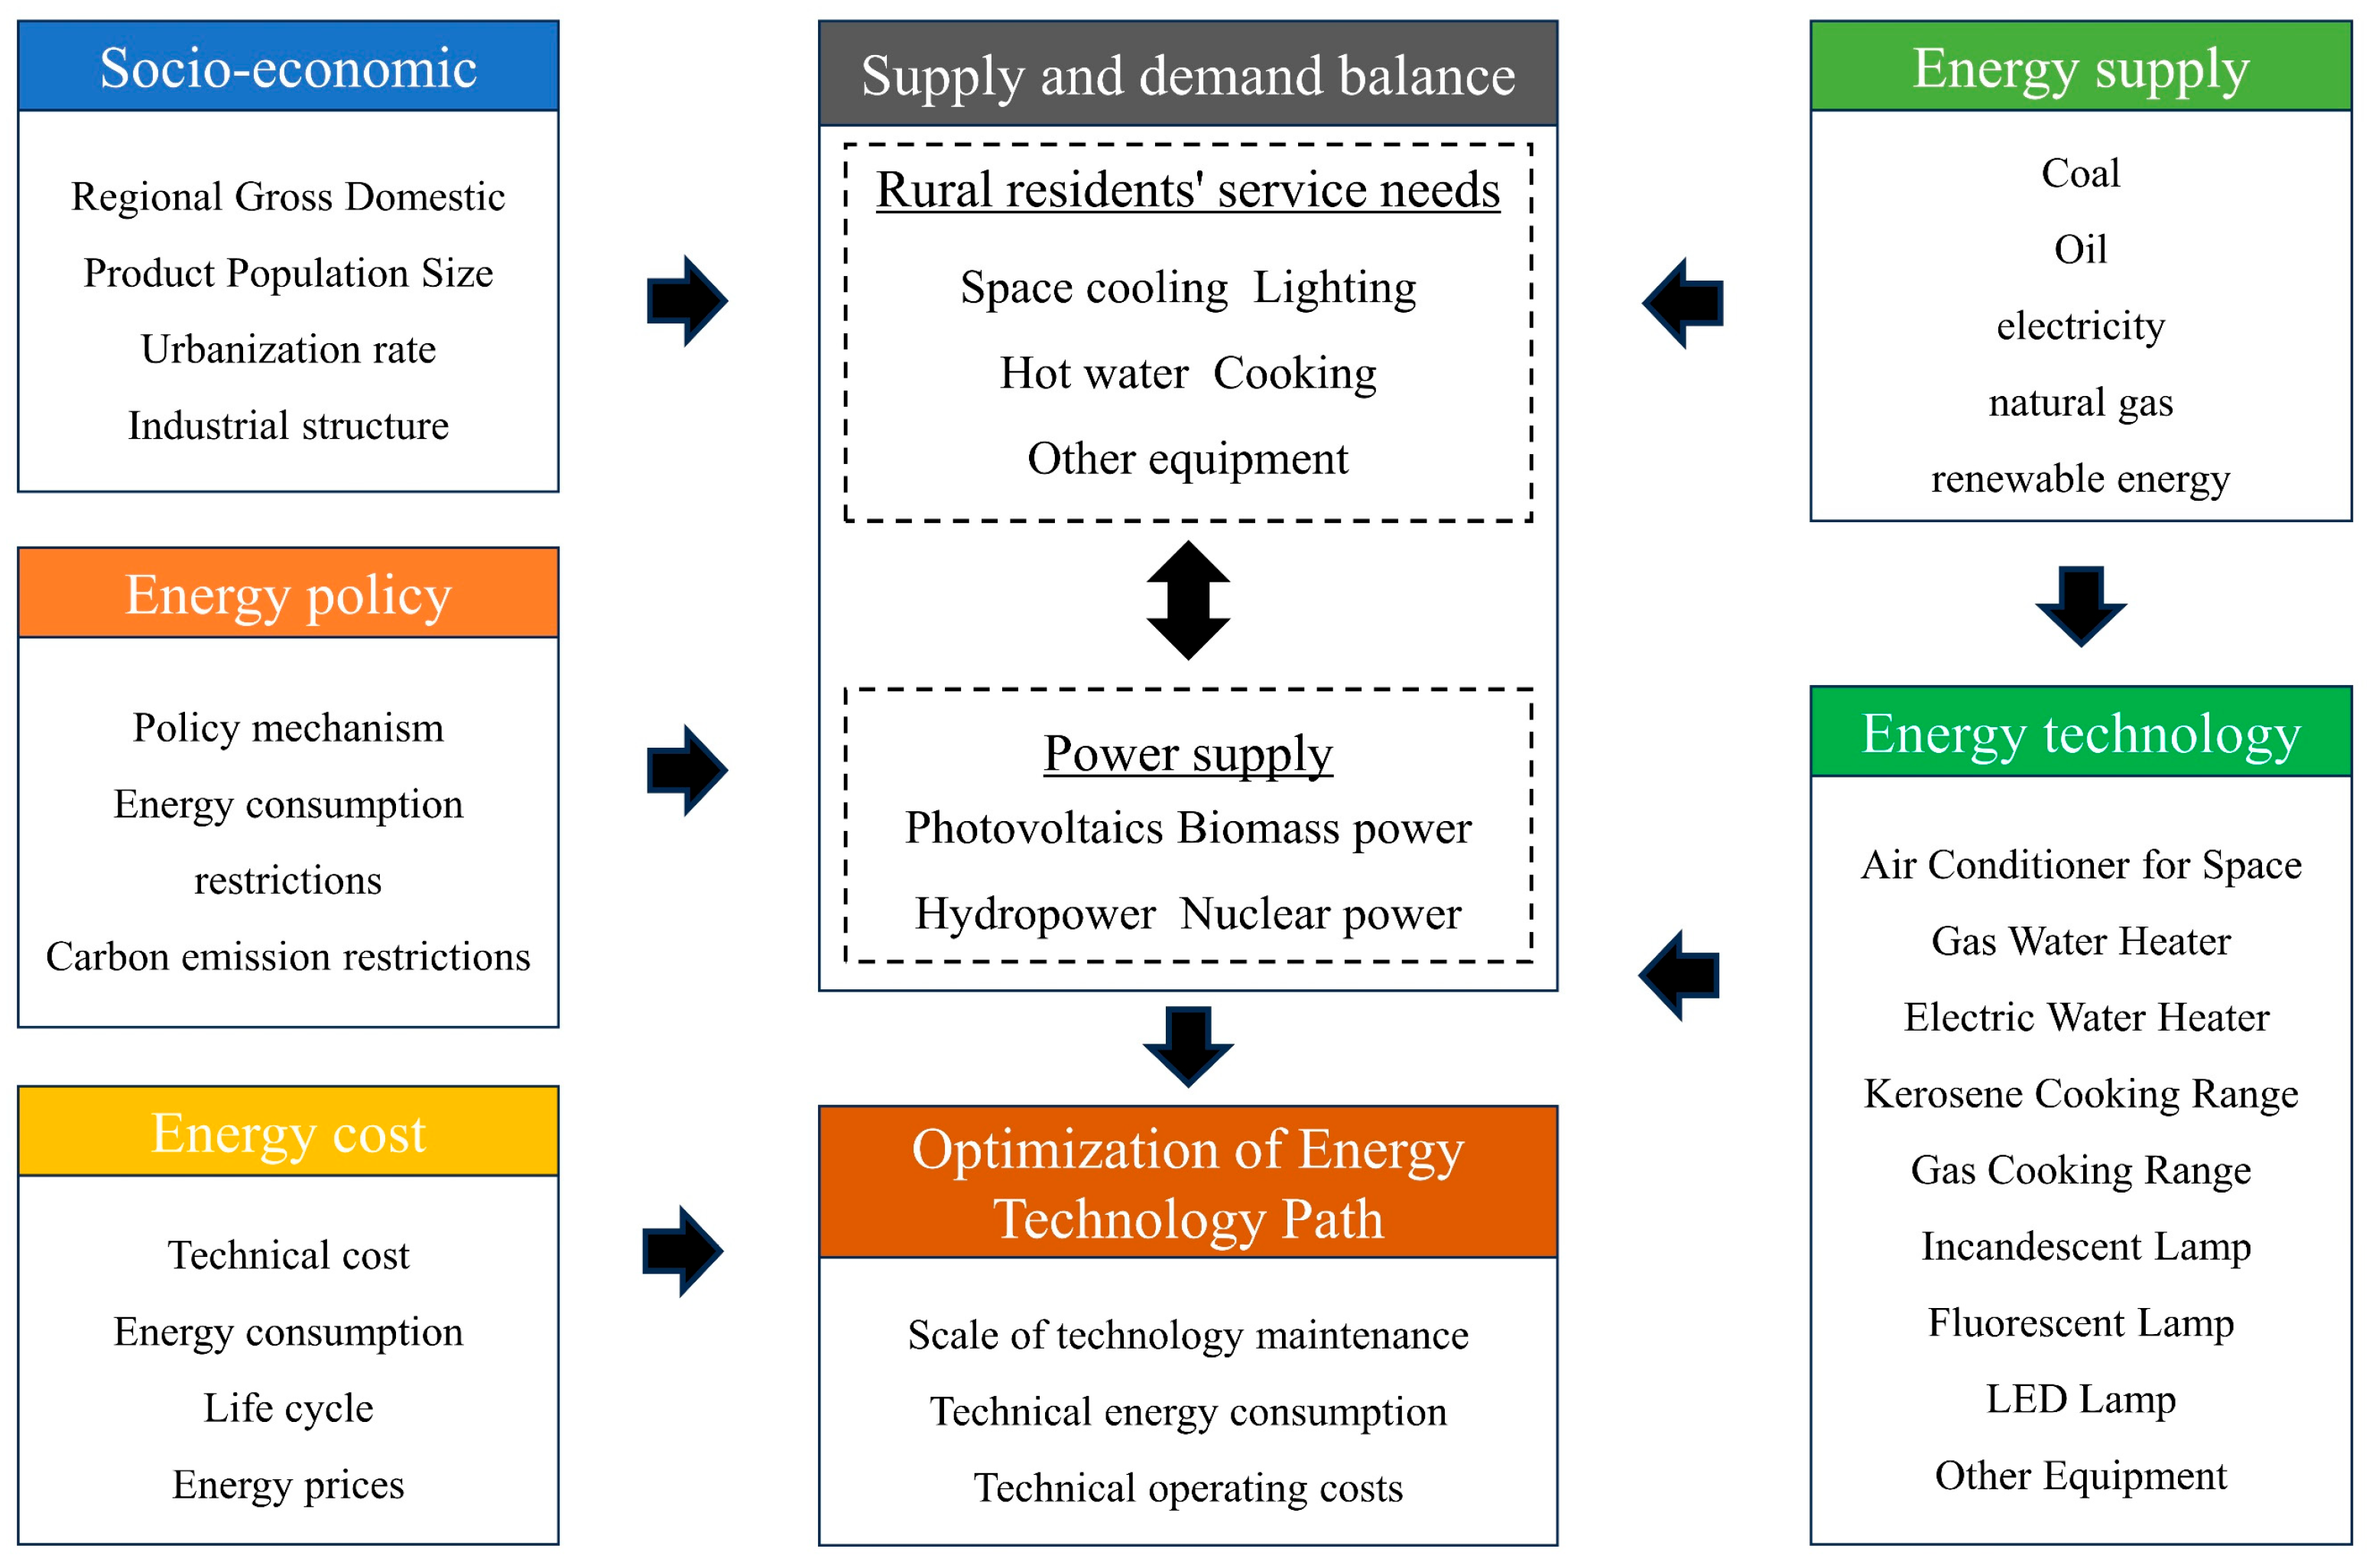
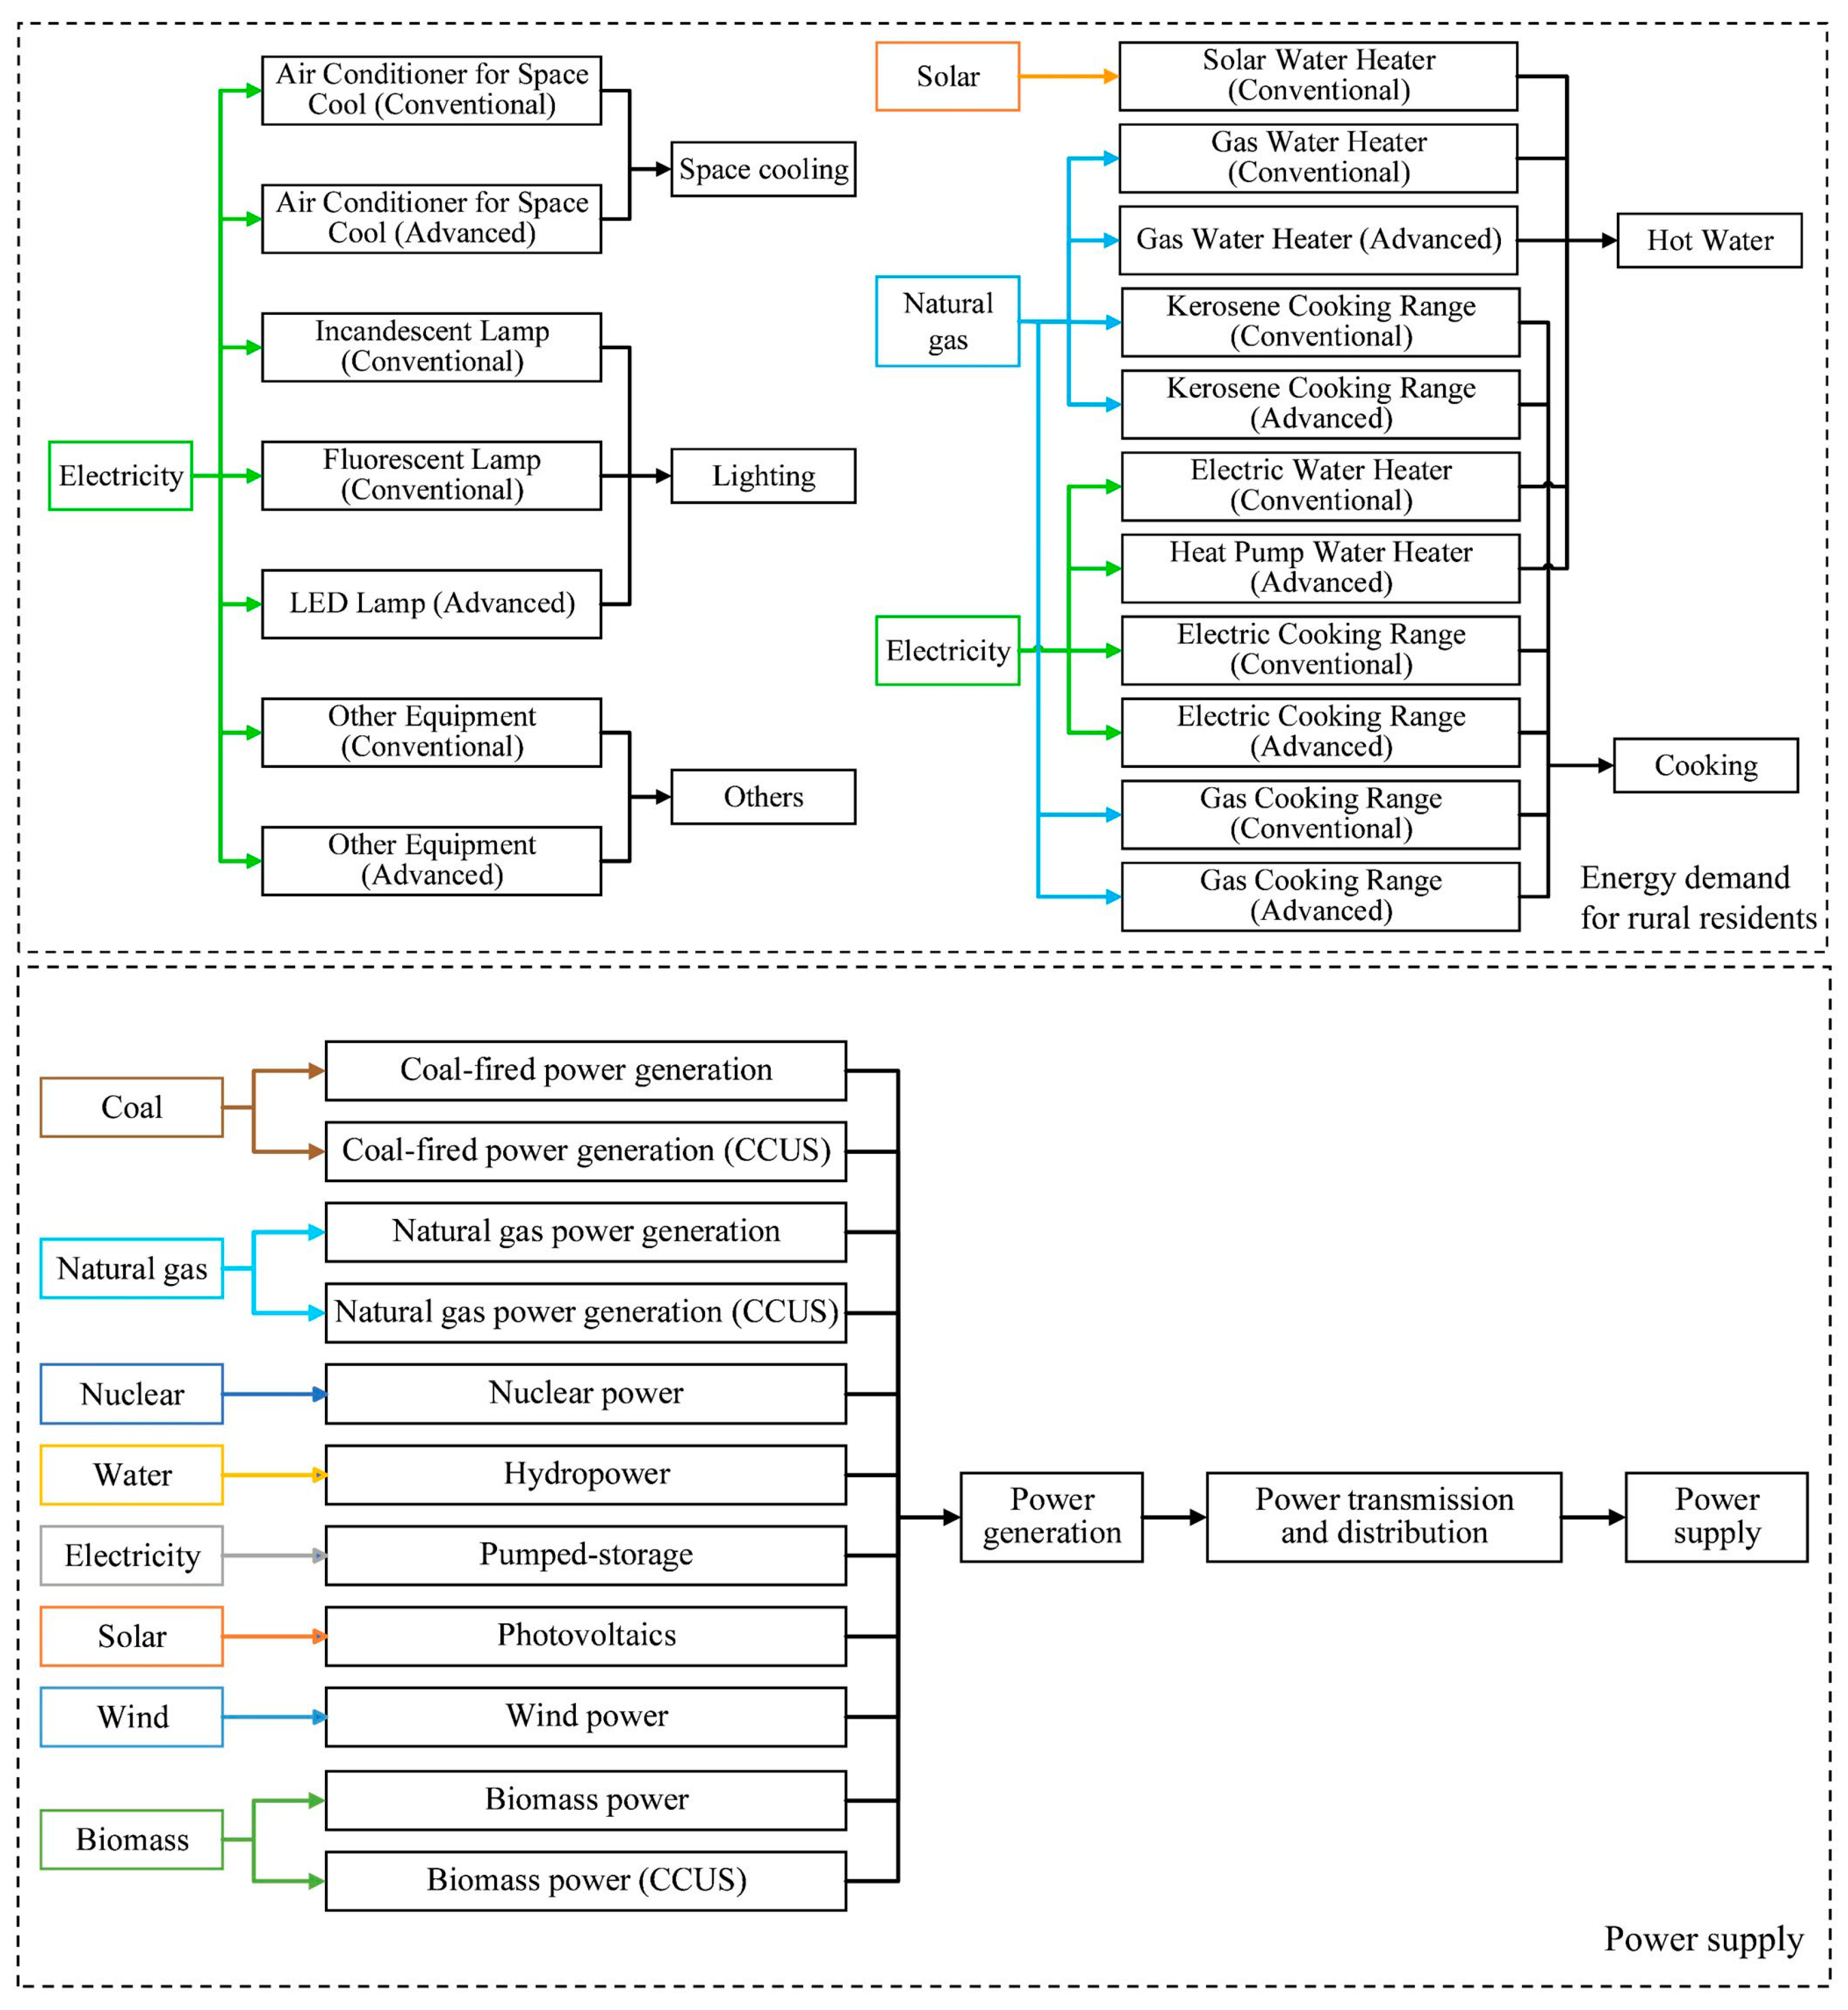
2.1. Model Structure and Technical Framework

Based on the principles of the AIM/Enduse model, this paper constructed the RG-Enduse model suitable for rural areas in Guangdong Province. Based on AIM/Enduse model framework and the principle of energy supply and demand balance, the types of energy supply, terminal technologies, service demands, and power production technologies are set locally to fully reflect the actual situation of rural energy use and supply in Guangdong Province. In addition, according to the level of local economic and social development and the implementation of policies, social development, energy policies, and energy costs are personalized. The model architecture is shown in Figure 1.
The optimization computation process of the RG-Enduse model involves the following main steps:
Step 1: Using both existing and forecast data, the model exogenously determines the service demands of rural residents. The electricity supply service demand depends on the amount of electricity required by rural residents, which needs to be passed as service demand to the electricity supply component.
Step 2: This step undertakes the function of “solution generation”. The model inputs energy data and technology parameters, setting upper and lower bounds for different technology shares. The objective is to minimize costs while imposing various constraints such as carbon emissions and technology substitution to optimize the best combination of technologies that meet service demands and output the quantitative selection scheme of the technology path (such as technology ratio).
Step 3: This step undertakes the function of “effect quantification”. Further, it calculates the energy consumption required for rural residents’ demands and electricity supply of the technology combination output by Step 2 and simultaneously computes the carbon emissions and technology costs associated with each technology pathway.
Based on the current energy use and electricity supply situation in rural Guangdong and future development trends, the model constructed in this study comprises two main parts: energy demand in rural areas and electricity supply. The residential demand component is divided into five categories: cooling, lighting, hot water, cooking, and other electrical appliances. The electricity supply component describes various generation technologies, including coal-fired power, natural gas power, biomass power, and photovoltaic power. Among these, coal-fired power, natural gas power, and biomass power can be configured with carbon capture, utilization, and storage (CCUS) technologies [24,25,26]. The electricity generated by these technologies is aggregated and distributed through the transmission and distribution network to meet the electricity demands of rural residents. The technological framework used in the model is illustrated in Figure 2.

2.2. Model Formula

2.2.1. Objective Function

The model takes the minimization of the total annual cost during the planning period as the objective function. The objective function aims to minimize the total cost of all feasible technology combinations in a given year, which includes the annualized initial investment cost, operating cost, and carbon emission cost of the technology. The total cost encompasses the purchase cost or initial investment cost, operation and maintenance cost, and energy cost of end-use energy equipment for rural residents.
The model integrates end-use energy equipment widely used by rural residents (such as coal stoves, gas stoves, solar water heaters, ground-source heat pumps, air conditioners, etc.). It is used to simulate the energy flow from the input end of various types of rural resident end-use energy equipment to the provision of final service demands (such as heating, cooling, hot water, cooking, lighting, etc.), thereby calculating the energy consumption and CO2 emissions of various types of equipment. The model can also be used to simulate the selection behavior of energy technologies. Under several policy constraints, the model seeks to meet the various service demands of rural residents with a technology combination that minimizes cost, based on the principle and algorithm of dynamic programming. The following is an introduction to its mathematical expression:
T H T h e a t i n g , t = i C H T h e a t i n g , i , t + M H T h e a t i n g , i , t + F H T h e a t i n g , t T C L c o o l i n g , t = i C C L c o o l i n g , l , t + M C L c o o l i n g , l , t + F C L c o o l i n g , t T H W h o t w a t e r , t = m C H W h o t w a t e r , m , t + M H W h o t w a t e r , m , t + F H W h o t w a t e r , t T C K c o o k i n g , t = j C C K c o o k i n g , j , t + M C K c o o k i n g , j , t + F C K c o o k i n g , t T L T l i g h t i n g , t = k C L T l i g h t i n g , k , t + M L T l i g h t i n g , k , t + F L T l i g h t i n g , t T A L a p p l i a n c e , t = r C A L a p p l i a n c e , r , t + M A L a p p l i a n c e , r , t + F A L a p p l i a n c e , t ,
where t represents the year; i represents the type of heating equipment; l represents the type of cooling equipment; m represents the type of equipment providing hot water services; j represents the type of cooking equipment; k represents the type of lighting equipment; and r represents the type of other household appliances and equipment. THTheating,t denotes the total cost of heating in year t; TCLcooling,t denotes the total cost of cooling in year t; THWhotwater,t denotes the total cost of hot water services in year t; TCKcooking,t denotes the total cost of cooking services in year t; TLTlighting,t denotes the total cost of lighting services in year t; and TALappliance,t denotes the total cost of other household appliances and equipment services in year t. CHTheating,i,t represents the annualized initial investment cost of heating equipment i in year t; CCLcooling,l,t represents the annualized initial investment cost of cooling equipment l in year t; CHWhotwater,m,t represents the annualized initial investment cost of hot water service equipment m in year t; CCKcooking,j,t represents the annualized initial investment cost of cooking equipment j in year t; CLTlighting,k,t represents the annualized initial investment cost of lighting equipment k in year t; and CALappliance,r,t represents the annualized initial investment cost of other household appliances and equipment r in year t. MHTheating,i,t denotes the operation and maintenance cost of heating equipment i in year t; MCLcooling,l,t denotes the operation and maintenance cost of cooling equipment l in year t; MHWhotwater,m,t denotes the operation and maintenance cost of hot water service equipment m in year t; MCKcooking,j,t denotes the operation and maintenance cost of cooking equipment j in year t; MLTlighting,k,t denotes the operation and maintenance cost of lighting equipment k in year t; and MALappliance,r,t denotes the operation and maintenance cost of other household appliances and equipment r in year t. FHTheating,t represents the energy cost of heating in year t; FCLcooling,t represents the energy cost of cooling in year t; FHWhotwater,t represents the energy cost of hot water services in year t; FCKcooking,t represents the energy cost of cooking services in year t; FLTlighting,t represents the energy cost of lighting services in year t; and FALappliance,t represents the energy cost of other household appliances and equipment in year t.
The calculation methods for the annualized initial investment cost, operation and maintenance cost, and energy cost of end-use energy equipment for rural residents are shown in the following equations, respectively. The annualized initial investment cost of each technology is calculated according to Equation (2):
F H T h e a t i n g , i , t = I C H T h e a t i n g , i , t 0 h 1 + h L H T h e a t i n g , i h 1 + h L H T h e a t i n g , i 1 C C L c o o l i n g , l , t = I C C L c o o l i n g , l , t 0 h 1 + h L C L c o o l i n g , l h 1 + h L C L c o o l i n g , l 1 C H W h o t w a t e r , m , t = I C H W h o t w a t e r , m , t 0 h 1 + h L H W h o t w a t e r , m h 1 + h L H W h o t w a t e r , m 1 C C K c o o k i n g , j , t = I C C K c o o k i n g , j , t 0 h 1 + h L C K c o o k i n g , j h 1 + h L C K c o o k i n g , j 1 C L T l i g h t i n g , k , t = I C L T l i g h t i n g , k , t 0 h 1 + h L L T l i g h t i n g , k h 1 + h L L T l i g h t i n g , k 1 C A L a p p l i a n c e , r , t = I C A L a p p l i a n c e , r , t 0 h 1 + h L A L a p p l i a n c e , r h 1 + h L A L a p p l i a n c e , r 1 ,
where I C H T h e a t i n g , i , t 0 represents the purchase cost of heating equipment i in year t; I C C L c o o l i n g , l , t 0 represents the purchase cost of cooling equipment l in year t; I C H W h o t w a t e r , m , t 0 represents the purchase cost of hot water service equipment m in year t; I C C K c o o k i n g , j , t 0 represents the purchase cost of cooking equipment j in year t; I C L T l i g h t i n g , k , t 0 represents the purchase cost of lighting equipment k in year t; I C A L a p p l i a n c e , r , t 0 represents the purchase cost of other household appliances and equipment r in year t; h denotes the discount rate; L H T h e a t i n g , i represents the service life of heating equipment i; L C L c o o l i n g , l represents the service life of cooling equipment l; L H W h o t w a t e r , m represents the service life of hot water service equipment m; L C K c o o k i n g , j represents the service life of cooking equipment j; L L T l i g h t i n g , k represents the service life of lighting equipment k; and L A L a p p l i a n c e , r represents the service life of other household appliances and equipment r. The operation cost of each technology is calculated according to Equation (3):
M H T h e a t i n g , i , t = A H T h e a t i n g , i , t O H T h e a t i n g , i , t M C L c o o l i n g , l , t = A C L c o o l i n g , l , t O C L c o o l i n g , l , t M H W h o t w a t e r , m , t = A H W h o t w a t e r , m , t O H W h o t w a t e r , m , t M C K c o o k i n g , j , t = A C K c o o k i n g , j , t O C K c o o k i n g , j , t M L T l i g h t i n g , k , t = A L T l i g h t i n g , k , t O L T l i g h t i n g , k , t M A L a p p l i a n c e , r , t = A A L a p p l i a n c e , r , t O A L a p p l i a n c e , r , t ,
where A H T h e a t i n g , i , t represents the unit operating cost of heating equipment i in year t; O H T h e a t i n g , i , t represents the number of operating units of equipment i in year t; A C L c o o l i n g , l , t represents the unit operating cost of cooling equipment l in year t; O C L c o o l i n g , l , t represents the number of operating units of cooling equipment l in year t; A H W h o t w a t e r , m , t represents the unit operating cost of hot water service equipment m in year t; O H W h o t w a t e r , m , t represents the number of operating units of hot water service equipment m in year t; A C K c o o k i n g , j , t represents the unit operating cost of cooking equipment j in year t; O C K c o o k i n g , j , t represents the number of operating units of cooking equipment j in year t; A L T l i g h t i n g , k , t represents the unit operating cost of lighting equipment k in year t; O L T l i g h t i n g , k , t represents the number of operating units of lighting equipment k in year t; A A L a p p l i a n c e , r , t represents the unit operating cost of other household appliances and equipment r in year t; and O A L a p p l i a n c e , r , t represents the number of operating units of other household appliances and equipment r in year t.
The maintenance cost of each technology is calculated according to Equation (4):
F H T h e a t i n g , t = y P R y , t i Z H T i , y , t D H T i , y , t O H T i , y , t F C L c o o l i n g , t = y P R y , t l Z C L l , y , t D C L l , y , t O C L l , y , t F H W h o t w a t e r , t = y P R y , t m Z H W m , y , t D H W m , y , t O H W m , y , t F C K c o o k i n g , t = y P R y , t j Z C K j , y , t D C K j , y , t O C K j , y , t F L T l i g h t i n g , t = y P R y , t k Z L T k , y , t D L T k , y , t O L T k , y , t F A L a p p l i a n c e , t = y P R y , t r Z A L r , y , t D A L r , y , t O A L r , y , t ,
where P R y , t represents the price of energy type y in year t; Z H T i , y , t represents the amount of energy consumed by heating equipment i to provide a unit of heating demand in year t; D H T i , y , t represents the amount of heating demand that a unit of heating equipment i can provide in year t; Z C L l , y , t represents the amount of energy consumed by cooling equipment l to provide a unit of cooling demand in year t; D C L l , y , t represents the amount of cooling demand that a unit of cooling equipment l can provide in year t; Z H W m , y , t represents the amount of energy consumed by hot water service equipment m to provide a unit of hot water demand in year t; D H W m , y , t represents the amount of hot water demand that a unit of hot water service equipment m can provide in year t; Z C K j , y , t represents the amount of energy consumed by cooking equipment j to provide a unit of cooking demand in year t; D C K j , y , t  represents the amount of cooking demand that a unit of cooking equipment j can provide in year t; Z L T k , y , t represents the amount of energy consumed by lighting equipment k to provide a unit of lighting demand in year t; D L T k , y , t represents the amount of lighting demand that a unit of lighting equipment k can provide in year t; Z A L r , y , t represents the amount of energy consumed by other household appliances and equipment r to provide a unit of service demand in year t; and D A L r , y , t represents the amount of service demand that a unit of other household appliances and equipment r can provide in year t.

2.2.2. Model Constraint Conditions

(1) Service demand constraints.
The service demand constraint is the most important constraint of the model, which means that the total service demand provided by rural residents’ terminal energy devices each year should be greater than the total service demand of rural residents, as shown in Equation (5):
i D H T i , t O H T i , t D H T h e a t i n g , t l D C L l , t O C L l , t D C L c o o l i n g , t m D H W m , t O H W m , t D H W h o t w a t e r , t j D C K j , t O C K j , t D C K c o o k i n g , t k D L T k , t O L T k , t D L T l i g h t i n g , t r D A L r , t O A L r , t D A L a p p l i a n c e , t ,
where D H T h e a t i n g , t represents the heating demand in year t; D C L c o o l i n g , t represents the cooling demand in year t; D H W h o t w a t e r , t represents the hot water service demand in year t; D C K c o o k i n g , t represents the cooking demand in year t; D L T l i g h t i n g , t represents the lighting demand in year t; and D A L a p p l i a n c e , t represents the service demand for other household appliances and equipment in year t.
(2) Retirement Volume Constraints for End-Use Energy Equipment of Rural Residents
The retirement volume constraint for end-use energy equipment of rural residents means that the number of energy-consuming devices retired or replaced each year cannot exceed the stock of end-use energy equipment of rural residents, as shown in Equation (6):
R H T i , t S H T i , t R C L l , t S C L l , t R H W m , t S H W m , t R C K j , t S C K j , t R L T k , t S L T k , t R A L r , t S A L r , t ,
where R H T i , t represents the retirement volume of heating equipment i in year t; S H T i , t represents the stock of heating equipment i in year t; R C L l , t represents the retirement volume of cooling equipment l in year t; S C L l , t represents the stock of cooling equipment l in year t; R H W m , t represents the retirement volume of hot water service equipment m in year t; S H W m , t represents the stock of hot water service equipment m in year t; R C K j , t represents the retirement volume of cooking equipment j in year t; S C K j , t represents the stock of cooking equipment j in year t; R L T k , t represents the retirement volume of lighting equipment k in year t; S L T k , t represents the stock of lighting equipment k in year t; R A L r , t represents the retirement volume of other household appliances and equipment r in year t; and S A L r , t represents the stock of other household appliances and equipment r in year t.
The calculation method for the stock of end-use energy equipment for rural residents is shown in the following equations:
S H T i , t = S H T i , t 1 + G H T i , t R H T i , t S C L l , t = S C L l , t 1 + G C L l , t R C L l , t S H W m , t = S H W m , t 1 + G H W m , t R H W m , t S C K j , t = S C K j , t 1 + G C K j , t R C K j , t S L T k , t = S L T k , t 1 + G L T k , t R L T k , t S A L r , t = S A L r , t 1 + G A L r , t R A L r , t ,
where G H T i , t represents the new addition of heating equipment i in year t; G C L l , t represents the new addition of cooling equipment l in year t; G H W m , t represents the new addition of hot water service equipment m in year t; G C K j , t represents the new addition of cooking equipment j in year t; G L T k , t represents the new addition of lighting equipment k in year t; and G A L r , t represents the new addition of other household appliances and equipment r in year t.
(3) Operating Volume Constraints for End-Use Energy Equipment of Rural Residents
The operating volume of end-use energy equipment for rural residents should not exceed the maximum stock of that equipment. The operating volume constraints for end-use energy equipment of rural residents are shown in the following equations:
O H T i , t S H T i , t m a x O C L l , t S C L l , t m a x O H W m , t S H W m , t m a x O C K j , t S C K j , t m a x O L T k , t S L T k , t m a x O A L r , t S A L r , t m a x ,
where S H T i , t m a x represents the maximum stock of heating equipment i in year t; S C L l , t m a x represents the maximum stock of cooling equipment l in year t; S H W m , t m a x represents the maximum stock of hot water service equipment m in year t; S C K j , t m a x represents the maximum stock of cooking equipment j in year t; S L T k , t m a x represents the maximum stock of lighting equipment k in year t; and S A L r , t m a x represents the maximum stock of other household appliances and equipment r in year t.
(4) Service Proportion Constraints for Different Energy Sources
According to policy objectives or technological development trends, it is necessary to set constraints on the service proportion provided by some energy sources. For example, for coal, kerosene, and liquefied petroleum gas, the service proportion should be at least 0 and should not exceed the proportion provided in the base year; for electricity, the service proportion should increase year by year. The service proportion constraints for different energy sources are shown in the following equations:
X H T y , t = i D H T i , y , t O H T i , y , t y i D H T i , y , t O H T i , y , t X C L y , t = l D C L l , y , t O C L l , y , t y l D C L l , y , t O C L l , y , t X H W y , t = m D H W m , y , t O H W m , y , t y m D H W m , y , t O H W m , y , t X C K y , t = j D C K j , y , t O C K j , y , t i j D C K j , y , t O C K j , y , t A L T y , t = k D L T k , y , t O L T k , y , t y k D L T k , y , t O L T k , y , t X A L y , t = r D A L r , y , t O A L r , y , t y r D A L r , y , t O A L r , y , t ,
In the equations, X H T y , t represents the proportion of heating services provided by energy y in year t; X C L y , t represents the proportion of cooling services provided by energy y in year t; X H W y , t represents the proportion of hot water services provided by energy y in year t; X C K y , t represents the proportion of cooking services provided by energy y in year t; A L T y , t represents the proportion of lighting services provided by energy y in year t; and X A L y , t represents the proportion of services provided by energy y for other household appliances and equipment in year t.
The model simultaneously considers three types of technology alternatives: one is to use new technologies at the end of the service life of old technologies, or to add technologies to meet demand. The second is to improve the energy efficiency of existing technologies, without considering the investment in new technologies for the time being. The third is to use new technologies to eliminate old technologies, even if existing technologies are still in use, but immediately stop using them due to situational constraints or greater cost-effectiveness. The model proposed in this article can simulate the technological replacement in the real production process during the technology selection process:
f 1 = T 1 + C 1 T 2 + C 2
f 2 = T 1 + C 1 T 1 + T 3 + C 3
where f 1 is the function of replacing new technology at the end of its service life, f 2 is the function of replacing old technology with new technology, T 1 is the initial investment cost of old technology, C 1 is the operation and maintenance cost of old technology, T 2 is the initial investment cost of new technology, T 3 is the initial investment cost of improving or phasing out old technology before its service life expires, and C 2 is the operation and maintenance cost of improving or phasing out old technology. When f 1 or f 2 > 1 old technologies are banned or improved. When f 1 or f 2 > 1 , the old technology may continue to be maintained.

3. Parameter and Scenario Building

3.1. Model Parameter

3.1.1. Technical Parameters

The technical parameters in the model include the service life of technical equipment in the base year, initial investment cost, operation and maintenance cost, and other data [7,27]. The technical operation and maintenance cost of power supply is set at 3% of the initial investment cost, and the annual utilization rate is based on the annual utilization hours. Other data sources were obtained by referencing relevant industry information [2,8,28], the technical parameters are shown in Table 1.

3.1.2. Energy Parameters

The energy sources included in this study mainly include coal, natural gas, and biomass fuels [29,30]. The emission coefficient refers to the recommended values of IPCC, and the price refers to the recommended values published on relevant websites, and the carbon emission tax is 100 yuan/tonCO2 [9,31] (as shown in Table 2).

3.2. Scenario Building

This study employs scenario analysis to forecast energy consumption, aiming to explore future trends and pathways to better understand the development direction of the research subject. Based on varying levels of energy conservation and carbon reduction efforts, three scenarios are set: the baseline (BL) scenario, the low-carbon (CM1) scenario, and the green low-carbon (CM2) scenario [32]. Energy consumption for each demand category is assessed considering trends in population growth, urbanization rates, and residential building area development, along with household consumption levels and electrification rates.
In line with the energy development goals of the 14th Five-Year Plan and Guangdong Province’s carbon peak implementation plan, the proportion of non-fossil energy consumption in Guangdong is projected to reach 32% by 2025, 35% by 2030, and 80% by 2060. The baseline scenario follows current policies, with improvements in the energy structure of rural areas by 2035, achieving a mix of increased clean energy, extensive biomass utilization, and high electrification rates by 2060. The low-carbon scenario anticipates a 5% improvement in energy efficiency compared to the baseline scenario. By 2035, it aims for the full electrification of rural residential consumption and encourages the large-scale applications of biomass energy and photovoltaic solar energy, with energy efficiency reaching the national advanced level by 2060. In the green low-carbon scenario, energy efficiency is projected to increase by an additional 10% compared to the low-carbon scenario. By 2035, it aims for the complete electrification of rural energy consumption, achieving global advanced levels of energy efficiency, and by 2060, it aims to achieve 100% clean energy, large-scale biomass utilization, and high electrification rates. Parameters for different scenarios in the model, broken down by demand categories, are shown in Table 3.

4. Results and Discussion

The GAMS optimization model is used to solve the RG-Enduse model proposed in this study, and the technical combination of each process in different scenarios is obtained, so as to explore an economically feasible high-quality and low-carbon development paths for the rural areas of Guangdong province.

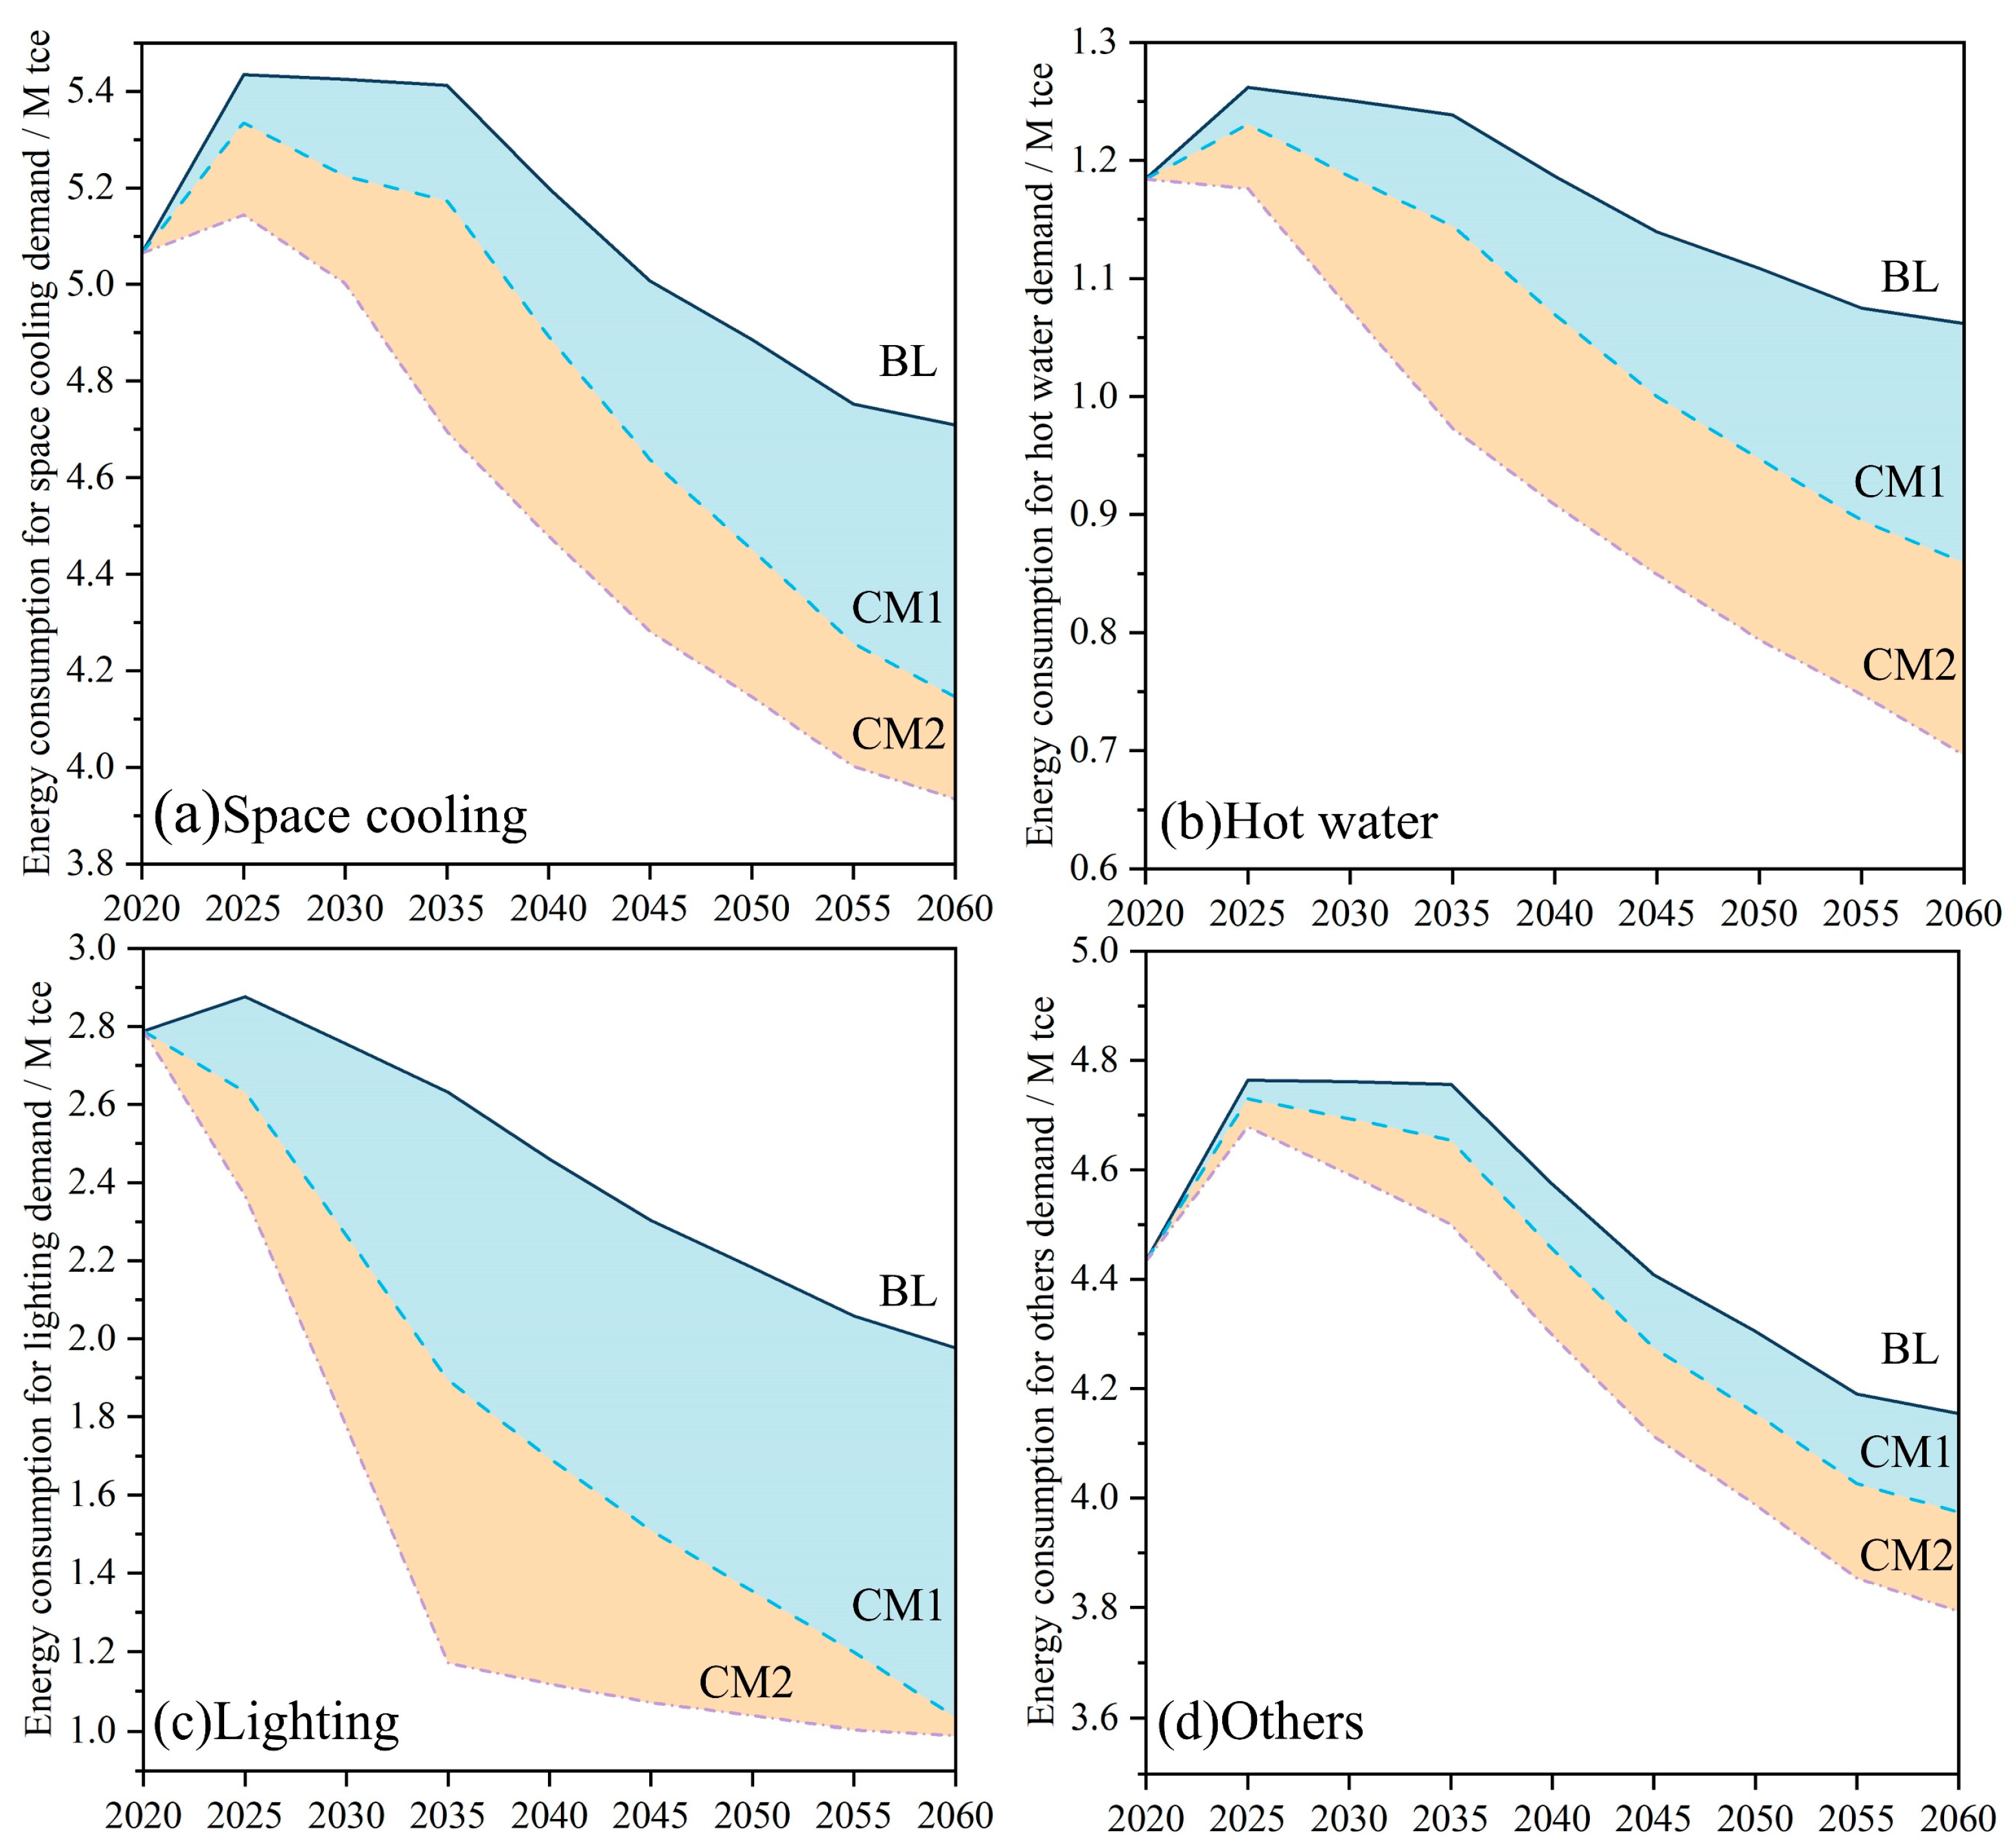
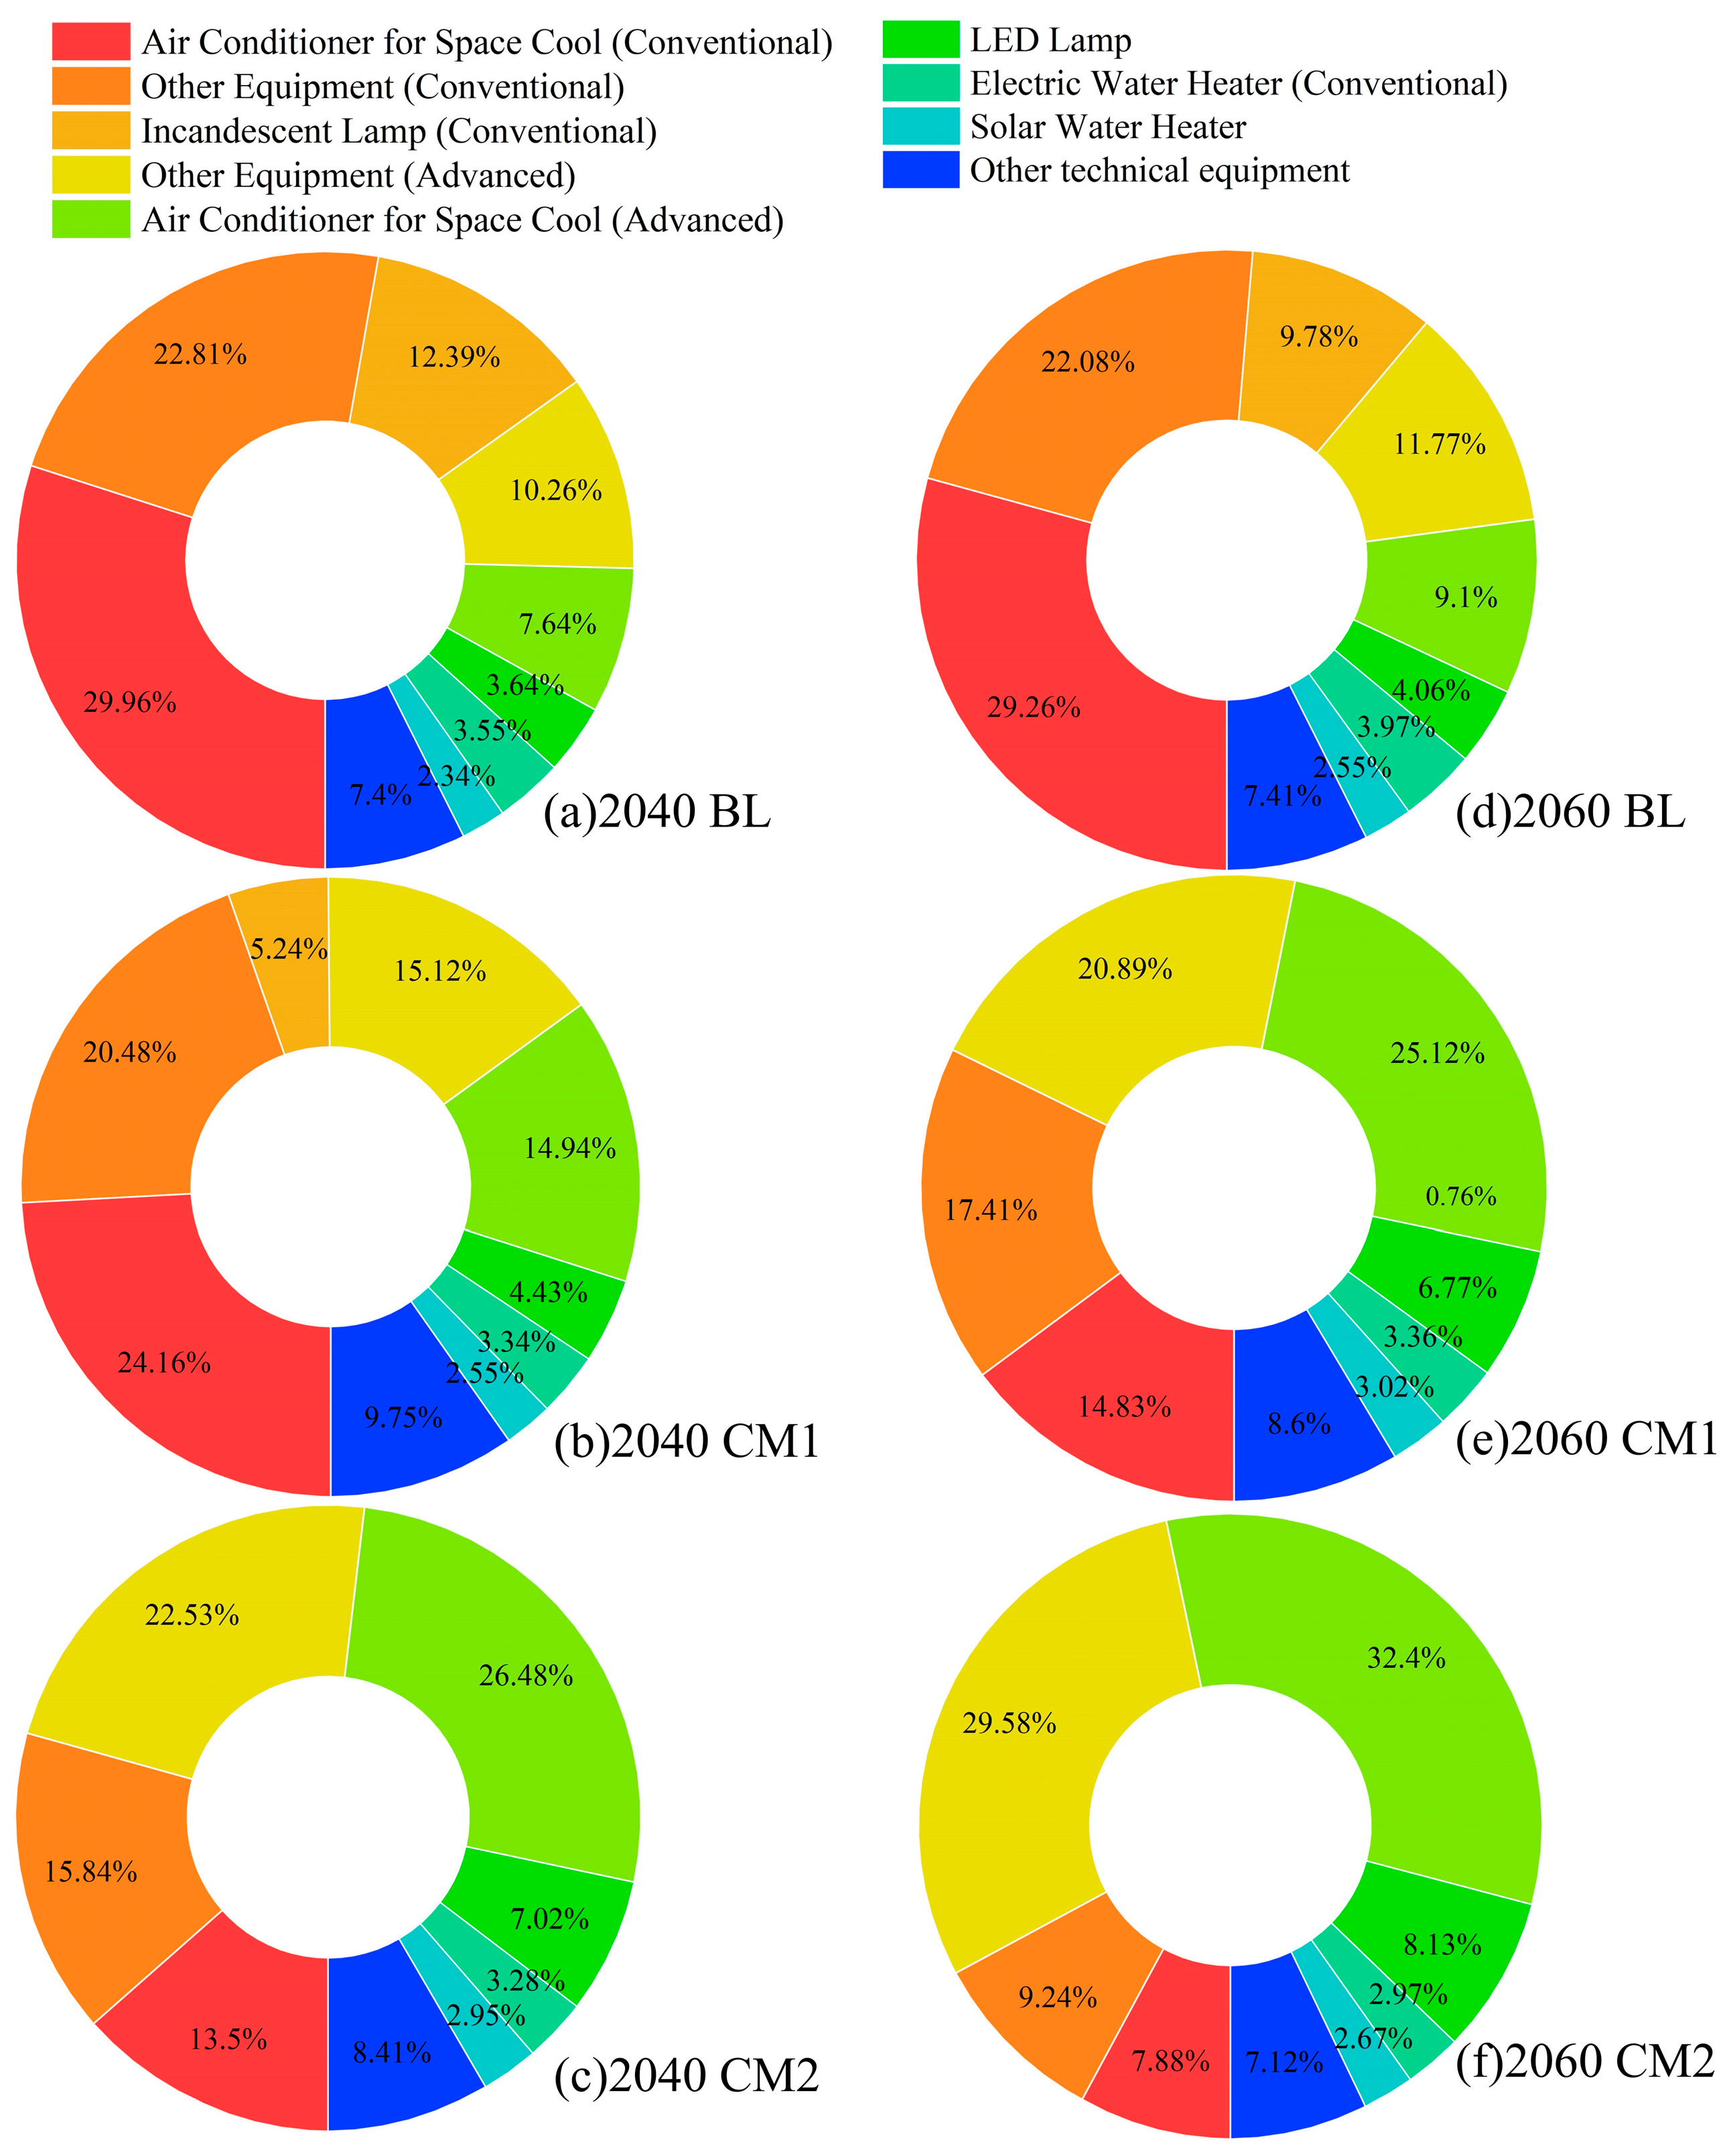
4.1. Energy Consumption Demand

In this part, the total energy consumption and main service demand levels of rural areas in Guangdong Province in BL, CM1, and CM2 from now until 2060 are analyzed, respectively. The energy saving effects of the major demands are further evaluated. Based on the proportion of various technologies in the future, the substitution of advanced technologies in BL, CM1, and CM2 to traditional technologies is also analyzed, aiming to explore the green and low-carbon development path of terminal energy consumption in rural areas.
This paper categorizes the energy demands of rural residents in Guangdong Province into five major categories, namely cooling, lighting, hot water, cooking appliances, and other electrical appliances, and explores the energy transition pathways on the demand side in rural areas. The model’s results are illustrated in Figure 3 and Figure 4. Due to the decrease in rural population caused by rapid urbanization, both the BL and CM1 scenarios show an initial increase followed by a decline, while the CM2 scenario exhibits a continuous decreasing trend. In both the BL and CM1 scenarios, energy consumption peaks in 2025, reaching 17.46 million tce and 14.35 million tce, respectively, and declines to 12.27 million tce and 10.38 million tce by 2060. In the CM2 scenario, rural energy consumption continuously decreases from 13.87 million tce in 2020 to 9.77 million tce in 2060. The CM1 scenario shows a decrease from 13.87 million tce in 2020 to 10.38 million tce in 2060, with a reduction rate of 25.17%, closely aligning with the decrease rate of the number of rural households (26.35%). This suggests that the potential increase in energy consumption due to improved living standards can almost be offset by improvements in technological efficiency and changes in population structure.
In Guangdong, cooling demand and other electrical appliances account for the largest shares of energy consumption. In the base year 2020, cooling demand energy consumption is 5.06 million tce, accounting for 36.52%, while energy consumption for other electrical appliances is 4.43 million tce, representing 31.97%. In the BL scenario, by 2060, cooling demand energy consumption is 4.71 million tce, the highest at 38.36%, while cooking demand energy consumption is 0.37 million tce, the lowest at 3.03%. In the CM1 scenario, the shares of cooling demand and other electrical appliances continue to grow, with cooling demand accounting for 39.96% and reaching 4.15 million tce. Energy consumption for other electrical appliances grows to 38.30%, reaching 3.97 million tce. In the CM2 scenario, energy consumption for cooling and other electrical appliances declines to 3.93 million tce and 3.79 million tce, respectively, but their shares slightly increase to 40.28% and 38.83%.
Figure 4 shows a comparison of the four demand categories under the three scenarios. With the large-scale application of advanced air conditioning, cooling demand energy consumption decreases by 11.95% to 0.56 million tce in the CM1 scenario and by 16.43% to 0.77 million tce in the CM2 scenario. Hot water demand energy consumption decreases by 19.09% to 0.20 million tce in the CM1 scenario. In the CM2 scenario, gas water heaters are gradually phased out, and the proportion of efficient heat pump water heaters increases, further reducing hot water energy consumption by 34.43% to 0.37 million tce. The most significant reduction is observed in lighting energy consumption due to the widespread use of advanced LED lights, with a decrease of 47.67% to 0.94 million tce in the CM1 scenario and 50.01% to 0.99 million tce in the CM2 scenario. Other electrical appliances, including refrigerators and televisions, show relatively less room for energy savings, with a reduction of 4.35% to 0.18 million tce in the CM1 scenario and 8.70% to 0.36 million tce in the CM2 scenario.
By comparing the substitution of advanced technologies, the technological development path supporting the above energy-saving effects is analyzed. The proportions of various technologies in the optimization results across different scenarios are shown in Figure 5. Due to the lower costs of traditional equipment and energy, traditional technologies dominate in the early stages. In the base year of 2020, traditional air conditioning systems hold the largest share at 30.91%, with an energy consumption of 4.29 million tce. Advanced electric cookers, traditional/advanced gas cookers, traditional/advanced kerosene stoves, and high-efficiency heat pump water heaters each account for less than 1%, with energy consumption below 0.14 million tce. In the BL scenario, by 2060, the proportions of technologies remain relatively unchanged, with total energy consumption decreasing to 12.27 million tce.
In the CM1 scenario, by 2040, heat pump water heaters and gas water heaters emerge as leading transitional technologies. By 2060, advanced air conditioning systems and other advanced technologies gradually surpass traditional technologies, with shares reaching 25.12% and 20.89%, respectively, and energy consumption of 2.61 million tce and 2.17 million tce. Electric water heaters and solar water heaters become the dominant technologies for hot water. Traditional kerosene stoves and incandescent bulbs are phased out, and the shares of advanced gas water heaters, traditional/advanced gas cookers, and advanced kerosene stoves fall below 1%.
In the CM2 scenario, traditional kerosene stoves and incandescent bulbs are eliminated by 2040, and by 2060, traditional/advanced gas water heaters, advanced kerosene stoves, and traditional/advanced gas cookers are further phased out. Heat pump water heaters and traditional electric cookers are minimally present. Advanced air conditioning systems and other advanced technologies are key to achieving green and low-carbon goals, with their shares increasing to 32.40% and 29.58%, respectively, and energy consumption at 3.17 million tce and 2.89 million tce. In the CM2 scenario, most technologies used by rural residents rely on green energy, leading to a total energy consumption reduction to 9.77 million tce.

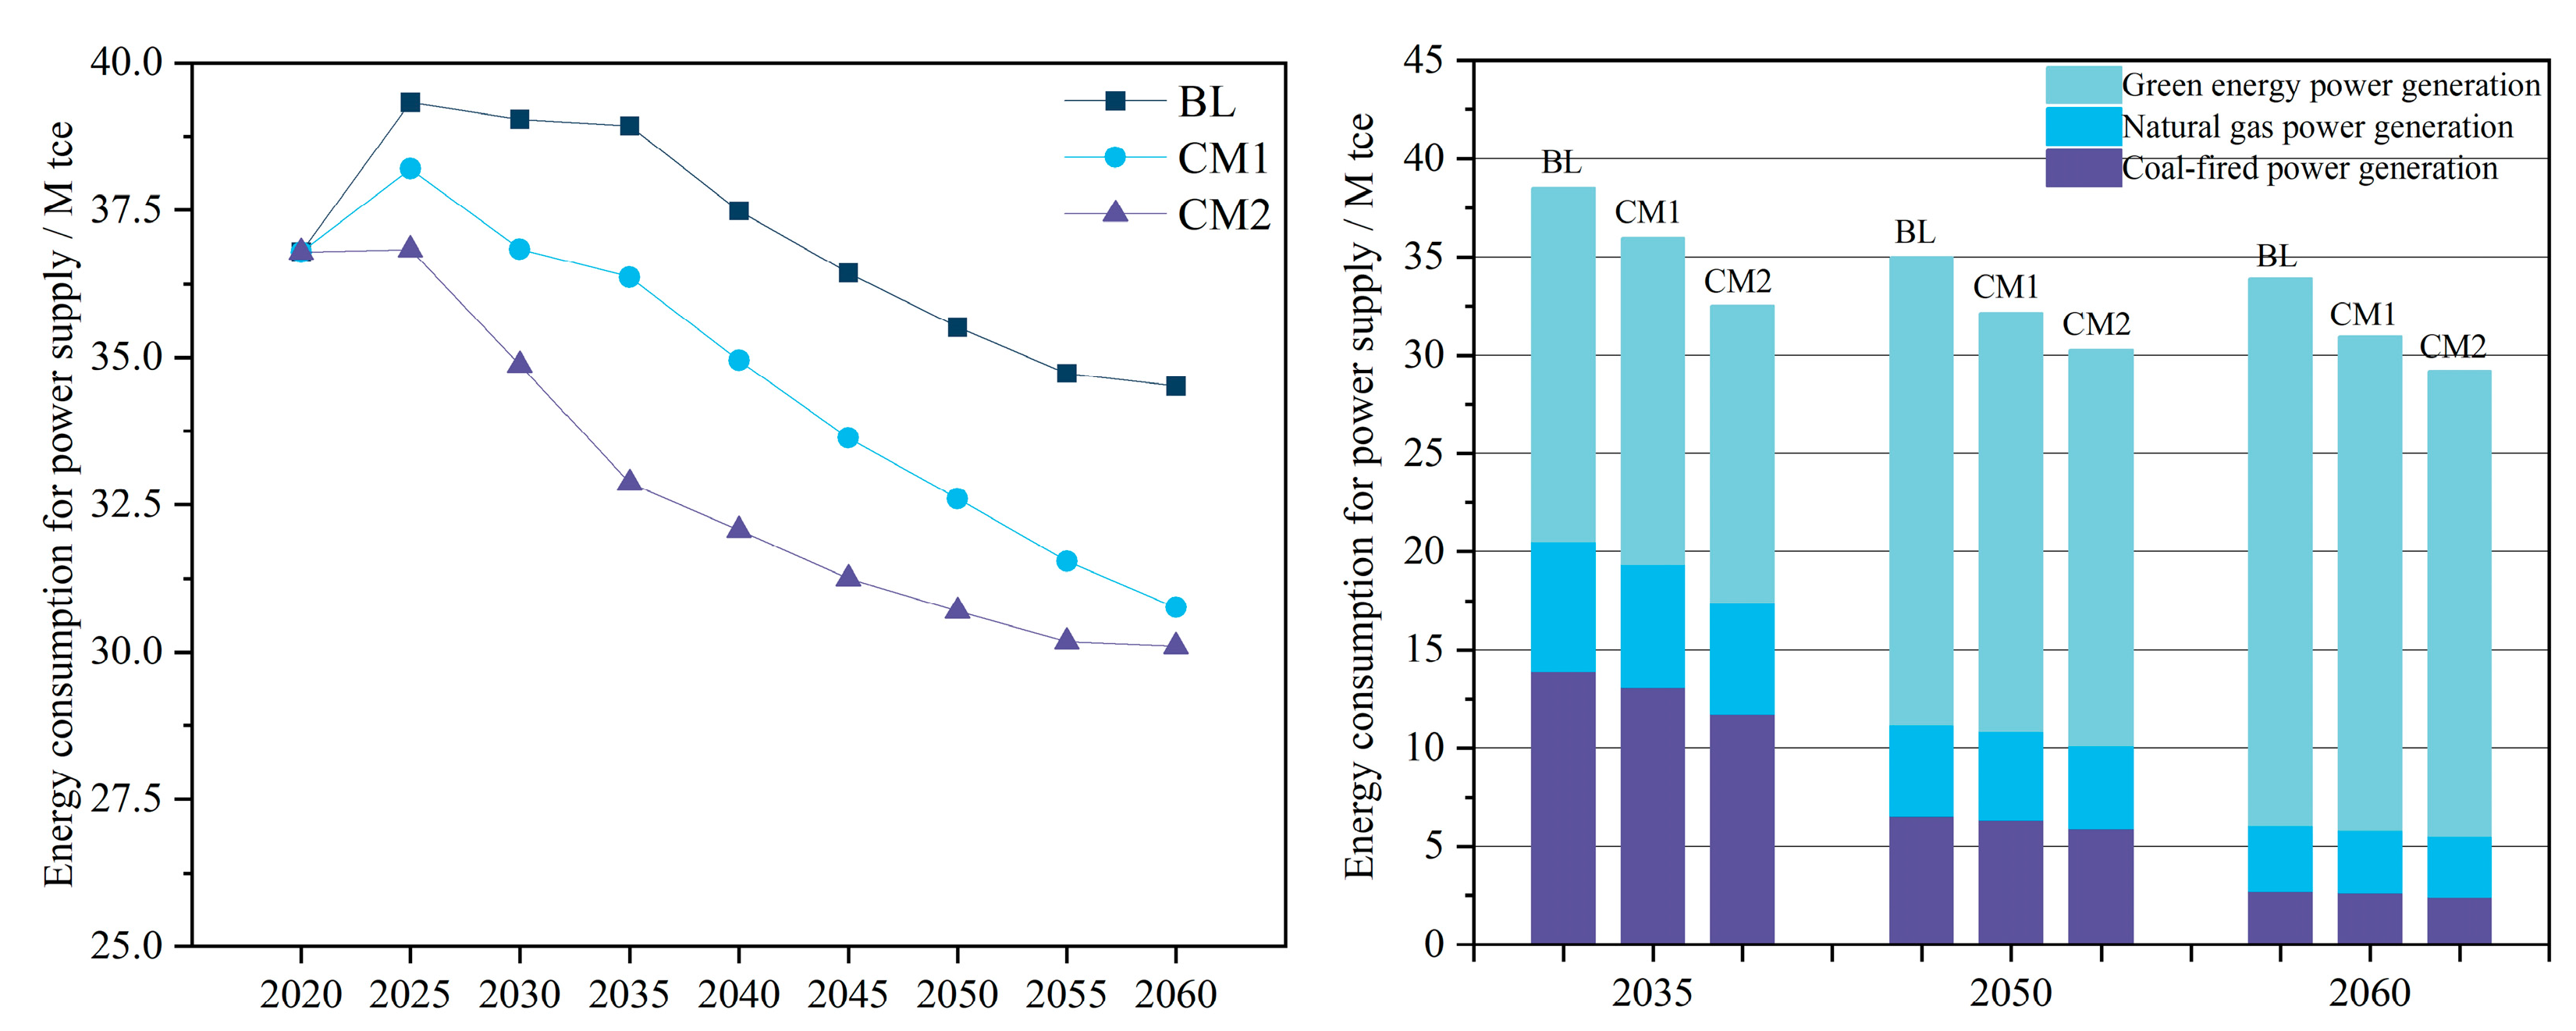
4.2. Energy Supply Demand

According to the analysis in Section 4.1, electricity is the main energy type for carbon neutral development in the future. This part analyzes the research results of the energy supply module. Firstly, the role of green electricity in energy supply transformation is explored by analyzing the energy consumption structure of BL, CM1, and CM2. Secondly, the power supply scheme of BL, CM1, and CM2, including the types of power generation technology, installed capacity, and power generation results, are compared and analyzed.

4.2.1. Electricity Consumption Demand

This study couples the RG-Enduse model with the supply-side analysis of electricity provision, exploring not only the demand-side but also the transformation pathways of the electricity supply side. In the base year of 2020, the primary energy required for the electricity supply sector was 36.79 million tce, as shown in Figure 6. In both the BL and CM1 scenarios, energy demand peaks in 2025 at 39.33 million tce and 38.20 million tce, respectively, and decreases to 34.51 million tce and 30.75 million tce by 2060. In the CM2 scenario, the peak is reached in 2023 at 36.86 million tce, decreasing to 30.10 million tce by 2060.
The proportion of green electricity in all three scenarios is gradually increasing. In the base year 2020, the primary energy requirements for coal power, gas power, and green electricity were 19.41 million tce, 4.55 million tce, and 12.54 million tce, respectively, with green electricity accounting for 34.10% of the total. In the BL scenario, green electricity consumption reaches 18.00 million tce by 2035 and 27.82 million tce by 2060, with proportions of 45.75% and 78.47%, respectively. In the CM1 and CM2 scenarios, the proportion of green electricity further increases, while the overall energy consumption decreases due to reduced demand. By 2035, green electricity consumption in the CM1 scenario is 16.64 million tce, with a share of 45.95%, and 15.10 million tce by 2060, with a share of 78.78%. In the CM2 scenario, green electricity consumption is 15.10 million tce by 2035 and 23.71 million tce by 2060, with proportions reaching 46.25% and 80.61%, respectively.

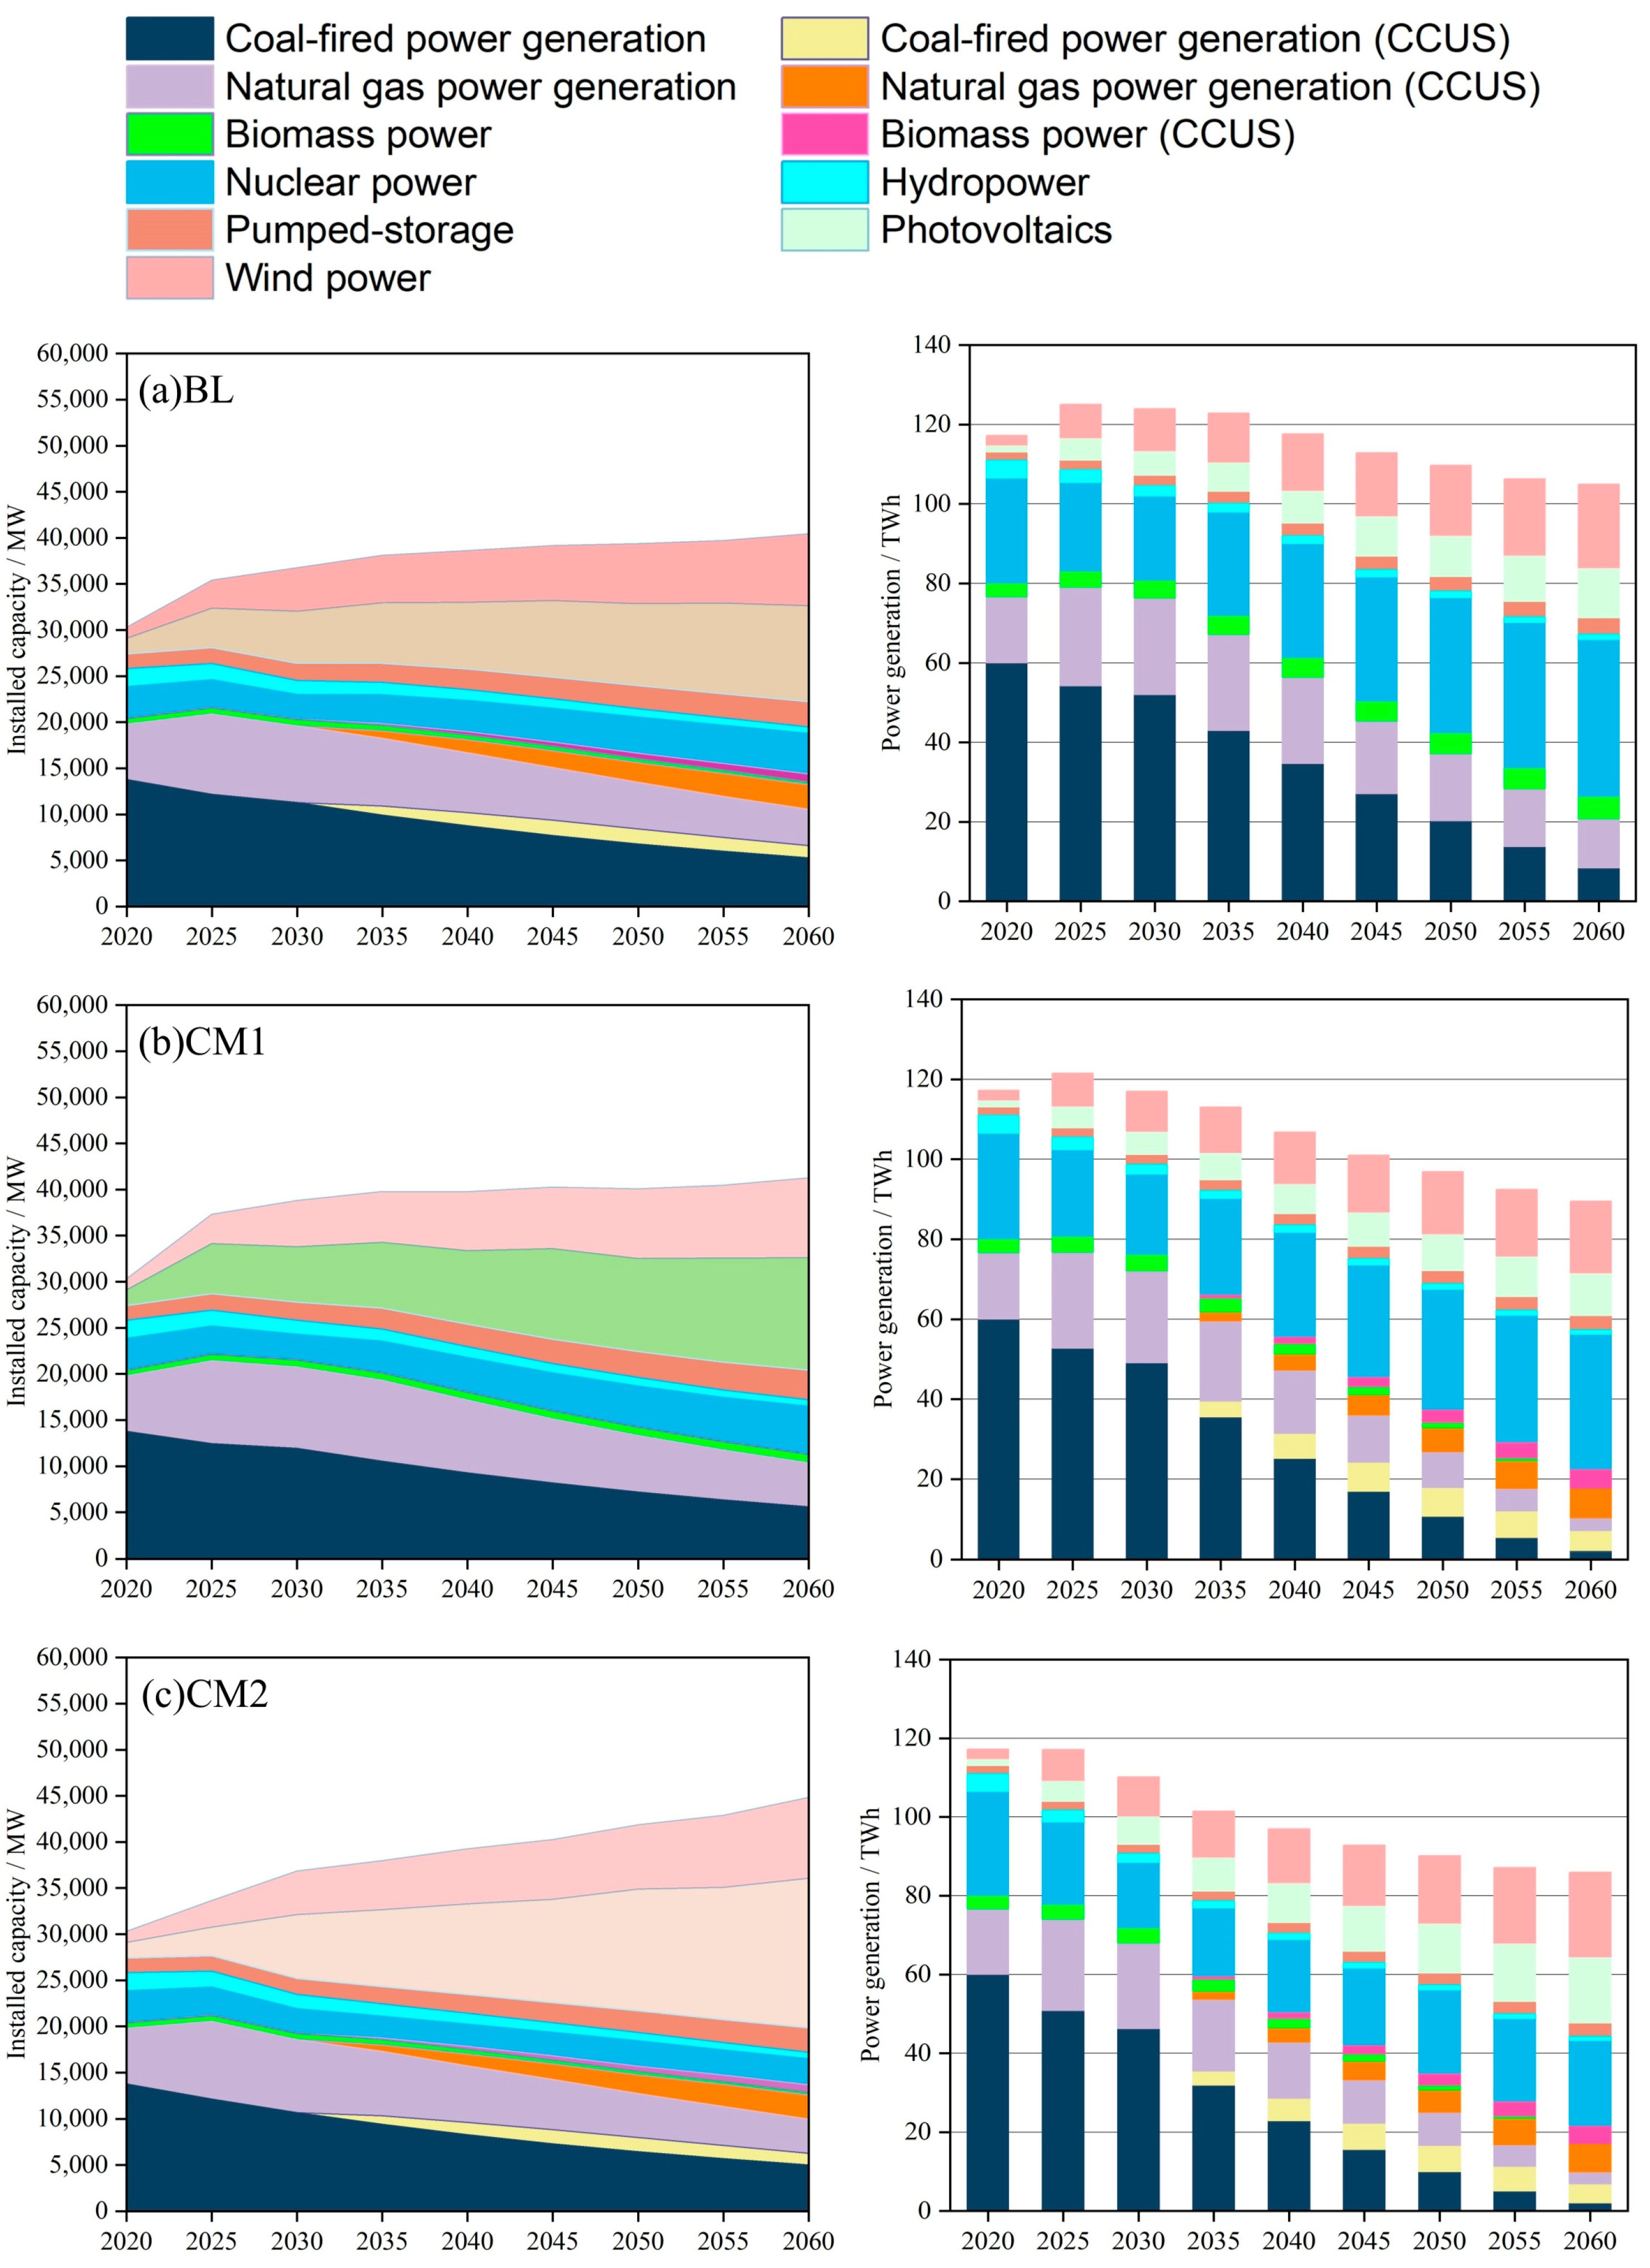
4.2.2. Power Supply Analysis

With the changes in service demands at rural consumption endpoints, different scenarios exhibit varying trends in installed capacity and power generation, as shown in Figure 7. In the base year of 2020, the total installed capacity was 30.31 GW, and the total power generation was 117.22 TWh. In the BL scenario, the installed capacity of coal and gas power plants peaks at 21.44 GW in 2025, decreasing to 10.35 GW by 2060, with their share of total generation dropping to 19.80%. Meanwhile, photovoltaic and wind power capacities show significant increases, with photovoltaic installed capacity in 2060 being 7.16 times that of 2020, reaching 12.18 GW, and its generation reaching 12.59 TWh, accounting for 12% of total generation. Wind power installed capacity is 7.09 times that of 2020, reaching 8.55 GW, with generation reaching 20.98 billion kilowatt-hours, accounting for 20% of total generation. In the BL scenario, the total installed capacity in 2060 is 41.16 GW, with a total power generation of 104.92 TWh. The share of green electricity installed capacity is 66.93%, with its generation accounting for 80.20%, indicating that the power structure is primarily based on nuclear and renewable energy with fossil fuels as supplementary.
The CM1 scenario incorporates large-scale CCUS technology, resulting in a significant reduction in the scale of retiring coal power compared to the BL scenario, with 6.60 GW retiring by 2060. In the CM2 scenario, the installed capacity of nuclear power grows to 2.81 GW, accounting for 25% of total generation, which is a significant decrease compared to the BL scenario, with the reduced share of nuclear power being offset by wind and photovoltaic power. In the CM2 scenario, the scale of retiring coal power increases to 7.25 GW, with wind and photovoltaic installed capacities rising to 8.76 GW and 16.22 GW, respectively, and biomass power capacity increasing to 1.12 GW. The share of installed capacity for green electricity reaches 71.98%, with its generation share rising to 80.10%. The CM2 scenario achieves a power structure dominated by renewable energy, with nuclear power and CCUS-enhanced fossil power as supplementary sources, and traditional fossil power serving as a flexible peak-shaving source. Given the increased proportion of green electricity capacity and generation, along with the large scale of coal power retirement, the CM2 scenario represents the optimal technological path for power supply. By expanding the installation of wind and photovoltaic green electricity, the retirement of coal power while is accelerated while retaining some capacity for flexible peak-shaving and a certain scale of biomass power to serve as zero-carbon or negative-carbon sources is configured to achieve net zero emissions [33,34].

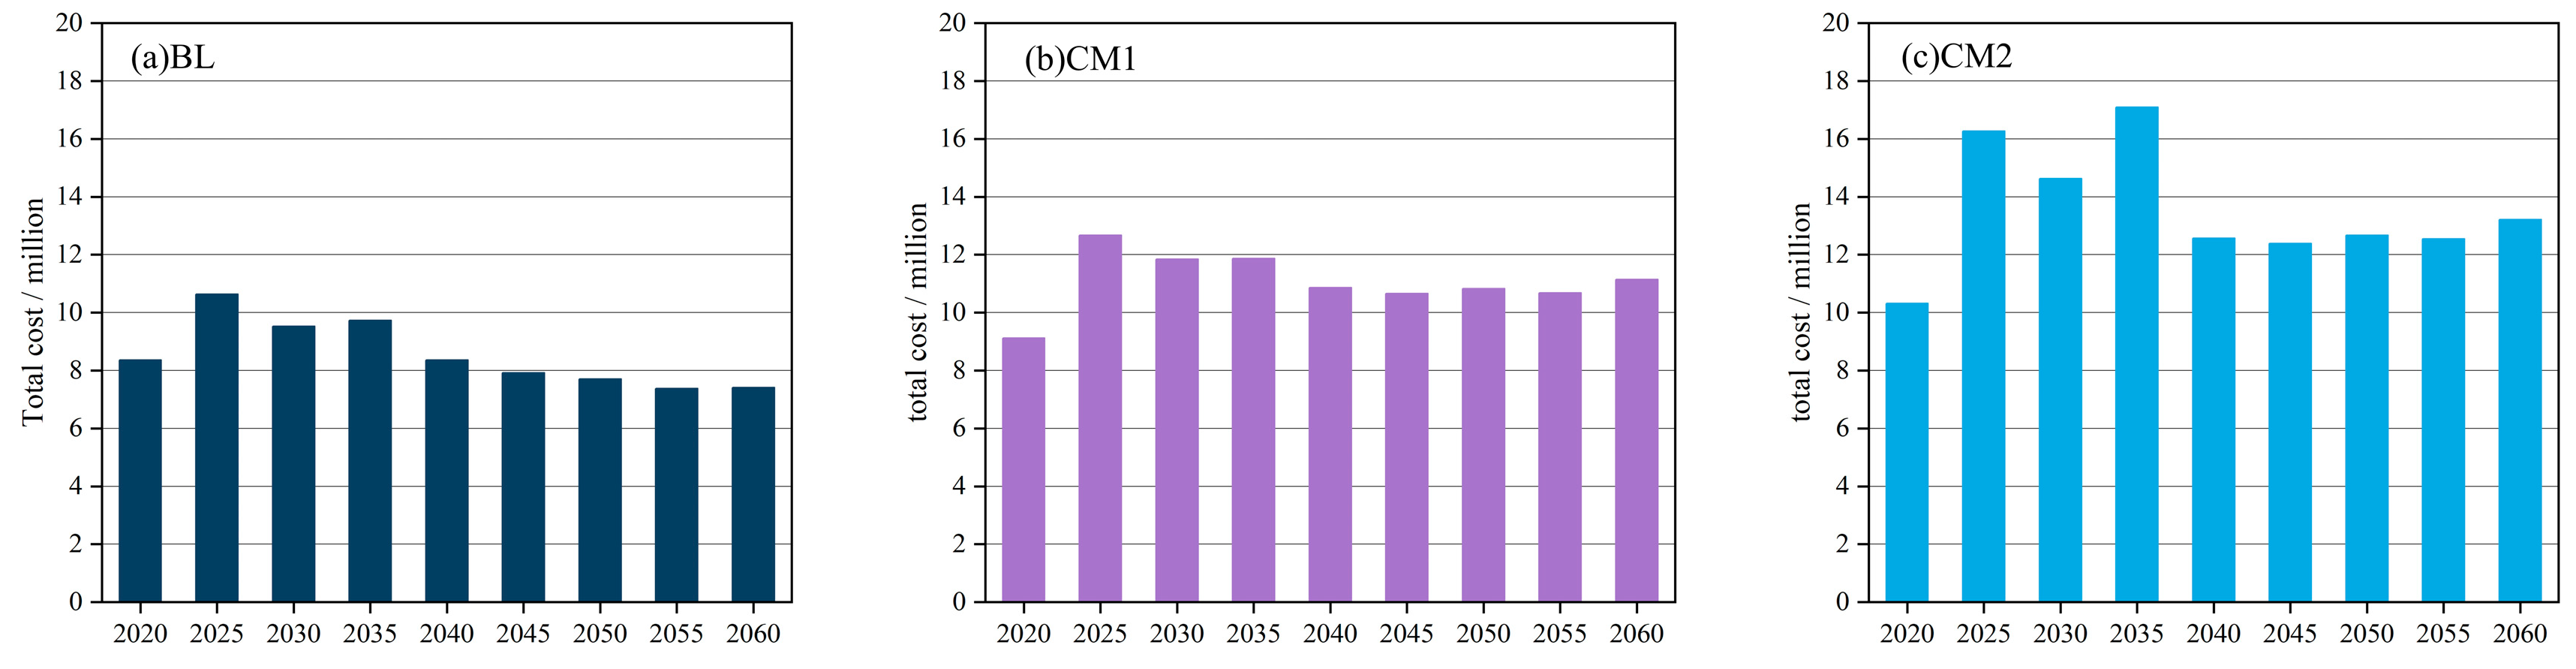
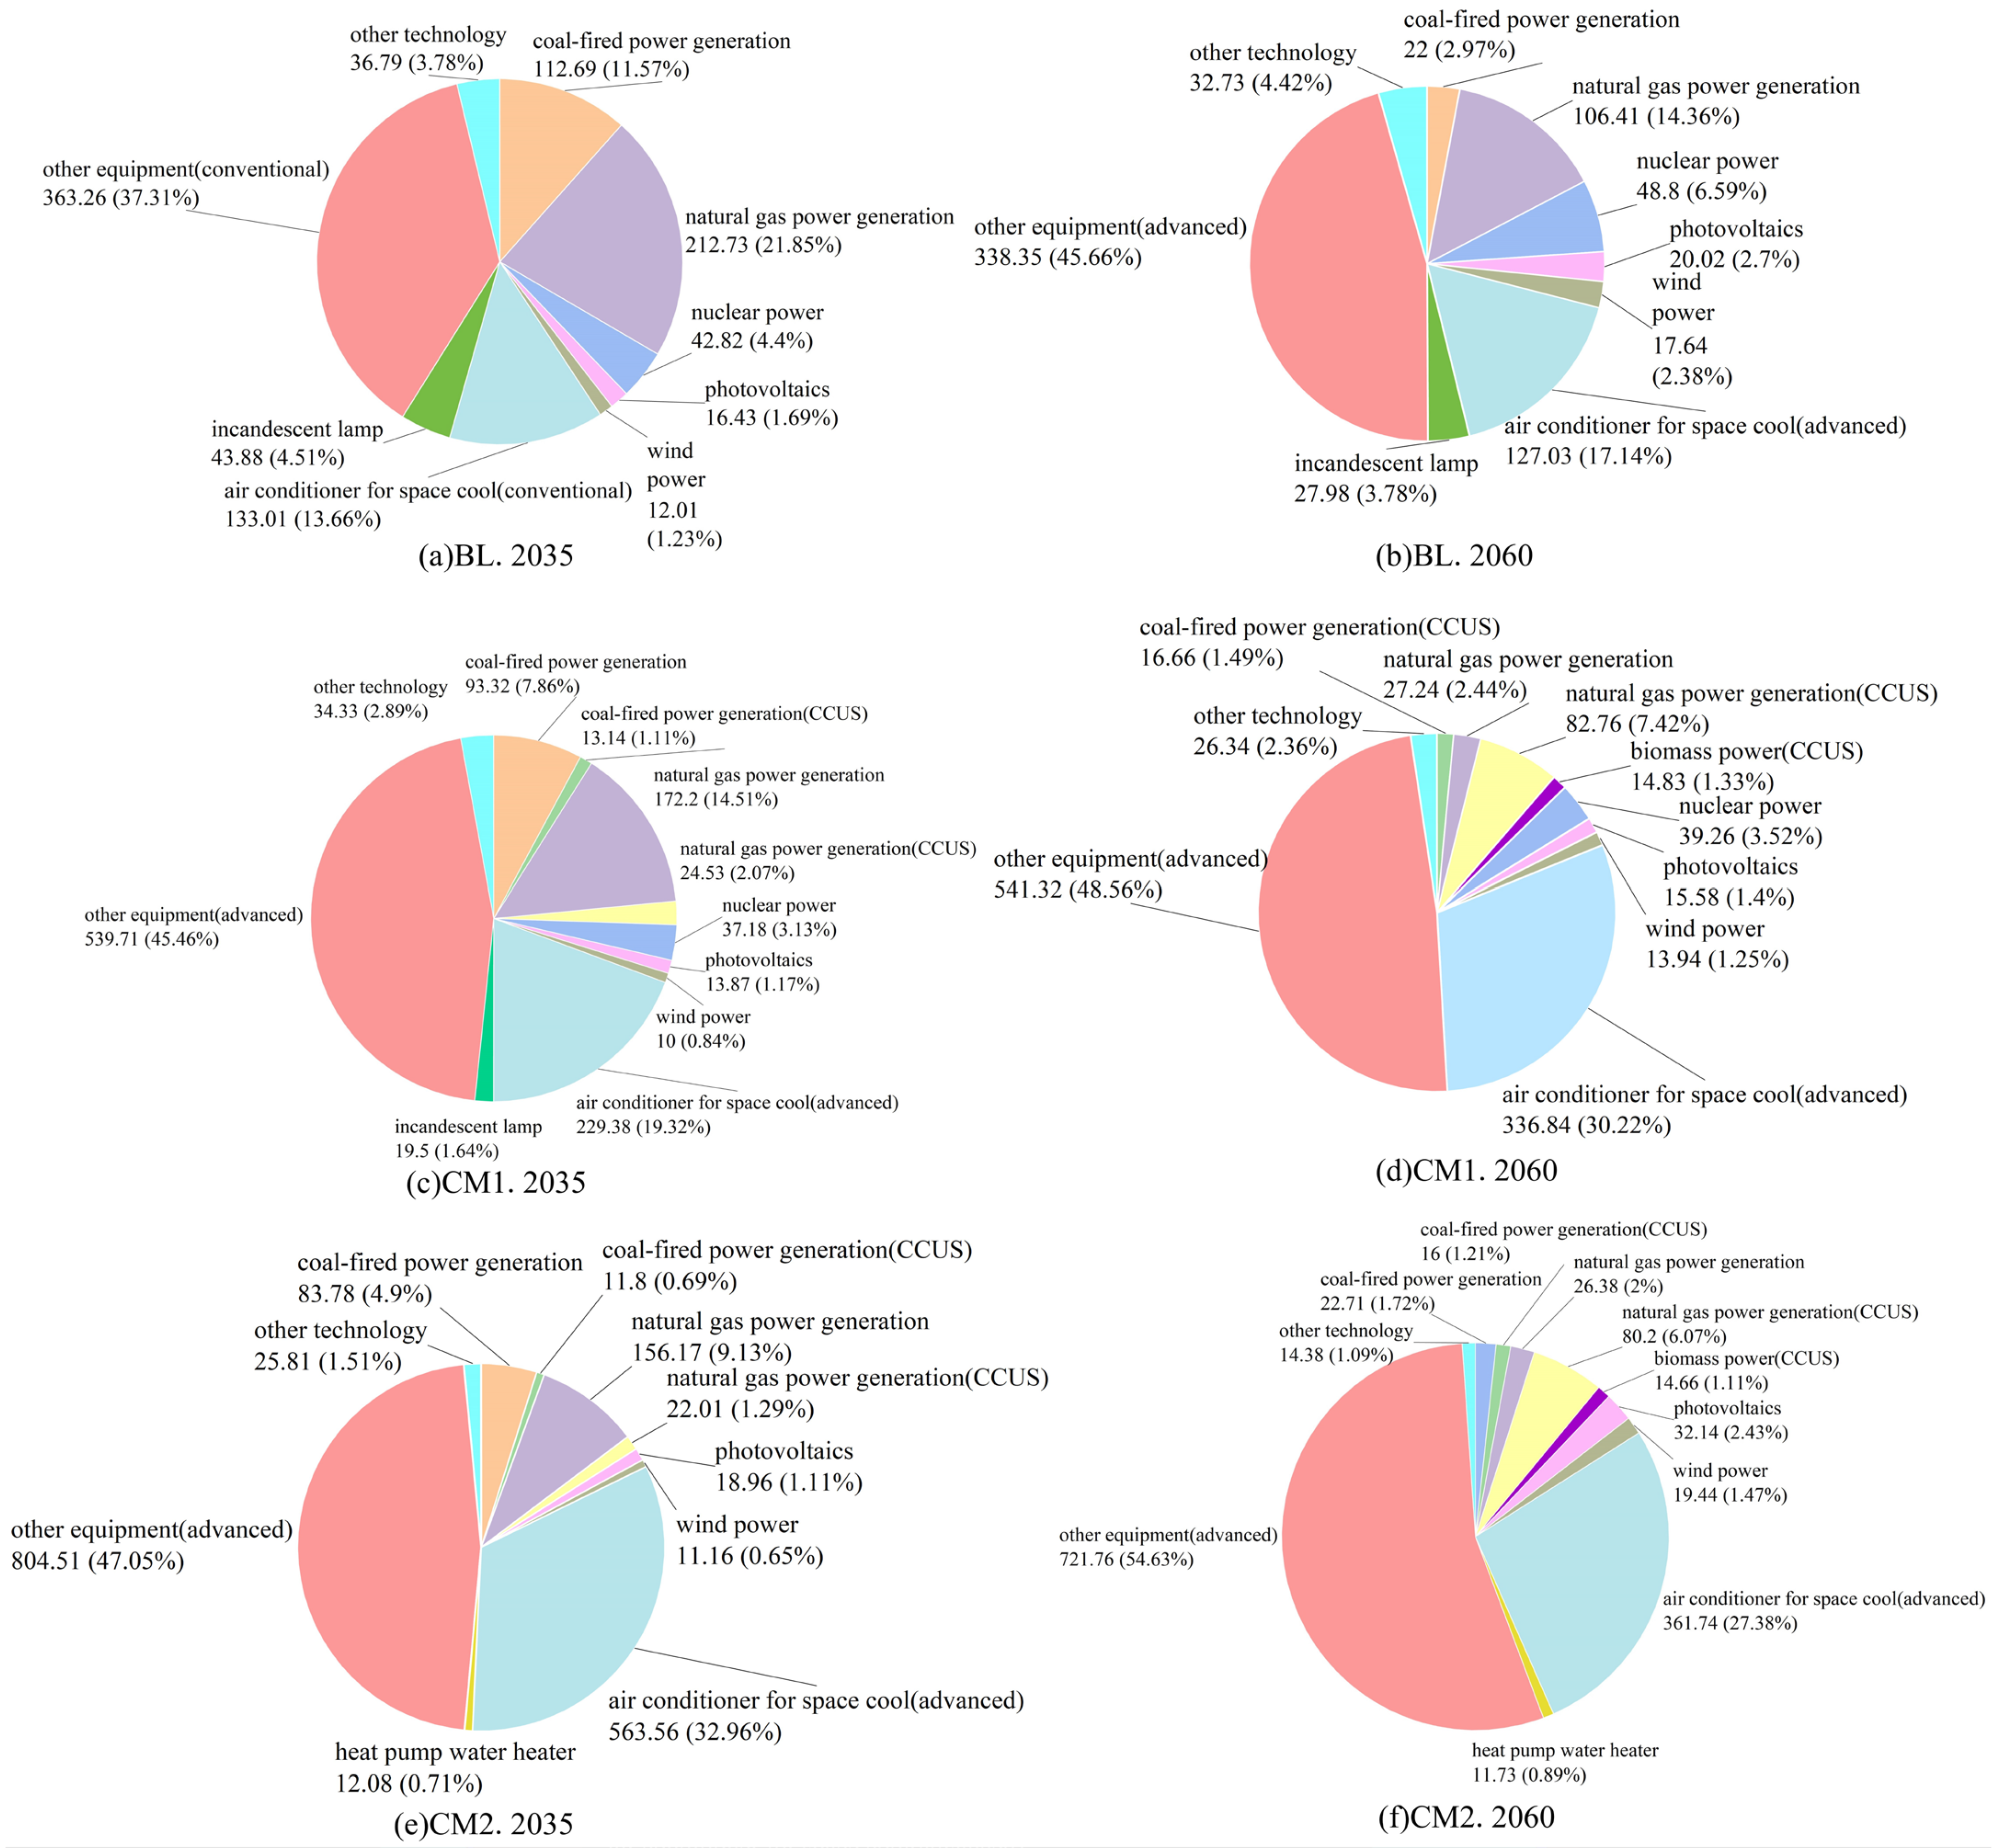
4.3. Total Cost Analysis

The purpose of this paper is to explore the most economically viable green and low-carbon development path. The model uses the minimization of the total annual cost during the planning period as the objective function. The total cost includes the purchase cost or initial investment cost, operation and maintenance cost, and energy cost of end-use energy equipment for rural residents. Through the comparative analysis of the total cost and cost structure in each scenario, the cost demand and change trend are analyzed. The total cost in the key years of the three scenarios is shown in Figure 8 and Figure 9.
Since both the CM1 and CM2 scenarios involve equipping coal-fired power, gas-fired power, and biomass power generation with CCUS technology based on the BL scenario, the total cost of the two scenarios is higher than that of the BL scenario. Moreover, the total cost of the CM2 scenario is also higher than that of the CM1 scenario. The total cost of the BL scenario shows a trend of increasing first and then decreasing. It was 8.3575 million yuan in 2020, peaked at 10.6327 million yuan in 2025, and then dropped to 7.4096 million yuan in 2060. In the BL scenario, the component with the smallest proportion of the total cost is the traditional kerosene stove, which has always been kept below 0.05%. The component with the largest proportion of the total cost is other equipment (advanced type), which accounted for as high as 42.07% in 2020 and increased to 45.66% in 2060. The significant increase in the total cost in the BL scenario in 2025 compared with that in 2020 is also related to the cost increase in other equipment (advanced type) and gas-fired power equipment. The total cost of other equipment (advanced type) increased from 3.5158 million yuan in 2020 to 3.8797 million yuan in 2025, and the total cost of gas-fired power equipment increased from 1.7246 million yuan in 2020 to 2.3141 million yuan in 2025. There was a significant decrease in 2040 compared with 2035, mainly due to the cost reduction in coal-fired power equipment, gas-fired power equipment, and traditional air-conditioning refrigerators, which decreased by 0.2176, 0.2512, and 0.2088 million yuan, respectively.
The CM1 scenario has a similar trend to the BL scenario, showing a trend of increasing first and then decreasing. It was 9.1213 million yuan in 2020, peaked at 12.6776 million yuan in 2025, and then dropped to 11.1476 million yuan in 2060. In the CM1 scenario, the total cost of coal-fired power, gas-fired power, and biomass power generation equipped with CCUS technology increased from 0.3552 million yuan in 2035 to 1.1085 million yuan in 2060. The total cost in the CM1 scenario decreased in 2030 compared with 2025, mainly due to the cost reduction in photovoltaic equipment, gas-fired power equipment, and wind power equipment, which decreased by 0.2490, 0.2375, and 0.1667 million yuan, respectively. There was a significant decrease in 2040 compared with 2035, mainly related to the cost reduction in other equipment (advanced type), gas-fired power equipment, and coal-fired power equipment, which decreased by 0.8841, 0.3644, and 0.2729 million yuan respectively. The total cost changes in the BL scenario and the CM1 scenario from 2040 to 2060 were both gradually decreasing and relatively stable.
The total cost of the CM2 scenario was 10.3173 million yuan in 2020, peaked at 17.0984 million yuan in 2035, and tended to be stable from 2040 to 2060, maintaining around 13 million yuan, with the total cost in 2060 being 13.2113 million yuan. In the CM2 scenario, the total cost of coal-fired power, gas-fired power, and biomass power generation equipped with CCUS technology increased from 0.3980 million yuan in 2035 to 1.1424 million yuan in 2060. The significant cost increase in the CM2 scenario in 2025 was mainly due to the large-scale application of advanced air-conditioning refrigerators and the further increase in the proportion of other equipment (advanced type). The total cost of advanced air-conditioning refrigerators was as high as 4.5887 million yuan in 2025, dropped to 3.4863 million yuan in 2030, further increased to 5.6356 million yuan in 2035, and stabilized around 3.5 million yuan from 2040 to 2060. Meanwhile, the cost of other equipment (advanced type) was 8.0451 million yuan in 2035 and decreased by 2.0278 million yuan in 2040, which further led to the peak of the total cost in 2035. Moreover, the total cost dropped to 12.6734 million yuan in 2040.

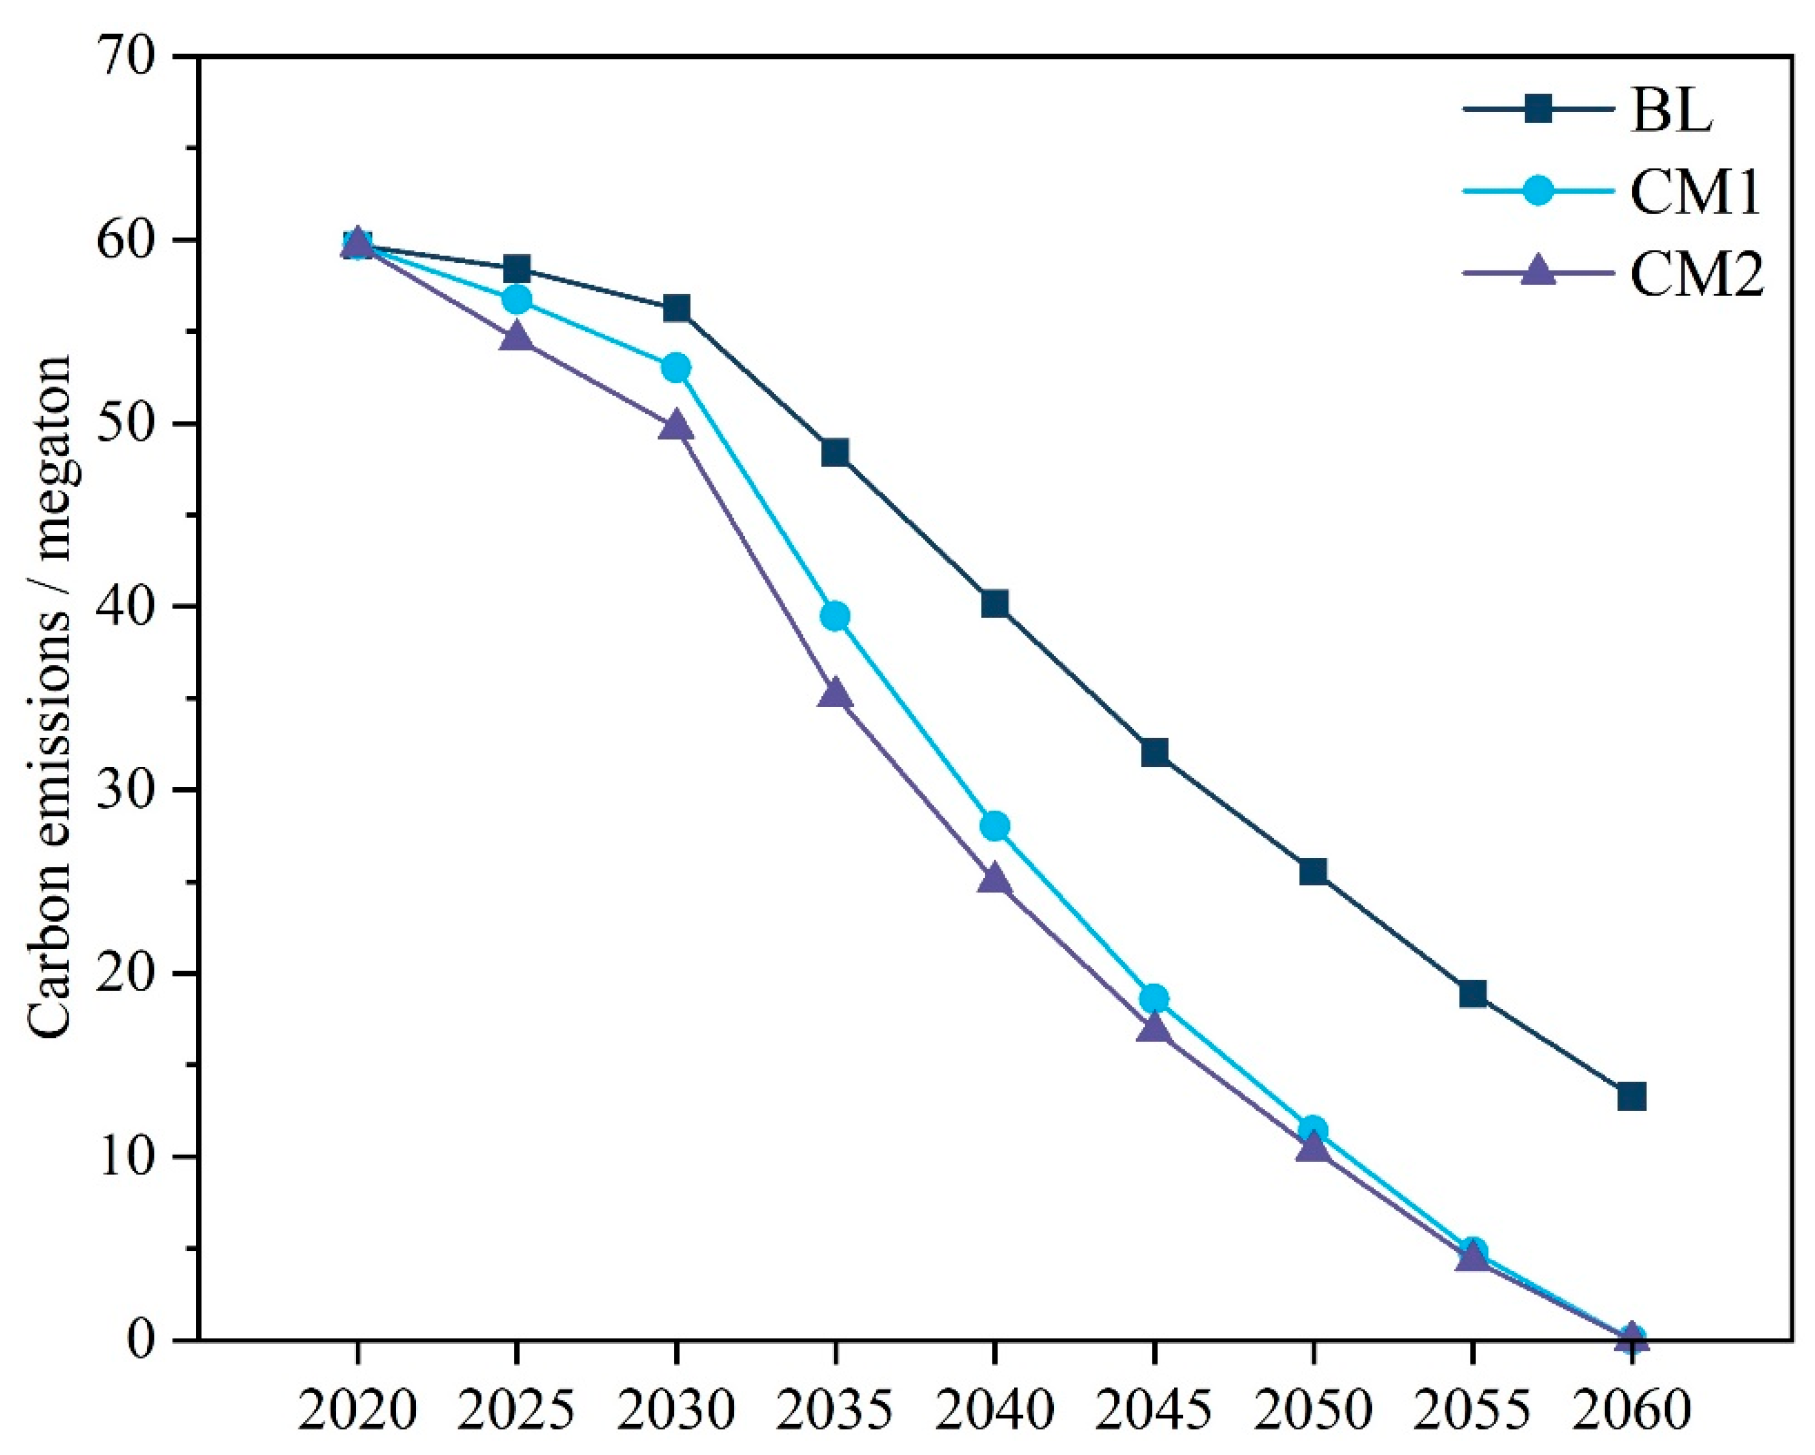
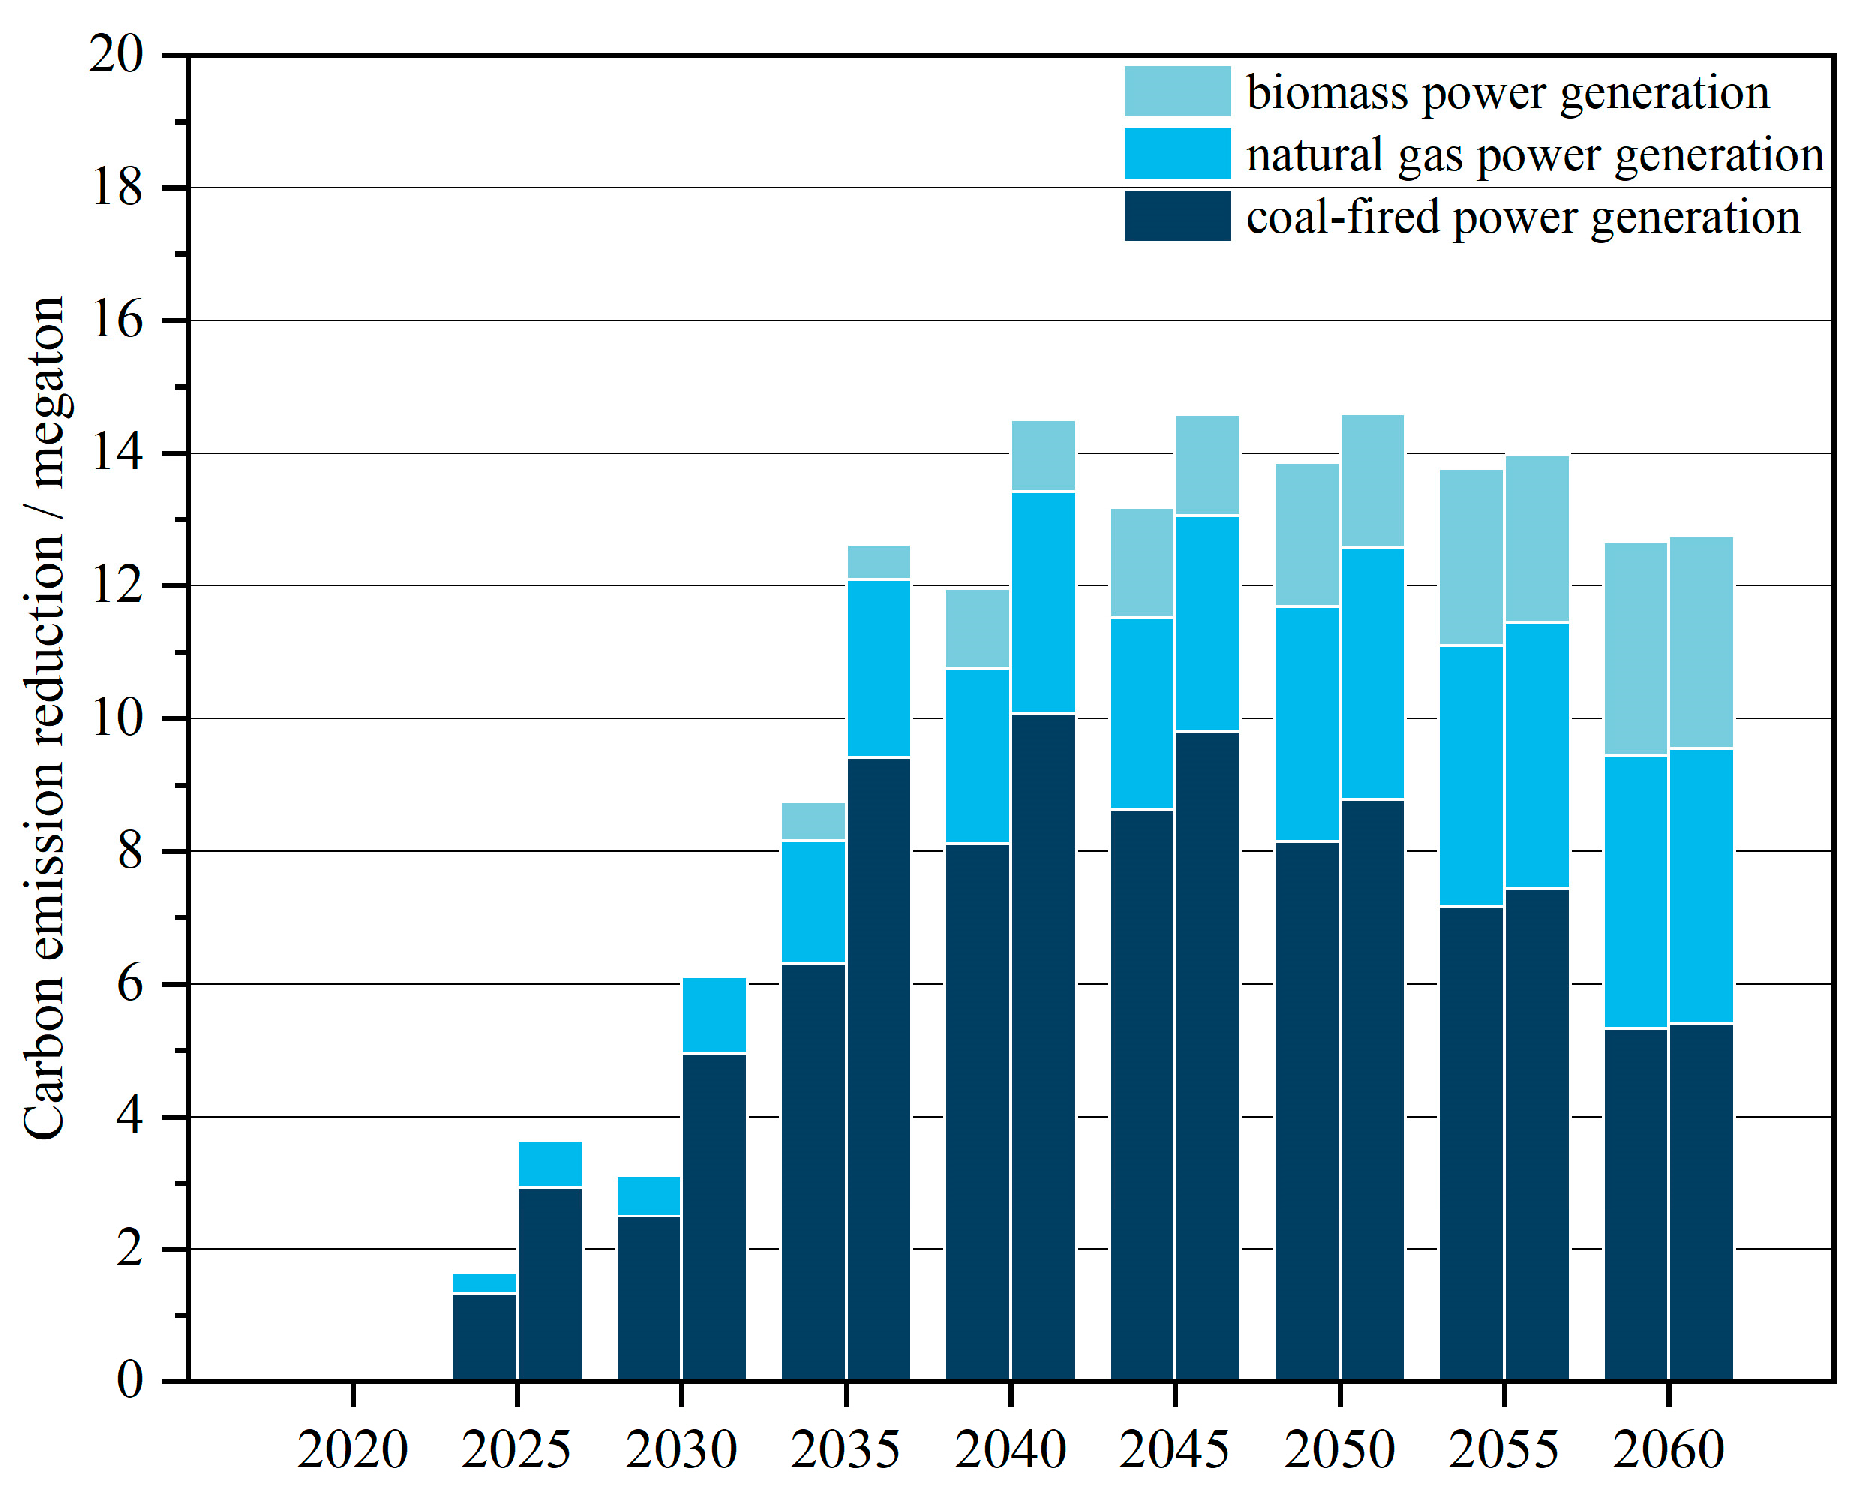
4.4. Carbon Emission Analysis

In this part, the carbon emission levels of each scenario are compared and analyzed year by year. Electricity is the dominant energy source for achieving carbon neutrality in rural areas by 2060, with the focus of net zero carbon emissions shifting from end-use by rural residents to upstream power generation supply. According to the model results shown in Figure 10, total carbon emissions in rural areas exhibit a downward trend across all three scenarios due to increasing urbanization rates, the large-scale adoption of advanced technologies, and a higher share of green electricity in installed capacity and generation. The carbon emissions in the base year 2020 amount to 59.69 million tons. In the BL scenario, carbon emissions decrease to 13.28 million tons by 2060. Furthermore, due to the implementation of CCUS technology, both the CM1 and CM2 scenarios achieve carbon neutrality by 2060. Both the CM1 and CM2 scenarios build on the BL scenario by incorporating CCUS technology into coal, gas, and biomass power generation. In the CM1 scenario, the shares of these three power generation technologies in 2035 are 8.96%, 9.93%, and 19.19%, respectively, and increase to 20.22%, 40.81%, and 71.05% by 2060. Compared to CM1, the CM2 scenario shows a slight increase in the shares of these technologies, reaching 20.36%, 41.36%, and 71.44% by 2060. The CM2 scenario consistently achieves lower carbon emissions across the optimization years, though from 2055 onward, carbon emission levels in CM1 and CM2 are nearly equivalent. Additionally, biomass power with CCUS plays a significant role in negative carbon emissions. To achieve carbon neutrality, the share of biomass CCUS technology must account for at least 71% of the total installed capacity.
Relative to the BL, the achievable carbon reductions from coal, gas, and biomass power generation of CM1 and CM2 are illustrated in Figure 11, respectively. The bar charts for each key year show the achievable reductions for CM1 on the left and CM2 on the right. The total reduction amount initially increases and then decreases over the years, with the greatest contribution coming from coal power. In the CM1 scenario, the peak reduction occurs in 2045 at 8.63 million tons, decreasing to 5.33 million tons by 2060. In the CM2 scenario, the achievable carbon reduction is higher, peaking at 10.08 million tons in 2040 and falling to 5.40 million tons by 2060. Biomass power with CCUS technology, introduced in 2030, shows a continuous increase in both its contribution to carbon reduction and its share. By 2060, the carbon reduction contribution from biomass power is 3.23 million tons in the CM1 scenario and 3.30 million tons in the CM2 scenario, with the gap in carbon reduction between the two scenarios gradually narrowing.

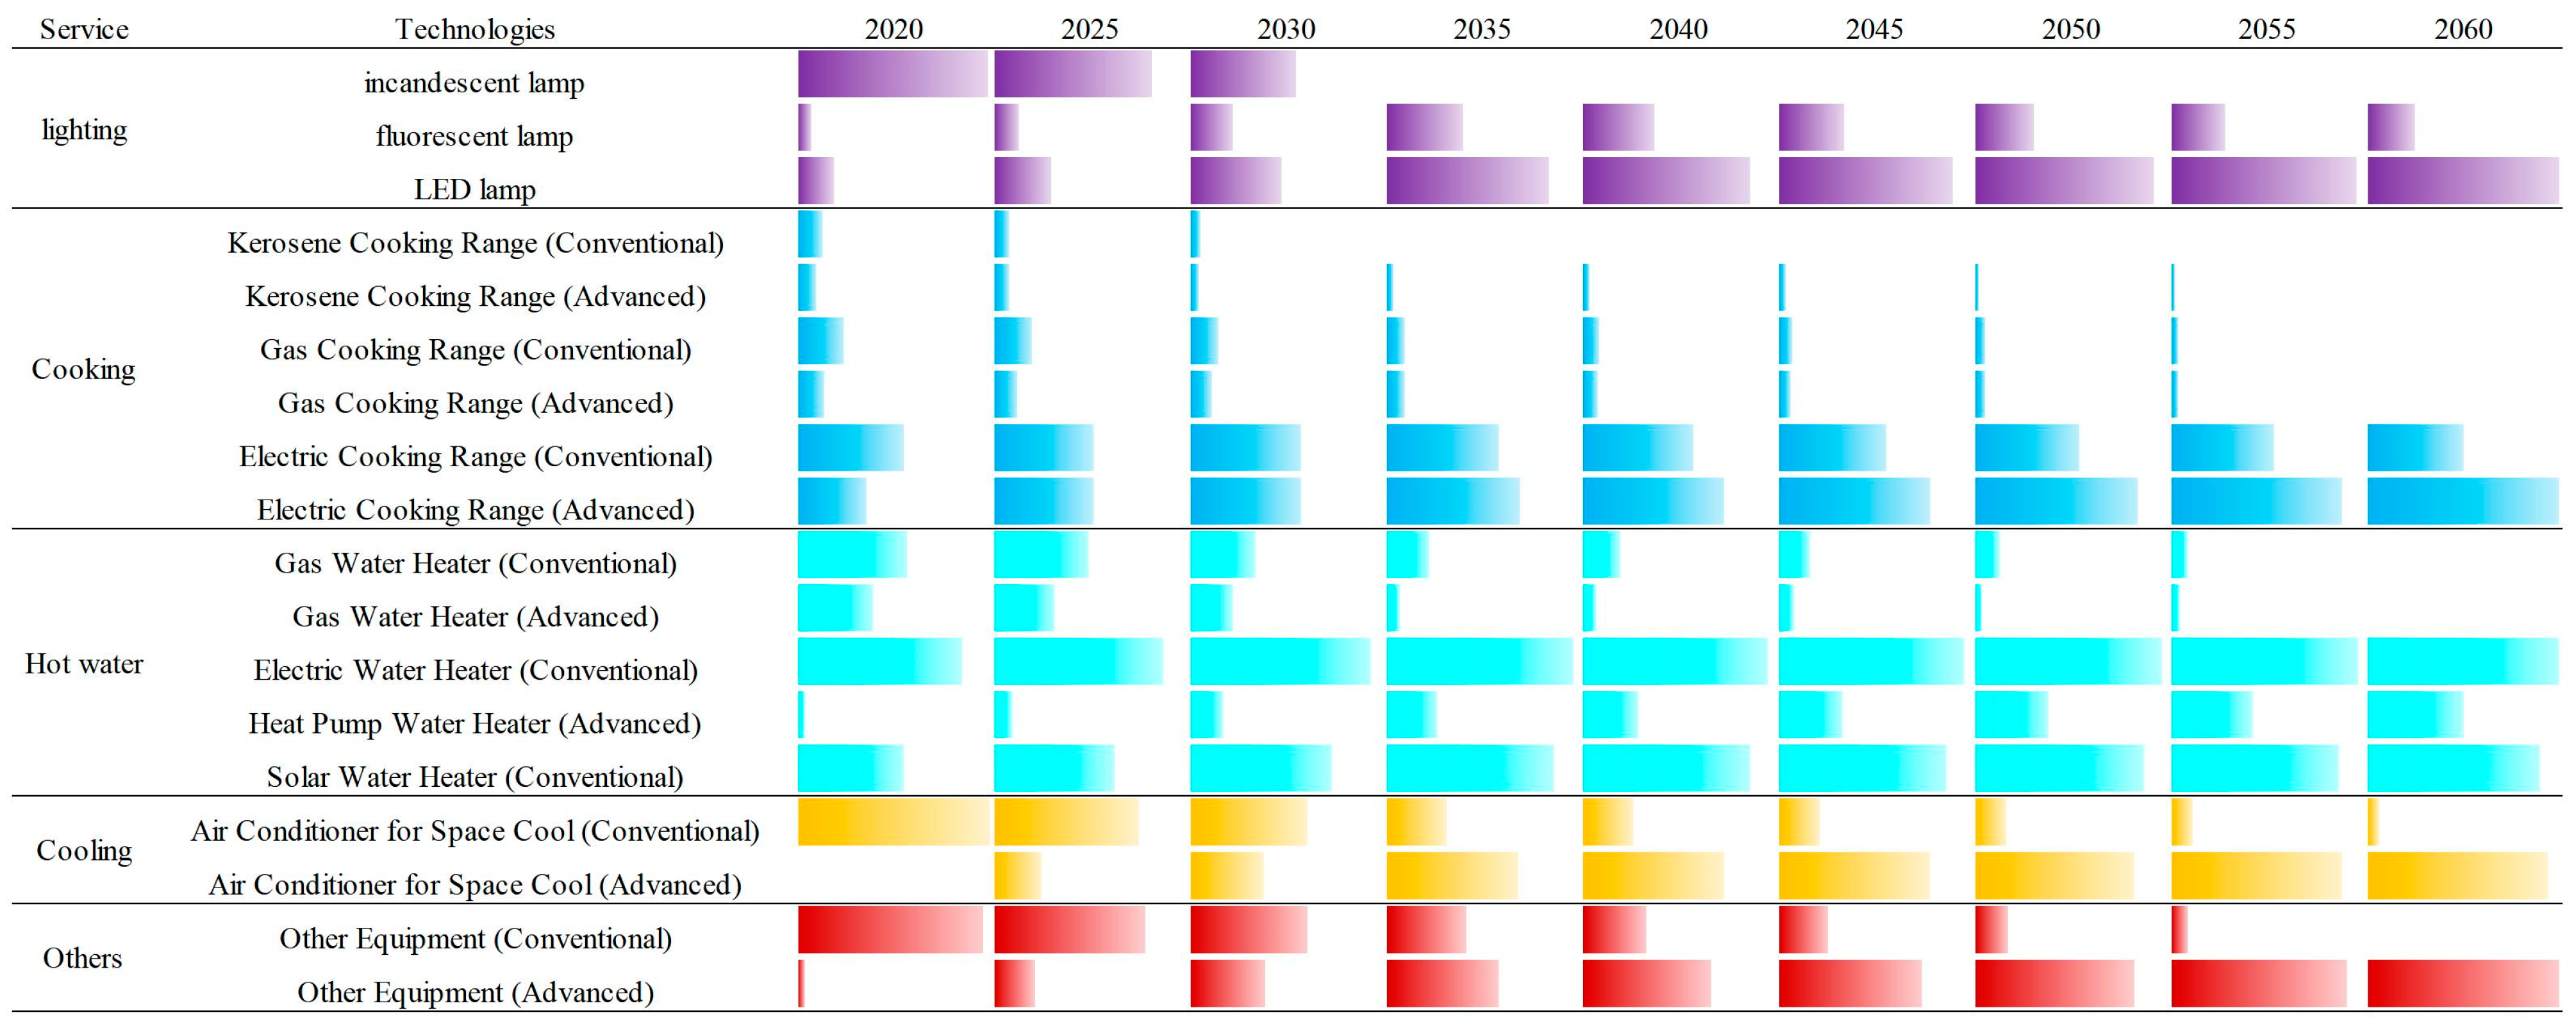
4.5. Low Carbon Path for Energy Development

This study has established three scenarios—baseline scenario (BL), low-carbon scenario (CM1), and green low-carbon scenario (CM2)—based on different levels of energy-saving and carbon reduction implementation efforts. In Section 4, the energy consumption for various demands is assessed by considering the trends of population growth, urbanization rate, and the development trend of residential building area, combined with residents’ consumption level and electrification level. The preset parameters for different scenarios down to each demand in the model are shown in Table 3. The model constructed in this study selects the technology combination that minimizes system cost within a linear optimization framework, under the conditions of meeting service demands, carbon emission constraints, and other system constraints to satisfy the energy demand of the target year. Based on the model’s results, the development paths based on the promotion of electrification for each of the three scenarios can be obtained, respectively, with the specific parameters for each key year shown in the following list.
Figure 12 presents the specific parameters for the changes in technology adoption ratios under the BL scenario. Compared with the preset parameters, it can be observed that, under the constraints of cost minimization and carbon emissions, the technologies available to rural residents can meet the demands for cooking utensils, hot water, cooling, and other equipment. Among these, there is a significant change in the technology adoption ratio for lighting. In 2035, the proportions of fluorescent lamps and LED lamps are 72% and 19%, respectively, while in 2060, they are 61% and 25%. This indicates that fluorescent lamps remain the dominant technology for lighting among rural residents in Guangdong Province. In the baseline scenario, the dominant technologies for the demands of cooking utensils, hot water, cooling, and other equipment in 2035 are traditional electric cookers, traditional electric water heaters, traditional air-conditioning coolers, and other equipment (traditional type). By 2060, only advanced electric cookers gradually become the technology equipment with the largest proportion in this demand, while the other demands remain unchanged.
Figure 13 presents the specific parameters for the changes in technology adoption ratios under the low-carbon scenario (CM1). Compared with the baseline scenario, it can be observed that in 2035, the proportions of fluorescent lamps and LED lamps in lighting demand further increased, with the proportions of incandescent lamps, fluorescent lamps, and LED lamps being 44%, 28%, and 28%, respectively. For hot water demand, the proportion of advanced heat pump water heaters is 5%, which is far from the preset value of 17%. In 2060, the technologies of incandescent lamps and traditional kerosene stoves are phased out, and the proportion of advanced heat pump water heaters in hot water demand is 11%, with no further increase. Compared with the baseline scenario, in 2035, the dominant technology for cooking utensil demand shifts to advanced electric cookers, at a proportion of 37%. In 2060, the dominant technology for lighting demand shifts to LED lamps, at a proportion of 68%.
Figure 14 presents the specific parameters for the changes in technology adoption ratios under the CM2. Compared with the baseline scenario, it can be observed that in 2035, the proportions of fluorescent lamps and LED lamps in lighting demand further increase, with the proportions of incandescent lamps, fluorescent lamps, and LED lamps being 44%, 28%, and 28%, respectively. For hot water demand, the proportion of advanced heat pump water heaters is 5%, which is far from the preset value of 17%. In 2060, the technologies of incandescent lamps and traditional kerosene stoves are phased out, and the proportion of advanced heat pump water heaters in hot water demand is 11%, with no further increase. Compared with the baseline scenario, in 2035, the dominant technology for cooking utensil demand shifts to advanced electric cookers, at a proportion of 37%. In 2060, the dominant technology for lighting demand shifts to LED lamps, at a proportion of 68%.

5. Conclusions

This paper develops the RG-Enduse model, tailored for rural areas in Guangdong Province, based on the AIM/Enduse framework. The model segments energy demand on the demand side into various services used by rural residents and further details the technologies and equipment employed by these residents. It also incorporates an analysis of the power supply side, exploring the energy supply-demand coordination paths under the rural revitalization context through BL, CM1, and CM2 scenarios. A comparative analysis of energy consumption and carbon emissions is conducted, and the following conclusions are reached:
(1) On the energy consumption demand side, the potential increase in energy consumption due to improved living standards can almost be offset by improvements in technological efficiency and changes in population structure. Energy demand in rural areas peaks in 2025 in both the BL and CM1 scenarios, reaching 17.46 million tce and 14.35 million tce, respectively. In the CM2 scenario, energy consumption in rural areas continually decreases from 13.87 million tce in 2020 to 9.77 million tce by 2060.
(2) On the energy supply demand side, due to the reduction in energy consumption demand, the consumption demand for electricity in rural areas is on a downward trend. The primary energy required for the electricity supply in CM2 scenario peaks in 2023 at 36.86 million tce and falls to 30.10 million tce by 2060, with green electricity consumption reaching 23.71 million tce, accounting for 80.61%.
(3) Regarding power supply analysis, CCUS technology will help traditional fossil power serving as a flexible peak-shaving source to support the development of a high proportion of renewable energy. The CM2 scenario represents the optimal technological path for power supply with the proportion of installed capacity for green electricity reaches 71.98%.
(4) Total carbon emissions in rural areas show a decreasing trend across all three scenarios. The application of CCUS technology and green power is the primary contribution of CM1 and CM2 to achieving carbon neutrality.
Based on these conclusions, the following targeted recommendations are proposed for both rural residents’ demands and power supply:
(1) Addressing various demands and technologies, advanced technologies in rural areas should be actively promoted, such as photovoltaic, solar thermal, and air source heat pump technologies. The adoption of smart lighting systems, kitchen electrification, and efficient cooking appliances should be enhanced to increase the level of electrification in rural households. Additionally, financial subsidies, tax incentives, or technical support for rural residents should be implemented to reduce the costs of technology replacement.
(2) Power supply should involve the large-scale deployment of CCUS technology and the rapid development of wind and photovoltaic green electricity technologies to achieve carbon neutrality. Furthermore, the development of a complementary approach between thermal power and green electricity, such as transforming thermal power from a primary generation source to a flexible peak-shaving resource, is also a transformation paths that can be used to ensure the security of the power supply.
This study only discusses the energy consumption of rural residents’ daily lives, without considering the energy consumption of rural production on a larger scale. At the same time, coupling rural energy consumption with electricity supply alone may have other influencing factors that have not been taken into account in this process. Future research will include rural production, rural transportation, and other fields to provide more comprehensive research and suggestions for the development path of rural areas. In addition, specific consideration can be given to power transmission between cities, refining the transmission and supply capacity of green electricity between regions, and promoting the coordinated development of renewable energy planning in various prefecture level cities in Guangdong Province.

Author Contributions

Conceptualization, M.L., Z.X. and J.Z.; methodology, Z.X., X.L. (Xiaoyu Liu), and P.W.; software, Z.X., Q.W. and R.D.; formal analysis, M.L., Z.X., X.L. (Xiaoyu Liu), Y.Z. and B.H.; investigation, M.L., Z.X., J.Z., X.L. (Xi Liu), and G.H.; data curation, Z.X. and X.L. (Xi Liu); writing—original draft preparation, M.L., Z.X. and X.L. (Xiaoyu Liu); writing—review and editing, M.L., Z.X., X.L. (Xiaoyu Liu), J.Z., Q.W., R.D., X.L. (Xi Liu), G.H., Y.Z., B.H. and P.W.; supervision, M.L., X.L. (Xiaoyu Liu), J.Z. and P.W.; project administration, M.L., J.Z. and P.W.; funding acquisition, P.W. All authors have read and agreed to the published version of the manuscript.

Funding

This research was funded by the Innovation Project supported by China Southern Power Grid Corp (YNKJXM20230014).

Institutional Review Board Statement

Not applicable.

Informed Consent Statement

Not applicable.

Data Availability Statement

All data that support the findings of this study are included within the article. Other related data associated with this study could be available if the readers raise such a request.

Conflicts of Interest

Minwei Liu was employed by Yunnan Power Grid Corp. Jincan Zeng, Qin Wang, Rongfeng Deng, Xi Liu, Guori Huang, Yuanzhe Zhu and Binghao He were employed by China Southern Power Grid. The remaining authors declare that this research was conducted in the absence of any commercial or financial relationships that could be construed as potential conflicts of interest.

References

  1. Zhong, X.; Yang, H.; Yang, K.; Xu, J. Development of a New-Type Multiple-Source Heat Pump with Two-Stage Compression. J. Therm. Sci. 2019, 28, 635–642. [Google Scholar]
  2. Zhang, L.; Yang, Z.; Chen, B.; Chen, G. Rural energy in China: Pattern and policy. Renew. Energy 2009, 34, 2813–2823. [Google Scholar]
  3. Gu, Y.; Zhang, W.; Yang, Y.; Wang, C.; Streets, D.G.; Yim, S.H.L. Assessing outdoor air quality and public health impact attributable to residential black carbon emissions in rural China. Resour. Conserv. Recycl. 2020, 159, 104812. [Google Scholar]
  4. Chu, W.; Xiao, H. Energy Consumption Structure of Chinese Rural Household: A Meta Approach. J. China Univ. Geosci. 2018, 18, 23–35. [Google Scholar]
  5. Zhu, X.; Yun, X.; Meng, W.; Xu, H.; Du, W.; Shen, G.; Cheng, H.; Ma, J.; Tao, S. Stacked Use and Transition Trends of Rural Household Energy in Mainland China. Environ. Sci. Technol. 2018, 53, 521–529. [Google Scholar] [CrossRef]
  6. Li, H.; Zhao, Y.; Wang, S.; Liu, Y. Spatial-temporal characteristics and drivers of the regional residential CO2 emissions in China during 2000–2017. J. Clean. Prod. 2020, 276, 124116. [Google Scholar]
  7. Yao, C.; Chen, C.; Li, M. Analysis of rural residential energy consumption and corresponding carbon emissions in China. Energy Policy 2012, 41, 445–450. [Google Scholar]
  8. Zhang, L.X.; Wang, C.B.; Yang, Z.F.; Chen, B. Carbon emissions from energy combustion in rural China. Procedia Environ. Sci. 2010, 2, 980–989. [Google Scholar]
  9. Zhang, M.; Su, B. Assessing China’s rural household energy sustainable development using improved grouped principal component method. Energy 2016, 113, 509–514. [Google Scholar]
  10. Zhang, L.X.; Wang, C.B.; Bahaj, A.S. Carbon emissions by rural energy in China. Renew. Energy 2014, 66, 641–649. [Google Scholar]
  11. Zheng, X.; Wei, C.; Qin, P.; Guo, J.; Yu, Y.; Song, F.; Chen, Z. Characteristics of residential energy consumption in China: Findings from a household survey. Energy Policy 2014, 75, 126–135. [Google Scholar]
  12. Chen, H.; Huang, Y.; Shen, H.; Chen, Y.; Ru, M.; Chen, Y.; Lin, N.; Su, S.; Zhuo, S.; Zhong, Q.; et al. Modeling temporal variations in global residential energy consumption and pollutant emissions. Appl. Energy 2016, 184, 820–829. [Google Scholar]
  13. Wang, S.; Hao, B.; Chen, X.; Peng, C. Investigation and Study on Residents’ Hot Water Demand and Energy Consumption Methods. Water Wastewater Eng. 2015, 51, 73–77. [Google Scholar]
  14. Zhang, N.; Xu, H.; Li, Z.; Li, T.; Xie, S.; Liu, S.; Xu, D.; Zhou, Y.; Zhou, H. Spatiotemporal evolution and driving factors of agricultural carbon emissions at county level in Guangdong Province based on machine learning. Chin. J. Eco-Agric. 2024, 32, 1994–2007. [Google Scholar]
  15. Chen, Y.; Shen, H.; Zhong, Q.; Chen, H.; Huang, T.; Liu, J.; Cheng, H.; Zeng, E.Y.; Smith, K.R.; Tao, S. Transition of household cookfuels in China from 2010 to 2012. Appl. Energy 2016, 184, 800–809. [Google Scholar]
  16. Zhou, M.; Liu, H.; Peng, L.; Qin, Y.; Chen, D.; Zhang, L.; Mauzerall, D.L. Environmental benefits and household costs of clean heating options in northern China. Nat. Sustain. 2022, 5, 329–338. [Google Scholar]
  17. Shen, G.; Xiong, R.; Tian, Y.; Luo, Z.; Jiangtulu, B.; Meng, W.; Du, W.; Meng, J.; Chen, Y.; Xue, B.; et al. Substantial transition to clean household energy mix in rural China. Natl. Sci. Rev. 2022, 9, nwac050. [Google Scholar]
  18. Lu, C.; Zhang, S.; Tan, C.; Li, Y.; Liu, Z.; Morrissey, K.; Adger, W.N.; Sun, T.; Yin, H.; Guo, J. Reduced health burden and economic benefits of cleaner fuel usage from household energy consumption across rural and urban China. Environ. Res. Lett. 2022, 17, 014039. [Google Scholar]
  19. Hu, X.; Lin, Z.; Huang, Y.; Chen, Y. Analysis of Carbon Emission Trends and Forecasts for Electricity in Southern China: Research based on STIRPAT Model. J. Technol. Econ. Manag. 2024, 9, 75–80. [Google Scholar]
  20. Wen, Z.; Chen, M.; Meng, F. Evaluation of energy saving potential in China’s cement industry using the Asian-Pacific Integrated Model and the technology promotion policy analysis. Energy Policy 2015, 77, 227–237. [Google Scholar]
  21. Liu, W.; Wang, C.; Mol, A.P. Rural residential CO2 emissions in China: Where is the major mitigation potential? Energy Policy 2012, 51, 223–232. [Google Scholar]
  22. Xu, T.; Li, Z.; Geng, Y.; Chen, W. Resource and environmental impacts of carbon emission reduction in China’s iron and steel sector under the carbon neutrality goal. Ziyuan Kexue 2024, 46, 700–716. [Google Scholar] [CrossRef]
  23. Ma, T.; Zhang, S.; Xiao, Y.; Liu, X.; Wang, M.; Wu, K.; Shen, G.; Huang, C.; Fang, Y.R.; Xie, Y. Costs and health benefits of the rural energy transition to carbon neutrality in China. Nat. Commun. 2023, 14, 6101. [Google Scholar]
  24. Jiang, H.; Yang, Q.; Dong, K. Socio-economic, energy, and environmental effects of low-carbon transition policies on China’s power industry. China Popul. Resour. Environ. 2022, 32, 30–40. [Google Scholar]
  25. Scalas, E.; Jeuland, M.A.; Pattanayak, S.K. Benefits and Costs of Improved Cookstoves: Assessing the Implications of Variability in Health, Forest and Climate Impacts. PLoS ONE 2012, 7, e30338. [Google Scholar]
  26. Wang, N.; Fu, X.; Wang, S. Spatial-temporal variation and coupling analysis of residential energy consumption and economic growth in China. Appl. Energy 2022, 309, 118504. [Google Scholar]
  27. Fan, J.-L.; Yu, H.; Wei, Y.-M. Residential energy-related carbon emissions in urban and rural China during 1996–2012: From the perspective of five end-use activities. Energy Build. 2015, 96, 201–209. [Google Scholar] [CrossRef]
  28. Daioglou, V.; Van Ruijven, B.J.; Van Vuuren, D.P. Model projections for household energy use in developing countries. Energy 2012, 37, 601–615. [Google Scholar]
  29. Wang, X.; Li, K.; Li, H.; Bai, D.; Liu, J. Research on China’s rural household energy consumption—Household investigation of typical counties in 8 economic zones. Renew. Sustain. Energy Rev. 2017, 68, 28–32. [Google Scholar]
  30. Xing, R.; Hanaoka, T.; Masui, T. Deep decarbonization pathways in the building sector: China’s NDC and the Paris agreement. Environ. Res. Lett. 2021, 16, 044054. [Google Scholar]
  31. Li, Q.T.; Gao, H. ColLaborative modelling between carbon market and electricity market based on carbon tax mechanism. Mod. Electron. Tech. 2024, 47, 76–84. [Google Scholar]
  32. Huang, Y.; Guo, H.; Liao, C.; Zhao, D. Study on low-carbon development path of urban transportation sector based on LEAP model—Take Guangzhou as an example. Adv. Clim. Change Res. 2019, 15, 670. [Google Scholar]
  33. Rui, D.; Gao, L.; Song, H.E.; Yang, D. Significance and challenges of CCUS technology for low-carbon transformation of China’s power industry. Power Gener. Technol. 2022, 43, 523. [Google Scholar]
  34. Feng, W.; Li, L. Research and practice on development path of low-carbon, zero-carbon and negative carbon transformation of coal-fired power units under “double carbon” targets. Power Gener. Technol. 2022, 43, 452. [Google Scholar]
Figure 1. RG-Enduse model architecture.
Sustainability 17 04055 g001
Figure 2. The technical framework of the RG-Enduse model.
Sustainability 17 04055 g002
Figure 3. Total energy consumption in rural areas under different scenarios.
Sustainability 17 04055 g003
Figure 4. Changes in energy consumption of various services for rural residents: (a) Space cooling demand; (b) Hot water demand; (c) Lighting demand; (d) Other demands.
Sustainability 17 04055 g004
Figure 5. Technical proportion of rural residents in different scenarios: (a) Technical proportion of BL scenario in 2040; (b) Technical proportion of CM1 scenario in 2040; (c) Technical proportion of CM2 scenario in 2040; (d) Technical proportion of BL scenario in 2060; (e) Technical proportion of CM1 scenario in 2060; (f) Technical proportion of CM2 scenario in 2060.
Sustainability 17 04055 g005
Figure 6. Energy consumption of electricity supply in different scenarios.
Sustainability 17 04055 g006
Figure 7. Installed capacity and power generation structure of power supply in different scenarios: (a) BL scenario; (b) CM1 scenario; (c) CM2 scenario.
Sustainability 17 04055 g007
Figure 8. Changes in total cost under different scenarios: (a) BL scenario; (b) CM1 scenario; (c) CM2 scenario.
Sustainability 17 04055 g008
Figure 9. Cost structure in different scenarios: (a) Cost structure of BL scenario in 2035; (b) Cost structure of CM1 scenario in 2035; (c) Cost structure of CM2 scenario in 2035; (d) Cost structure of BL scenario in 2060; (e) Cost structure of CM1 scenario in 2060; (f) Cost structure of CM2 scenario in 2060.
Sustainability 17 04055 g009
Figure 10. Total carbon emissions of rural residents in Guangdong Province.
Sustainability 17 04055 g010
Figure 11. Distribution of technological carbon emission reduction contribution of CM1 and CM2.
Sustainability 17 04055 g011
Figure 12. Changes in the proportion of baseline scenario technology.
Sustainability 17 04055 g012
Figure 13. Changes in the proportion of low-carbon scenario technologies.
Sustainability 17 04055 g013
Figure 14. Changes in the proportion of green and low-carbon scenario technologies.
Sustainability 17 04055 g014
Table 1. Model technical parameters.
TechnologyLifetime
(Years)
Initial Cost
(104 Yuan)
O/M Cost
(104 Yuan)
ServiceAnnual Utilization Rate (%)
Air Conditioner for Space Cool (Conventional)150.250Space cooling100
Air Conditioner for Space Cool (Advanced)150.50Space cooling100
Gas Water Heater
(Conventional)
150.10Hot water100
Gas Water Heater (Advanced)150.150Hot water100
Electric Water Heater
(Conventional)
150.220Hot water100
Heat Pump Water Heater
(Advanced)
150.50Hot water100
Solar Water Heater
(Conventional)
150.250Hot water100
Kerosene Cooking Range (Conventional)150.010Cooking100
Kerosene Cooking Range
(Advanced)
150.020Cooking100
Gas Cooking Range
(Conventional)
150.030Cooking100
Gas Cooking Range
(Advanced)
150.060Cooking100
Electric Cooking Range
(Conventional)
150.020Cooking100
Electric Cooking Range
(Advanced)
150.040Cooking100
Incandescent Lamp
(Conventional)
10.0010Lighting100
Fluorescent Lamp
(Conventional)
100.0050Lighting100
LED Lamp (Advanced)100.010Lighting100
Other Equipment
(Conventional)
150.020Others100
Other Equipment (Advanced)150.020Others100
Power transmission and distribution4000Electricity supply100
Coal-fired power generation403835115.05Electricity supply 49.8
Coal-fired power generation (CCUS)406136184.08Electricity supply 0
Natural gas power generation40215764.71Electricity supply 31.4
Natural gas power generation (CCUS)403451103.53Electricity supply 0
Nuclear power4014,000420Electricity supply 87.2
Hydropower409000270Electricity supply 27
Pumped water storage406250187.5Electricity supply 13.8
Photovoltaics403737112.11Electricity supply 11.8
Wind power403947118.41Electricity supply 22.2
Biomass power409000270Electricity supply 66.5
Biomass power (CCUS)4014,400432Electricity supply 0
Table 2. Model energy parameter settings.
EnergyPriceCarbon Emission Coefficient (tCO2/tce)
Coal (for power generation)550 yuan/ton2.66
Natural gas (for power generation)4.16 yuan/cubic meter1.52
Biomass (for power generation)131 yuan/ton0
Coal (for residential use)850 yuan/ton2.66
Natural gas (for residential use)3.45 yuan/cubic meter1.56
Table 3. Technical parameter settings for different scenarios.
ServiceTechnologyUnitBase YearBaseline Scenario (BL)Low Carbon
Scenario (CM1)
Green and Low-Carbon Scenario (CM2)
2020203520602035206020352060
LightingIncandescent Lamp
(Conventional)
%46362616000
Fluorescent Lamp
(Conventional)
%10152034242414
LED Lamp
(Advanced)
%44495450767686
CookingElectric Cooking Range
(Conventional)
%35323030282824
Electric Cooking Range
(Advanced)
%30303840585876
Gas Cooking Range
(Conventional)
%1512810660
Gas Cooking Range
(Advanced)
%10121210660
Kerosene Cooking Range
(Conventional)
%8644000
Kerosene Cooking Range
(Advanced)
%6886220
Hot waterSolar Water Heater
(Conventional)
%25283028303025
Gas Water Heater
(Conventional)
%20161014660
Gas Water Heater
(Advanced)
%151088220
Electric Water Heater
(Conventional)
%35384233303025
Heat Pump Water Heater
(Advanced)
%581017323250
Space coolingAir Conditioner for Space Cool (Conventional)%80757060303015
Air Conditioner for Space Cool (Advanced)%20253040707085
Other equipmentOther Equipment
(Conventional)
%70656055404020
Other Equipment
(Advanced)
%30354045606080
Disclaimer/Publisher’s Note: The statements, opinions and data contained in all publications are solely those of the individual author(s) and contributor(s) and not of MDPI and/or the editor(s). MDPI and/or the editor(s) disclaim responsibility for any injury to people or property resulting from any ideas, methods, instructions or products referred to in the content.

