Article

Socioenvironmental Vulnerability of Rural Communities in Espírito Santo, Brazil

by
Francielle Rodrigues de Oliveira
,
Roberto Avelino Cecílio
* and
Sidney Sara Zanetti
Department of Forest and Wood Sciences, Federal University of Espírito Santo, Jerônimo Monteiro 29550-000, Brazil
*
Author to whom correspondence should be addressed.
Sustainability 2025, 17(9), 4054; https://doi.org/10.3390/su17094054
Submission received: 14 March 2025 / Revised: 24 April 2025 / Accepted: 27 April 2025 / Published: 30 April 2025

Abstract

:
This study adapted the Socioenvironmental Vulnerability Index (SEVI) for rural communities in Espírito Santo, Brazil, considering climatic, environmental and social factors. The analysis included using an integration of indices, such as the Environmental Vulnerability Index (EnVuIn) and the Social Vulnerability Index (SVI). The inclusion of variables, such as the Water Quality Index (WQI), the percentage of conflicting use of Permanent Preservation Areas (PPAs) and the existence of water reservoirs, presented new elements that directly influence environmental vulnerability. The results indicate significant human interference in PPAs with high rates of conflicting use, especially in the communities of Boa Esperança (85.8%) and José Marcos (85.4%). The absence of water reservoirs proved to be a critical factor for the water security of the communities. Communities such as Novo Sonho presented high poverty rates, reflecting a high SVI (0.61). The EnVuIn indicated high environmental vulnerability in the communities of Boa Esperança, Santa Clara, Ita, Novo Sonho and Monte Alegre. Integrating the indicators and adapting the methodology resulted in a high SEVI for most communities, with emphasis on Novo Sonho and Boa Esperança (0.54), classified as very high. The study reinforces the need for public policies to reduce socioenvironmental risks and promote sustainability in rural communities.

1. Introduction

Water is an essential resource for human survival [1], economic development [2] and environmental preservation, playing an important role in quality of life [3], especially in rural communities [4,5,6]. In addition to domestic consumption, agriculture, livestock and small-scale production, which sustain the local economy in these communities, depend on water availability [7,8]. Access to drinking water sources in sufficient quantity and quality is directly related to public health, food security and reducing social inequalities. However, inadequate management, the contamination of water sources and water scarcity represent challenges that directly affect the sustainability of these communities [9,10].
Water scarcity is considered one of the main global challenges. According to the National Water and Sanitation Agency (ANA) in Brazil, water scarcity results from a complex integration of factors, including increased consumption, ecological degradation, inadequate resource management and climate change [11]. Climate change impacts water availability and quality, thereby making water resource management more complex. These changes in the climate result in heat waves, changes in precipitation patterns and intensified extreme weather events, such as droughts, storms and floods [12]. Consequently, the freshwater supply is directly affected, compromising essential sectors such as agriculture, energy generation and human supply [13].
Climate change and natural disasters do not affect all people equally [14]. The most vulnerable populations, especially those with low incomes, are more exposed to environmental disasters due to socioeconomic factors. This, in turn, limits their access to basic goods and services, reducing their ability to protect themselves and respond to impacts. This vulnerability is even more worrying in Brazil and other developing countries, as the economy and livelihoods of a large part of the population heavily depend on agriculture [15,16]. Small farmers are especially severely impacted by climate change in facing increasingly frequent and intense droughts, which compromise agricultural production, increase food insecurity and exacerbate poverty [17,18]. Water scarcity makes it difficult to irrigate crops, jeopardizing the food supply for a rapidly growing population [19,20]. In addition, prolonged drought poses a serious threat to rural livelihoods, pushing smallholder farmers into a poverty trap [21,22]. Extreme weather events can cause significant damage to subsistence crops and, consequently, affect family farmers. Therefore, studying vulnerability involves a broad and relevant discussion with a multidisciplinary approach.
The socioenvironmental vulnerability associated with water scarcity is not an issue exclusive to Brazil. It is a challenge faced by several countries, driven by factors such as climate change, the inappropriate use of natural resources and social inequalities. Although this challenge is faced by several nations, its manifestations and impacts vary according to regional characteristics, requiring specific, adaptive and integrated responses by governments, communities and productive sectors.
Although climate change has a global reach, its impacts vary between different regions, affecting populations around the world unequally. Southern Europe is particularly vulnerable to the impacts of climate change, being highly dependent on agriculture, forestry and land use. These effects are complex and affect both environmental systems and socioeconomic structures and their inter-relationships. Reduced rainfall and an increased duration of dry periods have intensified the region’s aridity, resulting in serious implications for agriculture, drinking water supply and biodiversity conservation [23]. Agricultural production in Bangladesh, which represents the main pillar of their economy, has been pressured by the growing demand for food and the effects of climate change, such as increased droughts and temperatures. With projections indicating an average increase of 1 °C by 2030 and 1.4 °C by 2050, the FAO, in partnership with the Asian Disaster Preparedness Centre (ADPC), is developing a project focused on adapting livelihoods to climate variations in the northwest of the country, which is particularly vulnerable to drought. The project is inserted in the Comprehensive Disaster Management Program (CDMP), which seeks to analyze livelihood systems, map the most vulnerable groups and promote local adaptation strategies. Part of the actions include training and capacity-building activities for professionals in the areas of agriculture and risk management [24]. Recent research in Brazil on adaptation links the issue of vulnerability regarding future impacts of climate change to the problems of current social inequities and unsustainable environmental practices.
In Brazil, although there is also a growing impact of climate change on water resources, socioenvironmental vulnerability to water scarcity has particular characteristics that aggravate the problem. Socioeconomic and territorial inequalities disproportionately expose the poorest and most peripheral populations to conditions of water insecurity [25]. The lack of effective public policies aimed at addressing social and environmental inequalities has compromised the adaptation capacity of the most vulnerable groups in the face of extreme weather events [26]. Such challenges are strongly associated with precarious access to essential services—such as health, basic sanitation and adequate housing—factors that, together, significantly reduce the resilience of populations exposed to recurrent environmental risks. Research in Brazil on adaptation to the future impacts of climate change has emphasized the direct relationship between climate vulnerability, persistent social inequalities and unsustainable environmental practices [27,28,29,30,31,32,33,34].
According to the 2017 Brazilian Agricultural Census, 108,014 agricultural establishments were recorded in the state of Espírito Santo, of which 74.8% were family owned. Rural communities in this state face a series of challenges related to climate variability and extreme events, such as prolonged droughts and heavy rainfall. Agricultural activities in Espírito Santo were affected by the water crisis from 2014 to 2017 [35]. According to a study [36], there was a loss of 8.4 million tons in agricultural production in those years, which corresponds to BRL 10.1 billion. The estimated average loss of 25.9% in production may have been influenced by the water crisis and drought due to the low rainfall recorded in these years. This interaction of climate variables with agricultural practices is complex and, therefore, implies critical risks to food security and the economic sustainability of communities.
Vulnerability is defined as the tendency or predisposition of a system to be adversely affected, including a variety of concepts and elements such as sensitivity or susceptibility to damage and the lack of capacity to cope and adapt [13]. It can be defined at the environmental, economic, social, political or legal levels [37]. Environmental vulnerability concerns the capacity of social groups to foresee exposure situations to environmental hazards and to face, resist and recover from the impacts caused by them [38,39]. This capacity depends on many factors, from the physical location of populations to socioeconomic, political and cultural factors [40,41,42]. On the other hand, social vulnerability is characteristic of population groups, indicating social disadvantage, which demonstrates the sociodemographic situation of the location.
Thus, socioenvironmental vulnerability is a combination of social and environmental vulnerability, which can be conceptualized as a coexistence or spatial overlap between poor population groups that live or circulate in at-risk or environmental degradation areas [39,43]. Researchers often use a set of indicators or indices that are estimated based on other indicators to assess the vulnerability of an area. These indicators help analyze trends and apply models at different spatial and temporal scales. However, they have limitations, especially in the choice of variables and the rules for calculating the vulnerability index of a specific region or community since the issue of vulnerability is complex, as each situation, population and region has the need for specific information. Thus, there are several indices, each developed for a specific reality and with different objectives and applications [44].
Combining variables related to physical factors and social, economic, cultural, political and educational characteristics, added to the analysis of the different perceptions about the risks involved, provides a deeper understanding of the reality experienced by these populations [45]. Therefore, several researchers have been committed to evaluating the potential of the environment in an integrated way, reconciling its natural characteristics with its restrictions with the aim of understanding environmental and social vulnerability in different regions [46,47,48,49,50,51].
Socioenvironmental vulnerability has emerged as an important issue in recent debates on sustainable development [52,53], especially in rural communities that face challenges arising from the interaction between social, economic and environmental dynamics [54,55]. The scenario in the state of Espírito Santo is marked by a diversity of rural realities, environmental degradation [56], economic dependence on agricultural activities [57] and exposure to extreme weather events, which contribute to accentuating the vulnerability of these populations [58].
Vulnerability can be expressed through indices. Research conducted in Brazil and around the world has already used indices as an efficient quantitative and classification tool for risk levels [32,51,59,60,61,62,63,64,65]. However, socioenvironmental vulnerability indices are mostly applied in urban areas and are related to the risks of environmental events, such as floods, earthquakes and inundations. The Socioenvironmental Vulnerability Index (SEVI) [66] stands out among such indices, which considers indicators such as the Standardized Precipitation Index (SPI), Water Use Conflict in Water Resource Management Index (WCMI), Water Use Conflict in Water Resource Planning Index (WCPI), Water Security Index (WSI), Humidity Index (HI) and Social Vulnerability Index (SVI) to analyze socioenvironmental vulnerability related to drought in rural settlements.
However, the issue of vulnerability is complex, and specific information is required for each situation, vulnerable population and region; therefore, there are several indices, each developed for a given reality, with different objectives and uses [67]. Thus, it was necessary to adapt the SEVI to include new environmental variables that deepen the analysis of the impacts of water scarcity, especially in rural communities.
This study presents important advances in the analysis of socioenvironmental vulnerability by methodologically adapting the Socioenvironmental Vulnerability Index and incorporating more specific environmental variables, such as water availability, land-use conflict and water quality indicators. Although some previous initiatives have applied the SEVI in rural areas, there is still a scarcity of studies that integrate these environmental dimensions, especially in regions with a high dependence on family farming, as is the case in Espírito Santo. The main contributions of this study, therefore, consist in updating the index to more accurately reflect the reality of rural communities facing water scarcity and applying the SEVI on a local scale. This enables the generation of information that is directly applicable to territorial management and to strengthening rural resilience.
In this context, the objective of this study was to adapt the SEVI methodology [66], expanding the SEVI by incorporating variables that provide a more comprehensive analysis of the resilience of communities in facing the adversities of drought considering climate diversity, ecosystems and the socioeconomic profile of those involved. The index was applied as a case study in rural communities in Espírito Santo to identify critical and vulnerable areas. In turn, this tool can support decision-making processes aimed at territorial planning and sustainable development of these locations.

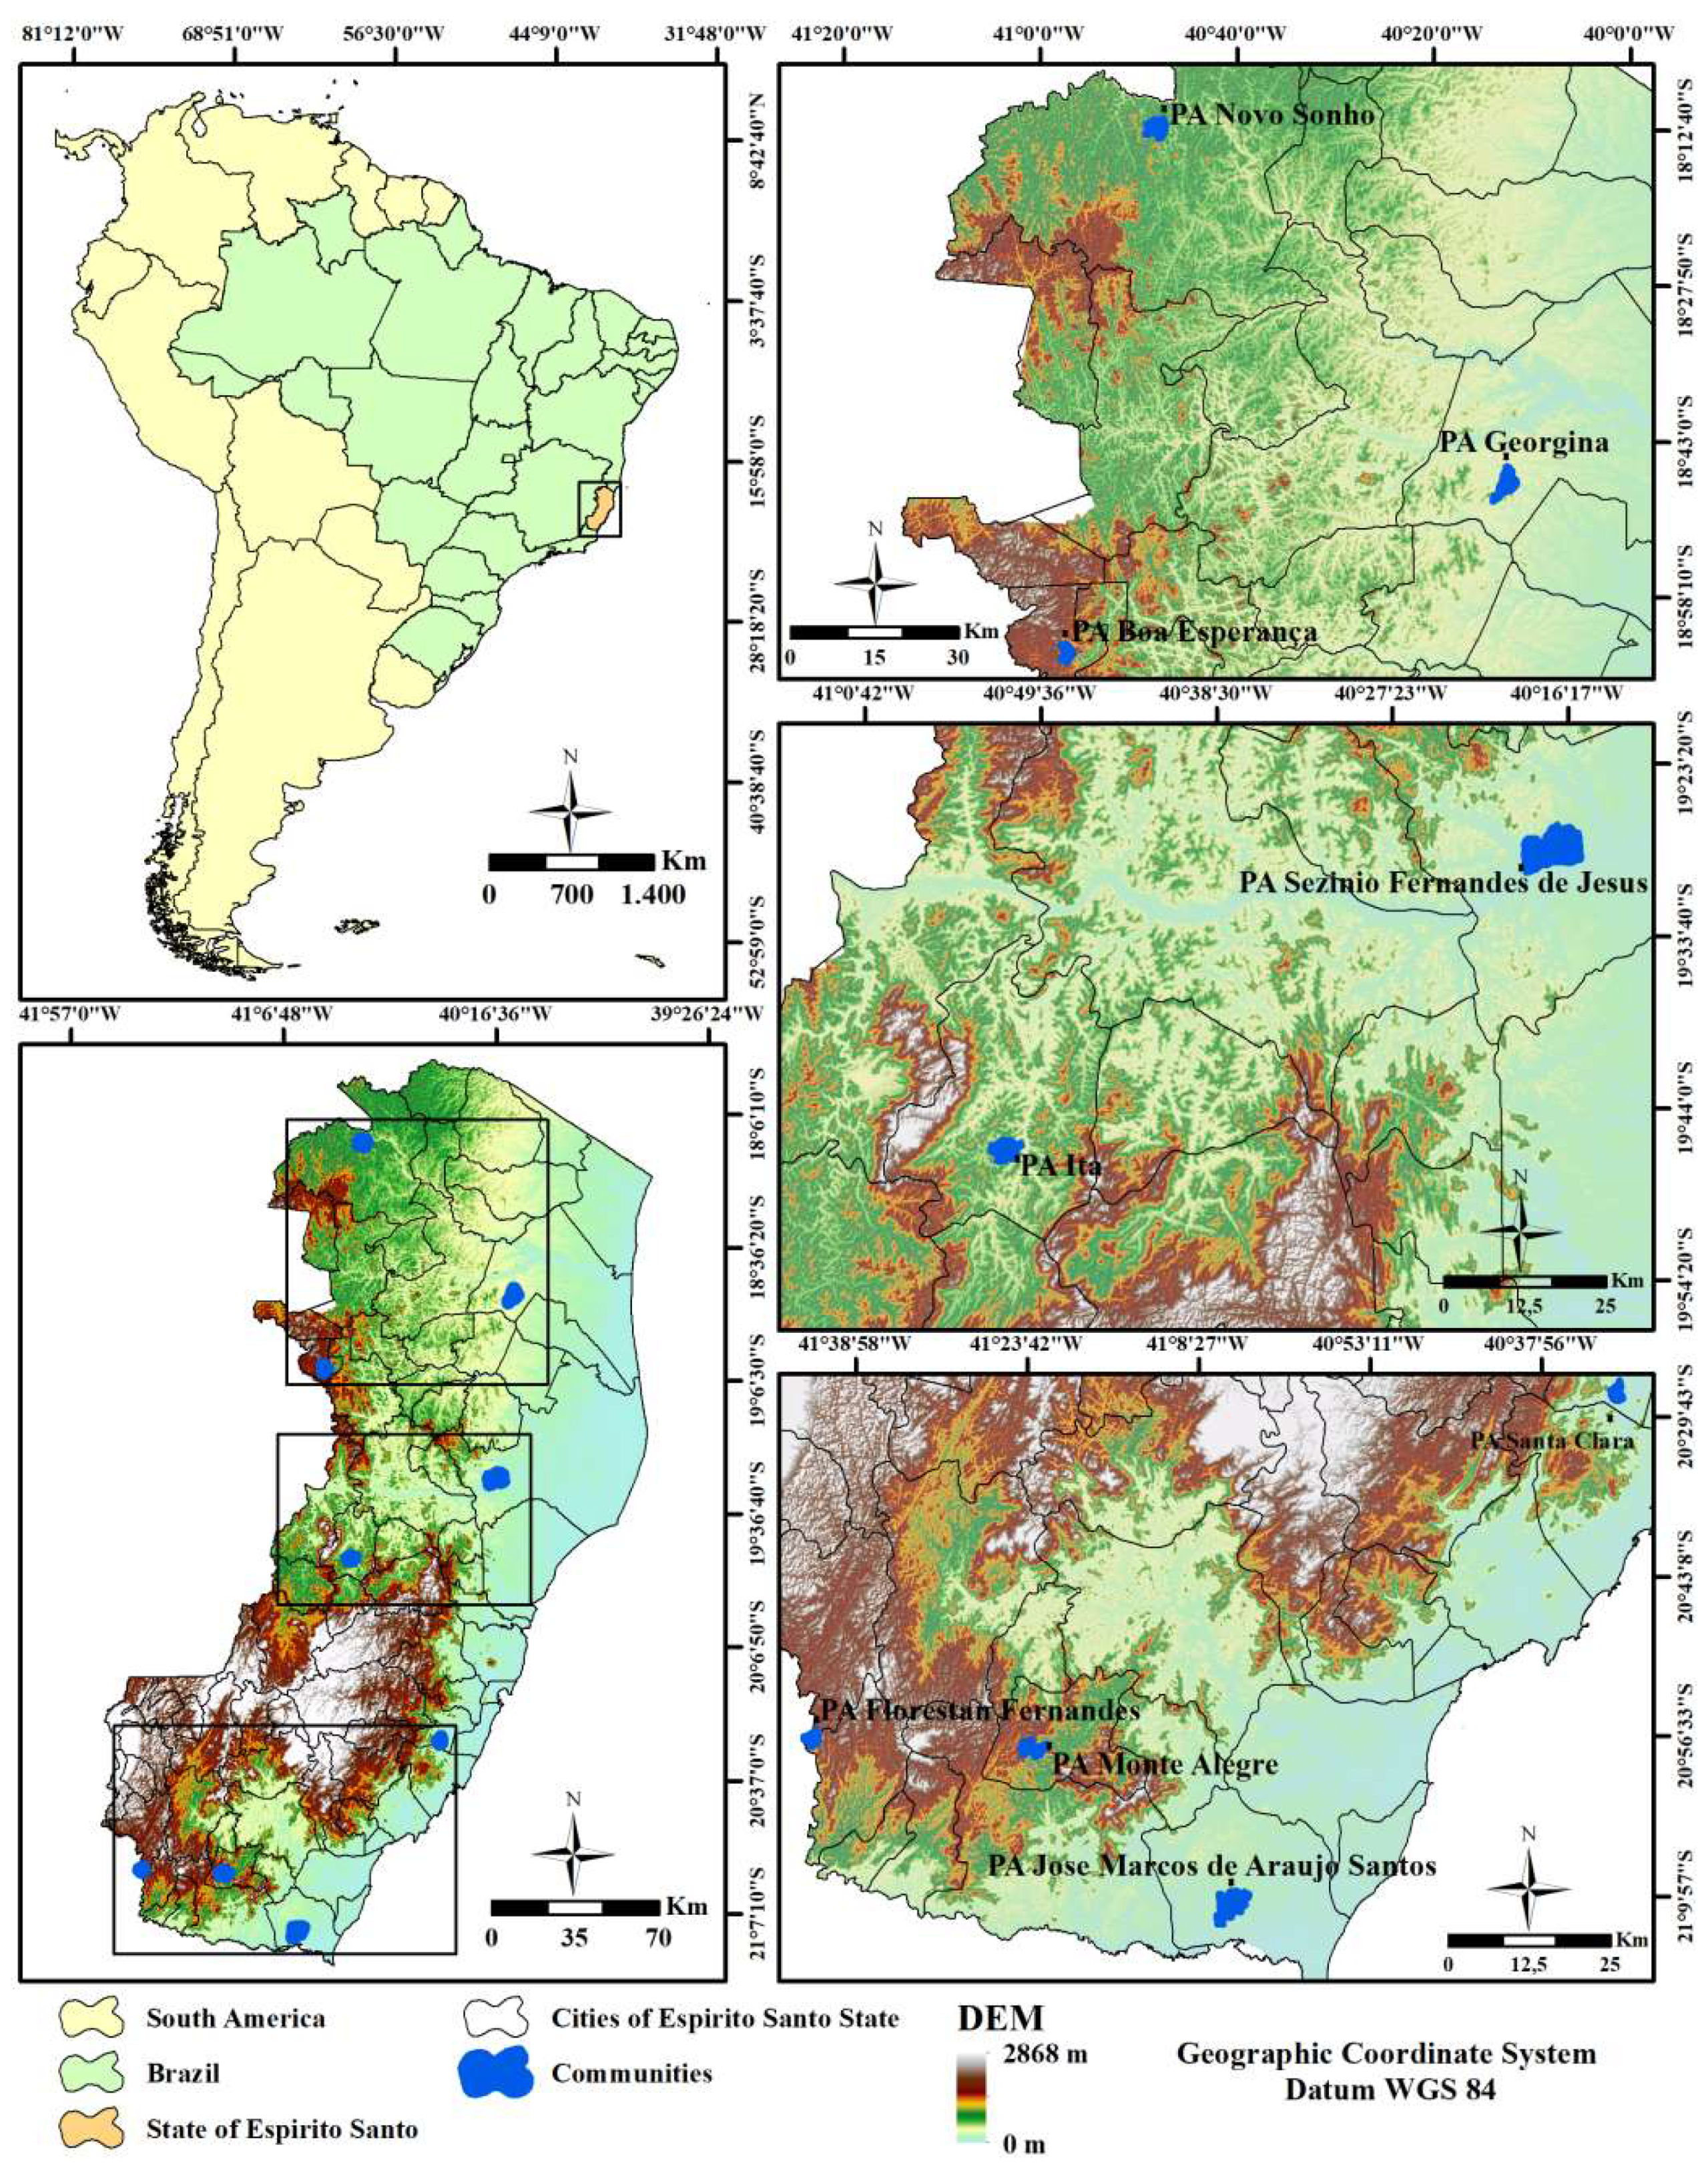
2. Materials and Methods

The SEVI adaptation was conducted in three stages: the generation of the Socioeconomic Vulnerability Index; the generation of the Environmental Vulnerability Index; and finally, the integration of these two to define socioenvironmental vulnerability. In addition to the variables suggested by the SEVI [66], the adaptation proposed in this study integrated the following additional variables: the Water Quality Index (WQI); conflicting use in Permanent Preservation Areas (PPAs); and the existence of water reservoirs in the area. The adapted SEVI was then applied as a case study in rural communities in Espírito Santo.
The indicators that compose the SEVI are described in the following items and summarized in Figure 1.
The study area defined for applying the case study was the state of Espírito Santo, Brazil. The state is delimited by the following coordinates: parallels 17.9° and 21.3° S and meridians 39.6° and 41.8° W. According to the Köppen climate classification, the Aw climate (tropical zone with dry winters) predominates in most of Espírito Santo (53.7%). The study area also encompasses several other climatic zones, including Cfa, which corresponds to an oceanic climate without a dry season (14.9%); Am, indicative of a tropical zone with a monsoon period (14.0%); Cfb, characterized by an oceanic climate without a dry season but with temperate summers (10.5%); Cwb, denoting a humid temperate climate with dry winters and temperate summers (3.4%); Af, representing a humid tropical climate (2.8%); Cwa, indicating a humid temperate climate with dry winters and hot summers (0.9%); and Cwc, classifying a humid temperate climate with dry winters and short, cool summers (0.02%) [68]. According to data from the Brazilian Institute of Geography and Statistics [69], Espírito Santo has a population of 3,833,712 inhabitants, distributed throughout its territorial extension of 46,074.448 km2, resulting in a population density of 83.21 inhabitants per km2, while another 540,480 people (14.1%) live in rural areas.
The case study comprised nine rural communities in the state of Espírito Santo (Figure 2).

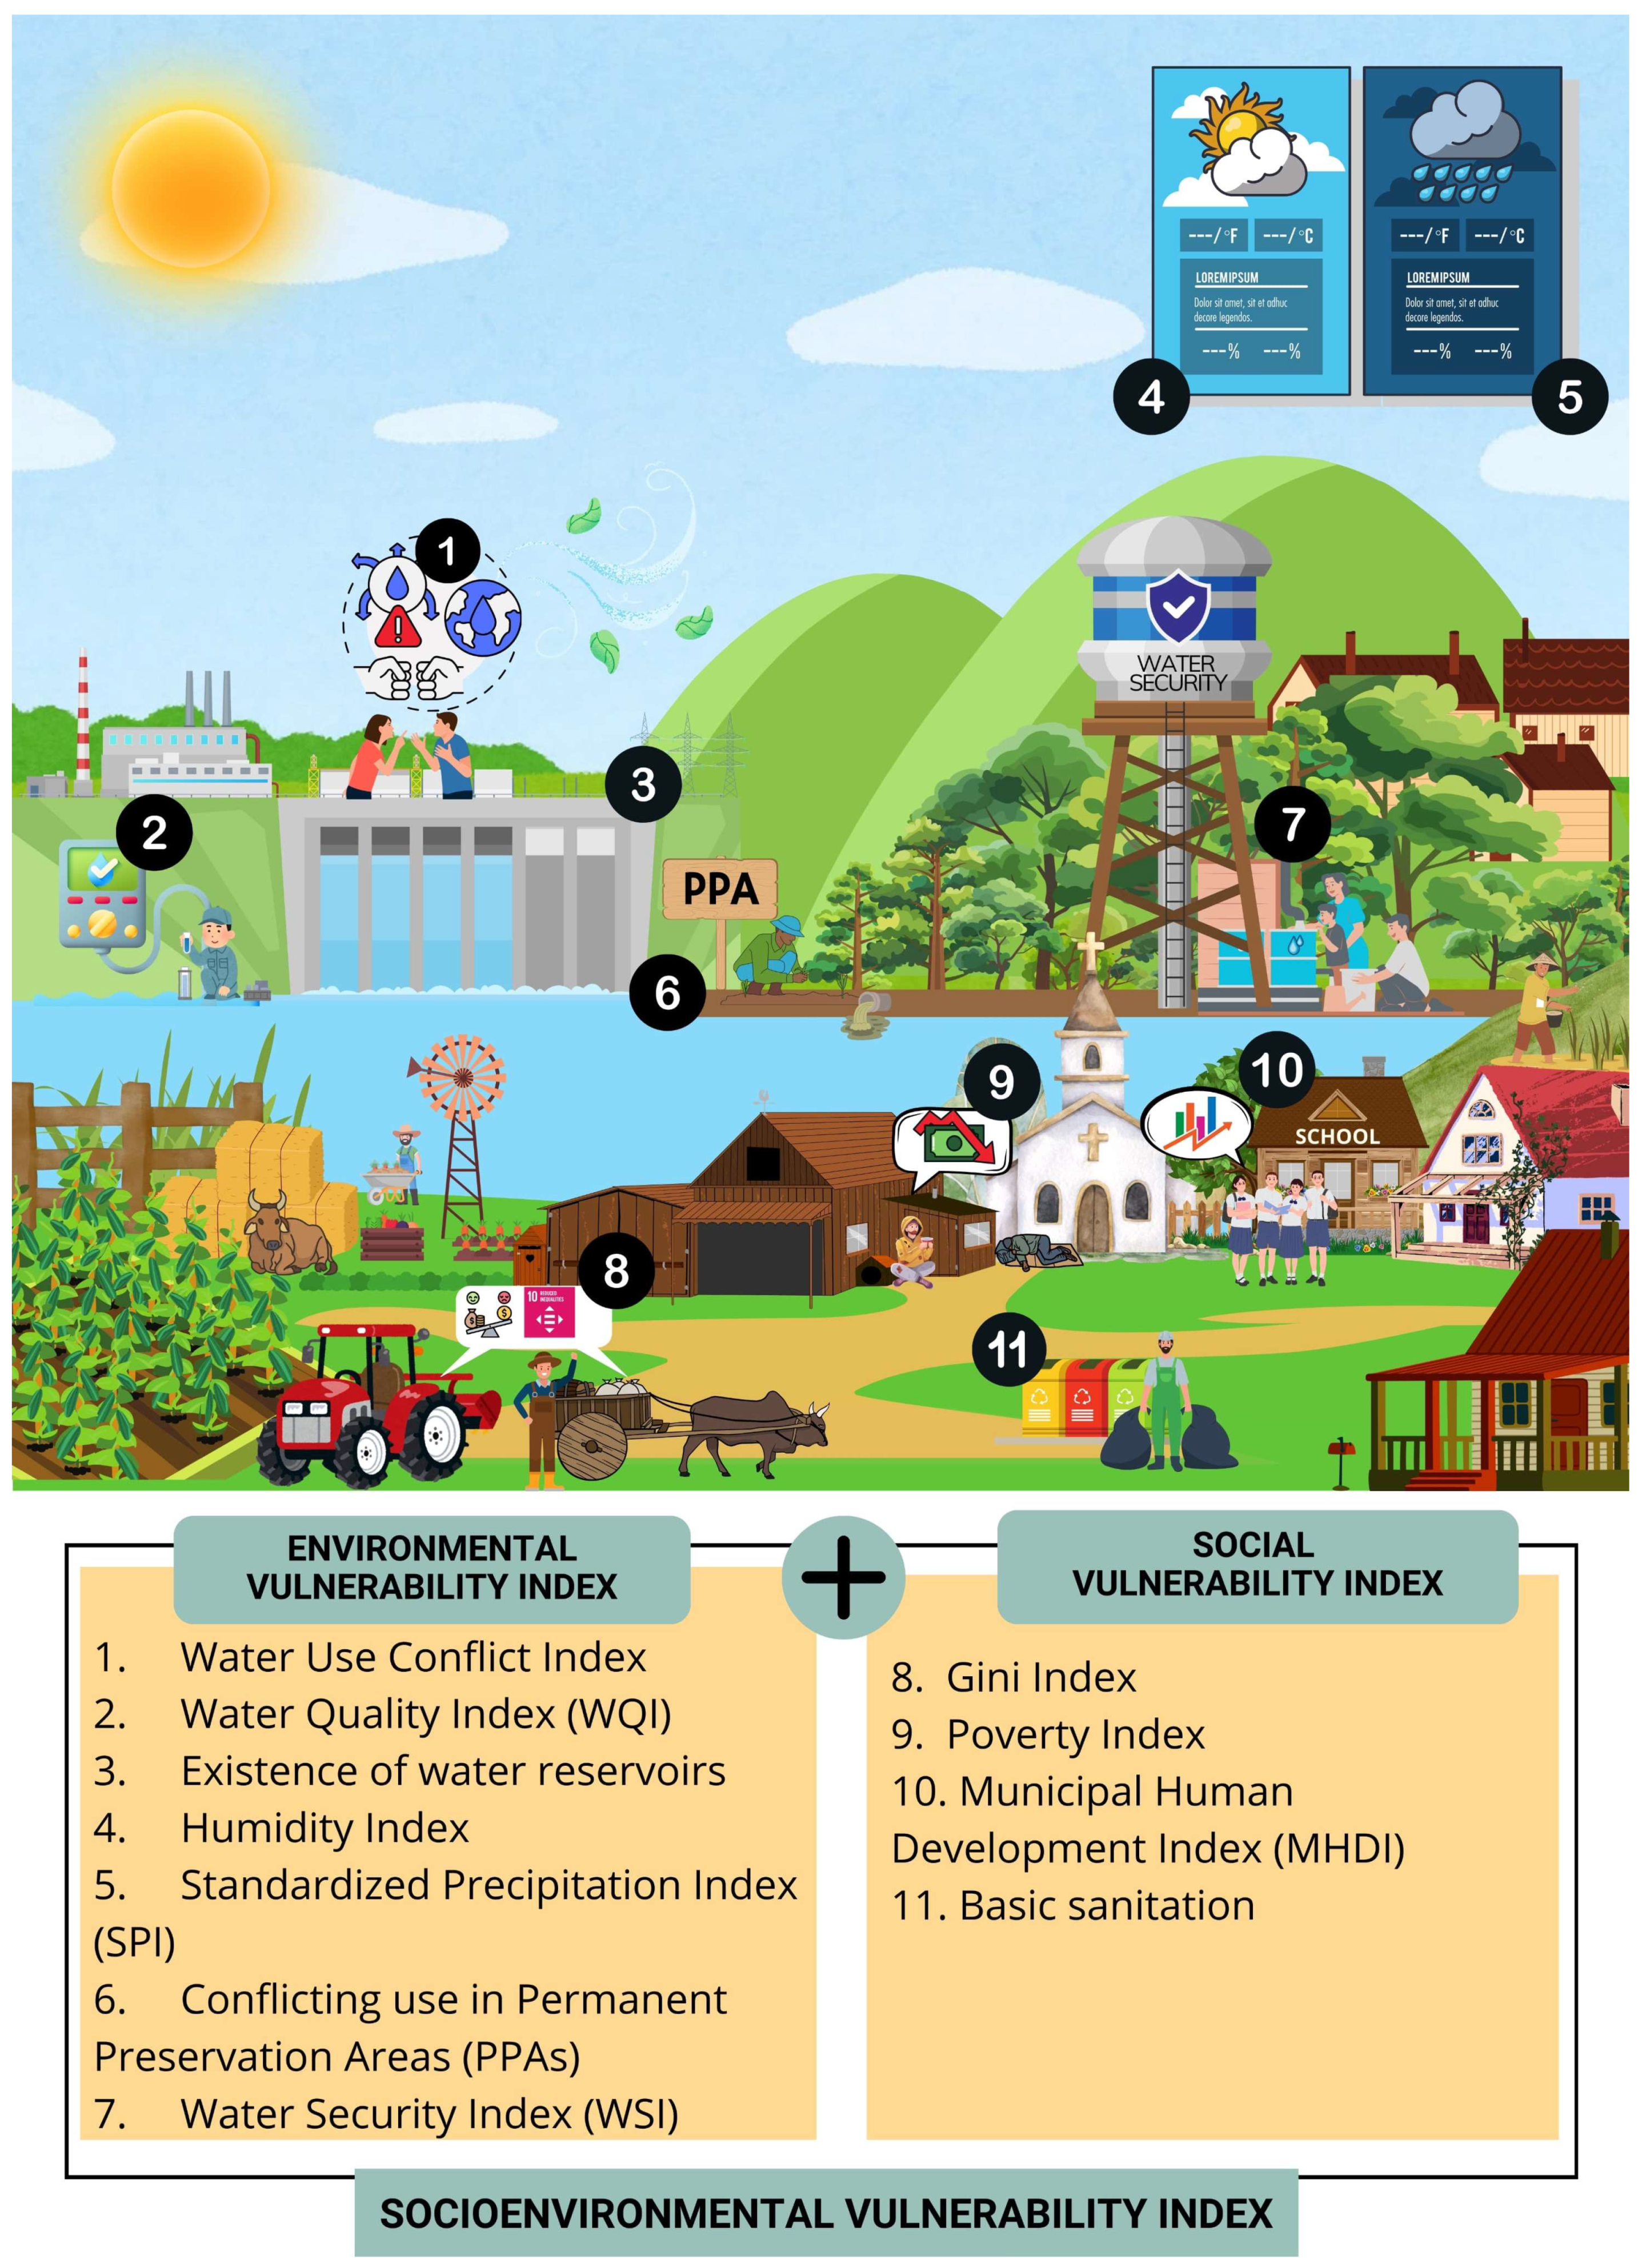
2.1. Environmental Vulnerability Index—EnVuIn

Environmental data from the communities were used to identify and describe the environment of the study areas and, above all, the potential, limitations and environmental risks. The following indicators (INDs) were used to construct the Environmental Vulnerability Index: the Water Use Conflict in Water Resource Management Index (WCMI), Water Use Conflict in Water Resource Planning Index (WCPI), Water Quality Index (WQI), existence of water reservoirs in the area, Humidity Index (HI), Standardized Precipitation Index (SPI), conflicting use in Permanent Preservation Area (PPAs), and Water Security Index (WSI).
In turn, the Environmental Vulnerability Index (EnVuIn) was developed to diagnose environmental vulnerability according to the equation:
E n V u I n = i = 1 n I N D i × W i i = 1 n W i
in which EnVuIn: Environmental Vulnerability Index, dimensionless; IND: indicator; and W: weight.
The Environmental Vulnerability Index was calculated using the data collected, assigning its respective weights. The weights of each variable that composes the EnVuIn were defined using the “Analytic Hierarchy Process” (AHP) method, developed by [70]. This method is commonly used to define the weights and importance of variables: in this case, to identify the most vulnerable areas.
The absolute scale in [70] was adapted for the hierarchical process proposed by the AHP method, which contains the intensity (from 1 to 9), definition and justification of each of the items, as presented in Table 1.
Quantifying the judgment between two criteria in many cases involves difficulties associated with errors in measuring attributes, impartiality in assessments and the availability of information, as well as inaccuracies and ambiguities inherent in the paired analysis procedure [71]. Thus, it is possible to use the scale of relative importance. Thus, a measure of the relative importance between two alternatives is established based on the absolute scale, facilitating the decision-making process. The evaluator must initially judge whether criterion “A” is more or less important than criterion “B”, and if so, estimate the degree of this difference. To do this, weights are assigned according to the proposed scale in order to quantify this perception. The pairwise comparison followed the scale composed of values lower than one (1) for variables defined as less important: 1/9 (extremely), 1/7 (very much), 1/5 (quite) and 1/3 (not very). The variables with higher weights have, as reference values, 3 (a little), 5 (a lot), 7 (quite a lot) and 9 (extremely), as illustrated in Figure 3.
In turn, the indicators that compose the EnVuIn calculation were standardized, as per item 2.2.
The paired comparisons between the indicators of this study were carried out based on the previous experience of the researchers involved, who have extensive knowledge in the areas of hydrological modeling, watershed management, agrometeorology, geoprocessing applied to water resource planning and quantitative statistical methods. The definition of the relative weights was guided both by this practical expertise and by the analysis of a similar study [44], which applied the AHP method to construct the Socioenvironmental Vulnerability Index (IVSA). This approach is widely used in studies involving multicriteria decision making, especially in contexts where there is no consolidated consensus among the indicators, allowing for the incorporation of qualified judgments systematically and transparently [70,73]. To ensure greater reliability of the comparisons, a free online tool, AHP-OS [74], was used. This software provides automated validation of judgments and calculation of the eigenvalue vector. The use of this method allows for a specialized and detailed analysis of socioenvironmental vulnerability, contributing to more informed decisions contextualized to the territorial reality analyzed.

2.1.1. Water Use Conflict Index

First, the values of the granted flows and the estimated flows at the confluences of the hydrography in each community were required to calculate the Water Use Conflict Index [75]. Next, data on the flow rate, which remains in place for 90% of the time (Q90), are required for the methodology, since this is the minimum reference flow rate adopted by the State Water Resources Agency (AGERH); the long-term mean flow rate (Qmld); the granted flows (Qout); and the estimated flows at the mouth of the hydrography segments. The data on these flows, as well as the information from the registry of grants and interferences, were acquired from the AGERH database. The data refer to the current grants in force.
The WCMI and WCPI of the water resources of the basins were calculated considering the segment of a river as the study unit [75]. The WCMI value is given by:
W C M I = Q o u t x Q m r
in which WCMI = Water Use Conflict in Water Resource Management Index, dimensionless; Qout = flow rate granted upstream of the mouth of the segment under study in m3 s−1; x = percentage expressed in decimals of the Qmr that can be granted, dimensionless; and Qmr = minimum reference flow rate estimated at the mouth of the segment under study, in m3 s−1.
The value of 50% of Q90 was used as the percentage of the minimum reference flow, i.e., x = 0.5. Therefore, the product obtained by x and Qmr (taken as equal to Q90) corresponds to the maximum flow that can be granted for consumption in Espírito Santo. The WCMI values can vary between 0 ≤ WCMI ≤ 1, in which case the flows granted upstream of the mouth of the segment under study are within the legal limits, and for WCMI > 1, it means that the flows granted upstream of the mouth of the segment under study exceed the limits established by law.
The Water Use Conflict in Water Resource Planning Index (WCPI) is expressed by the following equation:
W C P I = Q o u t Q m l d
in which WCPI = Water Use Conflict in Water Resource Planning Index, dimensionless, and Qmld = long-term mean flow at the mouth of the segment under study, in m3 s−1.
The WCPI values vary between 0 ≤ WCPI ≤ 1, which means that if there is a conflict over water use, it can still be overcome by adopting structural measures, and WCPI > 1 refers to the scenario in which the conflict cannot be overcome by structural measures alone.
The term “conflict” used in the context of the calculation of indices is based on a concept already consolidated in the Brazilian technical literature on water resource management [75]. In this work, the authors propose the Conflict Indices for the Use of Water in Management (ICG) and Planning (ICP), which seek to identify potential conflict situations when the granted flows approach or exceed the limits of the legally allowed water availability. The use of the term “conflict” refers, therefore, not necessarily to situations of open dispute between users, but rather to an imbalance between supply and demand that can compromise the rational and sustainable allocation of water, something that, if not managed, can evolve into real conflicts. The indices aim to support management and planning actions to prevent such imbalances from worsening [75]. Therefore, it should be noted that the term “conflict” is used in the technical sense as an indicator of the risk of incompatibility between water availability and the flows granted by the grant and that it refers to the identification of critical areas for preventive management purposes.

2.1.2. Water Quality Index—WQI

The Water Quality Index (WQI) was described by the National Sanitation Foundation (NSF) in the United States in 1970 [76,77]. The WQI ranges from zero (worst quality) to 100 (best quality) and uses nine attributes (dissolved oxygen, thermotolerant coliforms, pH, biochemical oxygen demand, nitrate, total phosphorus, temperature, turbidity and total solids) with their respective weights (Wi). The WQI enables comparisons of different watercourses to be made according to their quality. Therefore, it is possible to study environmental impacts on water bodies and their causes and to research and work on actions that preserve water bodies.
The results of water analyses made available by the State Water Resources Agency (AGERH) were used for this case study. In doing so, it was possible to analyze water quality through the WQI from 2007 to 2023. It is worth noting that the watercourses of four of the nine communities studied do not have AGERH monitoring points and, therefore, do not present the respective WQI values. Moreover, the WQI was not included in the Environmental Vulnerability Index (EnVuIn) calculation for communities where this information is not available. In these cases, the weight corresponding to the WQI was redistributed equally among the other indicators, ensuring that the assessment of environmental vulnerability only considered the effectively available data for each location.
The unavailability of Water Quality Index (WQI) data for four communities was a specific limitation. In view of this, we decided to proportionally redistribute the weight among the other indicators, maintaining the total sum of 1. It is believed that the exclusion of the WQI for these communities did not generate significant distortions in the overall vulnerability classification, especially considering the total number of indicators used and the lower weight attributed to this indicator. Despite the unavailability of the data, the WQI was maintained as a component of the Environmental Vulnerability Index, since water quality is an important factor for characterizing environmental health and human well-being and is especially relevant in rural contexts or contexts of restricted access to sanitation. Completely removing this indicator could compromise the representativeness of the proposed methodology. However, it is worth noting that in cases where all the data are available, the value of the weights can be recalculated to avoid underestimating or overestimating the real environmental condition, influencing, albeit subtly, the final SEVI result.

2.1.3. Existence of Reservoirs

The purpose of reservoirs is to accumulate part of the water available during rainy periods to compensate for deficiencies during dry periods, thereby regulating natural flows [78].
AGERH is the agency responsible for monitoring the safety of dams built and licensed in Espírito Santo (Federal Law No. 12,334, 20 September 2010). The most common dams in Espírito Santo are mostly small earthen dams used to store water for agricultural use or public supply, but they are strategic for water security. More than 300 water accumulation dams are currently registered and monitored by AGERH. For the case study in this work, data on the existence and quantity of water reservoirs in the communities were acquired from the AGERH database. The data refer to reservoirs built in the study area. A binary approach was adopted for the methodology used in this study: locations that have reservoirs were assigned the value 1, while those that do not have reservoirs received the value 0. These values were also normalized.
Relevant aspects related to water reservoirs, such as the capacity, size, conservation status and management methods, constitute factors that can significantly influence the water security of communities and, consequently, the assessment of environmental vulnerability. However, such information was not included in this analysis due to the difficulty in accessing these data for the communities assessed. This limitation restricted the possibility of incorporating a more detailed approach into the current methodology. Despite this, it is worth noting that the data used were obtained from AGERH, an official, reliable and up-to-date source. It was assumed that the reservoirs registered by this institution have adequate dimensions and volumes for their supply function, especially since they are formally recognized structures. Even so, the importance of these data is reinforced, which (when available) may be incorporated into future versions of the index with the aim of improving the water security representation and increasing the accuracy and sensitivity of the assessment of socioenvironmental vulnerability.

2.1.4. Humidity Index (HI)

The climatological water balance (CWB) was initially calculated based on the methodology of Thornthwaite and Mather [79], which provides information on water availability by calculating the surplus (SUR), deficiency (DEF) and water withdrawal and replacement (WWR) in the soil. Monthly average data from 1980 to 2022 were used for this case study, obtained from the gridded Brazilian database [80].
Next, the following indices were calculated based on the annual average values of each variable of the climatological water balance (SUR, DEF and WWR): Water Index (WI), Aridity Index (AI) and Humidity Index (HI). The soil’s available water capacity (SWC) was assumed to be 100 mm for both calculations. The focus in this work was on the Humidity Index (HI), with the aim of identifying the humid conditions over time in the settlement areas.
The following equation for the Water Index (HI) was followed:
W I = S U R W W R × 100
Once this was done, the Aridity Index (AI) was determined, which represents the water deficiency:
A I = D E F W W R × 100
Finally, the Humidity Index (HI) was defined by the equation:
H I = W I 0.6 × A I
in which WI = Water Index; AI = Aridity Index; HI = Humidity Index; SUR = water surplus from the BHC (mm); DEF = water deficit from the BHC (mm); and WWR = potential evapotranspiration from the CWB (mm).
The climate types correspond to the HI values. Therefore, the values can vary between −60 ≤ HI ≤ 100, from arid to super-humid, and correspond to the humidity of each location.

2.1.5. Standardized Precipitation Index (SPI)

The Standardized Precipitation Index (SPI) classifies and indicates the degree of drought in a given period. In other words, it is possible to identify how much the precipitation differs from the normal precipitation. The SPI calculation is determined from the probability density functions that describe the historical series of precipitation in different time scales [81]. The SPI conceptually represents precipitation behavior as a function of standard deviation values. For a given historical series, these values deviate from the average, thus creating the idea of standardized precipitation of the index. Since the monthly historical series of precipitation does not follow a normal distribution but rather an asymmetric distribution (not uniformly distributed around the average value), an initial treatment of the data series was necessary to calculate this index in such a way that the values have the desired normal distribution.
The SPI calculation begins with fitting the series of monthly precipitation totals to the Gamma probability density function. Then, the cumulative probability of occurrence of each monthly total is estimated. The inverse normal function to Gaussian is applied to this probability, resulting in the SPI value [82]. Since the SPI is normalized, wet and dry climates can be represented [83]. The index classifies the conditions of a location based on the variability of precipitation on different time scales. Its values range from −2.00 to 2.00, with negative values indicating drought and positive values indicating humidity. The drought types are directly associated with the SPI time scales: the longer the duration, the greater the water deficit and, consequently, the greater the economic and social losses.
The SPI calculation requires a series of monthly data from at least 30 years [81]. Monthly rainfall data from 1980 to 2022 [80] were used to calculate the index in this study, available at https://utexas.app.box.com/v/Xavier-etal-IJOC-DATA (accessed on 1 January 2024). This work contains daily meteorological data in grids with a resolution of 0.25° × 0.25° (27.78 km), extracted from automatic and conventional stations available in Brazil.
The monthly precipitation data from 43 years were used as an input parameter for calculating the SPI using MDM (Meteorological Drought Monitoring) software (Version 1), which is a computer program to calculate meteorological drought indices based on rainfall. The annual time scale and normal precipitation in this work were adopted as the average of the hydrological years from 1980 to 2022.
Then, it was necessary to establish only a single input value in the index to calculate the EnVuIn by first calculating the historical average of the SPI for each community.

2.1.6. Conflicting Use in Permanent Preservation Areas (PPAs)

Land-use shapefiles obtained from the Orthophotomosaic interpretation of the state of Espírito Santo for the period 2012/2015 and available in GEOBASES were used to identify and analyze the conflict areas between the type of land use and land cover in the PPAs in this case study. The PPAs were mapped based on the criteria established by the legislation, in accordance with the Brazilian Forest Code, Law 12.651 of 2012, which establishes parameters, definitions and limits of these areas, considering the marginal strip of the riverbed (30 m buffer) and around springs (50 m buffer).
The conflicting use percentages in the PPAs in the communities were considered to calculate the Environmental Vulnerability Index in this study.

2.1.7. Water Security Index (WSI)

The Water Security Index (WSI) was developed by the National Water and Basic Sanitation Agency (ANA), in partnership with the Ministry of Regional Development (MDR), to clearly represent the security or insecurity conditions in relation to water, integrating the concept of risk associated with its use. It considers the diversity of climate, ecosystems and land use and occupation patterns, establishing a connection between public water infrastructure policies and water resource management. The index is based on four dimensions: human, ecosystem, economy and resilience (ANA, 2019). Thus, the WSI synthesizes the population’s shortage rates and the economic losses resulting from water scarcity in a single value. The indicators have values classified into five ranges. The classes vary from 1 to 5, in decreasing order of the water security level.
The methodology [66] aims to add the WSI results as an indicator to compose the proposed Socioenvironmental Vulnerability Index. Thus, the vector data of Brazil’s water security index were downloaded through the ANA metadata portal (https://metadados.ana.gov.br/geonetwork/srv/pt/main.home, accessed on 1 January 2024) for 2017. The data (available on an ottobasin scale) were analyzed, and those related to the community areas were extracted using the free software QGIS 3.18.1.

2.2. Socioeconomic Data and Calculation of the Social Vulnerability Index (SVI)

The Social Vulnerability Index (SVI) includes data on poverty, income, education, health and basic sanitation. These variables were obtained from the last Demographic Census, conducted by the Brazilian Institute of Geography and Statistics (IBGE) in 2010. The following indicators were considered to diagnose social vulnerability: basic sanitation, Municipal Human Development Index (MHDI), poverty incidence and the GINI Index. When integrated, these indicators represent the sociodemographic situation of the cities where each community is located.
The Basic Sanitation Indicator represents the percentage of households that have basic sanitation considering the adequate water supply, sewage collection and treatment systems and solid waste. According to the United Nations Development Program (UNDP), the Municipal Human Development Index (MHDI) quantitatively presents the situation of municipalities regarding education (formal schooling), longevity (life expectancy, which is closely related to investments in the health area) and income. It ranges from zero to one, and the closer it is to one, the greater the human development. It is considered very low between 0.0 and 0.499; low between 0.500 and 0.599; medium between 0.600 and 0.699; high between 0.700 and 0.799 and very high between 0.8000 and 1.0.
Poverty, like inequality, can be measured in different ways. The most widely used measure of poverty is the ratio between the number of people living below the poverty line and the total population. The concept of poverty can refer to both regional and local underdevelopment, which imposes deprivation in basic living conditions, such as electricity, running water, sanitation facilities and difficulty in accessing health and education services, and to demographic characteristics and limitations in the human and financial capital of families, which hinder the ability to increase family income [84].
The GINI Index measures the degree of income concentration of a given group, in other words, the inequality that exists in the distribution of individuals according to per capita household income. Its value is zero when there is no inequality (the per capita household income of all individuals has the same value) and tends to one as inequality increases.
The construction of the Social Vulnerability Index (SVI) can be expressed by the sum of the indicators and weighted by the different weights associated with them, according to the equation:
S V I = i = 1 n I N D i × W i i = 1 n W i
in which SVI: Social Vulnerability Index, dimensionless; IND: indicator; and W: weight.
It should be noted that the use of data from the 2010 Demographic Census represents a relevant limitation of this study, especially about social indicators, whose dynamics may have changed significantly in recent years. In other words, changes may have occurred in the socioeconomic profile of the population, in the patterns of territorial occupation and in the supply of basic urban services, elements that directly influence the vulnerability indicators used in the study. As a consequence, there is a risk that the index prepared does not reflect, with complete precision, the conditions currently present, which may limit its direct application in more recent public policies. However, despite this limitation, the use of the 2010 Census remains the main national reference for social vulnerability analyses, being widely adopted in similar studies. Finally, it should be noted that the interpretation of the results was carried out with caution, considering the historical context of the regions analyzed and recognizing the possible changes that occurred over the period.
The Social Vulnerability Index was calculated from the social data collected by assigning their respective weights. The weights of each variable were defined using the AHP method [66].

2.3. Generation of the Socioenvironmental Vulnerability Index

Next, the following equation was used to integrate the indexes (EnVuIn and SVI) and calculate the SEVI:
S E V I = S V I ) + ( E n V u I n 2
in which SEVI = Socioenvironmental Vulnerability Index; EnVuIn = Environmental Vulnerability Index; and SVI = Social Vulnerability Index.
Therefore, it was possible to find a value on a scale ranging from 0 to 1, where the maximum corresponds to one (equating to very high vulnerability) and zero (to very low vulnerability). The communities were then categorized according to socioenvironmental vulnerability classes to graphically represent the index. The scale followed the same classification values as in Table 2.
Based on the SEVI calculation, it was possible to establish a classification between the interval values found (very low, low, moderate, high and very high vulnerability). Thus, the values closest to one reflect greater vulnerability and, therefore, present the worst social and economic conditions.
The SEVI ranges from 0 to 1, and its classes follow Table 2.

2.4. Data Normality

The Social and Environmental Vulnerability Index variables were standardized to harmonize the scales of the different data. Normalization was used, which maps the data of the original vector X into a new domain, defined by the interval [Lmin, Lmax], through linear transformations, defined by the function:
X = X X m i n X m a x X m i n L m a x L m i n + L m i n
in which X′ = normalized variable; X = observed variable to be normalized; Xmin = minimum value of variable X; and Xmax = maximum value of variable X.
The indicators that compose this study can have a positive relationship with vulnerability when they contribute to its reduction or a negative relationship contributing to an increase in vulnerability. Thus, it was possible to cross-reference the indicators that generated results varying between zero and one. Therefore, the closer to zero, the lower the vulnerability, and conversely, the closer to one, the greater the vulnerability.
Positive : X i , j = X i , m a x X i , j X i , m a x X i , m i n
Negative : X i , j = X i , j X i , m i n X i , m a x X i , m i n
In summary, Table 3 provides information about the indicators, the input data sources and how they were acquired.
The indices used in the study were calculated considering different spatial scales, in which some directly focused on the water body and others on the surrounding area. However, since this is an approach aimed at assessing socioenvironmental vulnerability, it is understood that all variables are interconnected and together contribute to characterize drought risk in rural communities. For example, the surrounding area directly influences the availability and quality of river water, whether through land use and occupation, vegetation cover or local agricultural practices. Thus, even the indicators calculated for different areas are connected within a broader socioenvironmental system, and their integrated analysis enables a deeper understanding of the vulnerability situation of these communities.
In this sense, vulnerability is understood as a process resulting from the combination of several socioenvironmental factors that, when interacting, weaken certain social groups, which can lead to disastrous consequences such as material and/or life losses [88]. Some papers [38,89] also highlight this interdependence between nature and society by establishing a cause-and-effect relationship, in which risk is associated with the degree of exposure to critical situations (whether of natural or social origin) that generate vulnerability in certain groups.

3. Results

3.1. Environmental Vulnerability Index (EnVuIn)

First, five categories of environmental vulnerability were defined based on the environmental indicators, represented by the very high, high, moderate, very low and low vulnerability classes. After normalizing the data, the Environmental Vulnerability Index was calculated and its respective classes defined. The highest weight for the indicators of the Environmental Vulnerability Index was attributed to the “WSI” indicator and the lowest to the “WQI” indicator.
The judgments in this study were subjected to verification of the consistency index, which remained below the threshold of 0.1, as recommended by Saaty, which validates the consistency of the comparisons made. Table 4 below shows the comparison matrix and the consistency ratio (CR).
Table 5 presents the environmental data of the communities.
After normalization, the indicators as well as the EnVuIn will have values between 0 and 1, so that the closer to 1, the greater the social vulnerability. The classes can be very low (0 to 0.200), low (0.201 to 0.300), medium (0.301 to 0.400), high (0.401 to 0.500) or very high (≥0.501) (IPEA, 2015), as observed in Table 6.
The EnVuIn values demonstrated the variation in environmental vulnerability. The communities José Marcos and Sezinio presented low environmental vulnerability. Florestan Fernandes and Georgina were classified as moderate environmental vulnerability; Novo Sonho, Ita, Monte Alegre and Santa Clara were classified as high; and finally, the Boa Esperança community had a very high EnVuIn.

3.2. Social Vulnerability Index (SVI)

The Social Vulnerability Index was calculated using the social data collected (Table 7), assigning their respective weights. The weights of each variable which compose the SVI were defined using the “Analytic Hierarchy Process” (AHP) method [70]. This method is commonly used to define the weights and importance of variables to identify the most vulnerable areas. The highest weight for the Social Vulnerability Index indicators was assigned to “poverty incidence” and the lowest to the “GINI Index” indicator.
According to Table 1, the five social vulnerability categories are represented by very high, high, moderate, low and very low vulnerability classes. The SVI ranges from 0 to 1, so that the closer to 1, the greater the social vulnerability. The classes can be very low (0 to 0.200), low (0.201 to 0.300), medium (0.301 to 0.400), high (0.401 to 0.500) or very high (≥0.501) [85].
Table 8 shows the data on social indicators with their normalized values, as well as the SVI result and its classification.
It is possible to see that seven communities were classified as having very high social vulnerability, and two presented high SVIs. This study found weaknesses in these areas in relation to quality of life, income, education and basic sanitation.

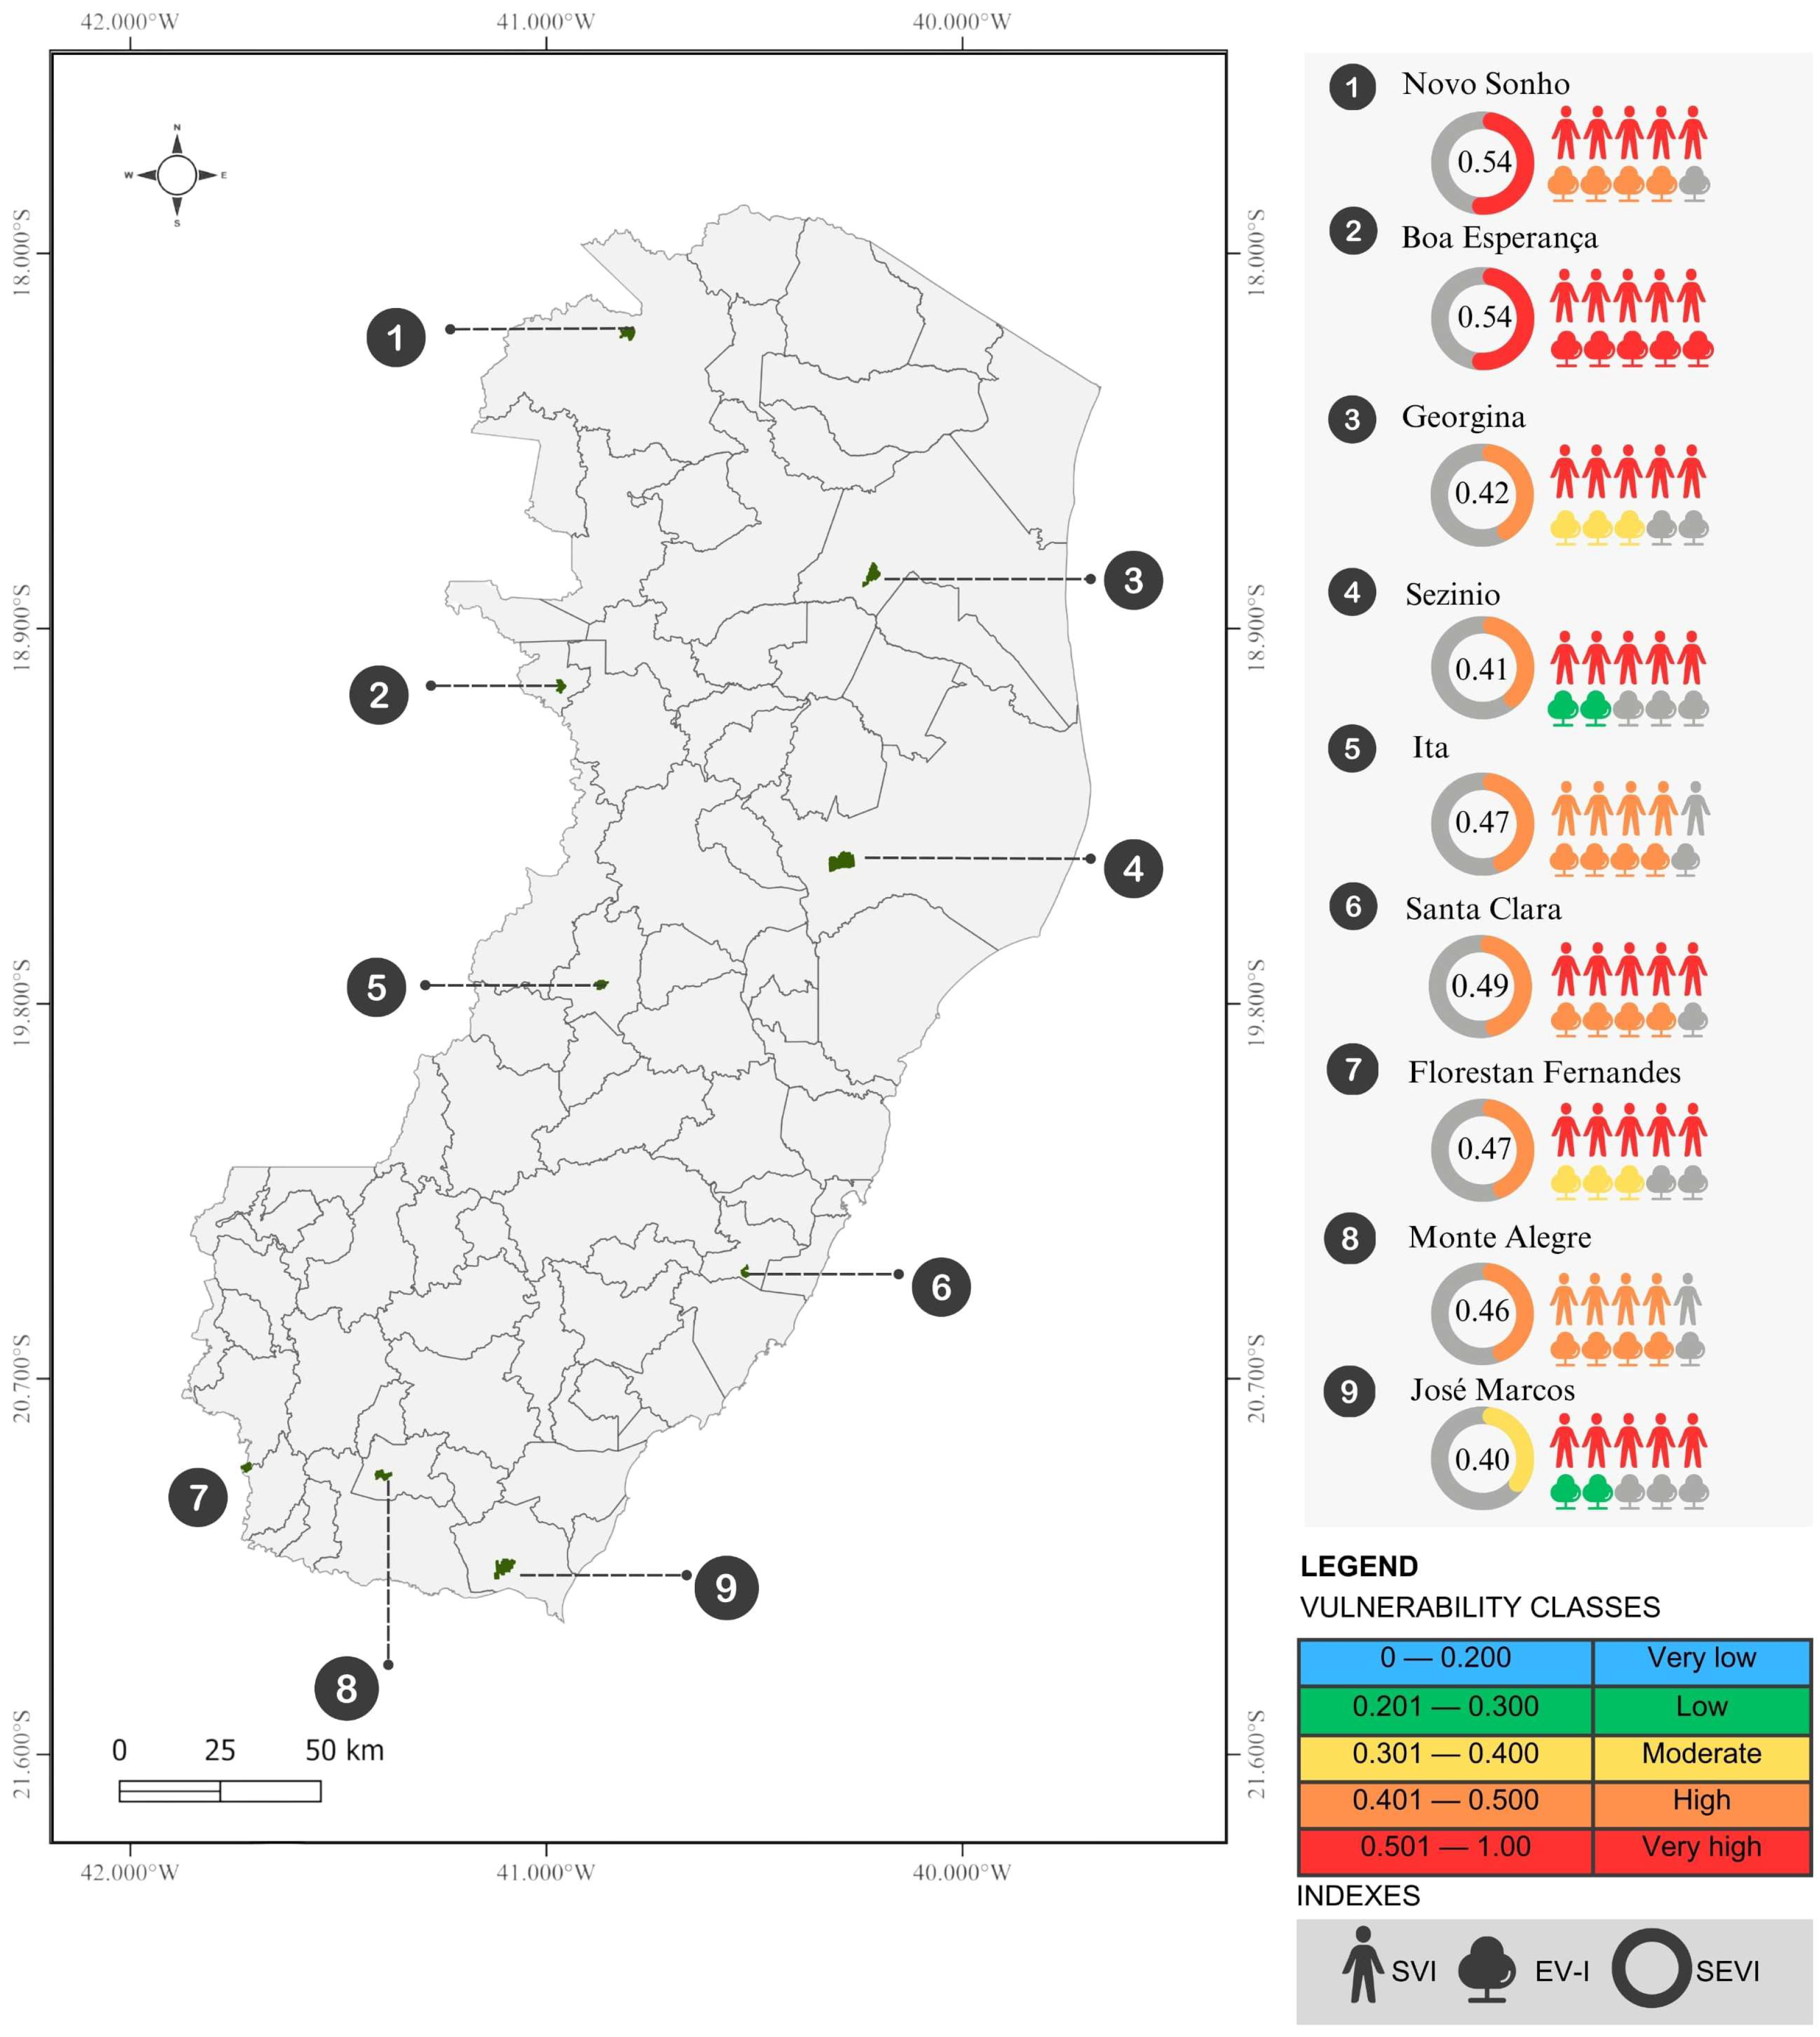
3.3. Socioenvironmental Vulnerability Index (SEVI)

Social Vulnerability (SVI) data combined with Environmental Vulnerability (EVI) data reveal the socioenvironmental vulnerability level. Therefore, the SEVI results correspond to communities where environments and populations coexist, which are exposed to risks arising from natural and social phenomena simultaneously. When physical exposure and social vulnerability are combined, they characterize risk territories that require attention and measures to reduce the problem, aiming at protecting human lives and/or material damage [90].
As described in Figure 4, the classifications obtained for the Socioenvironmental Vulnerability Index were of only three types: very high, high and moderate. The Novo Sonho and Boa Esperança communities registered the highest Socioenvironmental Vulnerability Indexes (SEVI = 0.54). In contrast, the José Marcos community obtained its SEVI classification as “moderate” (0.40). The other communities had their socioenvironmental vulnerability in the high class, with values between 0.41 and 0.49.

4. Discussion

The analysis of environmental vulnerability showed that the study areas in this study were mainly classified in the low, moderate, high and very high vulnerability classes. The José Marcos and Sezinio communities are in the low environmental vulnerability class, which presented positive Water Security Indexes (WSIs) and the existence of water reservoirs. These two indicators together account for approximately 50% of the total EnVuIn weight.
In the case of José Marcos, which obtained the lowest EnVuIn value, the combination of a high WSI (4.22) and the presence of reservoirs compensated for other factors, such as the high percentage of conflicts in PPAs (85.39%). Unlike the Sezinio community, despite having a moderate WSI (3.56), it benefits from the absence of conflicts in PPAs and the balance in other indicators.
The existence of water reservoirs can contribute to reduce environmental vulnerability when related to drought. The results on the existence of reservoirs highlight their strategic importance for water management, especially in regions subject to seasonal variations in water availability. This storage regulates the dynamics of floods and ebbs, favoring the supply for human and animal populations and food production through irrigation and fish farming, in addition to recreational activities [91]. For the authors, these water sources have become fundamental for the socioeconomic development of the region. However, the study points to a disparity between the communities studied, since only Sezinio, José Marcos and Georgina have some type of water reservoir in their areas. This inequality suggests significant differences in the water infrastructure available between the communities, which may impact the ability of each community to face drought periods.
In turn, two communities present distinct characteristics in the moderate environmental vulnerability class. The Georgina community has a water reservoir, a Water Security Index (WSI) considered high (above 3.51), and the lowest percentage of usage conflicts in Permanent Preservation Areas (PPAs). However, it is the only community that presented a high WCMI value, which is a factor that contributed to this classification. The WCMI values can vary between 0 ≤ WCMI ≤ 1, a situation in which the flows granted upstream of the mouth of the segment under study are within the legal limits. The Georgina community presented WCMI = 1, indicating that the grants did not exceed the 50% criterion of Q90 but are at the maximum limit allowed (0.9 < WCMI ≤ 1). In other words, the permissible flow rate to be granted is less than 10% of the maximum flow rate that can be granted, or the grant limit has been reached [75].
The joint WCMI and WCPI analysis allowed us to verify that a solution in the event of conflicts over water use can be obtained by investing in works that increase water availability for concession throughout the year. Furthermore, it allows for water availability analyses at the hydrographic segment level, enabling the management body to act locally to resolve existing conflicts or to plan solutions for imminent conflicts.
On the other hand, although the Florestan Fernandes community does not have reservoirs, it has a maximum WSI level, indicating a high capacity for resilience, safety and sustainability in water use. This indicator is essential for dealing with drought in rural communities, as it reflects the availability and rational use of water resources, which are essential for guaranteeing water security, agricultural production and the quality of life of the population, minimizing the impacts of prolonged droughts.
However, the data presented reinforce the complexity of water security and the need for more integrated approaches. A high WSI, such as that of Florestan Fernandes, should not be seen as a guarantee of water well-being without access. Despite reaching the highest level in the index, there is a disconnect between the score and the reality experienced by families. The water availability in the area does not translate into effective access, highlighting the importance of not only analyzing the existence of resources, but also the infrastructure, governance and legal issues that guarantee the use of this resource. Therefore, it is important to think about greater refinement in the concept of risk adopted in elaborating the WSI, especially for regions with greater climatic and social vulnerability [92]. The risk in these places transcends water supply, demands quantifications and directly affects the human, political and economic development of the population, impacting all human actions that occur in the region and, consequently, its water security.
The WSI aims to diagnose and characterize water security under multiple dimensions. It reflects information on the risk of population shortages and economic losses associated with water scarcity. The index is composed of a set of indicators that cover both the quantity and quality of water available for human supply and for productive sectors (such as industry, livestock and irrigation), in addition to considering water availability for ecosystem uses, the presence of natural and artificial reserves and the variability of rainfall. However, studies pointed to the occurrence of overestimated ISH values, which reinforces the need for methodological improvement [92,93]. Such adjustments must contemplate the combination of safety indicators with risk parameters, such as the severity of impacts and the probability of occurrence of critical events. Despite the divergences identified between the studies—attributed to different methodological requirements, computational limitations and the complexity inherent in the application of the index on a national scale [92]—the WSI prepared by the National Water and Basic Sanitation Agency (ANA) remains a relevant tool for the integrated management of water resources. Even so, the importance of considering local specificities, such as the class of the source, water availability and the predominant types of use, is emphasized [94]. In view of the above, it is important to clarify that although low and moderate EnVuIn communities presented a positive general condition, one cannot ignore the possibility of specific challenges, such as seasonality in supply or difficulties in maintaining infrastructure.
In contrast, the upper EnVuIn class is represented by the Monte Alegre, Novo Sonho, Ita and Santa Clara communities, which have the lowest WSI values, no reservoirs and high percentages of conflicting uses in their PPAs. In particular, communities with a medium WSI classification, such as Ita and Santa Clara, require priority attention to avoid future water crises. These areas face greater water vulnerability, indicating possible limitations in the availability, quality or accessibility of water, which require specific interventions. Boa Esperança was environmentally classified as very highly vulnerable. Added to the fact that it does not have water reservoirs in its area, this community presented the highest percentage of conflict in PPAs.
In this sense, the relevance of including this indicator for this case study is clear, since these conflicts reflect the anthropization of these areas, as evidenced by the occupation by pastures, agricultural crops, built-up areas, reforestation with eucalyptus and exposed soil. Conflicting use exceeds 80% in some communities, which can compromise the quality of water and soil resources that are essential for the subsistence of local communities. The predominant use of PPAs for livestock and agriculture requires attention, since these types of occupation can result in soil compaction, intensified erosion and increased leaching. In addition, they contribute to silting rivers and springs, causing significant changes in water flow and impacting aquatic biota [95].
These areas with exposed soil can compromise the useful life of watercourses and, therefore, deserve special attention with regard to land use and occupation activities [96], which, if not conducted with caution, can potentiate the effects of natural processes, such as intensified soil losses due to erosion and, consequently, silting and reduced water quality. Thus, inappropriate use of PPAs exposes communities to environmental and socioeconomic impacts.
It is important to emphasize that the SPI obtained the second highest weight in this work and although the average results of the SPI may indicate similarities for this case study, its inclusion in the EVI calculation continues to be important and justifies this score. The SPI analysis allows us to identify severe to extreme drought events in several areas, highlighting critical periods that significantly impact the analyzed communities. In certain contexts, these events can aggravate the effects of poverty, especially in rural communities. For example, the Georgina and Boa Esperança communities are located in the Northeast and Central-West micro-regions, which are traditionally vulnerable to impacts from drought [96,97].
Some studies highlight that droughts more intensely affect small family farmers, since they are particularly vulnerable to adverse weather conditions [98]. This situation results in structural challenges that compromise economic stability and reduce the quality of life of families. Thus, by integrating the SPI into the EnVuIn calculation, the effectiveness of the SPI as a tool for identifying critical drought and humidity periods is reinforced. These data are essential to support mitigation strategies and actions to adapt to climate change. Furthermore, they emphasize the importance of continuous and long-term monitoring, aiming to understand the impacts of climate variability on the economic and social dynamics of rural communities.
The EnVuIn results differ from those presented by the original index paper [66], since the Environmental Vulnerability Index had little variation in its class in that study. Six of the nine locations were classified as moderate and the others with a low EnVuIn. This can be justified by the inclusion of new indicators in this case study and by the different weights established for each one.
The Social Vulnerability Index (SVI) was calculated based on the social data obtained. It was observed that two communities were classified as highly vulnerable, while seven presented indices indicating very high vulnerability. This study highlighted weaknesses in the communities analyzed, especially in aspects related to quality of life, income, education and access to basic sanitation.
It is possible to observe that the most vulnerable communities presented the highest poverty incidence rates, given that this indicator received a weight of approximately 50% in relation to the others. In contrast, Ita and Monte Alegre were the only communities with a high SVI and the lowest poverty incidence rates. Therefore, these communities require greater attention and financial investment from public managers to reduce social vulnerability associated with poverty. For example, Novo Sonho presented the highest SVI value, a result of its low WHDI, combined with a high poverty incidence rate and inequality measured by the GINI Index.
Data from IBGE [87] reveal that 8.1 million people from a total rural population of 30.7 million people in Brazil are classified as extremely poor, with the distribution of these people being very unequal among Brazilian regions. Restrictions on access to land, limitations on the education offered, difficulties in accessing markets, deprivation of access to basic services and infrastructure deficiencies in several areas are some of the historical determinants of rural poverty in Brazil [99].
According to data from the IBGE, 144,885 people in the state of Espírito Santo live in extreme poverty. In relative terms, this means that 4.12% of the population of Espírito Santo is extremely poor. Most of the extremely poor people live in urban areas (61.02%, or 88,409), while 38.98% (56,476) live in rural areas. The intensity of extreme poverty is repeated in all regions, with small differences. The urban population that lives in extreme poverty does not exceed 4.5%, while this percentage reaches 11.3% in rural areas, as in the Southern region. However, the people who live in rural areas in the Northwest Mesoregion, where the two communities with the highest poverty incidence percentages and also the highest SVIs are located (Novo Sonho and Boa Esperança), represent 53% of the total population, and 9.6% of the rural population is extremely poor. Extreme rural poverty is higher in all municipalities in the region than extreme urban poverty, also showing the intensity of rural poverty over urban poverty [100].
The second most important indicator that can help explain the results is basic sanitation. It is noted that the rural population lives in precarious sanitation conditions, since the best condition among the study areas was approximately 5%, in the José Marcos community, followed by Santa Clara. This panorama reflects the national situation, where 7 of every 10 people without sanitation live in rural areas [101]. Other authors have pointed out the problem of sanitation lacking in rural areas [102,103]. Basic sanitation integrates water supply services; sewage disposal; solid waste packaging, collection, transportation and disposal; drainage provision and rainwater management [104]. However, managers exclude rural, Indigenous, settled and quilombola populations due to the high costs of conventional sanitation technologies [105].
Access to drinking water and basic sanitation are a serious public health problem in rural areas, mainly affecting the health of vulnerable groups, such as children [106]. Lower-income social groups are generally those with less access to clean air, drinking water, basic sanitation and land security. Economic dynamics generate a process of territorial and social exclusion that leads to rural exodus in the countryside due to the lack of expectation of obtaining better living conditions [107]. The health conditions of a population, as well as socioeconomic development, are related to access to water in quantity and quality [108]. Furthermore, although it is a basic human right, access to drinking water is still a distant reality in rural areas.
The SVI was developed as a tool to compare social vulnerability between communities in different municipalities, focusing on the poverty of the population, and using data made available by the IBGE. As suggested by others [109], the SVI is a relative measure, as it assesses inequalities between locations in the context of vulnerability without representing an absolute level of this condition. Therefore, the SVI can be adapted and expanded whenever necessary to include other social indicators that reflect the specificities and demands of each region.
In view of the above, the SVI results reinforce the need for government interventions to improve income, education and access to basic services. This type of analysis, supported by IBGE data, can guide public policies aimed at the most vulnerable communities, ensuring efficient resource allocation to reduce inequalities and improve quality of life.
Considering the overlap of social and environmental vulnerability indicators, the result showed that eight communities were at a high or very high socioenvironmental vulnerability levels, and only one had a moderate SEVI. The Novo Sonho community, which had the highest Social Vulnerability Index (SVI = 0.62), also recorded the highest Socioenvironmental Vulnerability Index (SEVI = 0.54). This demonstrates a direct correlation between high social vulnerability and greater exposure to environmental risks. In contrast, although the José Marcos community presented a high SVI (0.56), it had low environmental vulnerability (EnVuIn = 0.25). As a result, its SEVI rating was moderate (0.40), highlighting that environmental improvements can mitigate social vulnerabilities in some regions.
Similar to the EnVuIn, the SEVI results adapted in this study also differed from those of the original index [66]. For this author [66], the classifications obtained for the Socioenvironmental Vulnerability Index were only two types: moderate and high. The inclusion of variables in the EnVuIn impacted the classification of communities in the SEVI, differentiating the results in comparison with previous studies. Introducing variables such as the Water Quality Index (WQI), the percentage of conflicting use of Permanent Preservation Areas (PPAs) and the existence of water reservoirs introduced new elements that directly influence environmental vulnerability. Expanding the indicators enabled a more detailed understanding of the impacts of environmental degradation and socioeconomic conditions on the rural communities analyzed.
Environmental degradation is closely linked to increased social vulnerability through interdependent mechanisms. Among them, greater exposure to environmental risks, deterioration in the quality of natural resources, limited economic opportunities and precarious urban services stand out. Such impacts tend to be more severe in socially marginalized territories, where there is less capacity for adaptation, as well as limited access to protection and mitigation mechanisms. According to Paiva et al. (2019) [110], the more environmentally vulnerable an area is, the more vulnerable society becomes. In addition, the unequal distribution of the effects of degradation reveals patterns of environmental injustice, aggravating historical inequalities and deepening processes of exclusion. Populations in situations of greater socioeconomic fragility tend to occupy areas exposed to environmental risks, where there is often less presence of public authorities and basic infrastructure. Therefore, it becomes a cycle where the economic marginalization of informal areas contributes to their transformation into ecological risk zones, in which environmental degradation tends to intensify. This process, combined with the absence of adequate infrastructure, increases the risks faced by the populations that live in them, in addition to generating conflicts with current environmental legislation. The resulting environmental deterioration directly impacts the living conditions of residents, deepening socioenvironmental vulnerability and aggravating the processes of economic and territorial exclusion [111].
In this sense, environmental degradation is closely linked to the dynamics of vulnerability, since poverty and social vulnerability are mutually reinforcing conditions, followed by deficiencies in public policies, adverse climatic conditions and low agricultural suitability of soils, especially when natural resources are exploited in an unsustainable way from the point of view of their preservation [112]. The intensification of processes such as deforestation, soil sealing and pollution compromises the quality of essential natural resources, disproportionately affecting those with less access to health and sanitation services. In addition, environmental degradation can reduce local economic opportunities, making it difficult for families who directly depend on the environment to survive for income generation.
In rural communities, family farmers are among the most vulnerable groups, since they depend directly on natural resources for their livelihoods. Water scarcity, intensified by extreme weather events, directly affects agricultural production, compromising both food security and the income of these families. When these farmers do not have adequate means to face such events, vulnerability worsens, weakening their productive base and compromising the sustainability of the agroecological system as a whole. The results of this study indicate that environmental degradation contributes to aggravating situations of social vulnerability, directly affecting the livelihoods of local populations. The occupation of PPAs, often motivated by the lack of productive alternatives, increases exposure to environmental risks, compromises the integrity of ecosystems and compromises the quality of surface and groundwater [113].
The suppression of native vegetation on slopes, river banks, and springs compromises essential ecological functions, such as sediment retention, water infiltration into the soil and maintenance of the flow of watercourses [114]. When associated with the irregular occupation of these areas, the absence of adequate sanitary sewage systems contributes to the contamination of water bodies by domestic sewage and solid waste, which accentuates local environmental degradation. As a consequence, unsatisfactory Water Quality Indices can be observed, increasing the risks to public health. At the same time, the degradation of recharge areas and the reduction of vegetation cover contribute to the reduction of water availability, aggravating conflicts over the use of water in periods of drought and directly impacting domestic supply, family farming and animal watering. These factors reinforce the understanding that in the rural context, environmental degradation goes beyond the ecological dimension and directly compromises the resilience of ecosystems, constituting a structuring element of social and territorial vulnerabilities. By affecting the quality and availability of natural resources, especially water, and by affecting more severely populations with less adaptive capacity, environmental degradation aggravates pre-existing inequalities and limits the possibilities for sustainable development.
Based on the obtained results, including new variables in the Socioenvironmental Vulnerability Index calculation proved to be essential to increase the sensitivity and explanatory capacity of the index. These variables allowed us to capture dimensions that had not been addressed in an integrated manner until now, such as the quality of available water, the degradation of environmentally fragile areas and the water support infrastructure, which are essential aspects for understanding vulnerability in rural communities. Therefore, the expansion of the SEVI represented a significant methodological advance, making the index more adherent to the complexity of rural realities and more effective as an instrument to support territorial planning and promote sustainability.
Communities with greater social vulnerability showed a direct relationship with environmental vulnerability, showing that the scarcity of natural resources and environmental degradation aggravate social and economic inequalities. The methodological adaptation enabled refining the identification of the most vulnerable communities, offering more robust subsidies for formulating public policies and strategies to mitigate environmental and social impacts.
As evidenced by another study, the existence of better environmental conditions does not mean that the resident populations do not have difficulties in coping with the effects of long drought periods, since all communities presented undesirable conditions in the social aspect [115]. In this sense, socioenvironmental risks cannot be solely defined based on natural aspects; they constitute an association of these phenomena with the capacity of social groups to protect themselves, meaning social vulnerability [41].
Socioenvironmental vulnerability results from overlapping socioeconomic conditions that simultaneously produce precarious living conditions and environments susceptible to adverse events, also expressing themselves as a reduced capacity to cope with disaster risks [116]. Thus, based on the scenarios of social and environmental vulnerability in the areas under study, it was possible to identify those communities that presented a greater degree of socioenvironmental vulnerability. Other studies also revealed that small properties are in highly vulnerable socioenvironmental areas, often associated with a lack of financial resources and inadequate soil management [115]. Therefore, modernizing management practices to ensure the long-term sustainability of ecosystem services and soil productivity must be applied, since many traditional land-use practices contribute to depleting natural resources and intensifying poverty.
It is possible to draw a comparative overview between the communities studied based on the Socioenvironmental Vulnerability Index (SEVI) results, highlighting the main factors that explain the differences in vulnerability levels. Despite the social fragility in José Marcos, the only community with a moderate SEVI, good water infrastructure (water reservoirs and high ISH) acts as a mitigating factor, reducing socioenvironmental vulnerability.
Although most communities have high socioenvironmental vulnerability, they have different factors. For example, despite the Georgina community having water infrastructure that helps mitigate risks, it has pressure on other resources and is located in a region that is traditionally affected by drought, requiring monitoring and adaptive management. Moreover, although the infrastructure in Sezinio is not ideal, the presence of reservoirs and moderate pressure on land use keeps the vulnerability level at a relatively controlled level. Florestan Fernandes highlights the role of governance and infrastructure, because even with good natural conditions and with WSI at the maximum level, there are no reservoirs, and the population faces practical limitations in access to water. In turn, Monte Alegre, Ita and Santa Clara are environmentally vulnerable and socially fragile communities that require water planning and land-use control. They do not have reservoirs, and the WSI varies from medium to low, with intense conflicts in PPAs.
Finally, Novo Sonho and Boa Esperança were the communities with very high SEVIs, reflecting the very high SVI, justified by the high poverty and inequality, an absence of reservoirs, high conflicts in PPAs (>80%) and a WSI considered low. The sum of these factors severely aggravates the socioenvironmental vulnerability of these areas.
The inclusion of the variables PPA and WQI and the existence of water reservoirs in the Socioenvironmental Vulnerability Index in rural communities represents an advance in the integrated approach to vulnerability analysis, especially in relation to drought. Combined with other indicators, the SEVI enables a contextualized assessment of the environmental and social conditions of the study area, revealing both the weaknesses and adaptive potential of rural communities in facing an intensification of drought events. Due to the difference in regional environments, the vulnerability assessment mechanism varies from region to region. Therefore, it is difficult to develop a set of indicators that has broad adaptability, which is also why the selected indicators vary greatly according to the research object. Several studies have been developed to assess environmental and/or socioenvironmental vulnerability, defining the most representative indicators for each region. For example, ref. [117] selected 12 indicators from four aspects, including relief, meteorology, vegetation and irrigation conditions to assess environmental vulnerability. Alos, ref. [118] developed the Socioenvironmental Vulnerability to Desertification Index (SVDI) for the state of Espírito Santo. The index was developed using data such as the illiteracy rate, population growth, gross domestic product, average income of the population, precipitation, evapotranspiration, surface temperature, Aridity Index and water quality monitoring. In addition, ref. [119] used six natural factors (slope, elevation, relief dissection, precipitation, pedology and geology) to determine the Environmental Vulnerability Index for the Rio Doce basin, along with four factors associated with human activities (distance from urban centers, distance from roads, distance from mining dams and mapping of land use and land cover) to determine the Environmental Vulnerability Index.
Moreover, ref. [115] developed a methodology to assess these impacts using a Socioenvironmental Vulnerability Index (SVI), which combines physical, environmental and socioeconomic indicators related to exposure, sensitivity and adaptation. The developed SVI was applied in two large Brazilian river basins, which are home to two important Brazilian biomes threatened by agricultural expansion in Brazil: the São Francisco and Parnaíba River Basins. The index integrates variables such as the Municipal Human Development Index (MHDI); number of days without rain; land use and land cover; surface temperature; soil type; land degradation/desertification and population density. Also, ref. [120] quantitatively assessed the vulnerability of water quality to extreme drought in the Nakdong River Basin in South Korea. To do so, they used the meteorological drought index SPI in various periods and the following water quality indicators: dissolved oxygen (DO), biological oxygen demand (BOD), chemical oxygen demand (COD), chlorophyll-a concentration, total nitrogen (TN) and total phosphorus (TP). For the authors, although the extent of drought-related effects varies from humans to environmental systems, the impacts on water quality in particular require careful investigation. Such investigation should include the interconnections between climate and river quality variables and how the risk translates to various river basins, given their particularities in relation to land use, river basin characteristics and infrastructure.
The results of this study are important, as understanding drought impacts is still complex. They do not directly affect people’s physical integrity, as is the case with floods and landslides, but they do lead to an exhaustion of resources that are essential to their biological and social survival [121]. Drought impacts occur slowly, extending over a long low-rainfall period [122]. Thus, there is progressive worsening of adversities, as their effects tend to accumulate, generating severe crises in terms of social, economic and environmental stability. The intensity and frequency of droughts affect areas in different sectors, whether in agriculture, livestock, essential services and the community in general [123], directly affecting the stability of income and employment of rural workers.
Drought events and precipitation anomalies will continue to occur and may be intensified by the environmental and social conditions of communities. Even though their effects cannot be avoided, they can be mitigated through measures related to water infrastructure and strategic planning for communities, especially in contexts of high social and environmental vulnerability. As recommended by another study [124], it is necessary to establish municipal ecological–economic zoning through strategic planning, a rural sanitation plan, a sustainable rural development plan, the implementation of continuing environmental education programs, the creation of a fund for payment of environmental services and the implementation of water quality monitoring programs. It is important to integrate environmental issues to resolve the precariousness or absence of basic sanitation, involving technical, social and cultural aspects.
Despite the methodological advances presented, this study presents some relevant limitations. One of the main deficiencies refers to the unavailability of data on the Water Quality Index (WQI) for some communities studied, which required a proportional redistribution of weights among the other indicators. Although this adaptation is methodologically justifiable, it may have partly compromised the consistency in the comparative assessment of environmental vulnerability among communities. In addition, the analysis of water reservoirs adopted a binary approach (presence or absence), without considering critical aspects such as capacity, conservation status or management methods, which limits the depth of the water security assessment. However, it is worth noting that the value of the weights can be recalculated in cases where all data are available to avoid underestimating or overestimating the real environmental condition, thereby influencing (albeit subtly) the final SEVI result. Finally, the analysis in this study is based on quantitative data and does not incorporate perceptions of the local population, which could provide a more realistic and in-depth view of the challenges faced by communities.
Future research could improve the Socioenvironmental Vulnerability Index (SEVI) by incorporating more recent and detailed data on water infrastructure and actual access to drinking water, especially considering qualitative indicators and perceptions of the local population. It is recommended to include information on reservoir capacity, conservation status and forms of community management of water resources. In addition, it would be pertinent to develop participatory methodologies that integrate local knowledge, favoring more contextualized analyses that are sensitive to the specificities of each territory. A promising path for research refers to projecting and evolving vulnerability in the face of future drought or climate change scenarios. Another strategic direction is to expand the SEVI application to other rural regions of Brazil with different socioenvironmental profiles in order to validate and adjust the index to different realities, strengthening its applicability as an instrument for territorial management and for formulating public policies.

5. Conclusions

The environmental vulnerability classes in the communities ranged from low to moderate and high. This highlights challenges related to water resource management and the management of environmental preservation areas.
The social data indicated weaknesses in the communities analyzed, especially in aspects related to quality of life, income, education and access to basic sanitation. Two communities were classified as highly vulnerable, while seven presented indexes indicating very high vulnerability.
Most communities presented high or very high socioenvironmental vulnerability levels, reflecting both environmental fragility and socioeconomic challenges, such as poverty and lack of basic infrastructure.
The inclusion of new variables in the Environmental Vulnerability Index (EnVuIn) calculation was essential to establish a more accurate assessment of the vulnerability of the communities studied, both environmentally and in relation to the Socioenvironmental Vulnerability Index (SEVI).
The Socioenvironmental Vulnerability Index (SEVI) can serve as a tool to indicate critical areas that require priority actions to reduce drought impacts and promote community resilience, in addition to guiding public policies and strategies to foster environmental and social sustainability.
Expansion of the SEVI represented a relevant methodological advance, making the index more adherent to the complexity of rural realities and more effective as an instrument to support territorial planning and promote sustainability.
The relationship between socioeconomic, environmental, climatic and hydrological components in constructing the SEVI demonstrates how these indicators interact to intensify socioenvironmental vulnerability.
The results of the study reinforce the need for interventions and investment in rural communities related to basic sanitation, education, income generation, sustainable territorial planning, environmental education programs and water resource management technologies.

Author Contributions

Conceptualization, F.R.d.O., R.A.C. and S.S.Z.; methodology, F.R.d.O.; validation, F.R.d.O., R.A.C. and S.S.Z.; formal analysis, F.R.d.O., R.A.C. and S.S.Z.; investigation, F.R.d.O., R.A.C. and S.S.Z.; resources, R.A.C. and S.S.Z.; writing—original draft preparation, F.R.d.O., R.A.C. and S.S.Z.; funding acquisition, R.A.C. All authors have read and agreed to the published version of the manuscript.

Funding

This study was funded by the Fundação de Amparo à Pesquisa e Inovação do Espírito Santo, grant number 694/2022.

Institutional Review Board Statement

Not applicable.

Informed Consent Statement

Not applicable.

Data Availability Statement

Dataset available on request from the authors.

Acknowledgments

The authors thank the Espírito Santo Research and Innovation Support Foundation (FAPES: 694/2022) for supporting the development of this study.

Conflicts of Interest

The authors declare no conflicts of interest.

References

  1. Costa, T.T.R.; Correia, E.R.; Rodrigues, I.V.T.; Ramos, R.S.; Jorge, M.B.; Diógenes, R.S.T.D.M.; Flaker, C.H.C.; Bordignon, A.C. Avaliação Microbiológica e Físico-Química de Água Para Consumo Na Cidade de Pinheiro–MA: Impactos Da Falta de Saneamento Básico. Obs. Econ. Latinoam. 2024, 22, e7654. [Google Scholar] [CrossRef]
  2. Oliveira, B.O.S.D.; Nunes, C.H.D.S.; Correia, R.X.; Silva, D.M.P.D.; Souza, R.F.D.S.; Nascimento, L.D.S.D.; Campos, M.C.C. Qualidade Da Água Para Consumo Humano Em Comunidades Rurais No Sudoeste Da Amazônia. Front. J. Soc. Technol. Environ. Sci. 2023, 12, 305–317. [Google Scholar] [CrossRef]
  3. Dos Santos, G.S.; Paes, T.A.S.V.; Pessoa, T.B.A. Qualidade Da Água de Consumo de Comunidades Rurais Do Vale Do Jiquiriçá (Bahia): Análise Microbiológica e Percepção Dos Indivíduos. Rev. Bras. Meio Ambient. 2023, 11, 2–16. [Google Scholar]
  4. Prüss-Ustün, A.; Wolf, J.; Bartram, J.; Clasen, T.; Cumming, O.; Freeman, M.C.; Gordon, B.; Hunter, P.R.; Medlicott, K.; Johnston, R. Burden of Disease from Inadequate Water, Sanitation and Hygiene for Selected Adverse Health Outcomes: An Updated Analysis with a Focus on Low- and Middle-Income Countries. Int. J. Hyg. Environ. Health 2019, 222, 765–777. [Google Scholar] [CrossRef]
  5. Corrêa, R.F.M.; Ventura, K.S. Plano de Segurança Da Água: Modelo Conceitual Para Monitoramento de Riscos à Contaminação de Água Em Comunidades Rurais. Eng. Sanit. Ambient. 2021, 26, 369–379. [Google Scholar] [CrossRef]
  6. Baracho, R.O.; Bezerra, N.R.; Scalize, P.S. Proposition and Application of a Conceptual Model for Risk Management in Rural Areas: Rural Basic Sanitation Safety Plan (RBSSP). Resources 2024, 13, 90. [Google Scholar] [CrossRef]
  7. Silva, J.I.A.O.; Leite, A.F.; de Sousa, C.M. Apropriação Social Da Água Nas Comunidades Rurais Do Semiárido: Os Desafios Da Governança. Rev. Bras. Gestão e Desenvolv. Reg. 2023, 19, 647. [Google Scholar] [CrossRef]
  8. de Paiva Torres, M.F.; Saldanha, B.C. A Importância Socioeconômica Do Açude Do Sítio Fidalgo Na Comunidade Rural de Rafael Godeiro/RN. Geogr. Grapiúna 2024, 4, 64–83. [Google Scholar] [CrossRef]
  9. Pichel, N.; Vivar, M.; Fuentes, M. The Problem of Drinking Water Access: A Review of Disinfection Technologies with an Emphasis on Solar Treatment Methods. Chemosphere 2019, 218, 1014–1030. [Google Scholar] [CrossRef]
  10. Ferreira, D.C.; Graziele, I.; Marques, R.C.; Gonçalves, J. Investment in Drinking Water and Sanitation Infrastructure and Its Impact on Waterborne Diseases Dissemination: The Brazilian Case. Sci. Total Environ. 2021, 779, 146279. [Google Scholar] [CrossRef]
  11. Agência Nacional de Águas e Saneamento Básico. Relatório de Conjuntura Dos Recursos Hídricos No Brasil; ANA: Brasília, Brazil, 2022. [Google Scholar]
  12. Coelho, R.D.S.; Lima, D.R.; Ferreira, A.F.; Brito, R.D.C.M.; Schafer, A.G. Meio Ambiente E Sustentabilidade: A Associação Entre Ações Antrópicas E As Mudanças Climáticas. IOSR J. Bus. Manag. 2024, 26, 1–6. [Google Scholar] [CrossRef]
  13. Intergovernmental Panel on Climate Change Climate Change 2021: The Physical Science Basis. Contribution of Working Group I to the Sixth Assessment Report of the Intergovernmental Panel on Climate Change. Available online: https://www.ipcc.ch/report/ar6/wg1/ (accessed on 5 January 2025).
  14. Fernandes, J.S.A. Desastres Socioambientais: Impactos Na Política de Saúde Do Brasil. O Soc. Questão 2020, 23, 243–266. [Google Scholar]
  15. Pellegrino, G.Q.; Assad, E.D.; Marin, F.R. Mudanças Climáticas Globais e a Agricultura No Brasil. Rev. Multiciência 2007, 8, 138–162. [Google Scholar]
  16. Farooq, A.; Farooq, N.; Akbar, H.; Hassan, Z.U.; Gheewala, S.H. A Critical Review of Climate Change Impact at a Global Scale on Cereal Crop Production. Agronomy 2023, 13, 162. [Google Scholar] [CrossRef]
  17. Mbuli, C.S.; Fonjong, L.N.; Fletcher, A.J. Climate Change and Small Farmers’ Vulnerability to Food Insecurity in Cameroon. Sustainability 2021, 13, 1523. [Google Scholar] [CrossRef]
  18. Kabir, K.H.; Khan, M.A.; Hasan, K.; Aftab, S. Driving Forces of Adaptation Decision and Strategies to Climate-Related Events: Case on Farming Households in South–West Coastal Bangladesh. J. Environ. Assess. Policy Manag. 2022, 24, 2250019. [Google Scholar] [CrossRef]
  19. Rosa, L.; Chiarelli, D.D.; Rulli, M.C.; Dell’Angelo, J.; D’Odorico, P. Global Agricultural Economic Water Scarcity. Sci. Adv. 2020, 6, eaaz6031. [Google Scholar] [CrossRef]
  20. Roy, P.; Pal, S.C.; Chakrabortty, R.; Chowdhuri, I.; Saha, A.; Shit, M. Climate Change and Groundwater Overdraft Impacts on Agricultural Drought in India: Vulnerability Assessment, Food Security Measures and Policy Recommendation. Sci. Total Environ. 2022, 849, 157850. [Google Scholar] [CrossRef]
  21. Maru, H.; Haileslassie, A.; Zeleke, T.; Esayas, B. Analysis of Smallholders’ Livelihood Vulnerability to Drought across Agroecology and Farm Typology in the Upper Awash Sub-Basin, Ethiopia. Sustainability 2021, 13, 9764. [Google Scholar] [CrossRef]
  22. Williams, P.A.; Crespo, O.; Abu, M.; Simpson, N.P. A Systematic Review of How Vulnerability of Smallholder Agricultural Systems to Changing Climate Is Assessed in Africa. Environ. Res. Lett. 2018, 13, 103004. [Google Scholar] [CrossRef]
  23. Cerqueira, H.; Roxo, M.; Calvo-Cases, A. Mitigação e Adaptação Às Alterações Climáticas No Sul Da Europa. In The Overarching Issues of the European Area-Moving towards Efficient Societies and Sustainable Ecosystems; Faculdade de Letras da Universidade do Porto: Porto, Portugal, 2023; pp. 67–77. [Google Scholar]
  24. Ramamasy, S.; Baas, S. Climate Variability and Change: Adaptation to Drought in Bangladesh: A Resource Book and Training Guide; Food and Agriculture Organization of the United Nations: Rome, Italy, 2007. [Google Scholar]
  25. dos Santos, A.N.S.; Felippe, J.N.D.O.; Silva, K.L.; Júnior, P.R.D.S.; Salgado, J.J.D.F.; Assunção, I.D.; Xavier, T.D.S.; Guimarães, A.F.; Terto, F.L.; Noronha, T.P.; et al. Emergência Climática E Educação–Impactos No Meio Ambiente E A Transformação Do Currículo Escolar Pela Lei 14.926 De 2024. ARACÊ 2025, 7, 2379–2400. [Google Scholar] [CrossRef]
  26. Neves, F.M.; Chang, M.; Pierri, N. As Estratégias de Enfrentamento Das Mudanças Climáticas Expressas Nas Políticas Públicas Federais Do Brasil. Desenvolv. Meio Ambient. 2015, 34, 5–23. [Google Scholar] [CrossRef]
  27. Casagrande, D.; Emanuel, L.; Freitas, C.; Oliveira, F. Climate Adaptation Policies and Rural Income: Evidence from Social Technologies in Brazil. World Dev. 2024, 181, 106683. [Google Scholar] [CrossRef]
  28. Ferrari, F.J.; de Souza Netto, A.E.; Souza Netto, J.L. de Por Uma Abordagem Multidimensional Do Direito Dos Desastres Frente Aos Impactos Das Mudanças Climáticas. JURIS-Rev. Fac. Direito 2024, 33, 115–130. [Google Scholar] [CrossRef]
  29. Artaxo, P. Oportunidades e Vulnerabilidades Do Brasil Nas Questões Do Clima e Da Sustentabilidade. Rev. USP 2022, 135, 119–136. [Google Scholar] [CrossRef]
  30. Valois, I.M.; Cartaxo, E.F. Amazon Cities and Climate Change. Int. J. Innov. Educ. Res. 2022, 10, 189–209. [Google Scholar] [CrossRef]
  31. Neves, F.M.; Alvarez, G.; Corrêa, F.F.; Silva, J.B.L. Drivers of Vulnerability to Climate Change in the Southernmost Region of Bahia (Brazil). Soc. Nat. 2021, 34, e62222. [Google Scholar] [CrossRef]
  32. Alves, H.P.D.F. Socio-Environmental Vulnerability in the São Paulo Macro-Metropolis’ Three Main Metropolitan Regions: A Socio-Environmental Indicators Analysis Indicators Analysis. Ambient. Soc. 2021, 24, e00302. [Google Scholar] [CrossRef]
  33. Santos, M.R.D.S.; Vitorino, M.I.; Pereira, L.C.C.; Pimentel, M.A.D.S.; Quintão, A.F. Socioenvironmental Vulnerability to Climate Change: Conditions of Coastal Municipalities in Pará State. Ambient. Soc. 2021, 24, e01671. [Google Scholar] [CrossRef]
  34. Kirsch, H.M.; Schneider, S. Vulnerabilidade Social Às Mudanças Climáticas Em Contextos Rurais. Rev. Bras. Ciências Sociais 2016, 31, e319106. [Google Scholar] [CrossRef]
  35. Galeano, E.A.V.; Ventura, J.A.; dos Santos Martins, D. Socioeconomic Characterization of Employment in the Papaya Production Chain in Espírito Santo. Int. J. Prof. Bus. Rev. 2024, 9, e04678. [Google Scholar] [CrossRef]
  36. Galeano, E.A.V.; Costa, E.B.; Vinagre, D. Impactos Das Adversidades Agroclimáticas Na Produção Agropecuária Do Espírito Santo No Período de 2014 a 2017. In Proceedings of the 59° Congresso da Sociedade Brasileira de Economia, Administração e Sociologia Rural–SOBER, Brasília, Brazil, 8 February–8 June 2021. [Google Scholar]
  37. Castillo, M. Cómo Se Construye La Vulnerabilidad En Cundinamarca, Colombia, o La Historia de La Eterna Pobreza (de La Vivienda) Rural*. Bull. L’institut Français D’études Andin. 2014, 43, 559–585. [Google Scholar] [CrossRef]
  38. Blaikie, P.; Cannon, T.; Davis, I.; Wisner, B. At Risk. Natural Hazards, People’s Vulnerability and Disasters; Routledge: London, UK, 1994. [Google Scholar]
  39. Cartier, R.; Barcellos, C.; Hübner, C.; Porto, M.F. Vulnerabilidade Social e Risco Ambiental: Uma Abordagem Metodológica Para Avaliação de Injustiça Ambiental. Cad. Saude Publica 2009, 25, 2695–2704. [Google Scholar] [CrossRef] [PubMed]
  40. Girão, Í.R.F.; Rabelo, D.R.; Zanella, M.E. Análise Teórica Dos Conceitos: Riscos Socioambientais, Vulnerabilidade e Suscetibilidade. Rev. Geociências Nord. 2018, 4, 71–83. [Google Scholar] [CrossRef]
  41. Santos, J. de O. Existing Relations between Environmental Fragility and Social Vulnerability in Susceptibility to Risk. Mercator 2015, 14, 75–90. [Google Scholar] [CrossRef]
  42. Zanella, M.E.; Olímpio, J.L.; Costa, M.C.L.; Dantas, E.W.C. Vulnerabilidade Socioambiental Do Baixo Curso Da Bacia Hidrográfica Do Rio Cocó, Fortaleza-CE. Soc. Nat. 2013, 25, 317–332. [Google Scholar] [CrossRef]
  43. Alves, H.P.D.F.; Torres, H.D.G. Vulnerabilidade Socioambiental Na Cidade de Sao Paulo: Uma Analise de Familias e Domicilios Em Situacao de Pobreza e Risco Ambiental. São Paulo Perspect. 2006, 20, 44–60. [Google Scholar]
  44. Malta, F.S.; da Costa, E.M.; Magrini, A. Índice de Vulnerabilidade Socioambiental: Uma Proposta Metodológica Utilizando o Caso Do Rio de Janeiro, Brasil. Cien. Saude Colet. 2017, 22, 3933–3944. [Google Scholar] [CrossRef]
  45. Da Silva, N.G.; de Almeida, F.F.A.; Filho, R.L.M.S.; de Souza, W.M.; Galvíncio, J.D. Vulnerabilidade Ambiental e Socioeconômica Aos Eventos Extremos de Precipitação Relacionados a Seca No Semiárido Nordestino–Estudo de Caso Da Bacia Hidrográfica de Terra Nova–Pernambuco, Brasil. Rev. Bras. Geogr. Física 2023, 16, 1490–1510. [Google Scholar] [CrossRef]
  46. Edmonds, H.K.; Lovell, J.E.; Lovell, C.A.K. A New Composite Climate Change Vulnerability Index. Ecol. Indic. 2020, 117, 106529. [Google Scholar] [CrossRef]
  47. El-Zein, A.; Ahmed, T.; Tonmoy, F. Geophysical and Social Vulnerability to Floods at Municipal Scale under Climate Change: The Case of an Inner-City Suburb of Sydney. Ecol. Indic. 2021, 121, 106988. [Google Scholar] [CrossRef]
  48. Liu, Y.; Chen, J. Future Global Socioeconomic Risk to Droughts Based on Estimates of Hazard, Exposure, and Vulnerability in a Changing Climate. Sci. Total Environ. 2021, 751, 142159. [Google Scholar] [CrossRef] [PubMed]
  49. Johnson, D.; Blackett, P.; Allison, A.E.F.; Broadbent, A.M. Measuring Social Vulnerability to Climate Change at the Coast: Embracing Complexity and Context for More Accurate and Equitable Analysis. Water 2023, 15, 3408. [Google Scholar] [CrossRef]
  50. De Brito, A.G.M.; De Almeida, L.Q. Vulnerabilidade Socioambiental à Seca No Seridó Potiguar, Brasil: Construindo Indicadores. Soc. Nat. 2023, 35, e67826. [Google Scholar] [CrossRef]
  51. García, L.; Mungaray-Moctezuma, A.; Montoya-Alcaraz, M.; Sánchez-Atondo, A.; Calderón-Ramírez, J.; Gutiérrez-Moreno, J.M. Analysis of Socio-Environmental Vulnerability in Areas with Overpopulation and Natural Risks Induced by Their Urban-Territorial Conditions. Appl. Sci. 2024, 14, 6535. [Google Scholar] [CrossRef]
  52. Mendonça, F. Riscos, Vulnerabilidades e Resiliência Socioambientais Urbanas: Inovações Na Análise Geográfica. Rev. Anpege 2011, 7, 111–118. [Google Scholar] [CrossRef]
  53. Brandão, S.V.; Wanderley, L.S.O.; Dourado, D.C.P. Dinâmicas, Conflitos e Relações Em Segurança Alimentar Diante Da Vulnerabilidade Socioambiental. Organ. Rurais Agroind. 2021, 23, e1756. [Google Scholar]
  54. Potrich, R.; Grzybovski, D.; Smoktunowicz Toebe, C. Sustentabilidade Nas Pequenas Propriedades Rurais: Um Estudo Exploratório Sobre a Percepção Do Agricultor. Estud. Soc. Agric. 2017, 25, 208–228. [Google Scholar] [CrossRef]
  55. Barros, A.; Morais, E.P. Descaracterização Da Paisagem Rural: Consequências e Desafios Para as Comunidades Rurais. Rev. Tópicos 2024, 2, 1–15. [Google Scholar]
  56. Gonçalves, F.G.; Caldeira, M.V.W.; Silva, G.F.D.; De Souza, G.S. Sistemas Integrados de Produção: Pesquisa e Desenvolvimento de Tecnologias; Editora Científica Digital: Guarujá, Brazil, 2021; ISBN 9786553600195. [Google Scholar]
  57. Frederico, S. Cafeicultura Científica Globalizada e as Montanhas Capixabas: A Produção de Café Arábica Nas Regiões Do Caparaó e Serrana Do Espírito Santo. Soc. Nat. 2013, 25, 7–20. [Google Scholar] [CrossRef]
  58. Dias, E.M.S.; Pessoa, Z.S.; Teixeira, R.L.P.; Silva, L.C.S. Mudanças Climáticas e Agropecuária: Vulnerabilidades Da Região Semiárida Do Rio Grande Do Norte, Brasil. Colóquio-Rev. Desenvolv. Reg. 2021, 18, 20–39. [Google Scholar] [CrossRef]
  59. Szewrański, S.; Świąder, M.; Kazak, J.K.; Tokarczyk-Dorociak, K.; van Hoof, J. Socio-Environmental Vulnerability Mapping for Environmental and Flood Resilience Assessment: The Case of Ageing and Poverty in the City of Wrocław, Poland. Integr. Environ. Assess. Manag. 2018, 14, 592–597. [Google Scholar] [CrossRef] [PubMed]
  60. Mavromatidi, A.; Briche, E.; Claeys, C. Mapping and Analyzing Socio-Environmental Vulnerability to Coastal Hazards Induced by Climate Change: An Application to Coastal Mediterranean Cities in France. Cities 2018, 72, 189–200. [Google Scholar] [CrossRef]
  61. Gupta, A.K.; Negi, M.; Nandy, S.; Kumar, M.; Singh, V.; Valente, D.; Petrosillo, I.; Pandey, R. Mapping Socio-Environmental Vulnerability to Climate Change in Different Altitude Zones in the Indian Himalayas. Ecol. Indic. 2020, 109, 105787. [Google Scholar] [CrossRef]
  62. Marín-Monroy, E.A.; Hernández-Trejo, V.; Ojeda-Ruiz de la Peña, M.A.; Romero-Vadillo, E.; Ivanova-Boncheva, A. Perceptions and Consequences of Socioenvironmental Vulnerability Due to Tropical Cyclones in Los Cabos, Mexico. Sustainability 2021, 13, 6787. [Google Scholar] [CrossRef]
  63. Malta, F.S.; Marques da Costa, E. Socio-Environmental Vulnerability Index: An Application to Rio de Janeiro-Brazil. Int. J. Public Health 2021, 66, 584308. [Google Scholar] [CrossRef]
  64. Mello, B.J.; Souza, C.M.D.M.; Aumond, J.J.; Silva, J.I.A.O.; Langa, E.D.; De Novaes, J.M. A Vulnerabilidade Socioambiental a Desastres: Cenários e Desafios Para o Município de Brusque (SC). Rev. Gestão Ambient. Sustentabilidade 2023, 12, e22638. [Google Scholar] [CrossRef]
  65. Mattedi, M.A.; Mello, B.J.; Souza, C.M.D.M.; Vicentainer, D.A.; Kormann, T.C. Aplicação Do Índice de Vulnerabilidade Socioambiental a Desastres Por Meio de Sistema de Informação Geográfica (SIG): Estudo de Caso Do Município de Blumenau (SC). Rev. Gestão Ambient. Sustentabilidade 2024, 13, e23423. [Google Scholar] [CrossRef]
  66. De Oliveira, F.R.; Cecílio, R.A.; Zanetti, S.S. Metodologia Para Análise de Vulnerabilidade Socioambiental Aplicada a Assentamentos Rurais. Ambient. Soc. 2025, 28. [Google Scholar]
  67. Snowden, D.J.; Boone, M.E. A Leader’s Framework for Decision Making. Harv. Bus. Rev. 2007, 85, 68–76. [Google Scholar]
  68. Alvares, C.A.; Stape, J.L.; Sentelhas, P.C.; Gonçalves, J.L.D.M.; Sparovek, G. Köppen’s Climate Classification Map for Brazil. Meteorol. Zeitschrift 2013, 22, 711–728. [Google Scholar] [CrossRef] [PubMed]
  69. Instituto Brasileiro de Geografia e Estatística Panorama Censo 2022. Available online: https://censo2022.ibge.gov.br/panorama/ (accessed on 31 January 2025).
  70. Saaty, T.L. A Scaling Method for Priorities in Hierarchical Structures. J. Math. Psychol. 1977, 15, 234–281. [Google Scholar] [CrossRef]
  71. Borja Pimenta, L.; Beltrão, N.E.S.; Gemaque, A.M.D.S.; Amador Tavares, P. Processo Analítico Hierárquico (AHP) Em Ambiente SIG: Temáticas e Aplicações Voltadas à Tomada de Decisão Utilizando Critérios Espaciais. Interações 2019, 20, 407–420. [Google Scholar] [CrossRef]
  72. Braga, S.D.S.; Guzzi, A.; Malta, G.A.P. Analysis Of The Tourist Territories Of The Piauí Coast Using The Analytical Hierarchy Process. Mercator 2023, 22, e22007. [Google Scholar] [CrossRef]
  73. Ishizaka, A.; Labib, A. Analytic Hierarchy Process and Expert Choice: Benefits and Limitations. OR Insight 2009, 22, 201–220. [Google Scholar] [CrossRef]
  74. Goepel, K.D. Implementation of an Online Software Tool for the Analytic Hierarchy Process (AHP-OS). Int. J. Anal. Hierarchy Process 2018, 10, 469–487. [Google Scholar] [CrossRef]
  75. Moreira, M.C.; Silva, D.D.; Pruski, F.F.; Lara, M.D.S. Índices Para Identificação de Conflitos Pelo Uso Da Água: Proposição Metodológica e Estudo de Caso. Rev. Bras. Recur. Hídricos 2012, 17, 7–15. [Google Scholar] [CrossRef]
  76. Brown, R.M.; McClelland, N.I.; Deininger, R.A.; Tozer, R.G. A Water Quality Index: Do We Dare? Water Sew. Work. 1970, 117, 339–343. [Google Scholar]
  77. Castro Junior, R.M.D.; Sobreira, F.G.; Bortoloti, F.D. Modelagem Geoestatística a Partir de Parâmetros de Qualidade Da Água (IQA-NSF) Para a Sub-Bacia Hidrográfica Do Rio Castelo (ES) Usando Sistema de Informações Geográficas. Rev. Bras. Cartogr. 2007, 59, 241–253. [Google Scholar]
  78. Lopes, J.E.G.; Santos, R.C.P. Capacidade de Reservatórios; Escola Politécnica da Universidade de São Paulo: São Paulo, Brazil, 2002. [Google Scholar]
  79. Thornthwaite, C.W.; Mather, J.R. The Water Balance. Publ. Climatol. 1955, 8, 104. [Google Scholar]
  80. Xavier, A.C.; Scanlon, B.R.; King, C.W.; Alves, A.I. New Improved Brazilian Daily Weather Gridded Data (1961–2020). Int. J. Climatol. 2022, 42, 8390–8404. [Google Scholar] [CrossRef]
  81. McKee, T.B.; Doesken, N.J.; Kleist, J. The Relationship of Drought Frequency and Duration to Time Scales. In Proceedings of the 8th Conference on Applied Climatology, Anaheim, CA, USA, 17–22 January 1993; pp. 179–184. [Google Scholar]
  82. Rodrigues, E.L.; de Farias, N.T.; Lopes, R.F.C.; de Sousa, F.D.A.S. Análise Da Precipitação Pluviométrica Mensal e Anual e Dos Períodos de Seca No Município de Guarabira-PB. Rev. Bras. Geogr. Física 2023, 16, 134–144. [Google Scholar] [CrossRef]
  83. Tsakiris, G.; Vangelis, H. Towards a Drought Watch System Based on Spatial SPI. Water Resour. Manag. 2004, 18, 1–12. [Google Scholar] [CrossRef]
  84. Kageyama, A.; Hoffmann, R. Pobreza No Brasil: Uma Perspectiva Multidimensional. Econ. Soc. 2016, 15, 79–112. [Google Scholar]
  85. Costa, M.A.; Marguti, B.O. Atlas Da Vulnerabilidade Social Nos Municípios Brasileiros; Instituto de Pesquisa Econômica Aplicada: Brasília, Brazil, 2015. [Google Scholar]
  86. Agência Nacional de Águas e Saneamento Básico. Plano Nacional de Segurança Hídrica; ANA: Brasília, Brazil, 2019. [Google Scholar]
  87. Instituto Brasileiro de Geografia e Estatística Censo Demográfico 2010. Available online: http://www.ibge.gov.br/home/estatistica/populacao/censo2010/default.shtm (accessed on 1 January 2024).
  88. Maior, M.M.S.; Cândido, G.A. Avaliação Das Metodologias Brasileiras de Vulnerabilidade Socioambiental Como Decorrência Da Problemática Urbana No Brasil. Cad. Metrópole 2014, 16, 241–264. [Google Scholar] [CrossRef]
  89. D’Ercole, R.; Thouret, J.-C.; Dollfus, O.; Asté, J.-P. Les Vulnérabilités Des Sociétés et Des Espaces Urbanisés: Concepts, Typologie, Modes d’analyse. Rev. Géographie Alp. 1994, 82, 87–96. [Google Scholar] [CrossRef]
  90. Macedo, Y.M.; de Almeida, L.Q.; Troleis, A.L.; Maciel, A.B.C. Vulnerabilidade Socioambiental Em Escala de Detalhe: O Caso de Mãe Luiza, Natal, RN, Brasil. Geosaberes 2015, 6, 145–157. [Google Scholar]
  91. Ananias, F.A.; Guedes, J.D.A. Percepção Ambiental de Comunidades Rurais Do Semiárido Do Nordeste: O Caso Dascomunidades Do Entorno Do Reservatório de Pilões/RN. Interes. Rev. Geogr. Interdiscip. 2017, 3, 158–174. [Google Scholar] [CrossRef]
  92. Brito, H.C.; de Brito, Y.M.A.; Rufino, I.A.A. O Índice de Segurança Hídrica Do Brasil e o Semiárido Brasileiro: Desafios e Riscos Futuros. Rev. Bras. Cartogr. 2022, 74, 1–15. [Google Scholar] [CrossRef]
  93. de Melo, M.C.; Formiga-Johnsson, R.M.; de Azevedo, J.P.S.; Nascimento, N.d.O.; Machado, F.L.V.; Pacheco, F.A.L.; Fernandes, L.F.S. A Raw Water Security Risk Model for Urban Supply Based on Failure Mode Analysis. J. Hydrol. 2021, 593, 125843. [Google Scholar] [CrossRef]
  94. Mendes, J.P.; Ferreira, D.H.L.; Sugahara, C.R. Bacias Hidrográficas PCJ: Impactos Da Segurança Hídrica No Assentamento Milton Santos, Americana/SP. Rev. Nac. Gerenciamento Cid. 2020, 8, 65. [Google Scholar] [CrossRef]
  95. Silva, M.D.S.; Bueno, I.T.; Acerbi Júnior, F.W.; Borges, L.A.C.; Calegario, N. Avaliação Da Cobertura Do Solo Como Indicador de Gestão de Recursos Hídricos: Um Caso de Estudo Na Sub-Bacia Do Córrego Dos Bois, Minas Gerais. Eng. Sanit. Ambient. 2017, 22, 445–452. [Google Scholar] [CrossRef]
  96. dos Santos, R.B.; Menezes, J.A.; Confalonieri, U.; Madureira, A.P.; Duval, I.D.B.; Garcia, P.P.; Margonari, C. Construção e Aplicação de Um Índice de Vulnerabilidade Humana à Mudança Do Clima Para o Contexto Brasileiro: A Experiência Do Estado Do Espírito Santo1. Saúde Soc. 2019, 28, 299–321. [Google Scholar] [CrossRef]
  97. Pinho, L.G.D.R.; Bitencout, L.L.; de Souza, G.S.; Leal, É.D.A.S.; Lino, L.D.S.; Alves, A.G.; de Souza, W.L.; Martins, R.L.; Elias, J. Mudanças Climáticas e a Produção de Café Conilon Na Microrregião Centro-Oeste Do Estado Do Espírito Santo. Rev. Ifes Ciência 2021, 7, 1–14. [Google Scholar] [CrossRef]
  98. Mota, Z.M.; Silva, A.R. Da Segurança Hídrica Na Agricultura Familiar. In Proceedings of the Anais do II Congresso On-line Internacional de Sustentabilidade, Revista Multidisciplinar de Educação e Meio Ambiente, Fortaleza, Brazil, 24–27 November 2021. [Google Scholar]
  99. Zimmermann, S.A.; Grisa, C.; Tecchio, A.; Leite, S.P.; Bonnal, P.; Cazella, A.A.; Delgado, N.G.; Maluf, R.J.; Mattei, L. Desenvolvimento Territorial e Políticas de Enfrentamento Da Pobreza Rural No Brasil. Rev. Campo-Território 2014, 9, 540–573. [Google Scholar] [CrossRef]
  100. Rodriguez, C.J.S.; Conterato, M.A. A Pobreza Rural No Estado Do Espírito Santo: Invisibilidade e Ações de Enfrentamento a Partir Da Implementação Do Programa Incluir No Campo. DRd-Desenvolv. Reg. Debate 2017, 7, 75–94. [Google Scholar] [CrossRef]
  101. Germiniani Resende, R.; Ferreira, S.; Reis Fernandes, L.F. O Saneamento Rural no Contexto Brasileiro. Available online: https://agrogeoambiental.ifsuldeminas.edu.br/index.php/Agrogeoambiental/article/view/1027 (accessed on 13 February 2025).
  102. Damázio, S.M.; Soares, A.R.; Souza, M.A.A. de Perfil Parasitológico de Escolares Da Localidade de Santa Maria, Zona Rural Do Município de São Mateus/ES, Brasil. Rev. APS 2016, 19, 261–267. [Google Scholar]
  103. Camara, L.R.A.; Silva, D.D.S.D.; Sales, L.L.N.; Silva, D.W.S.; Pinheiro, E.M. Qualidade de Vida e Percepção Ambiental Dos Moradores de Comunidades Rurais Em São Luís (MA). Rev. Bras. Educ. Ambient. 2019, 14, 263–274. [Google Scholar] [CrossRef]
  104. BRASIL Lei 11.445, 5 Jan. 2007. Estabelece Diretrizes Nacionais Para o Saneamento Básico 2007. Available online: https://www.planalto.gov.br/ccivil_03/_ato2007-2010/2007/lei/l11445.htm (accessed on 13 February 2025).
  105. Mota, J.J.P.; Sousa, C.D.S.S.; Da Silva, A.C. Saneamento Básico e Seu Reflexo Nas Condições Socioambientais Da Zona Rural Do Baixo Munim (Maranhão). Rev. Caminhos Geogr. 2015, 16, 140–160. [Google Scholar] [CrossRef]
  106. Amaral, L.A.D.; Filho, A.N.; Junior, O.D.R.; Ferreira, F.L.A.; Barros, L.S.S. Água de Consumo Humano Como Fator de Risco à Saúde Em Propriedades Rurais. Rev. Saude Publica 2003, 37, 510–514. [Google Scholar] [CrossRef]
  107. Lamounier Júnior, A. Agricultura Familiar e Saúde Em Zona Rural: Um Estudo de Caso Sobre Vulnerabilidade Socioambiental No Município de Frei Inocêncio, Médio Rio Doce, Minas Gerais. Ph.D. Thesis, Escola Nacional de Saúde Pública Sergio Arouca, Rio de Janeiro, Brasil, 2012. [Google Scholar]
  108. De Assis, E.M.; Santos, E.M.; Faria, M.C.D.S.; Rodrigues, J.L.; Garcez, A.; Bomfeti, C.A.; Barcellos, N.T. A Vulnerabilidade de Populações Indígenas: Qualidade Da Água Consumida Pela Comunidade Maxakali, Minas Gerais, Brasil. Soc. Nat. 2020, 32, 279–290. [Google Scholar] [CrossRef]
  109. Drachler, M.D.L.; Lobato, M.A.D.O.; Lermen, J.I.; Fagundes, S.; Ferla, A.A.; Drachler, C.W.; Teixeira, L.B.; Leite, J.C.D.C. Desenvolvimento e Validação de Um Índice de Vulnerabilidade Social Aplicado a Políticas Públicas Do SUS. Cien. Saude Colet. 2014, 19, 3849–3858. [Google Scholar] [CrossRef]
  110. Paiva, A.M.; Lima, E.C. Índice de Vulnerabilidade Socioambiental no Médio Curso do Rio Batoque Setor Urbano de Hidrolândia/CE. Rev. Geociências Nordeste 2019, 5, 73–85. [Google Scholar] [CrossRef]
  111. JATOBÁ, S.U.S. Gestão do Territorio e a Produção da Socionatureza nas Ilhas do Lago de Tucuruí na Amazônia Brasileira. Ph.D. Thesis, Universidade de Brasília, Brasília, Brazil, 2006. [Google Scholar]
  112. Pereira, J.S.; Neto, J.M.D.M.; Silva, V.F.; de Brito, K.S.A.; Martins, W.A. Classes de Cobertura Vegetal No Município de Taperoá, Paraíba. Rev. Ibero-Am. Ciências Ambient. 2021, 12, 2. [Google Scholar] [CrossRef]
  113. Borges, L.A.C.; de Rezende, J.L.P.; Pereira, J.A.A.; Júnior, L.M.C.; de Barros, D.A. Áreas de Preservação Permanente Na Legislação Ambiental Brasileira. Ciência Rural 2011, 41, 1202–1210. [Google Scholar] [CrossRef]
  114. Stevaux, J.C.; Latrubesse, E.M. Geomorfologia Fluvial; Oficina de textos: São Paulo, Brazil, 2017. [Google Scholar]
  115. Vieira, R.M.D.S.P.; Tomasella, J.; Cunha, A.P.M.D.A.; Barbosa, A.A.; Pompeu, J.; Ferreira, Y.; Santos, F.C.; Alves, L.M.; Ometto, J. Socio-Environmental Vulnerability to Drought Conditions and Land Degradation: An Assessment in Two Northeastern Brazilian River Basins. Sustainability 2023, 15, 8029. [Google Scholar] [CrossRef]
  116. De Freitas, M.I.C.; Rossetti, L.A.F.G.; De Oliveira, R.B.N. Risk Mapping in Urban Areas: Methodological Essay for Sample Area of Santos, São Paulo–Brazil. Rev. Bras. Cartogr. 2015, 67, 5. [Google Scholar] [CrossRef]
  117. Zhao, J.; Ji, G.; Tian, Y.; Chen, Y.; Wang, Z. Environmental Vulnerability Assessment for Mainland China Based on Entropy Method. Ecol. Indic. 2018, 91, 410–422. [Google Scholar] [CrossRef]
  118. Barreto-Neto, A.A.; Marchesi, A.F. Avaliação Da Vulnerabilidade Socioambiental À Desertificação No Estado Do Espírito Santo, Brasil. Rev. Bras. Ciências Ambient. 2019, 51, 28–40. [Google Scholar] [CrossRef]
  119. Campos, J.A.; da Silva, D.D.; Fernandes Filho, E.I.; Pires, G.F.; Amorim, R.S.S.; de Menezes Filho, F.C.M.; de Melo Ribeiro, C.B.; Uliana, E.M.; Aires, U.R.V. Environmental Vulnerability Assessment of the Doce River Basin, Southeastern Brazil. Environ. Monit. Assess. 2023, 195, 1119. [Google Scholar] [CrossRef]
  120. Kim, J.-S.; Jain, S.; Lee, J.-H.; Chen, H.; Park, S.-Y. Quantitative Vulnerability Assessment of Water Quality to Extreme Drought in a Changing Climate. Ecol. Indic. 2019, 103, 688–697. [Google Scholar] [CrossRef]
  121. da Silva, C.C.J. Vulnerabilidade Socioambiental e Suscetibilidade a Seca e a Estiagem no Estado do Ceará. Master’s Thesis, Universidade Federal da Paraíba, João Pessoa, Brazil, 2023. [Google Scholar]
  122. Olímpio, J.L.S.; Zanella, M.E. Riscos Naturais: Conceitos, Componentes e Relações Entre Natureza e Sociedade. Raega-O Espaço Geográfico Análise 2017, 40, 94. [Google Scholar] [CrossRef]
  123. Buriti, C.D.O.; Barbosa, H.A.; Paredes-Trejo, F.J.; Kumar, T.V.L.; Thakur, M.K.; Rao, K.K. Un Siglo de Sequías: Por Qué Las Políticas de Agua No Desarrollaron La Región Semiárida Brasileña? Rev. Bras. Meteorol. 2020, 35, 683–688. [Google Scholar] [CrossRef]
  124. De Andrade, M.R.; Ávila, F.G.; Junior, R.H.J.H.; Santos, M.R. dos Socio-Environmental Analysis of the Rural Zone of Espírito Santo Do Dourado/MG: A Perspective for Future Integration Policies. Rev. Agrogeoambiental 2021, 13, 260–271. [Google Scholar] [CrossRef]
Figure 1. Variables of the adapted Socioenvironmental Vulnerability Index. Source: the authors.
Sustainability 17 04054 g001
Figure 2. Location of rural communities where the proposed SEVI was applied.
Sustainability 17 04054 g002
Figure 3. Scale values to pairwise comparison. Source: [72].
Sustainability 17 04054 g003
Figure 4. Results of SVI, EnVuIn and SEVI in communities.
Sustainability 17 04054 g004
Table 1. Absolute scale, definition and justification for the decision-making process with the AHP.
Intensity of ImportanceVerbal DefinitionExplanation
1Equal importanceBoth elements contribute equally to the goal.
3Moderate importance of one factor over the otherExperience or judgment slightly favors one element over the other.
5Strong importanceOne element is strongly more important than the other.
7Very strong importanceOne element is very strongly more important; its dominance is demonstrated in practice.
9Absolute importanceOne element is extremely more important than the other; maximum favorable evidence.
2, 4, 6, 8Intermediate valuesUsed for trade-offs between the previous intensities.
Source: adapted from [70].
Table 2. SEVI classes.
IndexSocial Vulnerability Level
0.00–0.200Very low
0.201–0.300Low
0.301–0.400Moderate
0.401–0.500High
0.501–1.00Very high
Source: [85].
Table 3. Summary of indicators and SEVI calculation.
EnVuIn
IndicatorData SourceCalculation MethodObjective in the EnVuIn
SPI—Standardized Precipitation IndexAvailable at (https://utexas.app.box.com/v/Xavier-etal-IJOC-DATA, accessed on 1 January 2024) [80]Adjustment of historical precipitation series to Gamma distribution//MDM softwareIdentify drought periods and assess the impact of climate variability
HI—Humidity IndexAvailable at (https://utexas.app.box.com/v/Xavier-etal-IJOC-DATA, accessed on 1 January 2024) [79,80]Calculation based on annual climatological water balanceDetermine climate humidity and regional variations
WSI—Water Security IndexNational Water and Sanitation Agency [86]Value obtained from national database, with classification from 1 to 5Represent water security in multiple dimensions (human, economic, ecological and resilience)
WCPI—Water Use Conflict in Water Resource Planning IndexState Water Resources Agency—AGERH (grant and flow data)Ratio between Qout and QmldEvaluate conflicts over water use in basin planning
WCMI—Water Use Conflict in Water Resource Management IndexState Water Resources Agency—AGERHMethodology: [75]Check excess concessions and risk of water unavailability
WQI—Water Quality IndexState Water Resources Agency—AGERH (monitoring)Ratio between Qout and 50% of Q90; methodology: [75]Evaluate the quality of water available for human and productive use
Reservoirs (presence/absence)State Water Resources Agency—AGERH (Dam Registry)Weighted average of nine physical-chemical and biological parametersRepresent infrastructure supporting water security
Conflicting PPAs (%)GEOBASES (2012–2015), based on Law 12.651/2012Binary: 1 (exists); 0 (does not exist)Identify anthropogenic pressure and environmental degradation in sensitive areas
Normalization of indicators to the range from 0 to 1; Positive: X i , j = X i , m a x X i , j X i , m a x X i , m i n ; Negative: X i , j = X i , j X i , m i n X i , m a x X i , m i n
Weighting of the indicators with the AHP method
E n V u I n = i = 1 n I N D i × P i i = 1 n P i
SVI
Social indicators[87]Weighting of 4 indicators: sanitation, HDI, poverty incidence and GINIAssess the socioeconomic condition of the exposed population
Normalization of indicators to the range from 0 to 1; Positive: X i , j = X i , m a x X i , j X i , m a x X i , m i n ; Negative: X i , j = X i , j X i , m i n X i , m a x X i , m i n
Weighting of the indicators with the AHP method
S V I = i = 1 n I N D i × P i i = 1 n P i
S E V I = S V I ) + ( E n V u I n 2
Table 4. Comparison matrix.
SPIWCMIWCIPWSIHIWQIReservPPA
1330.3333335843
0.33333310.3333330.333333330.21
0.333333310.333333330.21
33315944
0.20.3333330.3333330.2120.3333331
0.1250.3333330.3333330.1111110.510.20.333333
0.25550.253514
0.333333110.25130.251
0.2329550.064130.0850330.319080.0414910.0241560.1740210.059135
Number of comparisons = 28Consistency ratio (CR) = 8.6%
Weights
P_SPIP_WCMIP_WCPIP_WSIP_HIP_WQIP_ResevP_PPA
0.2329550.064130.0850330.319080.0414910.0241560.1740210.059135
Table 5. Environmental indicators for the study areas.
SPIWCMIWCPIWSIIuWQIReserPPAs
Boa Esperança0.00050.500.050.360.35*10.857
Novo Sonho0.00050.390.040.300.330.2910.438
Florestan Fernandes0.00050.000.000.120.450.410.655
Ita0.00070.000.000.390.33*10.438
Sezinio0.00020.180.020.360.310.3200.494
Monte Alegre0.00880.000.000.300.45*10.503
Jose Marcos0.00000.000.000.190.33*00.854
Georgina−0.00070.920.110.320.290.3100.189
Santa Clara−0.00020.000.000.390.420.3210.669
* Unmonitored point.
Table 6. Normalized environmental indicators and EnVuIn results for the study areas.
SPI_nWCMI_nWCPI_nWSI_nHI_nWQI_nReser_nPPAs_nEnVuIn
Boa Esperança0.500.500.050.360.35*10.8570.52
Novo Sonho0.500.390.040.300.330.2910.4380.46
Florestan Fernandes0.500.000.000.120.450.410.6550.40
Ita0.500.000.000.390.33*10.4380.47
Sezinio0.500.180.020.360.310.3200.4940.29
Monte Alegre0.500.000.000.300.45*10.5030.44
Jose Marcos0.500.000.000.190.33*00.8540.25
Georgina0.500.920.110.320.290.3100.1890.32
Santa Clara0.500.000.000.390.420.3210.6690.48
* Unmonitored point.
Table 7. Social indicators for the study areas.
Sanitation%MHDIPoverty Incidence% GINI Index
Boa Esperança00.66442.390.41
Novo Sonho1.90.66252.280.48
Florestan Fernandes0.00.70338.560.45
Ita1.00.70222.820.45
Sezinio3.00.72437.120.48
Monte Alegre1.10.69426.850.44
Jose Marcos4.50.65742.240.47
Georgina0.70.73536.130.46
Santa Clara4.40.68632.510.39
Table 8. Social indicators and SVI results for the study areas.
Sanitation%_nMHDI_nPoverty Incidence%_nGINI Index_nSVI
Boa Esperança10.3360.420.470.57
Novo Sonho0.980.3380.520.500.62
Florestan Fernandes10.2970.390.480.54
Ita0.990.2980.230.570.47
Sezinio0.970.2760.370.550.52
Monte Alegre0.990.3060.270.480.48
Jose Marcos0.950.3430.420.500.56
Georgina0.990.2650.360.420.52
Santa Clara0.960.3140.330.550.51
WeightsSanitation%MHDI%P_Incidence%GINI%
0.2653510.151170.5082870.075195
Disclaimer/Publisher’s Note: The statements, opinions and data contained in all publications are solely those of the individual author(s) and contributor(s) and not of MDPI and/or the editor(s). MDPI and/or the editor(s) disclaim responsibility for any injury to people or property resulting from any ideas, methods, instructions or products referred to in the content.

