Article

Analysis of Sustainable Development Strategy of Heavily Polluting Enterprises—Based on the Tripartite Game Model

School of Economics and Management, North China University of Science and Technology, Tangshan 063000, China
*
Author to whom correspondence should be addressed.
Sustainability 2025, 17(9), 4053; https://doi.org/10.3390/su17094053
Submission received: 27 February 2025 / Revised: 25 April 2025 / Accepted: 28 April 2025 / Published: 30 April 2025

Abstract

We constructed a three-tier tripartite evolutionary game model to analyze the interactive relationships among the government, clusters of heavily polluting enterprises, and the public regarding carbon emission reduction. The findings revealed that enhanced supervision efforts by both the government and the public significantly accelerated the evolutionary speed of green transition within heavily polluting enterprise clusters. Under current policy frameworks, the government effectively guided heavily polluting enterprises toward green and sustainable development pathways by implementing green subsidies and stringent environmental regulation policies. Pioneering enterprises in heavily polluting industries adopting green technology innovation expedited the green transformation of the entire sector substantially. Numerical simulations were conducted to validate these conclusions, and corresponding countermeasures and suggestions were proposed to facilitate the green transition of heavily polluting enterprises.

1. Introduction

Global climate change poses a significant threat to human society, and an increasing number of countries have elevated achieving “carbon neutrality” to a national strategy [1,2,3]. As key targets for emission reductions, how to effectively reduce carbon emissions and promote the development of green technologies in polluting enterprises has attracted the attention of governments, managers, and scholars globally [4,5].
Current research on the green transformation of heavily polluting enterprises mostly focuses on environmental regulations [6,7], green credit [8,9], and green financial policies [10,11]. Zhao, Y. et al. (2023) found that government environmental regulations drive green technological innovation in heavily polluting enterprises through the mediating effect of corporate social responsibility [12]; Cai et al. (2020) conducted an empirical analysis using a panel Poisson fixed-effects model and found that direct environmental regulations have a strong and significant incentive effect on green technological innovation in heavily polluting industries [13]. Lin, B. et al. (2024) determined that green credit policies drive the transformation of heavily polluting enterprises through a dual-track mechanism of “positive incentives” and “reverse constraints” [14]; Li, R. et al. (2022) found that the green credit implemented in China in 2012 significantly promoted the strategic business diversification of heavily polluting enterprises into non-polluting industries, and this effect was particularly prominent in large-scale, poorly governed, and highly marketized enterprises, confirming that the policy effectively promoted industrial transformation and upgrading [15]. Huang, Y. et al. (2023) used a continuous difference-in-differences model and found that China’s green financial policies inhibited the digital transformation of heavily polluting enterprises by increasing financing costs and financing constraints; however, this hindering effect was weakened in regions with reform and innovation and enterprises with highly educated executive teams [16]. Some studies have also explored the application of industrial intelligent technologies to drive the green innovation of production processes [17,18,19]. Xu et al. (2023) argued that industrial intelligent technologies significantly drive the green transformation of heavily polluting enterprises through technology spillovers and resource optimization [20]. Based on panel data from 30 provinces in China from 2006 to 2020, Shen, Y. et al. (2023) used a two-way fixed-effects model and instrumental variable method and empirically determined that the application of industrial robots generates significant pollution reduction and carbon reduction synergy effects by driving green technological innovation and improving energy efficiency [21]. Fatima, T. (2023) revealed that industrial intelligence drives the development of green industries through a market-oriented environmental regulation and carbon intensity mediation path [22]. Li, Z. et al. (2024) constructed an industrial intelligence index system and found that the development of industrial intelligence significantly reduced the emission intensity of polluting enterprises in China [23]. In summary, existing research has focused on the impact of factors such as environmental regulations and green credit on the transformation of heavily polluting enterprises; however, most studies have been limited to separately exploring technological emission reduction paths or the effects of single policies, without integrating the interactive effects of multiple stakeholders on the transformation process of enterprises. Therefore, this study deeply explored the issues of pollution reduction, carbon reduction, and green transformation of a cohort of heavily polluting enterprises from the perspectives of external driving factors and internal driving forces.
In addition, some scholars have studied issues related to the green transformation of enterprises through evolutionary game models. Wu, Y et al. (2024) constructed a three-party evolutionary game model involving industrial enterprises, local governments, and the central government and found that increasing environmental taxes, central government financial incentives, and the synergy of local supervision can effectively promote the green transformation of enterprises [24]. Xu, R et al. (2019) used a three-party evolutionary game model comprising the government, environmental service companies, and polluting enterprises and revealed that the “public-private partnership” model is key to environmental governance [25]. Cao, W et al. (2024) implemented a three-party evolutionary game model involving environmental protection enterprises, polluting enterprises, and the government [26]. They found that enhancing environmental governance efforts, government innovation subsidies, and the compensation degree of polluting enterprises to environmental protection enterprises promote green innovation [26]. In summary, although the existing evolutionary game models all adopt a three-party structure [27,28,29], their game subjects are limited to the relationship between enterprises and the government, with public participation only considered as an exogenous parameter or passive recipient, failing to form a closed-loop feedback of ‘government regulation—enterprise strategy—public supervision’.
Therefore, this study constructed a three-layer, three-party game model involving the government, the public, and a cohort of heavily polluting enterprises, taking carbon reduction policies as the trigger, to analyze the dynamic interaction mechanism in carbon and emission reductions. The research framework is shown in Figure 1. The research framework considered “the necessity of green transformation” and “the necessity of green innovation” as the core themes. It elucidates the associative mechanisms of environmental governance through a multi-party game logic of the government, heavily polluting enterprises, and the public. The first-level game focused on the government’s strategic path in responding to climate change, taking the supervision of carbon reduction by heavily polluting enterprises as the entry point. A three-party game model involving the government, enterprise group, and the public was constructed to analyze the dynamic impact of interactions among the subjects on the implementation of environmental policies. The second-level game was based on the strategic positioning of enterprises in responding to climate change. A game framework comprising the enterprise group, policy pressure, market response, and social responsibility was constructed to explore their strategic choices in balancing survival needs and long-term development under environmental constraints, revealing the impact of green transformation on sustainability. The third-level game was based on the consensus between the government and enterprises on green transformation, focusing on the collaborative game between leading enterprises and small and medium-sized enterprises (SMEs). Furthermore, the hindrance of free-riding effects on the transformation process was analyzed, and feasible paths for driving cross-scale enterprise technology collaboration through incentive mechanisms to break the implementation bottleneck of the overall green transformation of the industry were explored. The research results revealed that (1) the strengthening of government and public supervision had a significant positive effect on accelerating the green transformation of the heavily polluting enterprises group; (2) the enhancement of public supervision confidence and the increase in participation formed a positive feedback mechanism, promoting social transformation towards sustainable development; (3) the government effectively encouraged enterprises to transform towards green and sustainable development through the implementation of green subsidy policies and the formulation of strict environmental regulations; (4) the green technological innovation behavior of leading enterprises in the industry had a significant leading role in promoting the green transformation of the entire industry. In addition, the conclusions of this model were verified through numerical simulation, and consistent results were obtained.
The possible marginal contributions of this paper were: first, applying a three-layer evolutionary game to explain the mechanism promoting green technological innovation in a group of heavily polluting enterprises. In this game, each level’s actors adjusted their strategies based on their own interests and information and through continuous interaction and feedback, drove the entire system towards green technological innovation. Second, from the perspective of evolutionary game theory, by incorporating the government, heavily polluting enterprises, and the public into the same game framework, the interaction among the three actors and the resulting impact on environmental policies were innovatively explored, providing a new perspective for understanding the complex effects of government supervision on the carbon reduction strategies of heavily polluting enterprises. The results revealed that strengthening government and public supervision, implementing green subsidies and environmental regulation policies, and encouraging leading enterprises to engage in green technological innovation can effectively promote the green transformation of heavily polluting enterprises and achieve sustainable development.

2. Model Setting

Before constructing the three-tier tripartite game model, we made the following assumptions and described the variables involved in the model in detail (Table 1).
Assumption 1.
In each game, the three players involved are rationally bound.
Assumption 2.
Layer one: The strategy of the government game was to strictly supervise or not supervise the carbon emissions of heavily polluting enterprises, with a supervised probability of  x 1   ( 0 x 1 1 )  and unsupervised probability of ( 1 x 1 ). The selection strategy for heavily polluting enterprises was emission reduction or no emission reduction, with an emission reduction probability of  y 1   ( 0 y 1 1 )  and no emission reduction probability of  ( 1 y 1 ) . The public’s strategy involves choosing between supervising or not supervising the enterprise’s behavior, with a supervision probability of  z 1 ( 0 z 1 1 )  and non-supervision probability of  ( 1 z 1 ) .
Layer two: The government game strategy involves a strict (probability of x 2   ( 0 x 2 1 ) ) or not strict (probability of ( 1 x 2 ) ( 0 x 2 1 ) ) implementation of environmental regulations. The strategy for heavily polluting enterprise groups involves a preference for environmental performance (probability of y 2   ( 0 y 2 1 ) ) or for financial performance (probability of ( 1 y 2 ) ). The public’s strategy involves deciding whether to participate (probability of z 2 ( 0 z 2 1 ) ) or not participate (probability of ( 1 z 2 ) ) in environmental supervision.
Layer three: The third layer: Under continuous government supervision, the public’s strategic space for gaming is (strictly supervising whether heavily polluting enterprises engage in green technological innovation or not supervising such innovation), with a probability of x 3   ( 0 x 3 1 ) to choose supervision and ( 1 x 3 ) to choose non-supervision. The strategic space for leading heavily polluting enterprises is (innovate, do not innovate), with a probability of y 3 (0 ≤ y 3 ≤ 1) to choose innovation and ( 1 y 3 ) to choose non-innovation. The strategic decision for heavily polluting small and medium-sized enterprises is (to innovate, do not innovate), with a probability of z 3 (0 ≤ z 3 ≤ 1) to choose innovation and ( 1 z 3 ) to choose non-innovation.

3. Dynamic Game Analysis

3.1. First Evolutionary Game Analysis

In the first game layer, the income matrix combining the government, heavily polluting enterprise groups, and the public was constructed (Table 2).

3.1.1. Game Model Analysis of the Participant

  • Analysis of the government’s evolutionary stability strategy
Based on the income matrix in Table 2, the expected income from strict government supervision was U 11 , as shown in Equation (1).
U 11 = y 1 z 1 ( R 11 c 11 ) + y 1 ( 1 z 1 ) ( R 11 c 11 ) + ( 1 y 1 ) z 1 ( R 11 c 11 + p 1 ) + ( 1 z 1 ) ( 1 y 1 ) ( R 11 c 11 + p 1 )
The expected benefit that the government chooses not to supervise strictly was U 12 , as shown in Equation (2).
U 12 = y 1 z 1 ( R 12 c 12 ) + y 1 ( 1 z 1 ) ( R 12 c 12 ) + ( 1 y 1 ) z 1 ( R 12 c 12 ) + ( 1 z 1 ) ( 1 y 1 ) ( R 12 c 12 )
The government’s average expected return was U 1 , as expressed in Equation (3).
U 1 = x 1 U 11 + ( 1 x 1 ) U 12
The government’s replication dynamic equation (a dynamic differential equation that describes the frequency or frequency with which a particular strategy is adopted by species in a population) [30,31] was F 111 ( x 1 ) , as shown in Equation (4).
F 111 ( x 1 ) = d x 1 d t = ( U 11 U 1 ) x 1 = x 1 ( 1 x 1 ) ( R 11 c 11 R 12 + c 12 ) + ( 1 y 1 ) × p 1
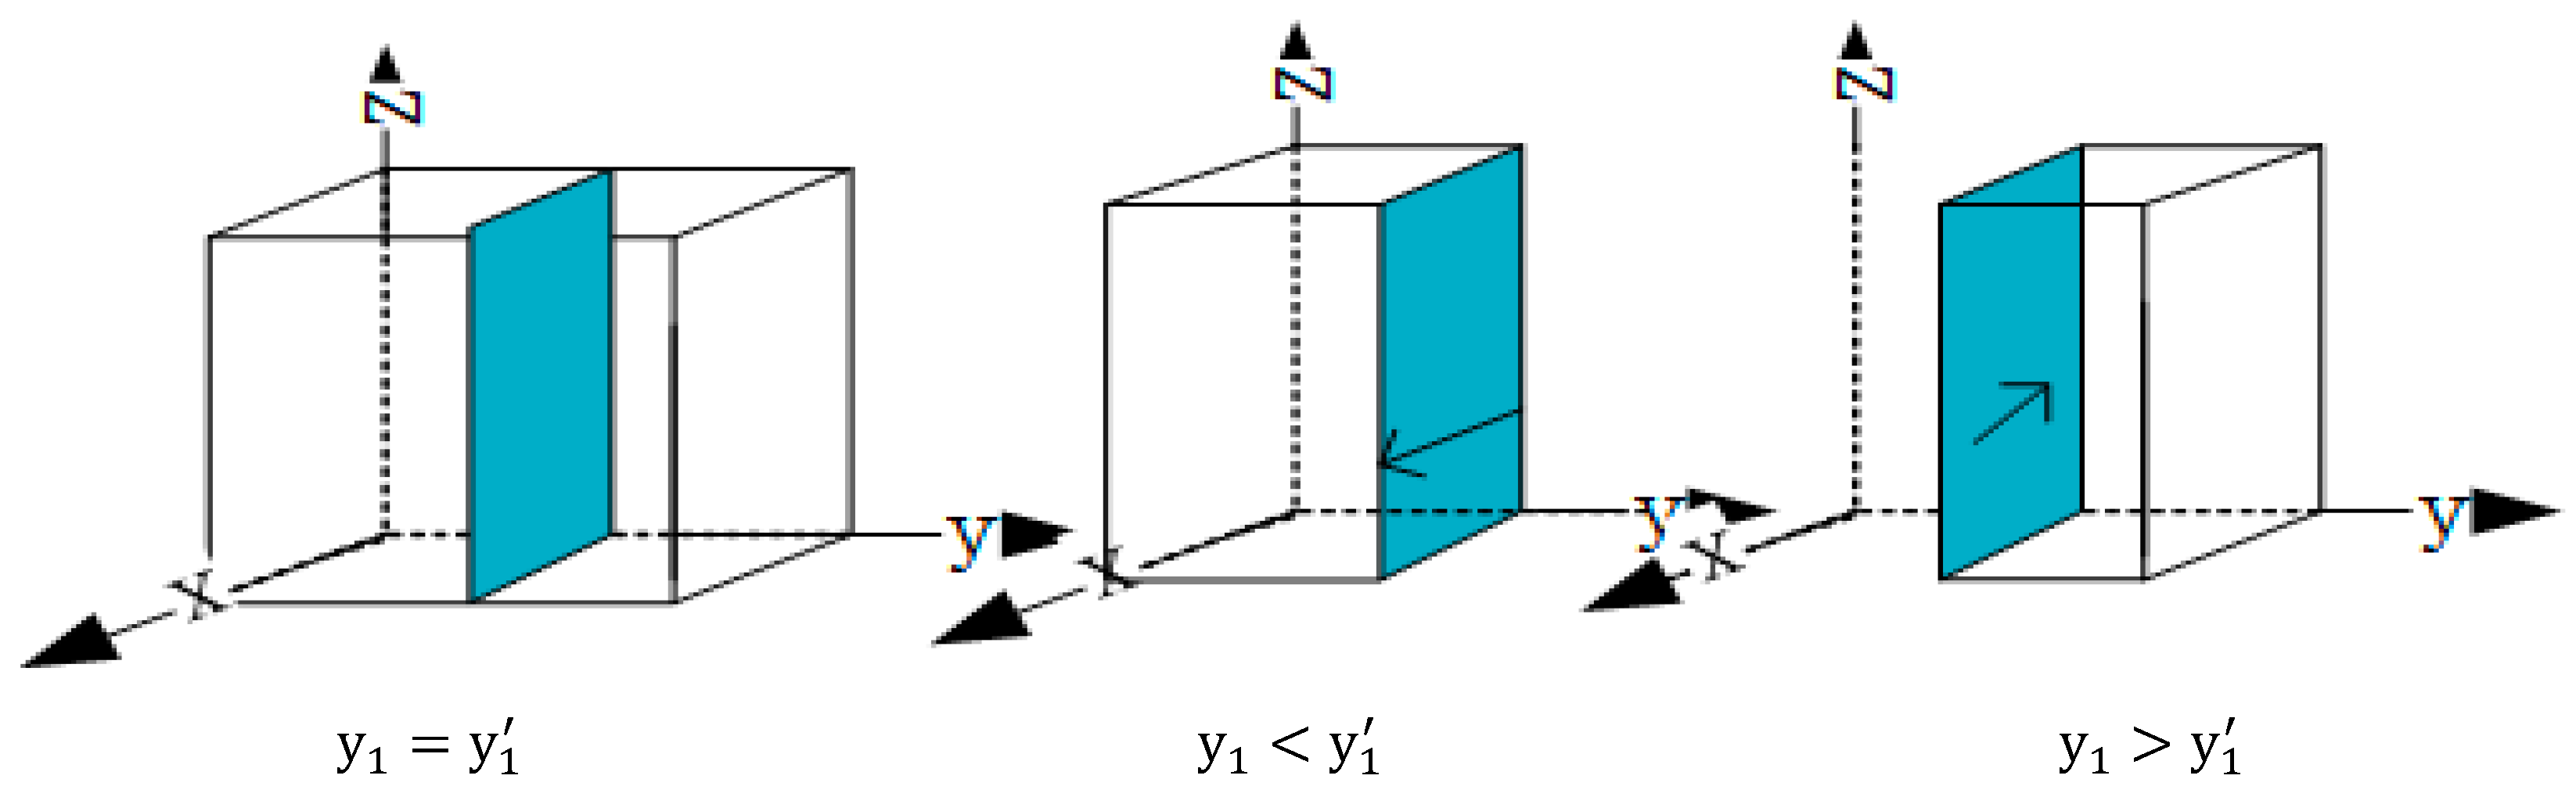
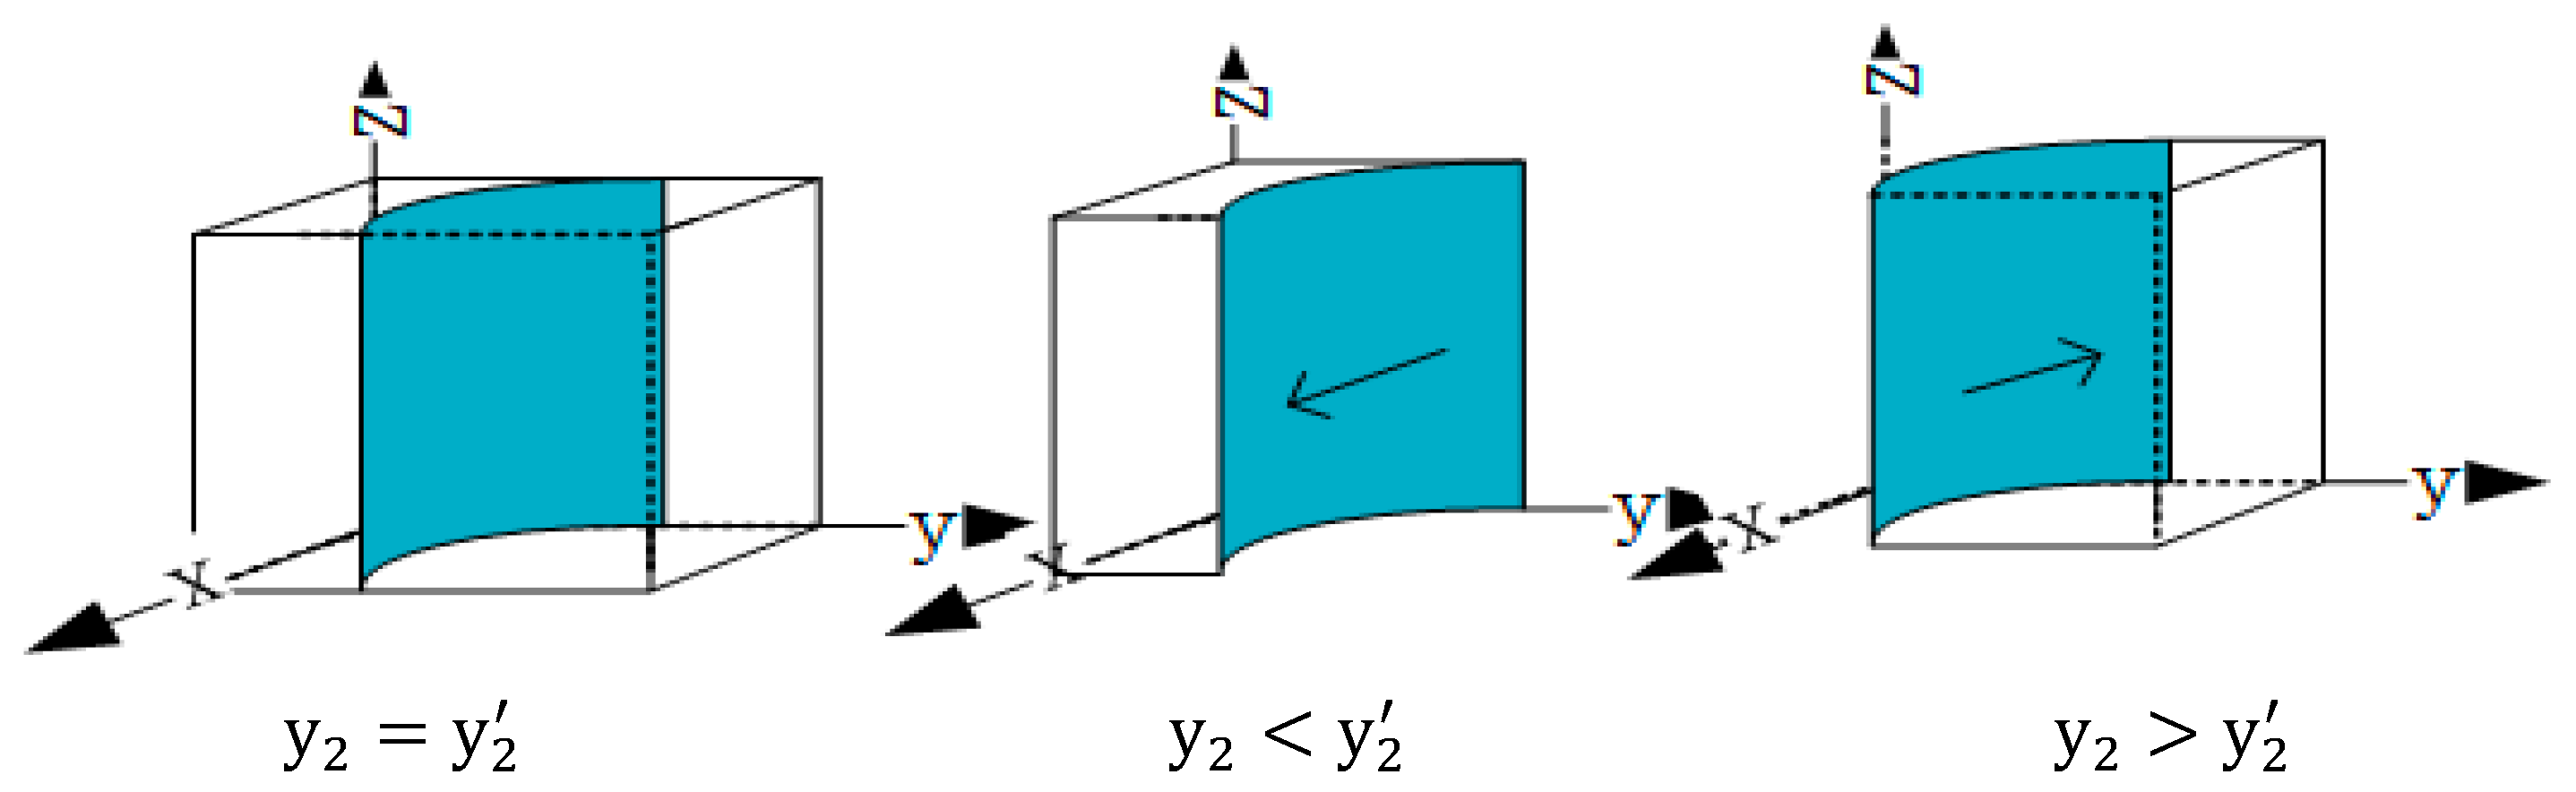
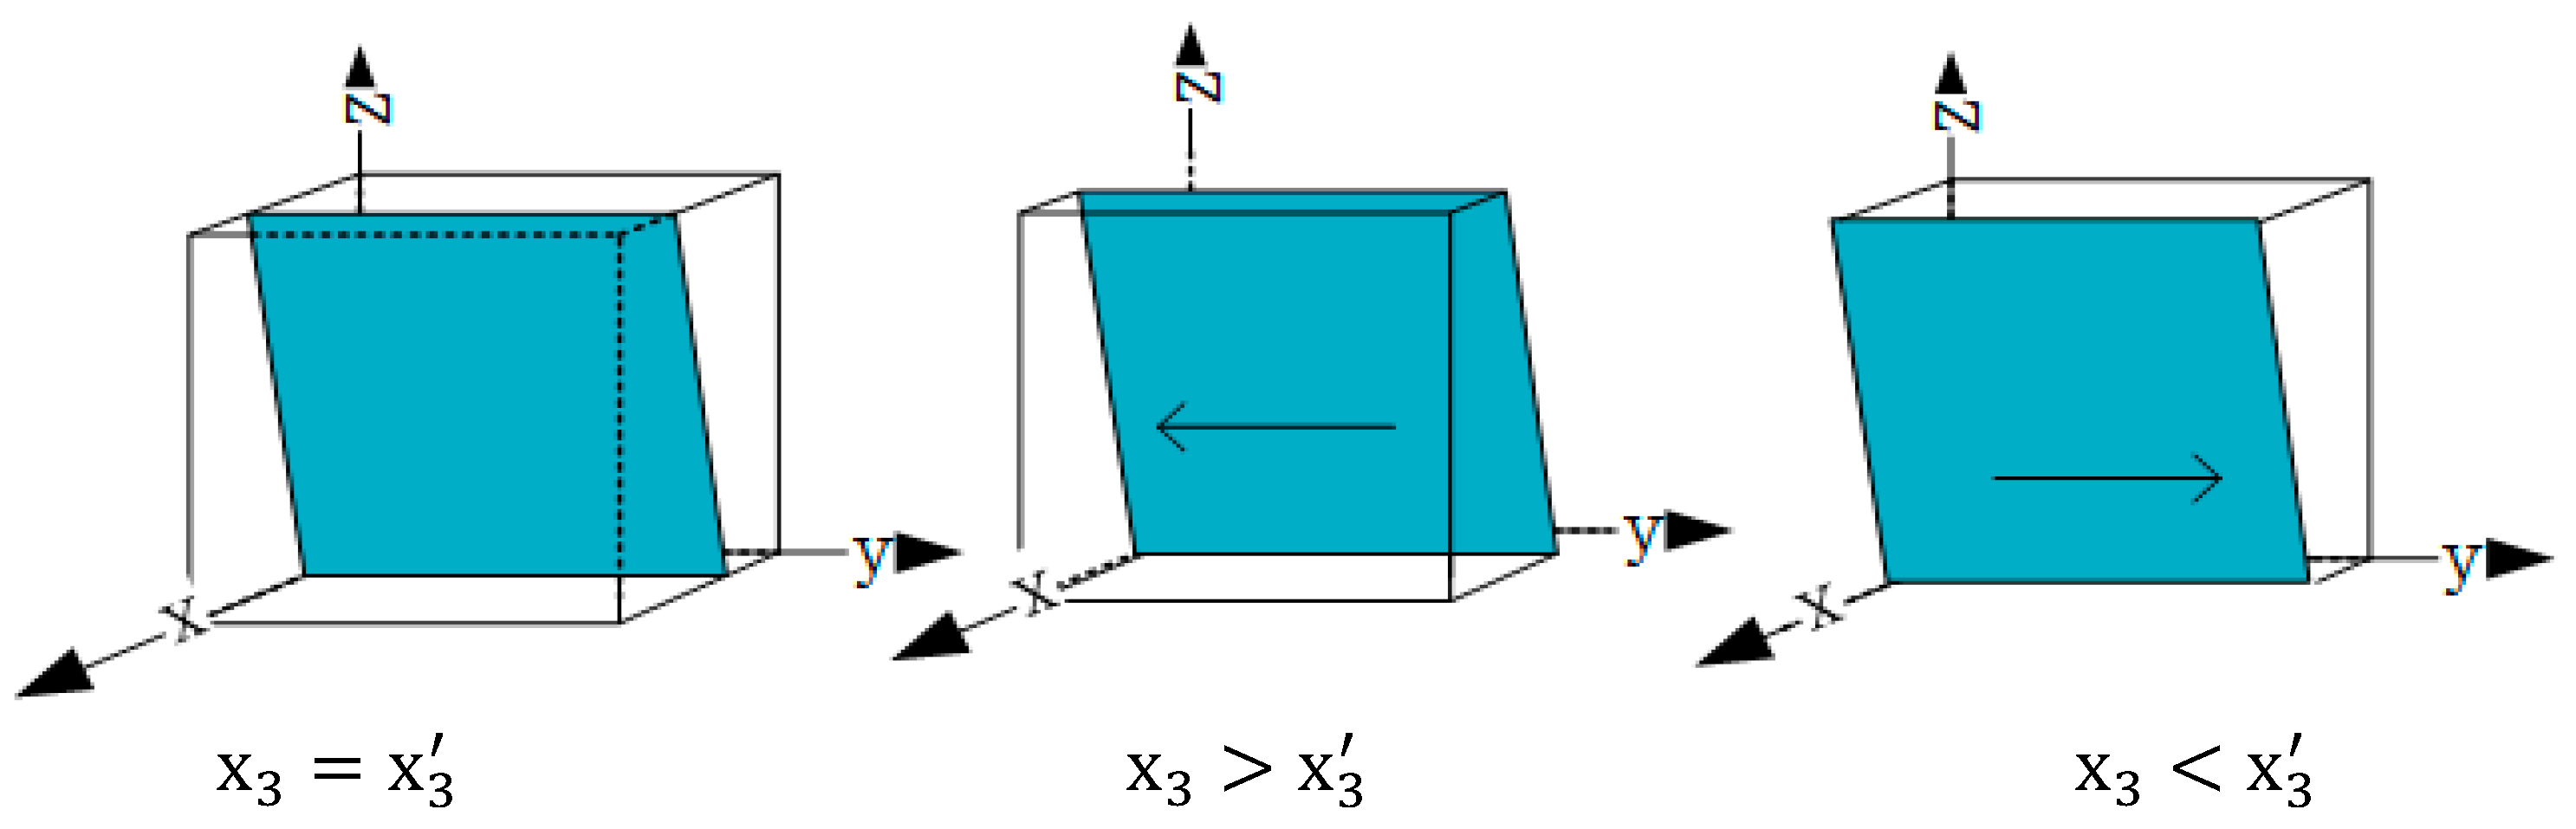
To analyze the equilibrium conditions for the government to achieve the stability strategy from the perspective of a single game player, the following analysis was conducted. Let F 111 ( x 1 ) = 0 determine the stability of the government’s choice strategy. Since ( R 11 c 11 R 12 + c 12 ) + ( 1 y 1 ) × p 1 was positively or negatively uncertain, the following assumption was made:
When ( R 11 c 11 R 12 + c 12 ) + ( 1 y 1 ) × p 1 = 0 , suppose y 1 = 1 + ( R 11 c 11 R 12 + c 12 ) p 1 , the following was true:
When y 1 = y 1 , then F 111 ( x 1 ) = 0 , all  x 1 were in the evolutionary stable state.
When y 1 y 1 , with F 111 ( x 1 ) = 0 , two possible evolutionary stability points were x 1 = 0 and x 1 = 1 .
According to the stability theorem of the replication dynamic equation, the probability of the government choosing supervision to be in a stable state must satisfy two conditions: F 111 ( x 1 ) = 0 and d F 111 ( x 1 ) d x 1 < 0 . Therefore, by taking the derivative of F 111 ( x 1 ) , Equation (5) was obtained.
d F 111 ( x 1 ) d x 1 = ( 1 2 x 1 ) ( ( R 11 c 11 R 12 + c 12 ) + ( 1 y 1 ) × p 1 )
When y 1 < y 1 ,   x 1 = 1 , the two conditions for reaching a steady state were satisfied, and in this case, x 1 = 1 meant the government evolved a stable strategy.
When y 1 > y 1 , x 1 = 0 , the two conditions for achieving a stable state were met, where x 1 = 0 
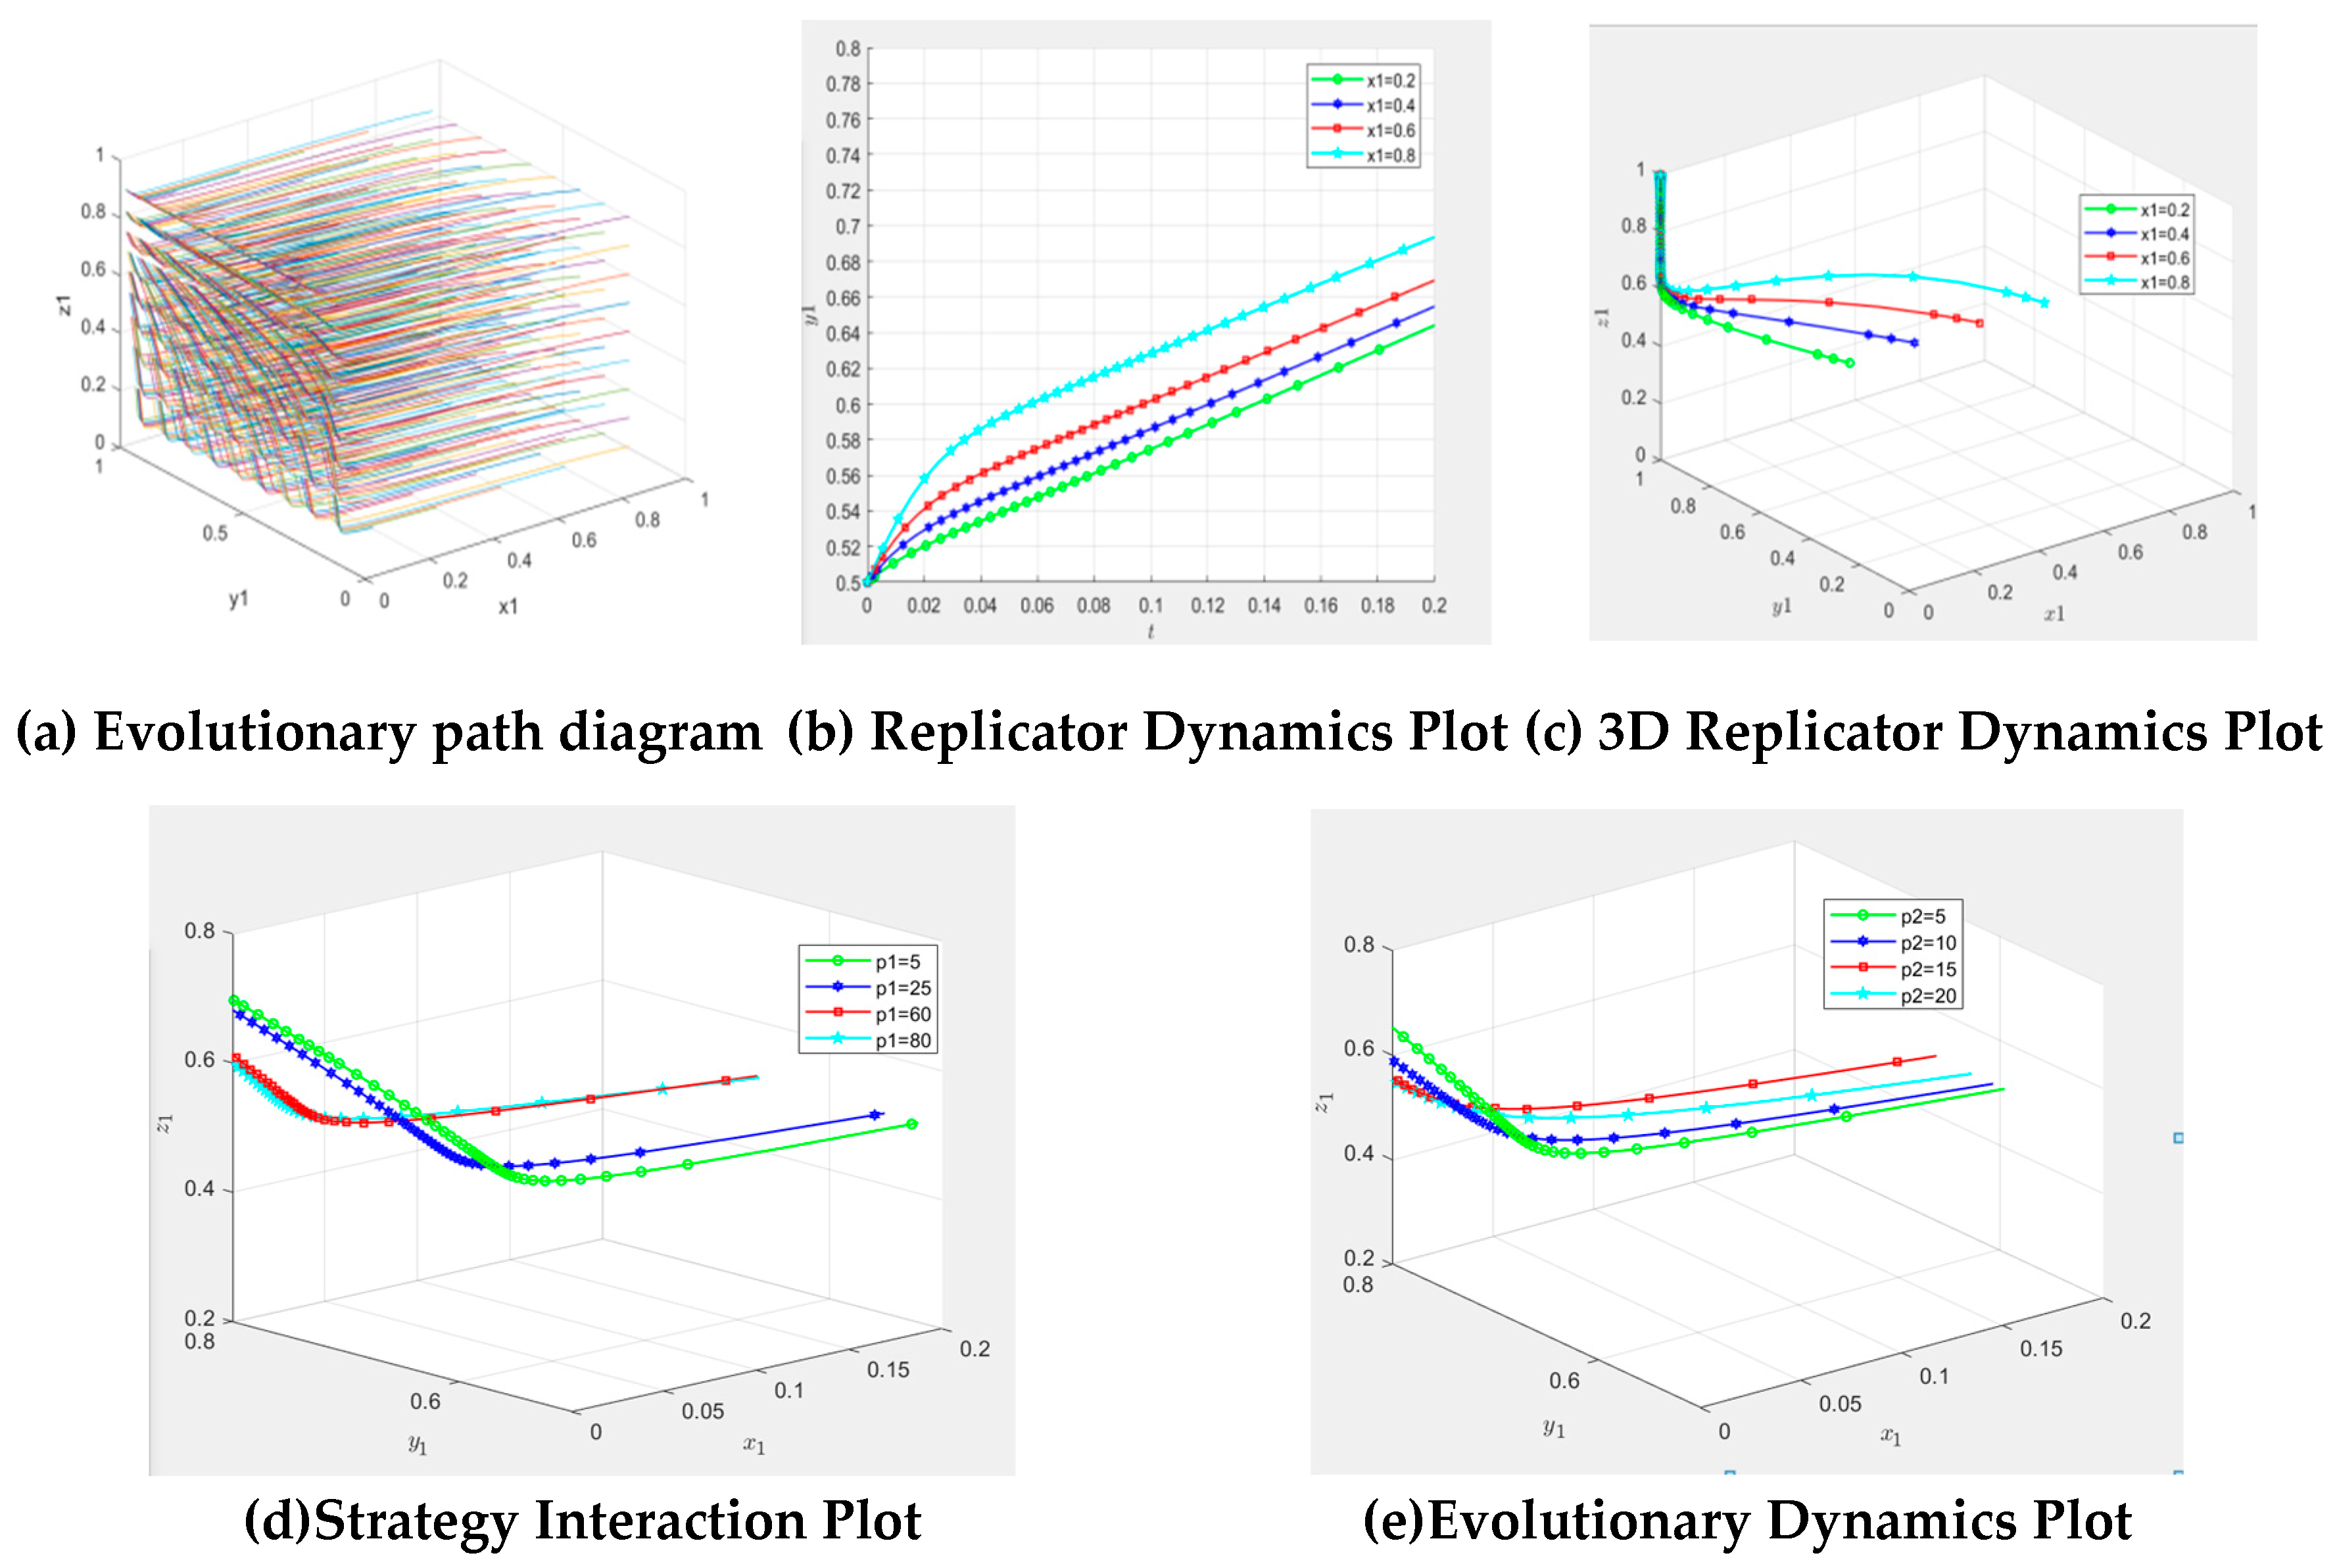
was the government’s evolution stability strategy. To demonstrate the above conclusions more intuitively, the evolutionary trend of government strategy was plotted (Figure 2).
  • Analysis of the evolution and stability strategy of heavy pollution enterprises
Based on the return matrix in Table 2, the expected return of heavy-pollution enterprises that opt for emission reduction was U 21 , and it was expressed as Equation (6).
U 21 = x 1 z 1 ( R 21 c 21 ) + x 1 ( 1 z 1 ) ( R 21 c 21 ) + ( 1 x 1 ) z 1 ( R 21 c 21 ) + ( 1 x 1 ) ( 1 z 1 ) ( R 21 c 21 )
The expected return of the heavy-pollution enterprise group was U 22 , which was expressed s Equation (7).
U 22 = x 1 z 1 ( R 22 C 22 p 1 p 2 ) + x 1 ( 1 z 1 ) ( R 22 C 22 p 1 ) + ( 1 x 1 ) z 1 ( R 22 c 22 p 2 ) + ( 1 z 1 ) ( 1 x 1 ) ( R 22 c 22 )
The average expected return of heavily polluting enterprises was U 2 , which was given by Equation (8).
U 2 = y 1 U 21 + ( 1 y 1 ) U 22
The replication dynamic equation for the policy selection of heavily polluting enterprises is shown in Equation (9).
F 211 ( y 1 ) = d y 1 d t = y 1 ( U 21 U 2 ) = y 1 ( 1 y 1 ) ( R 21 c 21 R 22 + c 22 ) z 1 × x 1 + z 1 × p 2 + x 1 × p 1
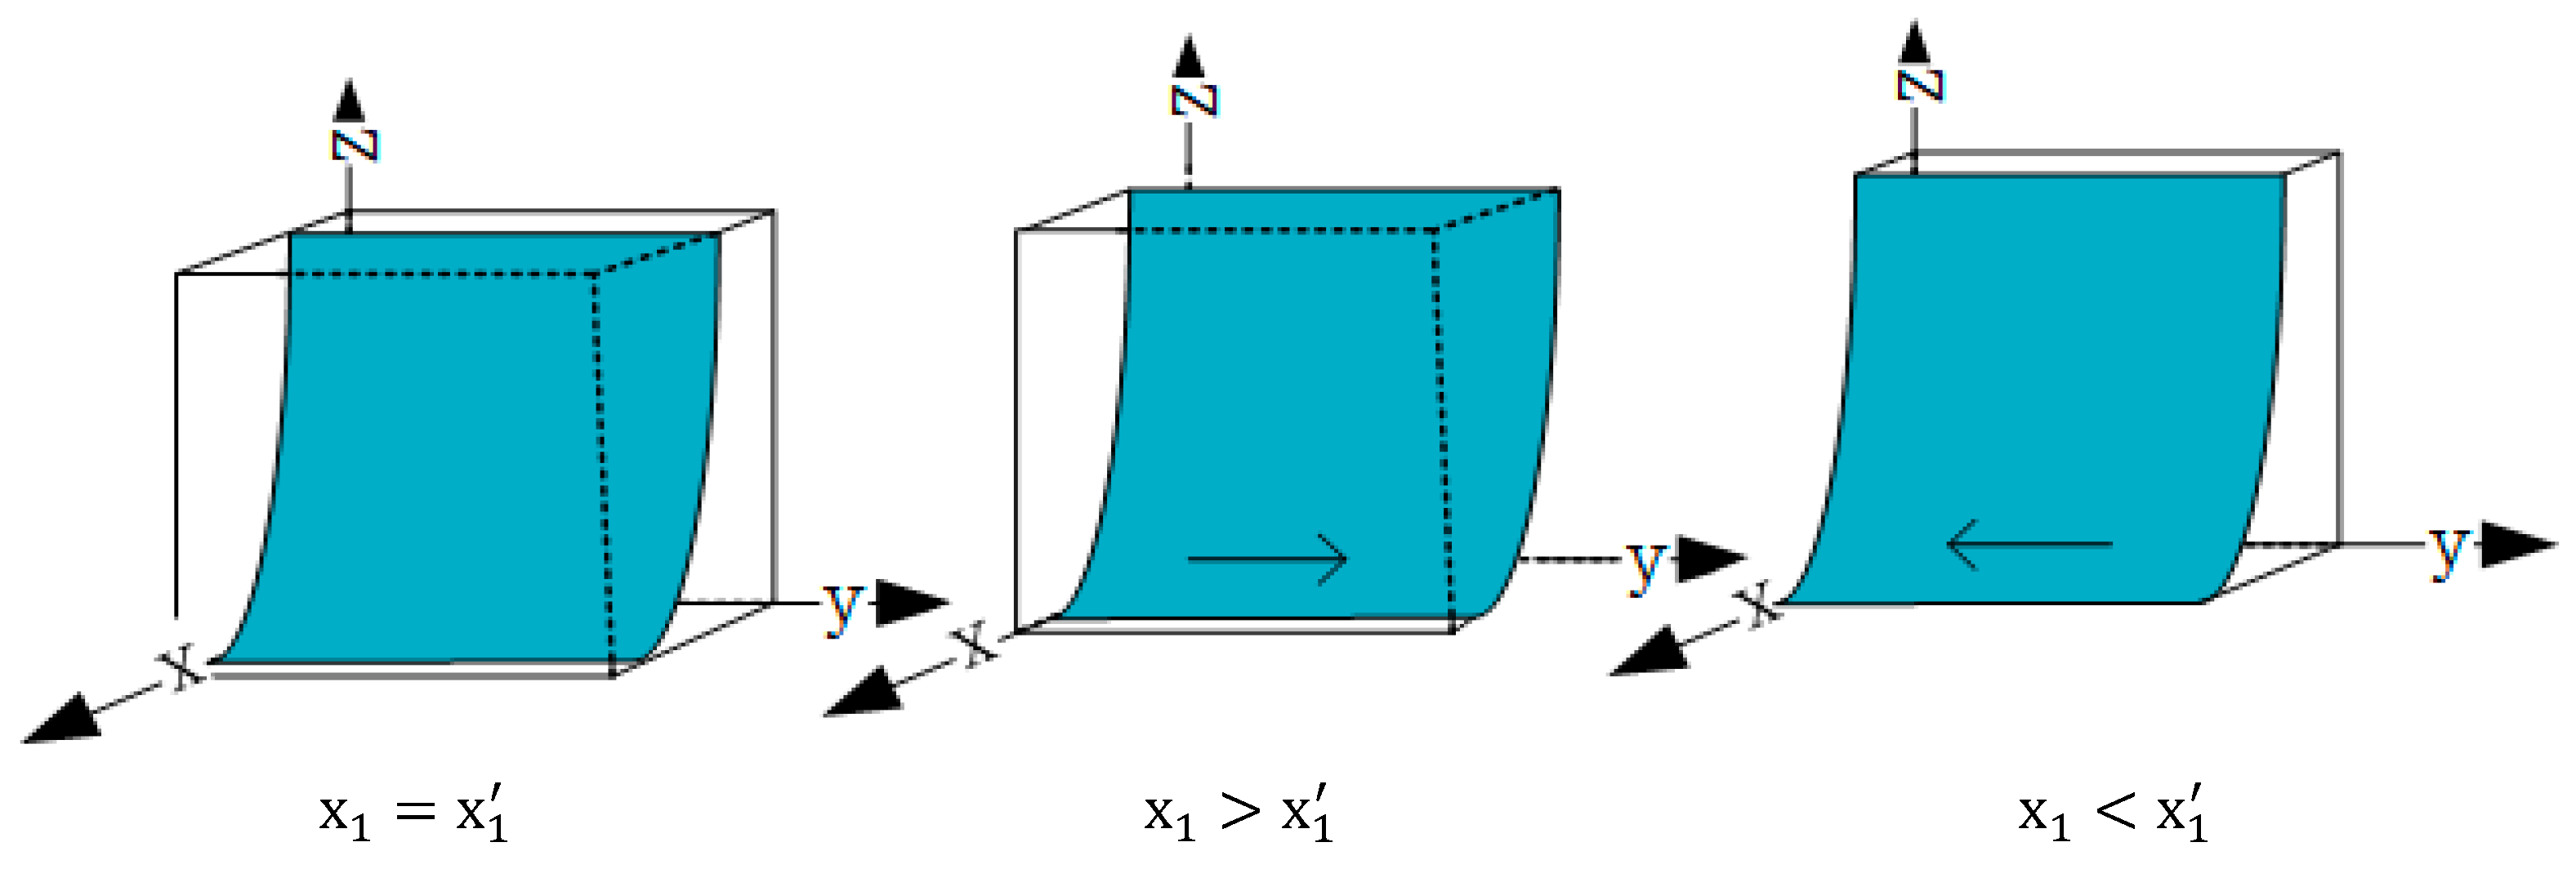
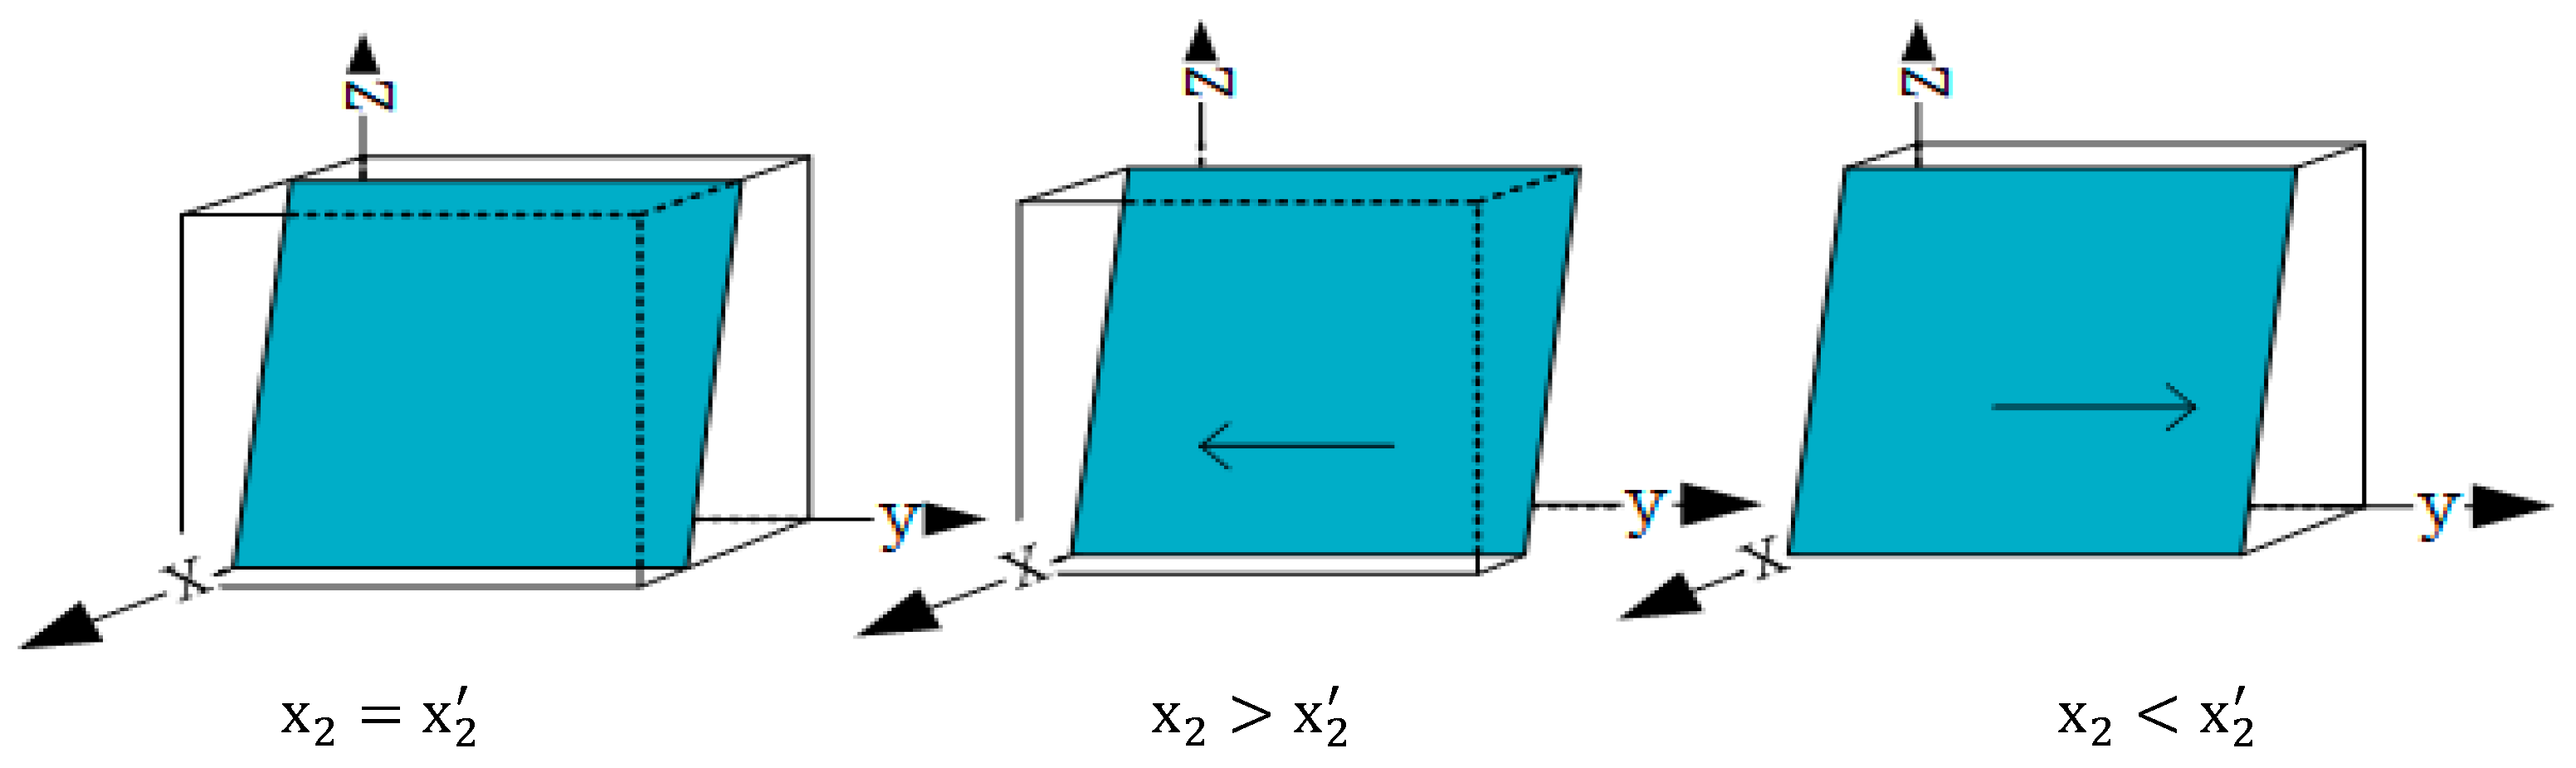
To analyze the equilibrium conditions for heavily polluting enterprises to achieve the stability strategy from the perspective of an individual game subject and to achieve F 211 ( y 1 ) = 0 for the stability of heavily polluting enterprises’ strategy because ( R 21 c 21 R 22 + c 22 ) z 1 × x 1 + z 1 × p 2 + x 1 × p 1 reflected positive and negative uncertainty, the following was assumed:
When ( R 21 c 21 R 22 + c 22 ) z 1 × x 1 + z 1 × p 2 + x 1 × p 1 = 0 , set x 1 = z 1 p 2 ( z 1 R 21 z 1 c 21 z 1 R 22 + z 1 c 22 + p 1 ) , and the following was true:
When x 1 = x 1 , then F 211 ( y 1 ) = 0 , all y 1 was in an evolutionary stable state.
When x 1 x 1 , make F 211 ( y 1 ) = 0 , and two possible evolutionary stability points were y 1 = 0 and y 1 = 1 .
According to the stability theorem of the replication dynamic equation, the probability that the heavily polluting enterprises were in a stable state must meet two conditions: F 211 ( y 1 ) = 0 and d F 211 ( y 1 ) d y 1 < 0 . Therefore, by taking the derivative of F 211 ( y 1 ) , Equation (10) was obtained.
d F 211 ( y 1 ) d y 1 = ( 1 2 y 1 ) ( ( R 21 c 21 R 22 + c 22 ) z 1 × x 1 + z 1 × p 2 + x 1 × p 1 )
When x 1 < x 1 ,   y 1 = 0 , the two conditions to becoming a stable state were met. Where y 1 = 0 denotes the evolutionary stability strategy of the heavily polluting enterprises.
When , x 1 > x 1 ,   y 1 = 1 , the two conditions to becoming a stable state were met. Where y 1 = 1 
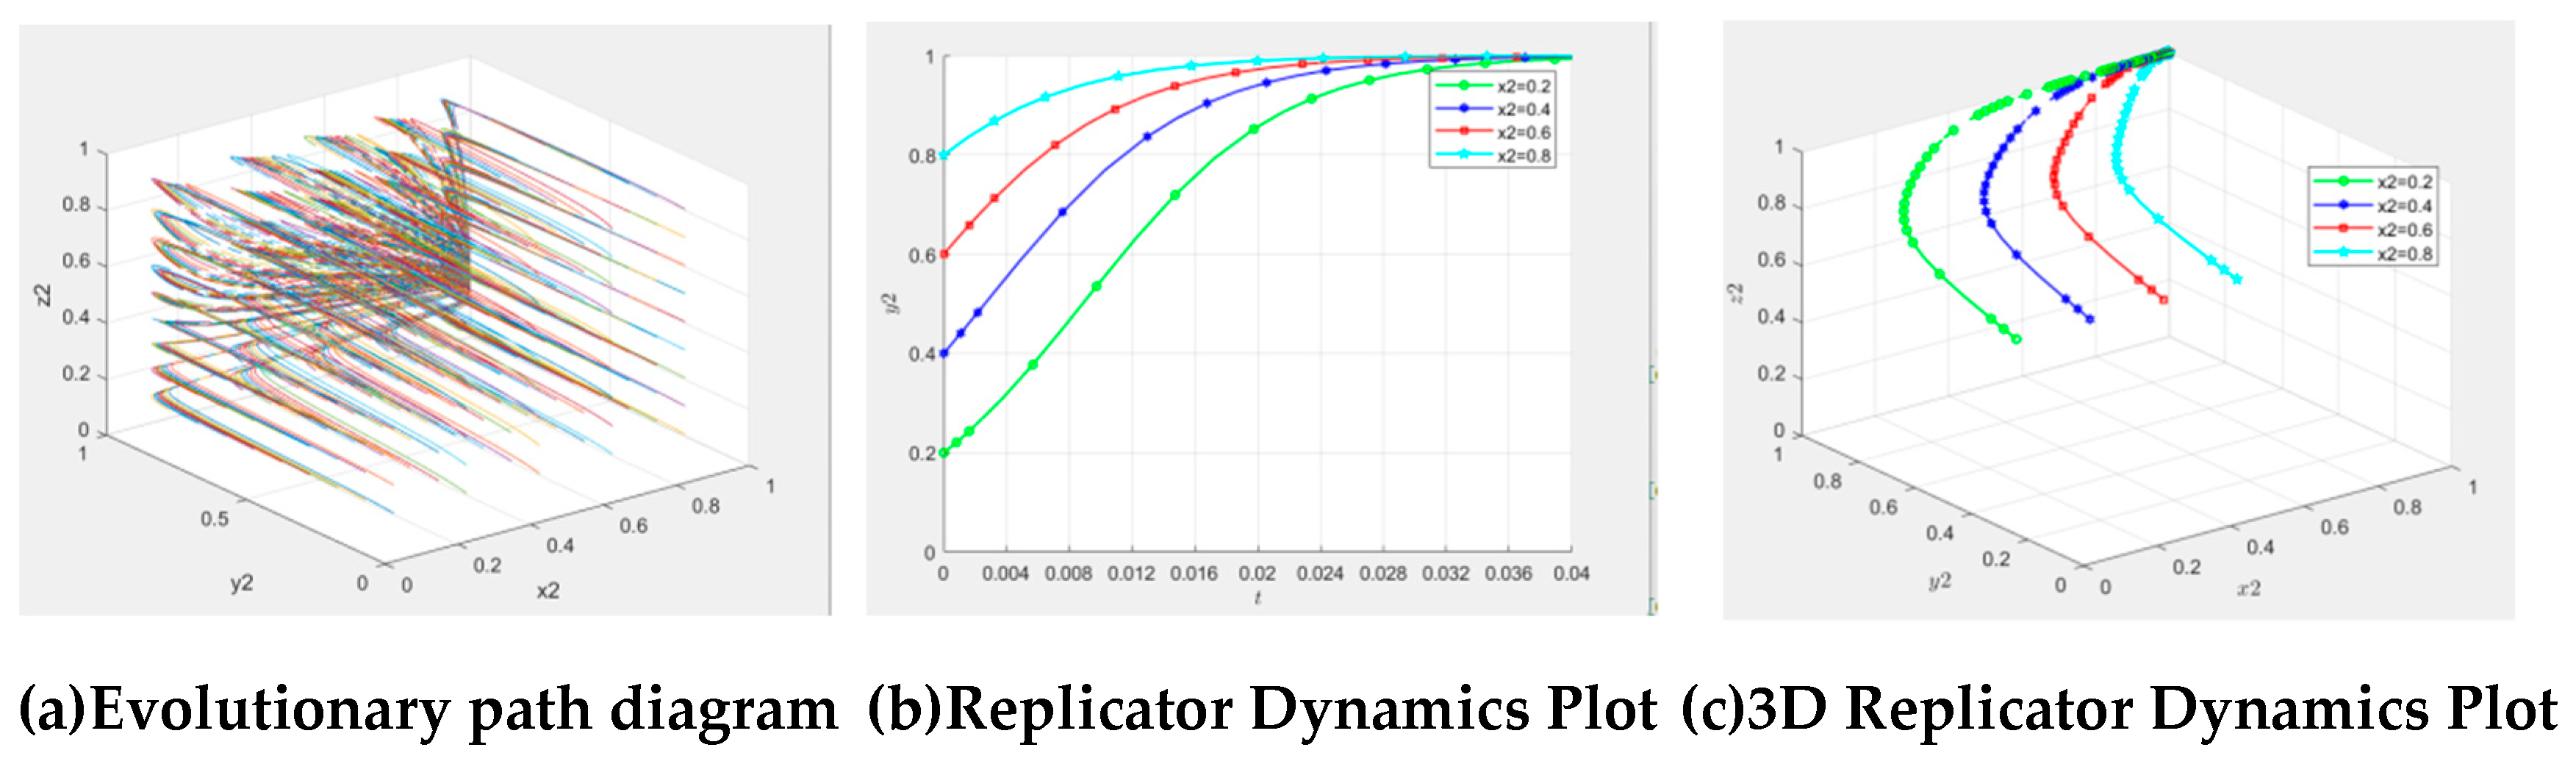
denotes the evolutionary stability strategy of the heavily polluting enterprises. To demonstrate the above conclusions more intuitively, the strategic evolution trend of heavily polluting enterprises was plotted (Figure 3).
  • Analysis of the public evolutionary stability strategy
Based on the income matrix in Table 2, the expected return of the public from choosing supervised enterprises was U 31 , as shown in Equation (11).
U 31 = x 1 y 1 ( R 31 c 31 ) + x 1 ( 1 y 1 ) ( R 31 c 31 + p 3 ) + ( 1 x 1 ) y 1 ( R 31 c 31 ) + ( 1 x 1 ) ( 1 y 1 ) ( R 31 c 31 + p 3 )
The expected return of the public choosing not to supervise the enterprise was U 32 , as shown in Equation (12).
U 32 = x 1 y 1 ( R 32 c 32 ) + x 1 ( 1 y 1 ) ( R 32 c 32 ) + ( 1 x 1 ) y 1 ( R 32 c 32 ) + ( 1 y 1 ) ( 1 x 1 ) ( R 32 c 32 )
The average expected return for the public was U 3 , as shown in Equation (13).
U 3 = z 1 U 31 + ( 1 z 1 ) U 32
The replication dynamic equation for public strategy selection is shown in Equation (14):
F 311 ( z 1 ) = d z 1 d t = z 1 ( U 31 U 3 ) = z 1 ( 1 z 1 ) ( R 31 c 31 R 32 + c 32 ) + ( 1 y 1 ) × p 3
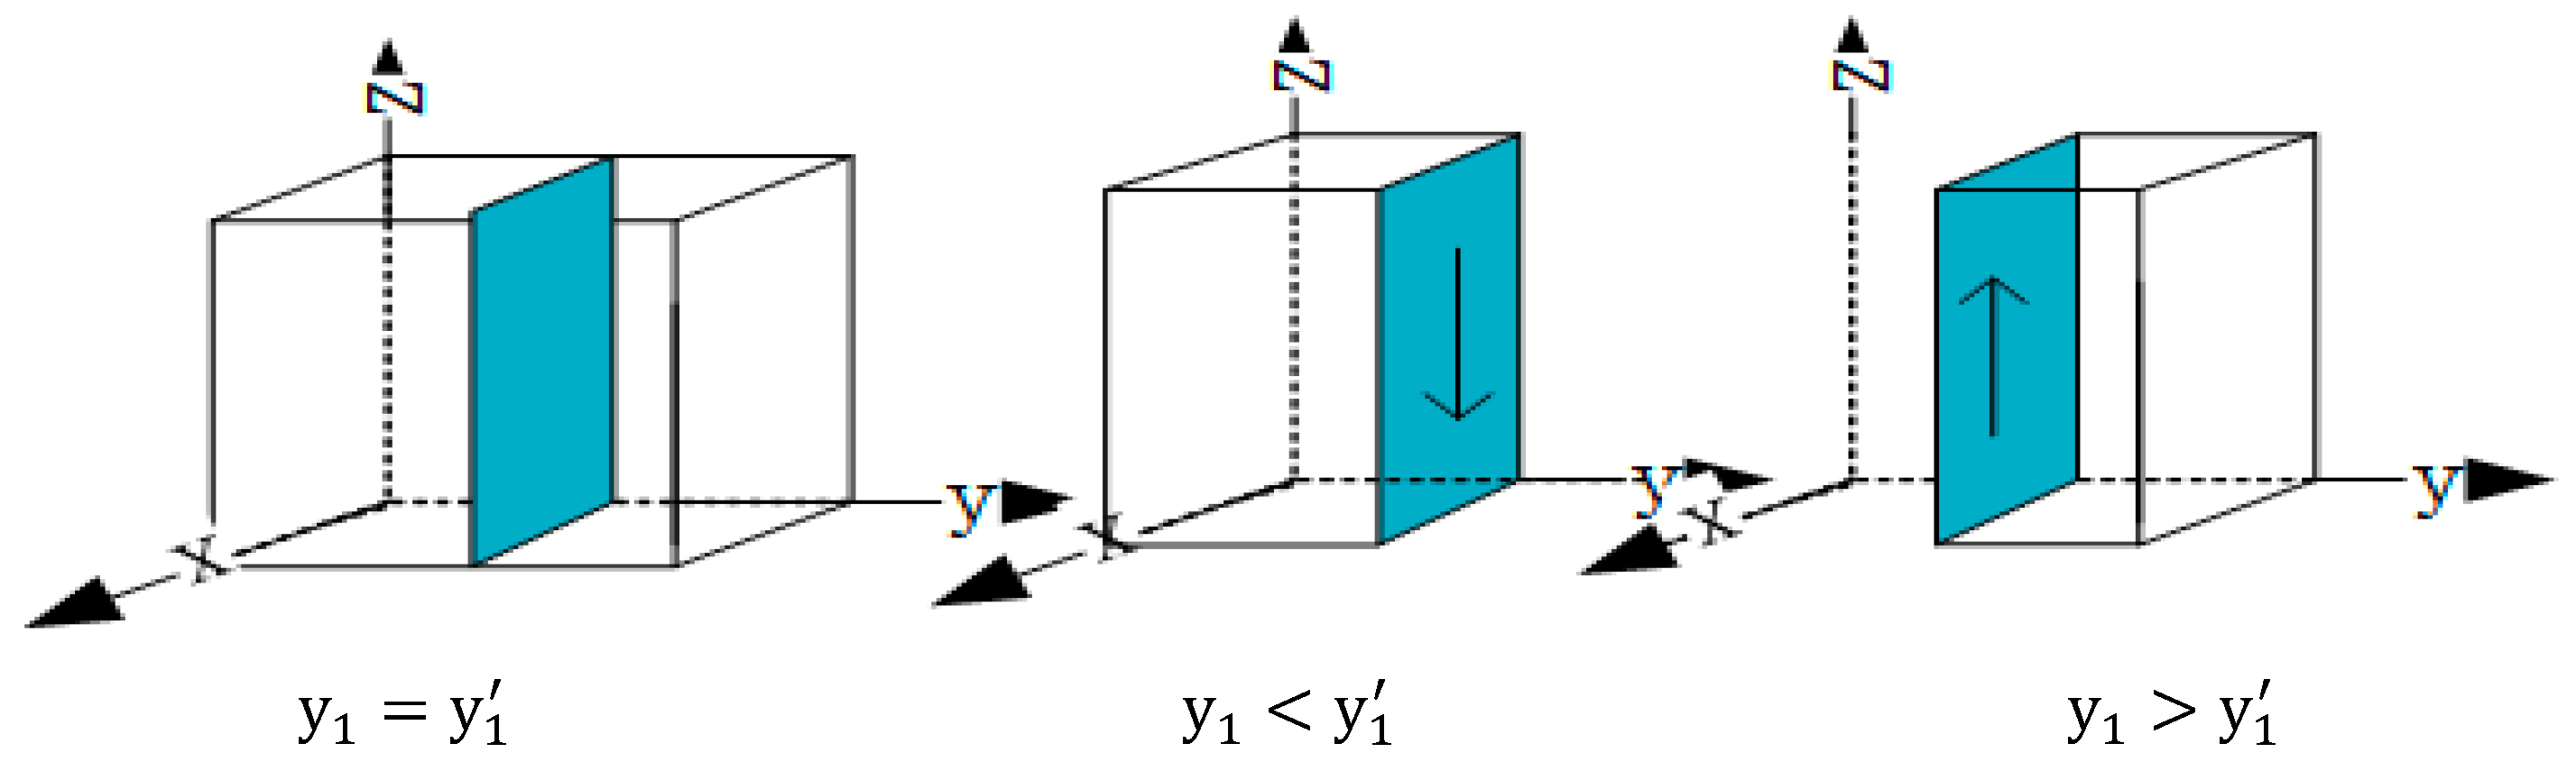
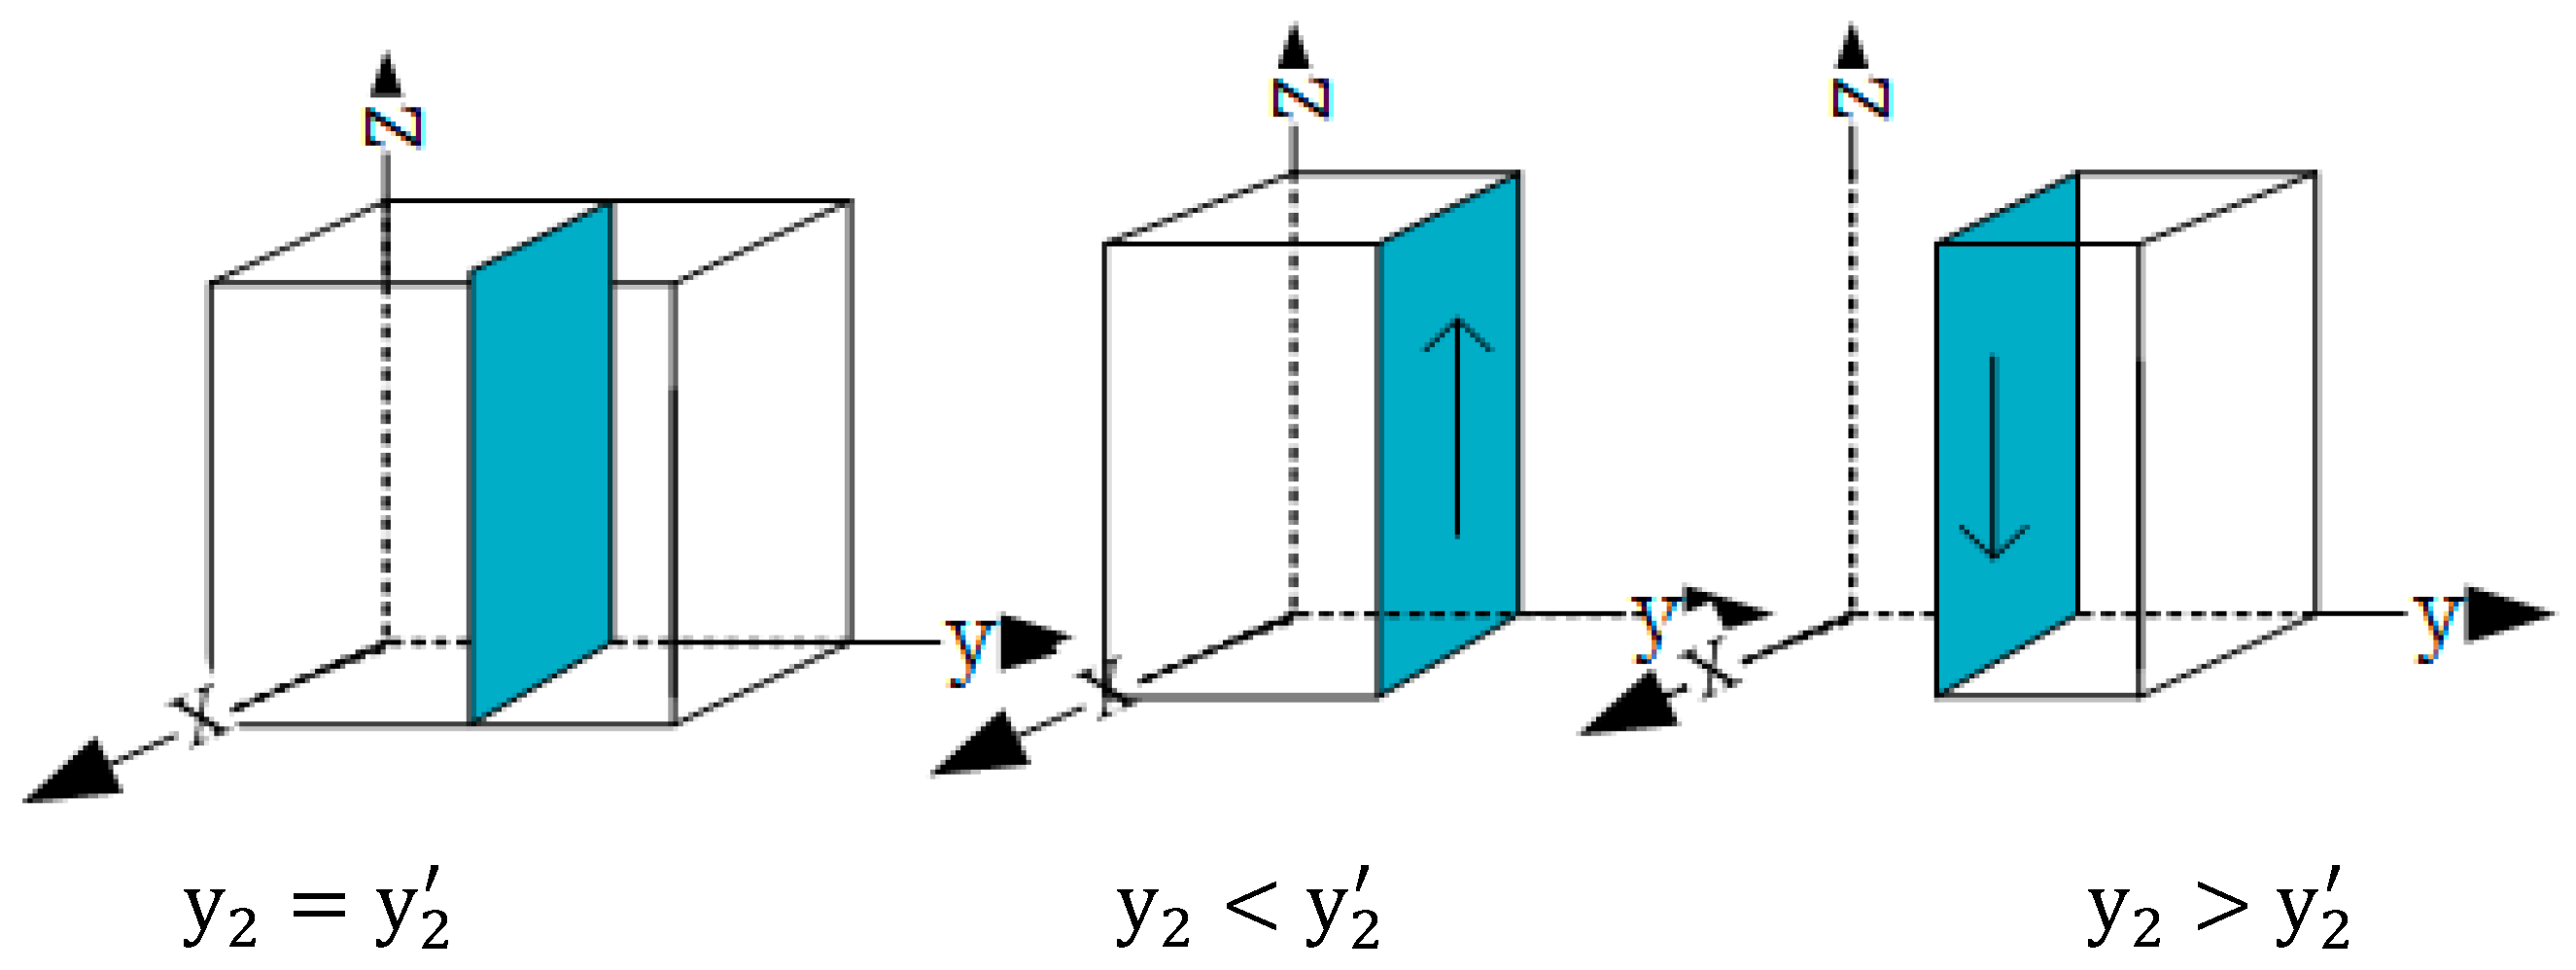
To analyze the equilibrium conditions for the public to reach a stable strategy from the perspective of a single game player, F 311 ( z 1 ) = 0 was used to seek the stability of the public choice strategy. Since ( R 31 c 31 R 32 + c 32 ) + ( 1 y 1 ) × p 3 reflected positive and negative uncertainty, the following was performed:
When ( R 31 c 31 R 32 + c 32 ) + ( 1 y 1 ) × p 3 = 0 , set y 1 = 1 + ( R 31 c 31 R 32 + c 32 ) p 3 , the following situations exist:
When y 1 = y 1 , then F 311 ( z 1 ) = 0 , z 1 was in an evolutionary stable state.
When y 1 y 1 , set F 311 ( z 1 ) = 0 , evolutionary stability was true for z 1 = 0 and z 1 = 1 .
According to the stability theorem of the replication dynamic equation, the probability of the public choosing supervision to be in a stable state must satisfy two conditions: F 311 ( z 1 ) = 0 and d F 311 ( z 1 ) d z 1 < 0 . By taking the derivative of F 311 ( z 1 ) , Equation (15) was obtained.
d F 311 ( z 1 ) d z 1 = ( 1 2 z 1 ) ( R 31 c 31 R 32 + c 32 ) + ( 1 y 1 ) × p 3
When y 1 < y 1 and z 1 = 1 , the two conditions for achieving a stable state were satisfied, where z 1 = 1 was the mass evolution stability strategy.
When y 1 > y 1 , z 1 = 0 , the two conditions were satisfied, and z 1 = 0 
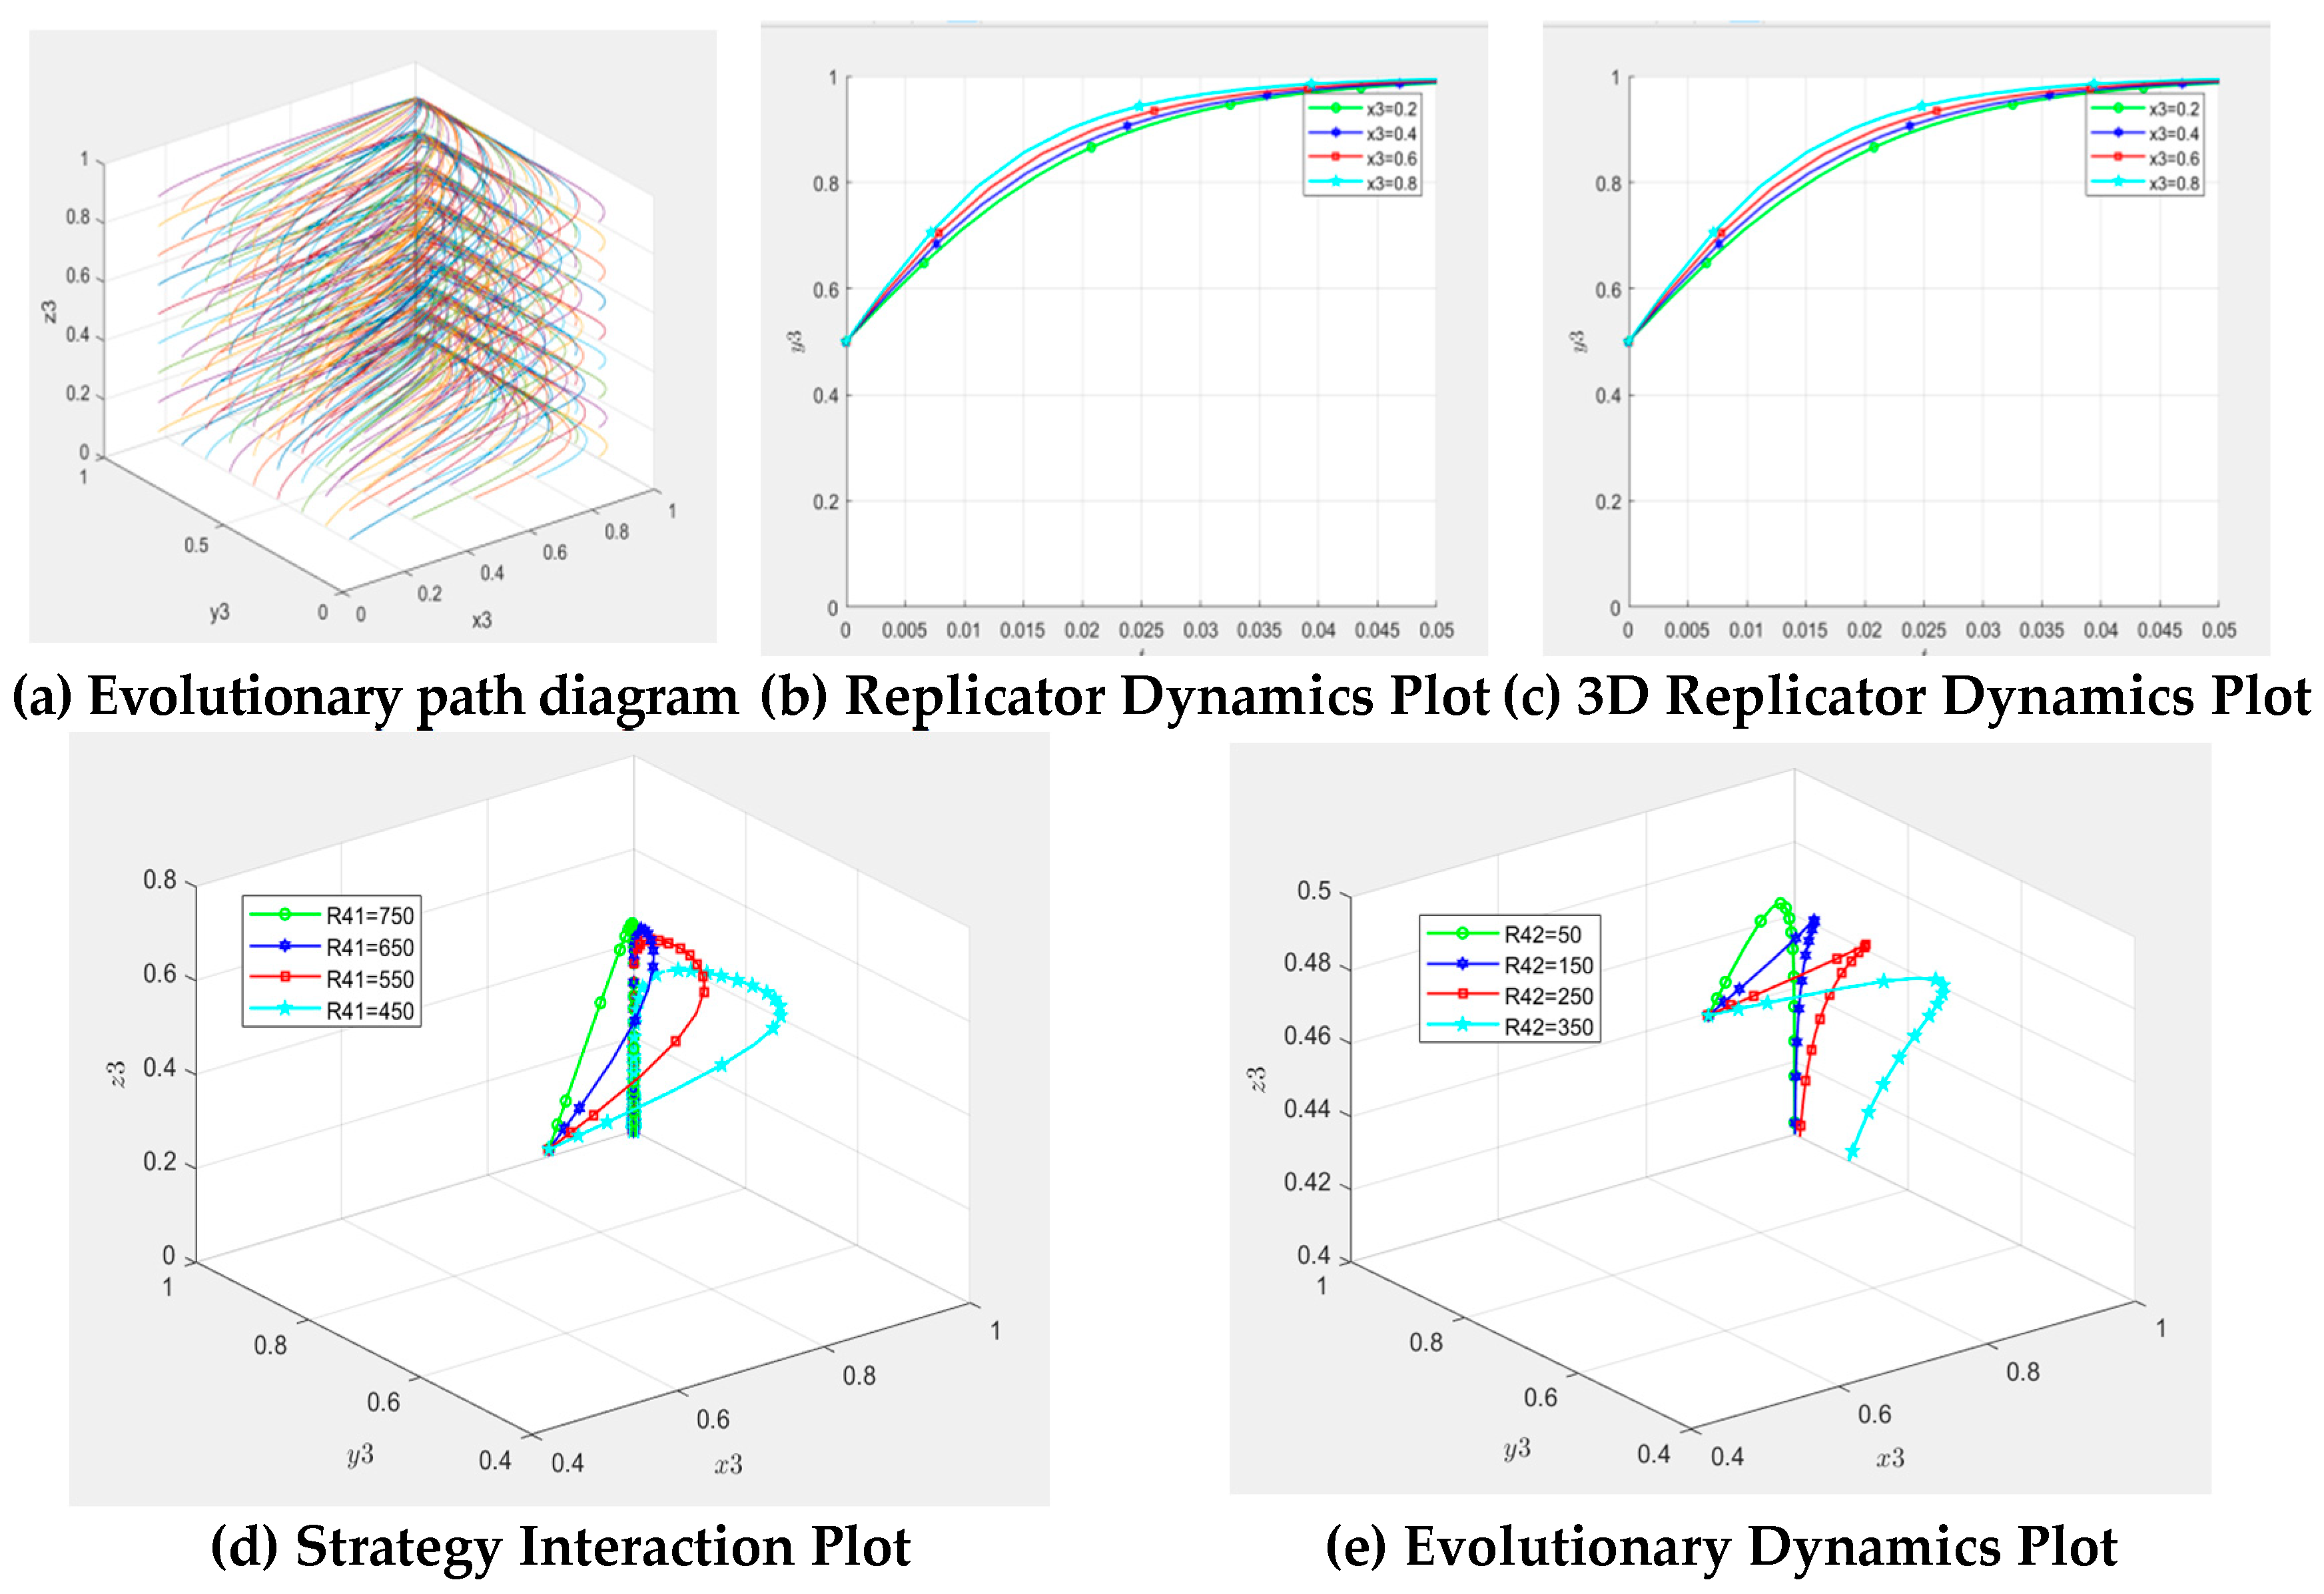
denotes the mass evolution stability strategy. To illustrate the above conclusions more intuitively, the evolutionary trends of public strategies were plotted (Figure 4).

3.1.2. System Stability Analysis

The replication dynamic system was built according to Equations (4), (9) and (14).
d x 1 d t = x 1 ( 1 x 1 ) ( R 11 c 11 R 12 + c 12 ) + ( 1 y 1 ) × p 1   d y 1 d t = y 1 ( 1 y 1 ) ( R 21 c 21 R 22 + c 22 ) z 1 × x 1 + z 1 × p 2 + x 1 × p 1 d z 1 d t = z 1 ( 1 z 1 ) ( R 31 c 31 R 32 + c 32 ) + ( 1 y 1 ) × p 3
It was assumed that d x 1 d t = 0 d y 1 d t = 0 d z 1 d t = 0 , and eight pure strategy equilibria were obtained:
E 11 0 , 0 , 0 , E 12 0 , 0 , 1 , E 13 0 , 1 , 0 , E 14 0 , 1 , 1 , E 15 1 , 0 , 0 , E 16 1 , 1 , 0 , E 17 1 , 0 , 1 ,  and E 18 ( 1 , 1 , 1 ) .
By constructing a Jacobian matrix,
( F 111 ( x 1 ) ) x 1 ( F 111 ( x 1 ) ) y 1 ( F 111 ( x 1 ) ) z 1 ( F 211 ( y 1 ) ) x 1 ( F 211 ( y 1 ) ) y 1 ( F 211 ( y 1 ) ) z 1 ( F 311 ( z 1 ) ) x 1 ( F 311 ( z 1 ) ) y 1 ( F 311 ( z 1 ) ) z 1
= ( 1 2 x 1 ) ( ( R 11 c 11 R 12 + c 12 ) + ( 1 y 1 ) × p 1 ) y 1 ( 1 y 1 ) ( p 1 c 21 z 1 + z 1 c 22 + R 21 z 1 R 22 z 1 ) 0 x 1 ( 1 x 1 ) p 1 T z 1 ( 1 z 1 ) p 3 0 y 1 ( 1 y 1 ) ( p 1 c 21 x 1 + x 1 c 22 + R 21 x 1 R 22 x 1 ) ( 1 2 z 1 ) ( R 31 c 31 R 32 + c 32 ) + ( 1 y 1 ) × p 3
where T = ( 1 2 y 1 ) ( ( R 21 c 21 R 22 + c 22 ) z 1 × x 1 + z 1 × p 2 + x 1 × p 1 )
In the analysis of the stability of the replication dynamic system using Lyyanov’s first method (If the eigenvalues of the Jacobian matrix corresponding to the local equilibrium point were all negative, then the equilibrium point was the evolutionary stability point. If at least one eigenvalue was positive, the equilibrium point was unstable), and the resulting eight pure strategy equilibrium points were substituted into the Jacobian matrix to find the eigenvalues of each equilibrium point, as shown in Table 3 [32,33].
From Table 3, we concluded that:
When R 11 c 11 R 12 + c 12 < 0 and R 31 c 31 R 32 + c 32 > 0 , that is, the net income of government supervision was less than that of public supervision, E 14 ( 0 , 1 , 1 ) reflected the stable evolution strategy, the system was the evolution trend of government supervision, emission reduction from heavily polluting enterprises, and the state of public supervision. In this ideal social state, enterprises were weakly constrained by the masses through independent governance and actively reduced pollution emissions. Moreover, the promotion of public education enhanced social awareness of environmental protection. The government does not directly supervise but ensures the transparency of environmental action and the possibility of public participation by formulating incentive policies, improving the legal system, and providing a platform for information disclosure. With the joint efforts of the government, enterprises, and the public, society formed a self-regulated and self-supervised environmental protection ecosystem that promoted the green transformation and sustainable development of the economy.
When R 11 c 11 R 12 + c 12 > 0 and R 31 c 31 R 32 + c 32 < 0 , that is, the net income of the government choice of supervision is greater than the net income of choosing no supervision, and the net income of mass choice of supervision is less than the net income of choosing no supervision E 16 ( 1 , 1 , 0 ) was the stability point, and the evolution trend of system stability was government supervision, emission reduction by heavily polluting enterprises, and no public supervision. In this state, government supervision becomes key in promoting the emission reduction from heavily polluting enterprises. To further enhance the sustainability of this state, governments should continue to strengthen regulations and standards while encouraging businesses to invest in clean technologies through economic incentives such as tax incentives and subsidies. Support for technological innovation is also crucial, and governments can fund research and development projects to help companies adopt more environmentally friendly production methods, as well as raise public awareness through environmental education. Establishing public participation mechanisms, such as online reporting systems, and ensuring the transparency of corporate environmental information can gradually stimulate public enthusiasm for participation.
When R 11 c 11 R 12 + c 12 + p 1 > 0 , R 21 c 21 R 22 + c 22 + p 1 + p 2 < 0 , and R 31 c 31 R 32 + c 32 + p 3 > 0 , E 17 ( 1 , 0 , 1 ) was the stability point of system evolution. The evolution trend was supervision from the government, emission reduction, and public supervision, which reflected the most unsatisfactory state. In this situation, the government’s regulatory efforts failed to effectively promote the emission reduction actions of enterprises, and the supervision of the masses failed to produce the expected positive impact, leading to difficulties in achieving environmental protection. This suggested the need for reassessment and adjustment of regulatory strategies as well as enhancing the effectiveness of public participation to achieve better environmental protection.
When R 11 c 11 R 12 + c 12 > 0 , R 21 c 21 R 22 + c 22 + p 1 + p 2 > 0 , and R 31 c 31 R 32 + c 32 < 0 , E 18 ( 1 , 1 , 1 ) was the stability point of system evolution. Here, the strategy of the system was government supervision, emission reduction, and public supervision. This joint effort constituted a comprehensive environmental protection framework. The government must establish and implement strict environmental laws and regulations, encourage enterprises to reduce emissions through incentive and punishment mechanisms, and increase the research, development, and promotion of environmental protection technologies. Moreover, public awareness of environmental protection must be increased, and people should be encouraged to implement energy conservation and emission reduction practices in their daily lives through education and media.

3.2. Second Layer of Evolutionary Game Analysis

In the second layer of the game, the income matrix combining the government, heavily polluting enterprises, and the public was constructed, and the results are shown in Table 4.

3.2.1. The Stability Analysis of the Second Layer of the Game Subject

  • Analysis of government evolution and stability strategy
Based on the return matrix in Table 4, the expected return of the government under strict environmental regulations was U 14 , as shown in Equation (16).
U 14 = z 2 y 2 ( R 14 c 14 ) + y 2 ( 1 z 2 ) ( R 14 c 14 ) + ( 1 y 2 ) z 2 ( R 14 c 14 + p 4 ) + ( 1 y 2 ) ( 1 z 2 ) ( R 14 c 14 )
The expected return for the government to implement relaxed environmental regulations was U 15 , as shown in Equation (17).
U 15 = y 2 z 2 ( R 15 c 15 ) + y 2 ( 1 z 2 ) ( R 15 c 15 ) + ( 1 y 2 ) z 2 ( R 15 c 15 ) + ( 1 y 2 ) ( 1 z 2 ) ( R 15 c 15 )
The average expected return of the government was U 7 , as shown in Equation (18).
U 7 = x 2 U 14 + ( 1 x 2 ) U 15
The replication dynamic equation for government policy selection is shown in Equation (19).
F 131 ( x 2 ) = d x 2 d t = x 2 ( U 14 U 7 ) = x 2 ( 1 x 2 ) R 14 c 14 R 15 + c 15 + z 2 p 4 y 2 z 2 p 4
The following analysis was conducted to analyze the equilibrium conditions for the government to achieve a stability strategy from the perspective of a single game subject. Let F 131 ( x 2 ) = 0 analyze the stability of the government selection strategy. Owing to the positive and negative uncertainty of R 14 c 14 R 15 + c 15 + z 2 p 4 y 2 z 2 p 4 , the following was assumed:
When R 14 c 14 R 15 + c 15 + z 2 p 4 y 2 z 2 p 4 = 0 , set y 2 = R 14 c 14 R 15 + c 15 + z 2 p 4 z 2 p 4 , the following was true:
When y 2 = y 2 , then F 131 ( x 2 ) = 0 , x 2 is in an evolutionary stable state.
When y 2 y 2 , make F 131 ( x 2 ) = 0 , x 2 = 0 and x 2 = 1 were evolutionary stability points.
According to the stability theorem of the replication dynamic equation, the probability that government supervision is in a stable state must meet two conditions: F 131 ( x 2 ) = 0 and d d F 131 ( x 2 ) d x 2 < 0 . Therefore, by taking the derivative of F 131 ( x 2 ) , Equation (20) was obtained.
d F 131 ( x 2 ) d x 2 = ( 1 2 x 2 ) R 14 c 14 R 15 + c 15 + z 2 p 4 y 2 z 2 p 4
When y 2 < y 2 ,   x 2 = 1 satisfied the two conditions to become a stable state, then x 2 = 1 is the government’s evolutionary stability strategy.
When y 2 > y 2 ,   x 2 = 0 , the two conditions for becoming a stable state are satisfied, and x 2 = 0 is the government’s evolutionary stability strategy. To show the above conclusions more intuitively, the evolutionary trend of the government strategy was plotted (Figure 5).
  • Analysis of the evolution and stability strategy of heavily polluting enterprises
The benefit of heavily polluting enterprises that prefer ecological performance was U 25 , as shown in Equation (21).
U 25 = x 2 z 2 ( R 25 c 25 + E ) + x 2 ( 1 z 2 ) ( R 25 c 25 + E ) + ( 1 x 2 ) z 2 ( R 25 c 25 + E ) + ( 1 x 2 ) ( 1 z 2 ) ( R 25 c 25 + E )
The income of heavily polluting enterprises that choose financial performance and not emissions reduction was U 26 , as shown in Equation (22).
U 26 = x 2 z 2 ( R 26 p 5 p 6 ) + x 2 ( 1 z 2 ) ( R 26 p 5 ) + ( 1 x 2 ) z 2 ( R 26 p 6 ) + ( 1 x 2 ) ( 1 z 2 ) ( R 26 )
The average return from the strategy selection of heavily polluting enterprises was U 8 , as shown in Equation (23).
U 8 = y 2 U 25 + ( 1 y 2 ) U 26
The replication dynamic equation for the strategy selection of heavily polluting enterprises is given in Equation (24).
F 231 ( y 2 ) = d y 2 d t = y 2 ( 1 y 2 ) E + R 25 c 25 R 26 + x 2 p 5 + z 2 p 6
To analyze the equilibrium conditions for heavily polluting enterprises to achieve stable strategies from the perspective of a single game subject, the following analysis was conducted: Make F 231 ( y 2 ) = 0 for the stability of the government selection strategy because E + R 25 c 25 R 26 + x 2 p 5 + z 2 p 6 denotes positive and negative and uncertainty, the following was assumed:
When E + R 25 c 25 R 26 + x 2 p 5 + z 2 p 6 = 0 , set x 2 = ( E + R 25 c 25 R 26 + z 2 p 6 ) p 5 , the following was true:
When x 2 = x 2 , then F 231 ( y 2 ) = 0 , y 2 was in an evolutionary stable state.
When x 2 x 2 , make F 231 ( y 2 ) = 0 , y 2 = 0 and y 2 = 1 were evolutionary stable states.
According to the stability theorem of the replication dynamic equation, the probability that the government choosing supervision was in a stable state needed to meet the two conditions F 231 ( y 2 ) = 0 and d F 231 ( y 2 ) d y 2 < 0 ; therefore, taking the derivative of F 231 ( y 2 ) , Equation (25) was obtained.
d F 231 ( y 2 ) d y 2 = ( 1 2 y 2 ) E + R 25 c 25 R 26 + x 2 p 5 + z 2 p 6
When x 2 < x 2 and y 2 = 1 , the two conditions for reaching a stable state were met when y 2 = 1 was the evolutionary stability strategy for heavily polluting enterprises.
When x 2 > x 2 and y 2 = 0 , the two conditions for becoming a stable state were met. Here, y 2 = 0 was the evolutionary stable strategy of heavily polluting enterprises. To demonstrate the above conclusion more intuitively, the evolutionary trend of government strategy was plotted (Figure 6).
  • Analysis of the public evolutionary stability strategy
The benefit of public participation in environmental supervision was U 35 , which is expressed in Equation (26):
U 35 = x 2 y 2 ( R 31 c 31 ) + x 2 ( 1 y 2 ) ( R 31 c 31 + p 6 ) + ( 1 x 2 ) y 2 R 31 c 31 ) + ( 1 x 2 ) ( 1 y 2 ) ( R 31 c 31 + p 6 )
The benefit of public participation in environmental supervision was U 36 and was expressed using Equation (27).
U 36 = x 2 y 2 ( R 32 c 32 ) + x 2 ( 1 y 2 ) ( R 32 c 32 ) + ( 1 x 2 ) y 2 ( R 32 c 32 ) + ( 1 x 2 ) ( 1 y 2 ) ( R 32 c 32 )
The average gain for the public was U 9 , as shown in Equation (28).
U 9 = z 2 U 35 + ( 1 z 2 ) U 36
The replication dynamic equation for public strategy selection was given by Equation (29):
F 331 ( z 2 ) = d z 2 d t = z 2 ( 1 z 2 ) ( R 31 c 31 R 32 + c 32 ) + ( 1 y 2 ) × p 6
The following analysis was conducted to analyze the equilibrium conditions for the public to achieve a stability strategy from the perspective of a single game subject. Make F 331 ( z 2 ) = 0 for the stability of the public selection strategy. Owing to the positive and negative uncertainty of ( R 31 c 31 R 32 + c 32 ) + ( 1 y 2 ) × p 6 , the following was assumed:
When ( R 31 c 31 R 32 + c 32 ) + ( 1 y 2 ) × p 6 = 0 , set y 2 = p 6 + R 31 c 31 R 32 + c 32 p 6 , the following situations were true:
When y 2 = y 2 , then F 331 ( z 2 ) = 0 , y 2 was in an evolutionary stable state.
When y 2 y 2 , with F 331 ( z 2 ) = 0 , y 2 = 0 and y 2 = 1 were evolutionary stability points.
According to the stability theorem of the replication dynamic equation, the probability that the government will choose supervision to be in a stable state must satisfy two conditions: F 331 ( z 2 ) = 0 and d F 331 ( z 2 ) d z 2 < 0 . Equation (30) was obtained by directing the F 331 ( z 2 ) .
d F 331 ( z 2 ) d z 2 = ( 1 2 z 2 ) ( R 31 c 31 R 32 + c 32 ) + ( 1 y 2 ) × p 6
When y 2 < y 2 and z 2 = 1 , the two conditions for achieving a stable state were satisfied, at which point z 2 = 1 was the public evolution stability strategy.
When y 2 > y 2 and z 2 = 0 , the two conditions for achieving a stable state were met. Here, z 2 = 0 was the stable public evolution strategy. To demonstrate the above conclusion more intuitively, the evolutionary trend of public strategy was plotted (Figure 7).

3.2.2. Stability Analysis of Participant Subject Strategy Combination

The replication dynamic system was built according to Equations (19), (24) and (29):
d x 2 d t = x 2 ( 1 x 2 ) R 14 c 14 R 15 + c 15 + z 2 p 4 y 2 z 2 p 4   d y 2 d t = y 2 ( 1 y 2 ) E + R 25 c 25 R 26 + x 2 p 5 + z 2 p 6 d z 2 d t = z 2 ( 1 z 2 ) ( R 31 c 31 R 32 + c 32 ) + ( 1 y 2 ) × p 6
It was assumed that d x 2 d t = 0 d y 2 d t = 0 d z 2 d t = 0 , and eight pure strategy equilibria were obtained E 21 ( 0 , 0 , 0 ) , E 22 ( 0 , 0 , 1 ) , E 23 ( 0 , 1 , 0 ) , E 24 ( 0 , 1 , 1 ) , E 25 ( 1 , 0 , 0 ) , E 26 ( 1 , 1 , 0 ) , E 27 ( 1 , 0 , 1 ) , and E 28 ( 1 , 1 , 1 ) .
By constructing a Jacobian matrix,
( F 131 ( x 2 ) ) x 2 ( F 131 ( x 2 ) ) y 2 ( F 131 ( x 2 ) ) z 2 ( F 231 ( y 2 ) ) x 2 ( F 231 ( y 2 ) ) y 2 ( F 231 ( y 2 ) ) z 2 ( F 331 ( z 2 ) ) x 2 ( F 331 ( z 2 ) ) y 2 ( F 331 ( z 2 ) ) z 2
= ( 1 2 x 2 ) R 14 c 14 R 15 + c 15 + z 2 p 4 z 2 y 2 p 4 y 2 ( 1 y 2 ) p 5 0 0 ( 1 2 y 2 ) E + R 25 c 25 R 26 + x 2 p 5 + z 2 p 6 z 2 ( 1 z 2 ) p 6 0 y 2 ( 1 y 2 ) p 6 ( 1 2 z 1 ) ( R 31 c 31 R 32 + c 32 ) + ( 1 y 2 ) × p 6
Using Lyyanov’s first method to analyze the stability of the replication dynamic system, the eight pure strategy equilibrium points obtained were substituted into the Jacobian matrix to find the eigenvalues of each equilibrium point, as shown in Table 5.
Public supervision is less binding on enterprises; therefore, the public of the enterprise group supervision income R 31 is a small positive, cannot affect the characteristics of positive and negative, based on the thinking of the rational man, the government to the public reward p 6 greater than 0 small positive, cannot affect the positive and negative characteristics, the cost of the public supervision c 32 close to 0, income R 32 close to 0. When R 31 c 31 R 32 + c 32 + p 6  < 0, the equilibrium points E 22 ( 0 , 0 , 1 ) , E 23 ( 0 , 1 , 0 ) , E 24 ( 0 , 1 , 1 ) , E 27 ( 1 , 0 , 1 ) ,   a n d   E 28 ( 1 , 1 , 1 ) were not stable. Therefore, only E 21 0 , 0 , 0 , E 25 1 , 0 , 0 ,   a n d   E 26 ( 1 , 1 , 0 ) were analyzed. From Table 5, we concluded that:
When R 15 c 15 < 0, and E + R 25 c 25 R 26 < 0 ,  it means that the net income from strict environmental regulation by the government is less than zero, heavy pollution enterprise preference environmental performance net income less than preference financial performance of net income, system evolution trend for the government does not implement strict environmental regulation, heavy pollution enterprise group preference financial performance, the public not supervision state, this is not an ideal social state, environmental problems may continue to deteriorate, the goal of social sustainable development is difficult to achieve.
When R 15 c 15 > 0 and E + R 25 c 25 < R 26 p 5 , the net income of the government implementing strict environmental regulation was >0, and heavily polluting enterprises favored financial performance, E 25 ( 1 , 0 , 0 ) was a stable evolution strategy, and the evolution trend of the system was government supervision, heavily polluting enterprises favored financial performance, and no public supervision. If the evolution trend of systems relies solely on government oversight, while heavily polluting companies still prioritize financial performance and the public lacks a sense of supervision, this could lead to insufficient environmental protection efforts. It would be difficult to form an effective social co-governance pattern. Companies might continue to adopt production methods detrimental to the environment in pursuit of maximum profit, neglecting long-term environmental impacts and social responsibilities, thereby exacerbating environmental degradation.
When c 14 c 15 R 14 + R 15 < 0 and ( E + R 25 c 25 R 26 + p 5 ) < 0 , the net income of the government implementing strict environmental regulation was >0, and heavily polluting enterprises favored financial performance, E 26 ( 1 , 1 , 0 ) was a stable evolution strategy, and the evolution trend of the system was government supervision. Meanwhile, heavily polluting enterprises favored environmental performance, and the public did not supervise. This suggested a positive transition with room for improvement. The government’s active supervision set the basic framework and standards for environmental protection and guided enterprises to focus on environmental performance, which is a key step in achieving sustainable development. Corporate preference for environmental performance reflects their awareness of social responsibility and the pursuit of long-term benefits, helping to reduce pollution and improve resource efficiency. No supervision by the public may indicate a social supervision mechanism is lacking, which limits the universality and depth of the supervision force. To further promote the positive evolution of the system, stimulating public awareness of participation and improving awareness and responsibility for environmental protection are necessary.
In summary, unsatisfactory environmental regulations and performance preferences of the government and enterprises may lead to environmental degradation, making it difficult to achieve socially sustainable development. Government supervision and enterprises’ preferences for environmental performance are key to promoting environmental protection; however, enhancing awareness of public participation and supervision to form an effective social co-governance pattern is necessary.

3.3. Third Layer of Evolutionary Game Analysis

The payoff matrix combining the public, leading heavily polluting enterprises, and heavily polluting SMEs was constructed in the third layer of the game, and the results are shown in Table 6.

3.3.1. Stability Analysis of the Third Layer of the Game

  • Analysis of the public evolutionary stability strategy
Based on the income matrix in Table 6, the expected return on strict public supervision was U 33 , as shown in Equation (31).
U 33 = y 3 x 3 ( R 31 c 31 ) + x 3 ( 1 y 3 ) ( R 31 c 31 ) + ( 1 x 3 ) y 3 ( R 31 c 31 ) + ( 1 x 3 ) ( 1 y 3 ) ( R 31 c 31 + p 6 )
The profit when the public chooses not to strictly supervise the enterprise was U 34 , which was expressed as Equation (32).
U 34 = y 3 x 3 ( R 32 c 32 ) + x 3 ( 1 y 3 ) ( R 32 c 32 ) + ( 1 x 3 ) y 3 ( R 32 c 32 ) + ( 1 x 3 ) ( 1 y 3 ) ( R 32 c 32 )
The average return on the public strategy selection was U 4 , as shown in Equation (33).
U 4 = z 3 U 33 + ( 1 z 3 ) U 34
The public choosing strictly supervised replication dynamic equations is expressed in Equation (34).
F 321 ( z 3 ) = d z 3 d t = z 3 ( U 33 U 4 ) = z 3 ( 1 z 3 ) ( ( R 31 c 31 R 32 + c 32 ) + ( 1 x 3 ) ( 1 y 3 ) p 6 )
The following analysis was conducted to analyze the equilibrium conditions for the public to achieve a stability strategy from the perspective of a single game subject. Make F 321 ( z 3 ) = 0 , owing to the positive and negative uncertainty of ( ( R 31 c 31 R 32 + c 32 ) + ( 1 x 3 ) ( 1 y 3 ) p 6 ), the following was assumed:
When ( ( R 31 c 31 R 32 + c 32 ) + ( 1 x 3 ) ( 1 y 3 ) p 6 ) = 0 and y 3 = ( R 31 c 31 R 32 + c 32 ) p 6 ( 1 x 3 ) + 1 , the following was true:
When y 3 = y 3 , then F 321 ( z 3 ) = 0 , z 3 is in an evolutionary stable state.
When y 3 y 3 , with F 321 ( z 3 ) = 0 , z 3 = 0 and z 3 = 1 were evolutionary stability points.
According to the stability theorem of the replication dynamic equation, the probability of the public choosing supervision in a stable state must satisfy two conditions: F 321 ( z 3 ) = 0 and d F 321 ( z 3 ) d z 3 < 0 . Therefore, by taking the derivative of F 321 ( z 3 ) , Equation (35) was obtained.
d F 321 ( z 3 ) d z 3 = ( 1 2 z 3 ) ( ( R 31 c 31 R 32 + c 32 ) + ( 1 x 3 ) ( 1 y 3 ) p 6
Combining the above analyses yielded Table 7.
According to the analysis of evolutionary stabilization strategies in Table 7, the public supervision behavior produced the following rules: (1) When the net income of public supervision was >0, if the probability of green innovation of leading heavily polluting enterprises exceeded the critical value, the public evolutionary stabilization strategy tended to be unsupervised. Conversely, when the probability of enterprise innovation was below the critical value, the public strategy tended to be supervised. (2) When the net income from public supervision was <0, the public tended to adopt a continuous supervision strategy, regardless of whether the probability of green innovation was higher than the critical value. This dynamic relationship suggested a significant threshold effect between the cost–benefit ratio of public surveillance and the level of green technology adoption by enterprises. To illustrate the above conclusions more intuitively, the evolutionary trend of public strategies was plotted, as shown in Figure 8.
  • Analysis of the evolution and stability strategy of the leading heavily polluting enterprises
The profit of leading heavily polluting enterprises from choosing green technological innovation was U 23 , as shown in Equation (36).
U 23 = y 3 z 3 ( R 23 c 23 + p 7 ) + y 3 ( 1 z 3 ) ( R 23 c 23 ) + ( 1 y 3 ) z 3 ( R 23 c 23 + p 7 ) + ( 1 z 3 ) ( 1 y 3 ) ( R 23 c 23 )
The profit of leading heavily polluting enterprises from choosing not to conduct green technological innovation was U 24 , as shown in Equation (37).
U 24 = 0
The average income of leading heavily polluting enterprises was U 5 , as shown in Equation (38).
U 5 = x 3 U 23 + ( 1 x 3 ) U 24
The replication dynamic equation for the strategy selection of leading heavily polluting enterprises is shown in Equation (39).
F 221 ( x 3 ) = d x 3 d t = x 3 ( U 23 U 5 ) = ( 1 x 3 ) ( R 23 c 23 + z 3 p 7 )
To analyze the equilibrium conditions for leading heavily polluting enterprises to achieve a stable strategy from the perspective of a single game subject, the following analysis was conducted. Make F 221 ( x 3 ) = 0 to seek the stability of the selection strategy for leading heavily polluting enterprises. Owing to the positive and negative uncertainty of ( R 23 c 23 + z 3 p 7 ) , the following was assumed:
When ( R 23 c 23 + z 3 p 7 ) = 0 , let z 3 = ( R 23 c 23 ) p 7 , with the following situations:
When z 3 = z 3 , then F 221 ( x 3 ) = 0 , x 3 was in an evolutionary stable state.
When z 3 z 3 , and F 221 ( x 3 ) = 0 , x 3 = 0 and x 3 = 1 are evolutionary stability points.
According to the stability theorem of the replication dynamic equation, the probability that the public chooses supervision in a stable state must satisfy the two conditions of F 221 ( x 3 ) = 0 and d F 221 ( x 3 ) d x 3 < 0 . Therefore, by taking the derivative of F 221 ( x 3 ) , Equation (40) was obtained.
d F 221 ( x 3 ) d x 3 = ( 1 2 x 3 ) ( R 23 c 23 + z 3 p 7 )
When z 3 < z 3 and x 3 = 0 , the two conditions for becoming a stable state were met, and x 3 = 0 was the evolutionary stability strategy of leading heavily polluting enterprises.
When z 3 > z 3 and x 3 = 1 , the two conditions for becoming a stable state were met, and x 3 = 1 was the evolutionary stability strategy of leading heavily polluting enterprises. To demonstrate the above conclusion more intuitively, a strategy evolution trend map of leading heavily polluting enterprises was plotted (Figure 9).
  • Analysis of the evolution and stability strategy of heavily polluting small and medium-sized enterprises
Based on the income matrix in Table 6, the benefit of green technology innovation for heavily polluting SMEs was U 41 , which was expressed using Equation (41).
U 41 = x 3 z 3 ( R 41 c 41 + p 7 ) + x 3 ( 1 z 3 ) ( R 41 c 41 ) + ( 1 x 3 ) z 3 ( R 41 c 41 + p 7 ) + ( 1 z 3 ) ( 1 x 3 ) ( R 41 c 41 )
The benefit of heavily polluting SMEs without green technological innovation was U 42 , which was expressed using Equation (42).
U 42 = z 3 x 3 R 42 + x 3 ( 1 z 3 ) R 42
The average income of heavily polluting SMEs was U 6 , which was expressed using Equation (43).
U 6 = y 3 U 41 + ( 1 y 3 ) U 42
The replication dynamics for the selection strategy of heavily polluting SMEs are expressed in Equation (44).
F 421 ( y 3 ) = d y 3 d t = y 3 ( 1 y 3 ) R 41 c 41 + z 3 p 7 x 3 R 42
The following analysis was conducted to analyze the equilibrium conditions of heavily polluting SMEs from the perspective of a single-game subject. Make F 421 ( y 3 ) = 0 to find the stability of the selection strategy for heavily polluting SMEs. Owing to the positive and negative uncertainty of R 41 c 41 + z 3 p 7 x 3 R 42 , the following was assumed:
When R 41 c 41 + z 3 p 7 x 3 R 42 = 0 , set x 3 = R 41 c 41 + z 3 p 7 R 42 , the following situations exist:
When x 3 = x 3 , then F 421 ( y 3 ) = 0 , y 3 was in an evolutionary stable state.
When x 3 x 3 , and F 421 ( y 3 ) = 0 , y 3 = 0 and y 3 = 1 were evolutionary stability points.
According to the stability theorem of the replication dynamic equation, the probability of choosing a green innovation in a stable state must satisfy two conditions: F 421 ( y 3 ) = 0 and d F 421 ( y 3 ) d y 3 < 0 . By taking the derivative of F 421 ( y 3 ) , Equation (45) was obtained.
d F 421 ( y 3 ) d y 3 = ( 1 2 y 3 ) ( R 41 c 41 + z 3 p 7 x 3 R 42
When x 3 < x 3 and y 3 = 1 , the two conditions for becoming a stable state were met. Here, y 3 = 1 was the stable evolution strategy of leading heavy pollution enterprises;
When x 3 > x 3 , y 3 = 0 , the two conditions for becoming a stable state were satisfied, and y 3 = 0 was the evolutionarily stable strategy. To show the above conclusions more intuitively, the strategy evolution trend of heavily polluting SMEs was plotted (Figure 10).

3.3.2. Stability Analysis of Participant Subject Strategy Combination

The replication dynamic system was built according to Equations (34), (39) and (44).
d x 3 d t = x 3 ( 1 x 3 ) R 23 c 23 + z 3 p 7 d y 3 d t = y 3 ( 1 y 3 ) ( R 41 c 41 + z 3 p 7 x 3 R 42 d z 3 d t = z 3 ( 1 z 3 ) R 31 c 31 R 32 + C 32
It was assumed that d x 3 d t = 0 d y 3 d t = 0 d z 3 d t = 0 , and eight three-population strategy equilibrium points were obtained: E 31 0 , 0 , 0 , E 32 0 , 0 , 1 , E 33 0 , 1 , 0 , E 34 0 , 1 , 1 , E 35 1 , 0 , 0 , E 36 1 , 1 , 0 , E 37 1 , 0 , 1 ,   a n d   E 38 ( 1 , 1 , 1 ) .
By constructing a Jacobian matrix,
( F 221 ( x 3 ) ) x 3 ( F 221 ( x 3 ) ) y 3 ( ( F 221 ( x 3 ) ) z 3 ( F 421 ( y 3 ) ) x 3 ( F 421 ( y 3 ) ) y 3 ( F 421 ( y 3 ) ) z 3 ( F 331 ( z 3 ) ) x 3 ( F 331 ( z 3 ) ) y 3 ( F 331 ( z 3 ) ) z 3
= ( 1 2 x 3 ) R 23 c 23 + z 3 p 7 y 3 ( 1 y 3 ) R 42 0 0 ( 1 2 y 3 ) R 41 c 41 + z 3 p 7 x 3 R 42 0 0 y 3 ( 1 y 3 ) p 7 ( 1 2 z 3 ) R 31 c 31 R 32 + c 32
Using Lyyanov’s first method to analyze the stability of the replication dynamic system, the eight pure strategy equilibrium points obtained were substituted into the Jacobian matrix to find the eigenvalues of each equilibrium point, as shown in Table 8.
The binding force of public supervision on enterprises was small; therefore, the income from public supervision R 31 was considered as a small positive number that cannot affect the positive and negative feature values. The cost of government non-supervision of enterprise c 21 , the cost of public non-supervision c 32 , and income R 32 were all close to 0. When R 31 c 31 R 32 + c 32 < 0 , only E 31 ( 0 , 0 , 0 ) , E 33 ( 0 , 1 , 0 ) ,   a n d   E 36 ( 1 , 1 , 0 ) were analyzed. From Table 7, we concluded that:
When R 23 c 23 < 0 and R 41 c 41 < 0, the net income of green technology innovation by leading heavily polluting enterprises was <0. The net profit of heavily polluting SMEs from green technology innovation was <0. E 31 ( 0 , 0 , 0 ) was the stability point of system evolution. For a stable evolution strategy, the evolution trend of the system is that the leading heavy pollution enterprises do not implement green technology innovation, and heavily polluting small and medium-sized enterprises do not make green technology innovations. The state of public neglect is not an ideal state of society; that is, the leading heavy pollution enterprises and small and medium-sized enterprises have not adopted green technology innovation. At the same time, the public lacks the necessary environmental supervision. The social state formed by the lack of green innovation impetus and public supervision not only aggravates the severity of environmental problems but also reflects the collective action dilemma of society in promoting sustainable development.
When R 23 c 23 < 0 , and R 41 c 41 > 0 , the net income of leading heavily polluting enterprises implementing green technology innovation is negative, while that of heavily polluting SMEs is positive. E 33 ( 0 , 1 , 0 ) was the stability point of system evolution. For the stable evolution strategy, the evolution trend is characterized by heavy-polluting leading enterprises not engaging in green technological innovation, while heavy-polluting small and medium-sized enterprises engaged in green technological innovation, which the public does not supervise. The evolution trend of the system presented a differentiation state. On the one hand, leading enterprises of heavy pollution are not actively engaged in the innovation and application of green technology because of various factors, such as cost considerations, short-term profit pursuit, or a lack of understanding of green transformation. This not only exacerbated the problem of environmental pollution but also limited the sustainable development of the whole industry. On the other hand, some heavily polluting SMEs are realizing the need for a green transformation, possibly because of more flexible operating mechanisms or higher sensitivity to market changes. They are attempting to adopt green technology to gain advantages in future market competition. However, this transition may be in its infancy, and its size and influence are relatively limited. In this trend, the role of the public does not seem to be fully implemented; the necessary environmental awareness and supervision strength lead to a lack of social pressure on enterprises, and it is difficult to form sufficient external impetus to promote the green transformation of the entire industry. Overall, this situation reflects the unbalanced distribution of environmental responsibility and the imperfect social supervision mechanism. A more balanced and comprehensive development by raising public awareness and strengthening corporate responsibility is urgently required.
When R 23 c 23 > 0, and R 41 c 41 R 42   > 0, the leading heavy pollution enterprises for green technology innovation net income is greater than 0, heavy pollution of small and medium-sized enterprises net income is less than 0.  E 36 ( 1 , 1 , 0 ) was the stability point of system evolution. The evolution trend of the system was characterized by heavy-polluting leading enterprises engaging in green technological innovation, heavy-polluting small and medium-sized enterprises engaging in green technological innovation, and the state of the public not supervising. The evolution trend of the system shows that the leading enterprises in heavily polluting industries have begun to actively participate in the innovation of green technology. They have more resources and capabilities to manage the requirements of environmental regulations or improve their corporate image and market competitiveness. Leading enterprises strive to reduce pollution emissions during the production process through research and development and the adoption of cleaner production technologies, causing a transition to sustainable development. Many heavily polluting SMEs are gradually following suit. Although they may face capital and technology restrictions, these enterprises explore green innovation paths suitable for their own conditions for survival and development. Despite the positive trend in green innovation at the enterprise and industry levels, the role of public participation and supervision is not fully understood. In this state, the public lacks sufficient understanding and attention to the green actions of enterprises, which may lead them to slow the pace of green transformation or take only superficial measures to address the public and regulations without external pressure. Owing to the lack of public supervision, there may still be information asymmetry in the market, and it is difficult for consumers to accurately judge whether the green innovation of enterprises is real and effective, which may also affect the market recognition of green products and consumers’ green consumption choices.
In summary, when heavily polluting enterprises lack motivation for green technological innovation and lack public supervision, a collective action dilemma of aggravated environmental problems and sustainable social development may occur. Even if some heavily polluting enterprises pursue green technology innovation, if public supervision and participation are insufficient, it may limit the depth and breadth of the green transformation of the entire industry. The public must improve their awareness of environmental protection and corporate social responsibility to promote balanced development.

4. Numerical Simulation Analysis

4.1. First-Layer Game Simulation Analysis

By analyzing four different situations, this study systematically evaluated the choice of carbon emission reduction strategies for heavily polluting enterprises under different government supervision, punishment mechanisms, and public participation. Case 1 examined the impact of public supervision on the carbon emission reduction strategies of heavily polluting enterprises. For parameters R 11 = 100 , c 11 = 200 , R 21 = 100 , c 21 = 8 , R 31 = 80 , R 32 = 7 , c 31 = 90 , c 32 = 3 , R 22 = 60 , c 22 = 50 , R 12 = 3 , c 12 = 5 , p 1 = 50 , p 2 = 5 , p 3 = 5 , the simulation results are shown in Figure 11a. Case 2 evaluated the influence of government supervision intensity on the emission reduction probability of heavily polluting enterprises and assigned x 1 as 0.2, 0.4, 0.6, or 0.8. The three-dimensional results are shown in Figure 11b,c. Case 3 evaluated the influence of the government punishment mechanism on the emission reduction behavior of heavily polluting enterprises and assigned p 1 as 5, 25, 60, or 80 for simulation analysis. The results are shown in Figure 11d. Case 4 evaluated the impact of the joint supervision of the government and the public on the carbon emission reduction strategy of heavily polluting enterprises. A simulation analysis was conducted at p 2 = 5, 10, 15, or 20. The results are shown in Figure 11e.
As shown in Figure 11a, in the absence of direct government supervision, public supervision of heavily polluting enterprises alone can significantly affect their carbon emission reduction strategies and promote the adoption of more environmentally friendly production methods. With the promotion of the carbon emissions reduction policy, government supervision and punishment can promote the emissions reduction from heavily polluting enterprises (Figure 11b–d. Heavy-polluting enterprises face unprecedented pressure owing to the current severe environmental background, forcing them to implement effective strategies to reduce emissions. Greater government oversight prevents these companies from ignoring their environmental responsibility, and they must follow stricter emission standards. From Figure 11e, it can be seen that an increase in government and public supervision and an increase in fines effectively promote the implementation and evolution of emission reduction measures for heavily polluting enterprise groups.
In summary, strengthening the supervision of the government and public can significantly promote the green transformation of heavy-polluting enterprises and promote social progress in the direction of sustainable development. The active participation in public supervision and the improvement in confidence form a positive interaction with the continuous strengthening of government supervision and jointly accelerate the pace of social green development.

4.2. Second Layer of Game Simulation Analysis

By analyzing four different situations, this study evaluated how to formulate carbon emission reduction strategies for heavily polluting enterprises under the influence of different regulatory environments and internal preferences. Situation 1 evaluated the impact of strict environmental regulations on the strategic choice of heavily polluting enterprises. The following parameters were assigned: R 14 = 120 , c 14 = 80 , R 15 = 120 , c 15 = 90 , R 31 = 8 , R 32 = 20 , c 31 = 10 , c 32 = 5 , R 25 = 1000 , c 24 = 500 , c 25 = 0 , R 26 = 80 , p 4 = 30 , p 5 = 50 , p 6 = 20 , E = 100 . The simulation results are shown in Figure 12a. Situation 2 evaluated the influence of the government’s strict environmental regulation on the strategic selection of heavily polluting enterprises and assigned x 2 as 0.2, 0.4, 0.6, or 0.8. The simulation results are shown in Figure 12b,c. Case 3 evaluated the influence of government subsidy on the strategic choice of heavily polluting enterprises, assigning E = 50, E = 100, E = 150, and E = 200. The results are shown in Figure 12d. Situation 4 evaluated how the preferences of heavily polluting enterprises affect their strategic decisions, assigning R 26 as 5, 19, 15, or 20. The simulation results are shown in Figure 12e.
As seen in Figure 12a, even if the lack of public oversight weakened external pressures, when the government implemented strict environmental regulations, heavy polluters still improved their environmental performance to avoid legal risks and maintain market competitive advantages. Figure 12b shows that the intensity of government environmental regulation accelerated the green transformation of heavily polluting enterprises and encouraged enterprises to actively improve their environmental performance to meet compliance requirements. This not only reduced the risk of non-compliance by enterprises but also created opportunities to obtain policy incentives such as green subsidies. This confirmed the role of environmental regulatory tools as leverage in balancing ecological protection and industrial development. Figure 12c shows that public restraint on firms increased the importance of firms on environmental performance. As seen in Figure 12d–e, the government’s green subsidies and environmental regulatory policies were the key factors in promoting the green transformation of heavily polluting enterprises, and the increase in green subsidies and external incentives accelerated the probability of heavily polluting enterprises preferring environmental performance, providing policy support and incentives for sustainable development.

4.3. Third-Layer Game Simulation Analysis

This study examined the influence of green innovation by heavily polluting enterprises on the stability of the system stability strategy using four different situations. Situation 1 evaluated the influence of green technology innovation by SMEs on the system stability strategy: R 31 = 300 , c 31 = 200 , R 32 = 500 , c 32 = 50 , R 41 = 550 , R 42 = 250 , c 41 = 150 , c 23 = 50 , R 23 = 400 ,   a n d   p 7 = 100 . The simulation results are shown in Figure 13a. Situation 2 evaluated the influence of the probability of green technological innovation from leading heavily polluting enterprises on the system stability strategy and x 3 was assigned as 0.2, 0.4, 0.6, and 0.8 to obtain the simulation results shown in Figure 13b,c. Situation 3 evaluated the influence of the benefits of green technological innovation on the system stability strategy. R 41 was assigned as 750, 650, 550, or 450, and the results are shown in Figure 13d. Situation 4 evaluated the influence of the spillover benefit of technological innovation in heavy-pollution-leading enterprises on the system stability strategy and assigned R 42 values of 50, 150, 250, or 350 for simulation analysis. The results are shown in Figure 13e.
As can be seen from Figure 13a, when leading heavily polluting enterprises and SMEs promote green technological innovation, society as a whole enters a positive cycle. Even in the absence of public supervision, this type of innovation drive can facilitate a green transition for the entire society. Leading heavily polluting enterprises’ promotion of green technology innovation will accelerate the promotion of SMEs’ green technology innovation (Figure 13b,c). This is because the former typically have a large market share and influence, and their positive green technological innovation actions can produce a strong demonstration effect. With the deepening of green technological innovation in leading enterprises, market demand for green products will gradually increase, which will further encourage SMEs to accelerate the pace of technological innovation. The market mechanism will play an important role in this process, promoting SMEs to implement green technological innovation through price signals and changes to adapt to market demand and improve their competitiveness. The active participation of SMEs in green technological innovation has positively impacted the promotion of green technological innovation in leading enterprises (Figure 13d). When leading heavily polluting enterprises implement green technological innovation, their spillover benefits encourage SMEs to obtain technological achievements through imitation to accelerate the green transformation of the entire industry (Figure 13e). SMEs will be more motivated to accelerate their own pace of green technological innovation, and continuous innovation and technological iteration will eventually promote a greener and more intelligent industry and contribute to the sustainable development of the entire society and environment.
In summary, the synergistic effect of heavily polluting leading enterprises and SMEs in green technological innovation promotes the progress of their respective technologies and drives the green transformation of the entire industry. The technological innovation of leading enterprises increases the demand for green products in the entire market and encourages SMEs to accelerate their technological innovation to adapt to market changes. Meanwhile, the active participation of SMEs promotes the innovation pace of leading enterprises. This two-way interaction forms a positive cycle, which promotes the green transformation of the entire industry through the price signal and demand changes in the market mechanism and provides an impetus for the sustainable development of society.

5. Conclusions and Discussions

5.1. Conclusions

From an evolutionary games perspective, this study systematically revealed the dynamic evolution law and mechanism of the green transformation of heavily polluting enterprises. The research findings were as follows: (1) The collaborative governance mechanism of government environmental regulation and public supervision significantly increased the cost of environmental violations for enterprises through the dual pressure of legal constraints and social reputation. Enterprises were forced to incorporate green transformation into their strategic decision-making framework. (2) With the tightening of environmental regulations and an increase in market access thresholds, heavily polluting enterprises, driven by the dual pressure of policy compliance and the risk of competitive elimination, gradually formed a transformation path centered on environmental performance improvement. (3) Leading enterprises in the industry gained a first-mover advantage through green technological research and development. Their innovative achievements formed a transmission chain of ‘research and development—demonstration—spillover’ through the technology diffusion network, driving SMEs to transition from passive compliance to active innovation, ultimately achieving a green upgrade of the entire industrial chain.
To effectively promote the green transformation of heavily polluting enterprises, the following suggestions are proposed: (1) The government should build an open information platform to enhance the interaction between public and environmental protection data. Moreover, the government should promote NGO and community organization participation in environmental supervision through incentive measures and resource allocation. (2) The government should regularly assess green subsidy policies to ensure precise support for enterprises undergoing green transformation and strengthen the enforcement of environmental regulations. Enterprises should be encouraged to comply with environmental protection norms through reward and punishment mechanisms, while cross-departmental collaboration is necessary to ensure policy consistency. (3) The government should accelerate the innovation and popularisation of green technologies through fiscal incentive mechanisms, such as establishing a green technology innovation fund. This will support the research and development investment of leading enterprises in the environmental protection technology field and promote their cooperation with academic institutions. (4) The government should encourage leading enterprises to share their successful experiences of green transformation. Through industry exchanges and case sharing, this will inspire other enterprises in the sector to emulate these practices and collaboratively advance the transformation of the broader socio-economic system toward sustainable development.

5.2. Discussions

This study provides a novel theoretical framework for the driving mechanism of the green transformation of heavily polluting enterprises from a multi-agent game perspective. The research conclusion indicated that the joint supervision of the government and the public constructed a dual-driven mechanism of “policy constraints—social reputation”. Increasing the economic cost to enterprises for environmental violations effectively promoted them to incorporate green transformation into their core strategy. These results expanded previous studies which emphasized the role of a single policy tool. Furthermore, the “research and development—spillover” effect of green technology from leading enterprises verified the feasibility of collaborative innovation in the industrial chain. The transmission pathway from “policy-driven” to “leading enterprises pioneering and SMEs replicating” was revealed, representing a relative to the existing research paradigm that focuses on the behavior of individual enterprises.
Although this study provides valuable insights, few limitations exist. First, although the numerical simulation method provided the basic framework for subsequent research, owing to the privacy protection requirements of environmental protection data in enterprises, the scope and depth of the current data collection were limited. Future studies should mine available data to explore the behavioral patterns of enterprise-level environments comprehensively. Second, the parameter settings of the existing models focus on the common characteristics of the entire industry and do not fully incorporate differentiated variables, such as the heterogeneity of enterprise scale and the diversity of technological reserves. Future research must construct an analysis system that integrates multi-dimensional heterogeneous parameters to enhance the model’s explanatory power for micro-level subjects.

Author Contributions

Conceptualization, M.W. and Y.Z.; methodology, M.W.; software, M.W.; validation, B.S.; formal analysis, M.W.; investigation, B.S.; resources, M.W.; data curation, B.S.; writing—original draft preparation, M.W.; writing—review and editing, Y.Z.; visualization, B.S.; supervision, B.S.; project administration, B.S.; funding acquisition, B.S. All authors have read and agreed to the published version of the manuscript.

Funding

This research was funded by the National Natural Science Foundation of China (72072054).

Institutional Review Board Statement

Not applicable.

Informed Consent Statement

Not applicable.

Data Availability Statement

No new data were created or analyzed in this study.

Conflicts of Interest

The authors declare no conflicts of interest.

Abbreviations

The following abbreviations are used in this manuscript:
GTIGreen Technology Innovation
SMEsSmall and medium-sized enterprises

References

  1. Zhao, X.; Ma, X.; Chen, B.; Shang, Y.; Song, M. Challenges toward carbon neutrality in China: Strategies and countermeasures. Resour. Conserv. Recycl. 2022, 176, 105959. [Google Scholar] [CrossRef]
  2. Chen, L.; Msigwa, G.; Yang, M.; Osman, A.I.; Fawzy, S.; Rooney, D.W.; Yap, P.S. Strategies to achieve a carbon neutral society: A review. Environ. Chem. Lett. 2022, 20, 2277–2310. [Google Scholar] [CrossRef] [PubMed]
  3. Zou, C.; Xue, H.; Xiong, B.; Zhang, G.; Pan, S.; Jia, C.; Lin, M. Connotation, innovation and vision of “carbon neutrality”. Nat. Gas Ind. B 2021, 8, 523–537. [Google Scholar] [CrossRef]
  4. Wu, Z.; Huang, X.; Chen, R.; Mao, X.; Qi, X. The United States and China on the paths and policies to carbon neutrality. J. Environ. Manag. 2022, 320, 115785. [Google Scholar] [CrossRef]
  5. Zou, C.; Wu, S.; Yang, Z.; PAN, S.; Wang, G.; Guan, M.; Shen, Y. Progress, challenge and significance of building a carbon industry system in the context of carbon neutrality strategy. Pet. Explor. Dev. 2023, 50, 210–228. [Google Scholar] [CrossRef]
  6. Lin, Z.; Liang, D.; Li, S. Environmental regulation and green technology innovation: Evidence from China’s heavily polluting companies. Sustainability 2022, 14, 12180. [Google Scholar] [CrossRef]
  7. Liang, L.; Yao, Z. Research on the effect of environmental strategy on green transformation of enterprises. Sci. J. Econ. Manag. Res. 2021, 3, 176–188. [Google Scholar]
  8. Li, R.; Chen, Y. The influence of a green credit policy on the transformation and upgrading of heavily polluting enterprises: A diversification perspective. Econ. Anal. Policy 2022, 74, 539–552. [Google Scholar] [CrossRef]
  9. Tian, C.; Li, X.; Zhu, B. Exploring the impact of green credit policy on green transformation of heavy polluting industries. J. Clean. Prod. 2022, 335, 130257. [Google Scholar] [CrossRef]
  10. Lu, Y.; Gao, Y.; Zhang, Y.; Wang, J. Can the green finance policy force the green transformation of high-polluting enterprises? A quasi-natural experiment based on “Green Credit Guidelines”. Energy Econ. 2022, 114, 106265. [Google Scholar] [CrossRef]
  11. Zhao, L.; Wang, D.; Wang, X.; Zhang, Z. Impact of green finance on total factor productivity of heavily polluting enterprises: Evidence from green finance reform and innovation pilot zone. Econ. Anal. Policy 2023, 79, 765–785. [Google Scholar] [CrossRef]
  12. Zhao, Y.; Huang, Y.; Hu, S.; Sun, J. How tripartite stakeholders promote green technology innovation of China’s heavily polluting enterprises? Sustainability 2023, 15, 9650. [Google Scholar] [CrossRef]
  13. Cai, X.; Zhu, B.; Zhang, H.; Li, L.; Xie, M. Can direct environmental regulation promote green technology innovation in heavily polluting industries? Evidence from Chinese listed companies. Sci. Total Environ. 2020, 746, 140810. [Google Scholar] [CrossRef]
  14. Lin, B.; Pan, T. The impact of green credit on green transformation of heavily polluting enterprises: Reverse forcing or forward pushing? Energy Policy 2024, 184, 113901. [Google Scholar] [CrossRef]
  15. Fatima, T.; Li, B.; Malik, S.A.; Zhang, D. The spatial effect of industrial intelligence on high-quality green development of industry under environmental regulations and low carbon intensity. Sustainability 2023, 15, 1903. [Google Scholar] [CrossRef]
  16. Hao, X.; Li, Y.; Wang, K.; Sun, Q.; Wu, H. Eco-intelligent production: Intelligent manufacturing and industrial green transition. Environ. Dev. Sustain. 2025, 1, 1–31. [Google Scholar] [CrossRef]
  17. Wang, A.; Luo, K.; Nie, Y. Can artificial intelligence improve enterprise environmental performance: Evidence from China. J. Environ. Manag. 2024, 370, 123079. [Google Scholar] [CrossRef]
  18. Huang, Y.; Bai, F.; Shang, M.; Liang, B. Catalyst or stumbling block: Do green finance policies affect digital transformation of heavily polluting enterprises? Environ. Sci. Pollut. Res. 2023, 30, 89036–89048. [Google Scholar] [CrossRef]
  19. Kugele, A.S.H.; Sarkar, B. Reducing carbon emissions of a multi-stage smart production for biofuel towards sustainable development. Alex. Eng. J. 2023, 70, 93–113. [Google Scholar] [CrossRef]
  20. Xu, Y.; Yang, C.; Ge, W.; Liu, G.; Yang, X.; Ran, Q. Can industrial intelligence promote green transformation? New insights from heavily polluting listed enterprises in China. J. Clean. Prod. 2023, 421, 138550. [Google Scholar] [CrossRef]
  21. Shen, Y.; Yang, Z. Chasing green: The synergistic effect of industrial intelligence on pollution control and carbon reduction and its mechanisms. Sustainability 2023, 15, 6401. [Google Scholar] [CrossRef]
  22. Shen, Y.; Zhang, X. Intelligent manufacturing, green technological innovation and environmental pollution. J. Innov. Knowl. 2023, 8, 100384. [Google Scholar] [CrossRef]
  23. Li, Z.; Liu, W.; Hu, M.; Niu, W. Industrial intelligence and enterprise pollution reduction: Empirical evidence from chinese pollution enterprises. Environ. Eng. Manag. J. 2024, 23, p2287. [Google Scholar]
  24. Wu, Y.; Hu, J.; Irfan, M.; Hu, M. Vertical decentralization, environmental regulation, and enterprise pollution: An evolutionary game analysis. J. Environ. Manag. 2024, 349, 119449. [Google Scholar] [CrossRef] [PubMed]
  25. Xu, R.; Wang, Y.; Wang, W.; Ding, Y. Evolutionary game analysis for third-party governance of environmental pollution. J. Ambient. Intell. Humaniz. Comput. 2019, 10, 3143–3154. [Google Scholar] [CrossRef]
  26. Cao, W.; Yu, J. Evolutionary game analysis of factors influencing green innovation in Enterprises under environmental governance constraints. Environ. Res. 2024, 248, 118095. [Google Scholar] [CrossRef]
  27. Wei, J.; Li, Y.; Liu, Y. Tripartite evolutionary game analysis of carbon emission reduction behavior strategies under government regulation. Environ. Dev. Sustain. 2024, 27, 1–33. [Google Scholar] [CrossRef]
  28. Lv, Y.; Wan, L.; Zhang, N.; Wang, Z.; Tian, Y.; Ye, W. Research on the Green Transition Path of Airport Development under the Mechanism of Tripartite Evolutionary Game Model. Sustainability 2024, 16, 8074. [Google Scholar] [CrossRef]
  29. Li, Y.; Zhu, Y. Analysis of the Tripartite Evolutionary Game Among Third-Party Verification Agencies, Emission Control Enterprises, and Government Driven by Carbon Trading-the Case of Beijing Carbon Market. SSRN, 2024; in press. [Google Scholar]
  30. Friedman, D. Evolutionary games in economics. Econometrica 1991, 59, 637–666. [Google Scholar] [CrossRef]
  31. Friedman, D. On economic applications of evolutionary game theory. J. Evol. Econ. 1998, 81, 15–43. [Google Scholar] [CrossRef]
  32. Sastry, S.; Sastry, S. Lyapunov stability theory. In Nonlinear Systems: Analysis, Stability, and Control; Springer: New York, NY, USA, 1999; pp. 182–234. [Google Scholar]
  33. Parks, P.C. AM Lyapunov’s stability theory—100 years on. IMA J. Math. Control Inf. 1992, 9, 275–303. [Google Scholar] [CrossRef]
Figure 1. Technical Roadmap.
Sustainability 17 04053 g001
Figure 2. The evolutionary trend of the government strategy.
Sustainability 17 04053 g002
Figure 3. Strategy evolution trend diagram of heavy pollution enterprise groups.
Sustainability 17 04053 g003
Figure 4. The evolutionary trend diagram of the mass strategy.
Sustainability 17 04053 g004
Figure 5. The phase diagram of government strategy evolution.
Sustainability 17 04053 g005
Figure 6. Strategy evolution phase diagram of heavily polluting enterprises.
Sustainability 17 04053 g006
Figure 7. The evolutionary trend diagram of the public strategy.
Sustainability 17 04053 g007
Figure 8. The evolutionary trend diagram of the public strategy.
Sustainability 17 04053 g008
Figure 9. Strategy evolution trend diagram of leading heavy pollution enterprises.
Sustainability 17 04053 g009
Figure 10. Strategy evolution phase diagram of heavily polluting SMEs.
Sustainability 17 04053 g010
Figure 11. First-layer 1 game simulation results diagram.
Sustainability 17 04053 g011
Figure 12. Layer A2 game simulation results diagram.
Sustainability 17 04053 g012aSustainability 17 04053 g012b
Figure 13. Simulation results of the third layer game.
Sustainability 17 04053 g013
Table 1. Description of variables.
VariableDefinition
c11The costs of strict government regulation
c12The government does not supervise the indirect costs
c14The cost of strict government regulation of the environment
c15The cost of the government not regulating the environment
c21The cost of reducing emissions in heavily polluting enterprise groups
c22The cost of heavily polluting enterprises not reducing emissions
c23The cost of leading heavy pollution enterprises in green technology innovation needs
c24The cost of heavily polluting enterprises to favor environmental performance
c31The cost of supervision by the public
c32The cost of no supervision by the public
c41The cost of green technology innovation needed for heavily polluting small and medium-sized enterprises
R11The government strictly regulates the gains made
R12The benefits the government obtains from lax regulation.
R14The benefits to the government from implementing strict environmental regulations
R15Loose environmental regulation benefits
R21Income from emission reduction from heavily polluting enterprises
R22Income of heavily polluting enterprises without emission reduction
R23Leading heavy pollution enterprises profiting from green technology innovation
R25Heavily polluting enterprises that prioritise environmental performance will benefit economically
R26Prioritizing the economic benefits of financial performance
R31Gain obtained by public supervision
R32Public does not monitor the gains obtained
R41Benefits to heavily polluting small and medium-sized enterprises from green technology innovation
R42Spillover benefits from technological innovation
p1Under strict government supervision, heavily polluting enterprises that fail to reduce emissions will incur fines
p2If the public finds that the enterprise does not reduce emissions under active supervision, the enterprise will be reported and fined
p3If the public finds that the enterprise does not reduce emissions under active supervision, the enterprise will be reported, and the corresponding people will be rewarded
p4The cost of violating government environmental regulations in heavily polluting enterprises
p5The reputation loss caused by heavy pollution enterprises’ negative response to government environmental regulation
p6Compensation to the public for the pollution by heavily polluting enterprises
p7Subsidies for green technology innovation for enterprises
EEcological benefits of heavily polluting enterprises
Table 2. Payoff matrix of the first layer game.
GovernmentHeavy Pollution EnterprisesThe Public
Supervised ( z 1 )Do Not Supervise ( 1 z 1 )
Actively supervise ( x 1 )Actively reduce emissions ( y 1 ) R 11 c 11
R 21 c 21
R 31 c 31
R 11 c 11
R 21 c 21
R 32 c 32
Negative emission reduction of ( 1 y 1 ) R 11 c 11 + p 1
R 22 c 22 p 1 p 2
R 31 c 31 + p 3
R 11 c 11 + p 1
R 22 c 22 p 1
R 32 c 32
Negative supervision of the person ( 1 x 1 )Actively reduce emissions ( y 1 ) R 12 c 12
R 21 c 21
R 31 c 31
R 12 c 12
R 21 c 21
R 32 c 32
Negative emission reduction of ( 1 y 1 ) R 12 c 12
R 22 c 22 p 2
R 31 c 31 + p 3
R 12 c 12
R 22 c 22
R 32 c 32
Table 3. Analysis of equilibrium point stability in the first game layer.
EquationEigenvalue λStability
E 11 ( 0 , 0 , 0 ) c 12 c 11 + p 1 + R 11 R 12 Instability
0
R 31 c 31 R 32 + c 32 + p 3
E 12 ( 0 , 0 , 1 ) R 11 c 11 R 12 + c 12 + p 1 Instability
p 2
c 31 c 32 p 3 R 31 + R 32
E 13 ( 0 , 1 , 0 ) R 11 c 11 R 12 + c 12 Instability
0
R 31 c 31 R 32 + c 32
E 14 ( 0 , 1 , 1 ) R 11 c 11 R 12 + c 12 Possibly a stable point
p 2
( R 31 c 31 R 32 + c 32 )
E 15 ( 1 , 0 , 0 ) ( R 11 c 11 R 12 + c 12 + p 1 ) Instability
p 1
R 31 c 31 R 32 + c 32 + p 3
E 16 ( 1 , 1 , 0 ) ( R 11 c 11 R 12 + c 12 ) Possibly a stable point
p 1
( R 31 c 31 R 32 + c 32 )
E 17 ( 1 , 0 , 1 ) ( R 11 c 11 R 12 + c 12 + p 1 ) Indeterminacy
( R 21 c 21 R 22 + c 22 + p 1 + p 2 )
( R 31 c 31 R 32 + c 32 + p 3 )
E 18 ( 1 , 1 , 1 ) ( R 11 c 11 R 12 + c 12 ) Indeterminacy
( R 21 c 21 R 22 + c 22 + p 1 + p 2 )
( R 31 c 31 R 32 + c 32 )
Table 4. The payoff matrix of the second layer game.
GovernmentHeavy Pollution EnterprisesThe Public
Supervised ( z 2 )Do Not Supervise ( 1 z 2 )
Implement strict environmental regulations ( x 2 )Preference for environmental performance ( y 2 ) R 14 c 14
E + R 25 c 25
R 31 c 31
R 14 c 14
E + R 25 c 25
R 32 c 32
Preference for financial performance ( 1 y 2 ) R 14 c 14 + p 4
R 26 p 5 p 6
R 31 c 31 + p 6
R 14 c 14
R 26 p 5
R 32 c 32
Implement loose environmental regulation ( 1 x 2 )Preference for environmental performance ( y 2 ) R 15 c 15
E + R 25 c 25
R 31 c 31
R 15 c 15
E + R 25 c 25
R 32 c 32
Preference for financial performance ( 1 y 2 ) R 15 c 15
R 26 p 6
R 31 c 31 + p 6
R 15 c 15
R 26
R 32 c 32
Table 5. Analysis of the equilibrium point stability in the second layer of the game.
EquationEigenvalue λStability
E 21 ( 0 , 0 , 0 ) c 15 c 14 + R 14 R 15 Possible stability
E + R 25 c 25 R 26
R 31 c 31 R 32 + c 32 + p 6
E 22 ( 0 , 0 , 1 ) c 15 c 14 + R 14 R 15 + p 4 Instability
E + R 25 c 25 R 26 + p 6
( R 31 c 31 R 32 + c 32 + p 6 )
E 23 ( 0 , 1 , 0 ) c 15 c 14 + R 14 R 15 Instability
( E + R 25 c 25 R 26 )
R 31 c 31 R 32 + c 32
E 24 ( 0 , 1 , 1 ) c 15 c 14 + R 14 R 15 Instability
( E + R 25 c 25 R 26 + p 6 )
( R 31 c 31 R 32 + c 32 )
E 25 ( 1 , 0 , 0 ) c 14 c 15 R 14 + R 15 Possible steady point
E + R 25 c 25 R 26 + p 5
R 31 c 31 R 32 + c 32 + p 6
E 26 ( 1 , 1 , 0 ) c 14 c 15 R 14 + R 15 Possible stable point
( E + R 25 c 25 R 26 + p 5 )
R 31 c 31 R 32 + c 32
E 27 ( 1 , 0 , 1 ) c 14 c 15 R 14 + R 15 p 4 Instability
E + R 25 c 25 R 26 + p 5 + p 6
( R 31 c 31 R 32 + c 32 + p 6 )
E 28 ( 1 , 1 , 1 ) c 14 c 15 R 14 + R 15 Instability
( E + R 25 c 25 R 26 + p 5 + p 6 )
( R 31 c 31 R 32 + c 32 )
Table 6. The payoff matrix of the third layer game.
Heavy Pollution of the Leading EnterprisesSmall and Medium-Sized and Heavily Polluting EnterprisesThe Public
Supervised ( z 3 )Do Not Supervise ( 1 z 3 )
Make green technology innovation ( x 3 )Green innovation( y 3 ) R 23 c 23 + p 7
R 41 c 41 + p 7
R 31 c 31
R 23 c 23
R 41 c 41
R 32 c 32
Do not innovate ( 1 y 3 ) R 23 c 23 + p 7
R 42
R 31 c 31
R 23 c 23
R 42
R 32 c 32
Implement loose environmental regulation ( 1 x 3 )Green innovation( y 3 ) 0
R 41 c 41 + p 7
R 31 c 31
0
R 41 c 41
R 32 c 32
Do not innovate ( 1 y 3 ) 0
0
R 31 c 31 + p 6
0
0
R 32 c 32
Table 7. Stability analysis of a single game agent.
ConditionMathematical ExpressionsStability Point
Stability base conditions F 321 z 3 = 0 ,   d F 321 ( z 3 ) d z 3 < 0
Copy the derivative of the dynamic equation d F 321 ( z 3 ) d z 3 = ( 1 2 z 3 ) ( ( R 31 c 31 R 32 + c 32 ) + ( 1 x 3 ) ( 1 y 3 ) p 6 )
( R 31 c 31 R 32 + c 32 ) > 0 y 3 > y 3 F 321 ( z 3 ) = 0   and   d F 321 ( z 3 ) d z 3 < 0 z 3 = 0
y 3 < y 3 F 321 ( z 3 ) = 0   and   d F 321 ( z 3 ) d z 3 < 0 z 3 = 1
( R 31 c 31 R 32 + c 32 ) < 0 y 3 > y 3 F 321 ( z 3 ) = 0   and   d F 321 ( z 3 ) d z 3 < 0 z 3 = 1
y 3 < y 3 F 321 ( z 3 ) = 1   and   d F 321 ( z 3 ) d z 3 < 0 z 3 = 0
Table 8. Analysis of equilibrium point stability in the third layer game.
EquationEigenvalue λStability
E 31 ( 0 , 0 , 0 ) R 23 c 23 Possible steady point
R 41 c 41
R 31 c 31 R 32 + c 32
E 32 ( 0 , 0 , 1 ) R 23 c 23 + p 7 Instability
R 41 c 41 + p 7
( R 31 c 31 R 32 + c 32 )
E 33 ( 0 , 1 , 0 ) R 23 c 23 Possible steady point
( R 41 c 41 )
2 ( R 31 c 31 R 32 + c 32 )
E 34 ( 0 , 1 , 1 ) R 23 c 23 + p 7 Instability
( R 41 c 41 + p 7 )
2 ( R 31 c 31 R 32 + c 32 )
E 35 ( 1 , 0 , 0 ) ( R 23 c 23 ) Unclear
R 41 c 41 R 42
0
E 36 ( 1 , 1 , 0 ) c 23 R 23 Possible steady point
( R 41 c 41 R 42 )
R 31 c 31 R 32 + c 32
E 37 ( 1 , 0 , 1 ) ( R 23 c 23 + p 7 ) Unclear
R 41 c 41 + p 7 R 42
0
E 38 ( 1 , 1 , 1 ) ( R 23 c 23 + p 7 ) Instability
( R 41 c 41 + p 3 R 42 )
( R 31 c 31 R 32 + c 32 )
Disclaimer/Publisher’s Note: The statements, opinions and data contained in all publications are solely those of the individual author(s) and contributor(s) and not of MDPI and/or the editor(s). MDPI and/or the editor(s) disclaim responsibility for any injury to people or property resulting from any ideas, methods, instructions or products referred to in the content.

