Abstract
Urban parks are essential for enhancing public health and environmental sustainability, as they reduce urban heat, improve air quality, and provide spaces for physical activity. Inequalities in park allocation, however, lead to access discrepancies, disproportionately impacting populations already struggling socially. The spatial disparity between park supply and demand in Busan, South Korea, is examined in this study through a quantitative approach incorporating socio-economic indicators and GIS(Geographic Information System)-based analysis. First, we divided Busan into 100 m × 100 m grid cells and applied a modified Huff model, setting a kind of distance-decay exponent β, to estimate park supply against baseline demand (the planning standard of 6 m2 per person), and overlaid a composite need index of six socio-economic indicators to pinpoint underserved areas. Our first stage grid-based arithmetic analysis revealed that 100 of Busan’s 205 communities are undersupplied. Given a composite need index of six socio-economic indicators, sixty-two cells remained imbalanced, and we finally identified the ten communities with the highest need for targeted park provision. The findings indicate that Busan’s park planning policies, aimed at enhancing per capita green space, do not adequately address localized disparities. Accordingly, as opposed to a uniform expansion plan, this study stresses the importance of prioritizing park provision according to community-specific needs. These results suggest that policymakers could enhance public health outcomes and advance social equity by considering socio-economic vulnerabilities when planning cities. Specifically, this research highlights the significance of including environmental justice in urban sustainability frameworks and gives actionable ideas for fair park allocation.
1. Introduction
The presence of parks not only offers notable environmental advantages to urban residents, including the mitigation of the heat island effect, the enhancement of air quality, and the preservation of water resources but also has a substantial impact on the mental and physical health of individual citizens and public health through the provision of an ideal setting for physical activity [1,2,3,4]. In other words, urban parks confer numerous advantages to our society regarding public health and the environment by alleviating citizens’ stress and enhancing air quality [5,6]. In addition to the benefits of mental health improvement, Joye [7] and Kellert et al. [8] contend that urban greening has the potential to alleviate stress simply under its appearance. In terms of physical activity, parks in cities can serve as open spaces, thereby providing residents with an increased number of opportunities to engage in physical activity within the city [9,10]. In particular, obesity has emerged as a serious health concern in developed countries in recent years, and parks play a key role in alleviating the obesity issue by providing more opportunities for physical activity [1,11]. As a result of these numerous benefits, urban parks are becoming a more prominent focus in the public policy domains of public health and urban planning [12,13].
Recent studies have pointed out that uneven park distributions across communities have been associated with certain ethnicities and socio-economic groups [14,15], and such disparities are affected by a broader social context that helps marginalized communities face systemic disadvantages in access to environmental benefits. Schlosberg [16] provides a political framework to identify and understand the current environmental and social issues based on his description of how certain racial or socially vulnerable people encounter distributional, procedural, and recognitional environmental injustice. Boone et al. [17], Bullard [18], and Bullard and Wright [19] assert that certain racial groups have been denied environmental benefits as a result of unconscious social or institutional discrimination. From a more pragmatic standpoint, Mandarano and Meenar [20] and Park [21] contend that market-friendly policies are responsible for the unequal distribution of parks and street trees, which have positive environmental effects. Notably, they emphasize the current institutional constraint that the distribution of parks or urban greening is inextricably linked to community capacity, irrespective of who implements the projects. On the other hand, a growing body of literature has highlighted the disparity between the supply and demand for parks in urban communities, emphasizing that achieving a balance among their characteristics is crucial for developing an effective park system in cities [22,23,24]. Instead of emphasizing social equity or definition, these studies emphasize the distributional discrepancy between the demand for parks by individual citizens or communities and the supply of park space. Park et al. [23] indicated the disparity between the supply and demand of parks in Seoul, South Korea, by quantifying the supply and demand of parks and contrasting the two by developing corresponding indices. Furthermore, Kim et al. [22] and Kabish et al. [24] noted the demand–supply mismatch in parks and quantified the supply and demand of parks and their accessibility by measuring park areas.
Quantitative research addressing the geographical mismatch between supply and demand in parks should also be conducted from the standpoint of social or environmental definition. Similar to how socio-economic factors influence park distribution [1,11,25], access to food, which is substantially associated with physical health, is not uniformly distributed across communities. Ball et al. [26] and Li et al. [27] highlight the spatial gap between food retailers and food diversity, indicating that the availability of nutritious foods significantly correlates with the socio-economic status of communities. They revealed that socio-economically advantaged communities had better access to health food stores. Furthermore, Sturm and An [28] showed that restricting the availability of nutritious food can contribute to a rise in obesity rates. These results indicate that communities experiencing social vulnerability encounter increased limitations in accessing parks and healthy food, potentially leading to heightened health concerns associated with obesity. Given that the location and accessibility of parks significantly contribute to public health [1,2,4,26], these results suggest that the examination of park supply and demand requires a more profound inquiry from the definitional standpoint.
Busan Metropolitan City is the second largest city in South Korea, characterized by its mountainous landscape and relatively hilly topography, which hinders development. Most natural green areas and urban parks are located in mountainous communities; however, the topographical features present challenges for citizens attempting to easily access parks and green areas due to densely developed urban communities. This has resulted in an inadequate number of parks that can be utilized daily, and the development of parks in urbanized communities continues to be a critical undertaking for Busan’s sustainability goal [29]. Furthermore, the urbanization of Busan has advanced expeditiously since 1980, resulting in a persistent decline in agricultural land and green areas, which is anticipated to persist until 2040 [12]. To this end, the Busan city government has taken up the goal of improving the rate of green coverage of the city community from 9.8% to 15%. Secondly, it aims at enhancing the rate of per capita area of the park to 21.3 m2 as outlined in the 2030 Busan Master Plan for Parks and Greenbelts as well as in the 2040 Master Plan for Busan Metropolitan City. Furthermore, the 2030 Busan Master Plan for Parks and Greenbelts seeks to expand the number of small parks within urban communities to improve accessibility to parks within a five-minute walk. Although the city government has been striving to expand the parkland in urban centers, Busan is confronted with the limited available space for developing new parks [12]. It is anticipated that some districts will lose green areas while others will gain an increase [12,29]. This differential effect on green space availability exacerbates a pre-existing issue in the Busan park system. Research indicates that the supply of parks in Busan has become unbalanced due to a supply-driven policy that created a discordance between park supply and user demand [30,31].
The primary aim of this study is to carefully assess the communities in Busan, South Korea, that are facing a supply–demand mismatch for parks and to identify places that should be prioritized for park provision. In the context where both the practical challenges of park development and the theoretical need for the correlation of distributional mismatches and socio-economic characteristics are highlighted, a research gap is identified: the necessity of examining supply–demand mismatches in conjunction with socio-economic considerations in a fast-urbanizing Busan metropolitan city, where constraints are particularly acute. This study will elucidate the distribution of parks within the city and furnish data regarding policy efficacy by explicitly demonstrating the correlation between the supply–demand mismatch of parks and particular city communities. Furthermore, this study will provide practical and actionable evidence that can be used to develop public policies that are more equitable and just by taking into account the socio-economic characteristics of citizens and the distribution of urban parks. In particular, this research, which was conducted within the regional context of Busan, has the potential to inform the development of policy priorities that will optimize the environmental and public health functions of parks in densely populated and urbanized communities.
The following sections first contextualize Busan’s contradictory planning background for urban parks, then detail the spatial datasets compiled for both the supply and demand of urban parks. The methods section illustrates the grid-based Huff-model methodology and overlaying analysis flow to quantify the mismatch between urban park supply and community needs. Results are presented in the form of two-stage maps and a table and illustrate both the arithmetic and socio-economic need-weighted gaps. The discussion interprets such findings in equity and public health terms and translates them into actionable recommendations for the 2030 and 2040 master plans of the city. Finally, the paper ends with an outline of the methodological limitations and recommendations for future research avenues.
2. Materials and Methods
2.1. Contradictory Planning Background in Busan
Busan Metropolitan City is bounded by longitudes 128°45′ E and 129°18′ E and latitudes 34°53′ N and 35°23′ N and encompasses approximately 770 km2 of urban and forested mountainous terrain. Major cities lying within the same latitudinal band include Zhengzhou (34°45′50″ N) and Xi’an (34°15′40″ N) in China, as well as Osaka (34.67° N) and Kyoto (35°01′ N) in Japan. The annual average temperature is 15.2 degrees Celsius and has risen by approximately 0.3 degrees Celsius every decade since the 2010s. Temperatures range from a low of minus 8.8 degrees Celsius to a high of 34.8 degrees Celsius. Gentle slopes with an inclination of 10 degrees or less, which are easy to develop, account for about 46.1 percent of the total land area, and roughly 35 percent of the land within the city boundary is forest designated as green belt.
The two Busan planning documents concerning urban parks and green space embody an ambitious aspiration of sustainability. However, the content of the planning conveys a contradiction between urban park expansion in urbanized zones and simultaneous policies that allow for greenbelt concurrent policies that facilitate greenbelt reduction and prioritize development over preservation of green areas [12]. The 2040 Master Plan for Busan Metropolitan City commits to eco-friendly land use, green infrastructure, green areas, and other measures to mitigate heat-related health risks and flooding, but the plan overlooks the past trend in which actual forest cover has declined and greenbelt restrictions are being relaxed [12]. Similarly, the 2030 Busan Master Plan for Parks and Greenbelts sets targets for increased green coverage, per capita park area, and five-minute walking access to urban parks, but it simultaneously authorizes greenbelt de-designation for development zones without securing equivalent conservation gains [12]. This tension around urban parks and green areas underscores the challenge of aligning development imperatives with the preservation of urban parks and green areas that underpin long-term sustainability and public health. Table 1 summarizes this planning background.

Table 1.
Planning Background of Busan.
2.2. Materials
The purpose of this study is to quantify the distribution of parks in Busan and analyze the demand and supply accordingly. In exploring the supply side, we created a spatial dataset of parks. In order to build a dataset of open spaces that citizens actually recognize and use as parks, we utilized spatial data of parks regulated by the Act on Urban Parks and Green Areas and the National Land Planning and Utilization Act in Korea. Urban Parks data were collected primarily from the Public Data Portal [32], an official data source provided by the Ministry of the Interior and Safety, and a spatial dataset of 713 urban parks was organized. However, since these data are built as point layers, the point data of urban parks were converted into polygons by overlaying the cadastral GIS (Geographic Information System) database provided by the Ministry of Land, Infrastructure and Transport [33]. Additionally, during this overlaying process, we identified parks that were missing from the Public Data Portal and added those 1152 additional parks to our dataset [32]. As a result, a total of 1865 parks were organized as spatial data, as shown in the following map (Figure 1).
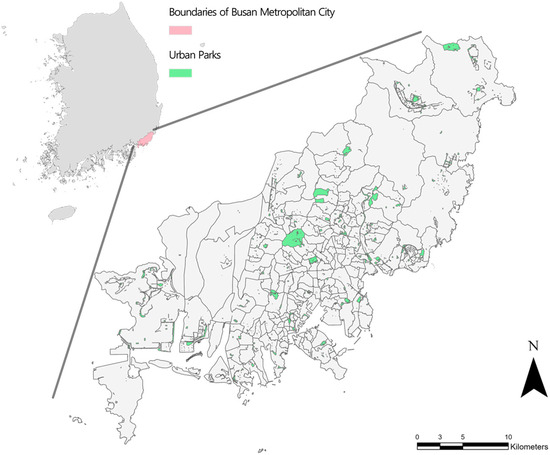
Figure 1.
Boundaries of Busan Metropolitan City and Distribution of Urban Parks.
To construct the dataset necessary for investigating demand aspects, we aggregated data on the population who live below the poverty level, the proportion of elderly and children, the number of workers, business density, and the average building age that are provided by Statistics Korea [34]. In examining population size in urban space, this study utilized living population data rather than the resident registration population data that Statistics Korea provides. We obtained these data from KT Corporation which is the third-largest mobile and internet service provider. These living population data are produced by merging public big data from the Busan metropolitan government with telecommunication data, especially mobile phone usage, from KT Corporation. These data can provide a snapshot of the active population within a given space, which as a result enables a more precise estimation of the population.
2.3. Methods
Given the study’s focus on the spatial mismatch between park supply and demand, this study broke down the study area into smaller and uniform units, and organized 100 m × 100 m grids. Each grid cell serves as the unit of analysis. Rather than using administrative districts, such as community or county scales, this more fine-scale approach allows for a more detailed and precise investigation of the supply–demand mismatch of urban parks. As the distance to urban parks is calculated in this analysis, the grid-based system helps avoid the potential bias introduced in distance calculation that stems from the arbitrary boundaries of administrative districts, and thereby identifies underserved areas more accurately. The grid system created a total of 81,297 cells.
2.3.1. Supply Estimation Through Huff Model
Based on the grid system, we estimated the supply of urban parks using the Huff model. The supply is calculated as the park usable area in each cell. The park usable area is calculated through the Huff model, which considers the distance from parks to analysis units, the area of urban parks around the cell, and a parameter that controls the decay in likelihood based on distance. The model is a kind of spatial interaction model proposed by Huff to analyze the usage behavior of consumers in stores and shopping malls [35]. The Huff model was designed to calculate the probability that consumers will visit a specific store or facility by reflecting the attractiveness and distance-decay effect of the facility. The early Huff model used factors such as store size, sales, and brand awareness as indicators of attractiveness, and introduced the concept that the probability of consumers’ usage decreases according to the spatial distance from the facility. In particular, by including the distance-decay coefficient (β), which indicates that the probability of visiting decreases as the distance increases, it was possible to quantitatively analyze the effect of consumers’ accessibility on usage behavior [35,36,37].
In addition to applications on business geography, the Huff model has been widely utilized in the analysis of numerous urban facility locations, such as park and ride catchment areas and bicycle parking facilities [38,39,40]. To be specific, the study of Im [41] suggests a modified model to estimate the supply quantity of neighborhood park service provision as follows.
is the outcome of the Huff model. It represents the park’s usable area in the cell for the park . is the area of the park . is the distance from the cell to the surrounding parks. is the exponent applied to the distance, where a higher value means a stronger reduction in probability as distance increases (i.e., the further the park is, the lower the probability of use). values typically range between 1.0 and 2.0. Consistent with Wang [42], we adopt a distance-decay exponent of β = 2.0. This is because distance exerts a stronger influence than park size when residents select everyday amenities such as parks [42]. In other words, this modified Huff model sets the area of the park and the distance between the park and the demand point as the main variables, instead of utilizing the traditional ‘attractiveness’ factor which is one of the core concepts in Huff’s [36,37] original model. The Huff model applied in this study is defined so that the supply of the park is inversely proportional to the distance from the demand point, the centroid of a 100 m × 100 m cell, which reflects the fact that the spatial services provided by the park are distributed based on distance [41]. In other words, the larger the area of the park, the more services are provided, and conversely, the farther the distance between the park and the demand point, the less supply is allocated to the point. This approach is useful for spatially interpreting the supply of parks, and allows the service level of the park to be measured by considering the park area as the supply quantity and the effect of decreasing service use according to distance, rather than the simple concept of distance [41].
2.3.2. Demand Estimation Through Spatial Overlay
After completing the first layer, which measures the actual supply of parks using the Huff model and integrates it into Busan’s grid system, the second layer is created by calculating the basic demand for urban parks with consideration of the population and the planned park area (6 m2 per person) based on Busan’s living population data and inputting it into the grid system. The gap between the supply and demand for parks in a mathematical form of area can be calculated by overlaying these two layers. This resulting gap shows the numerical mismatch of park supply and demand, which is visualized in Figure 2. This process is indicated as processes ①–② in the middle of the flow chart below (Figure 2).
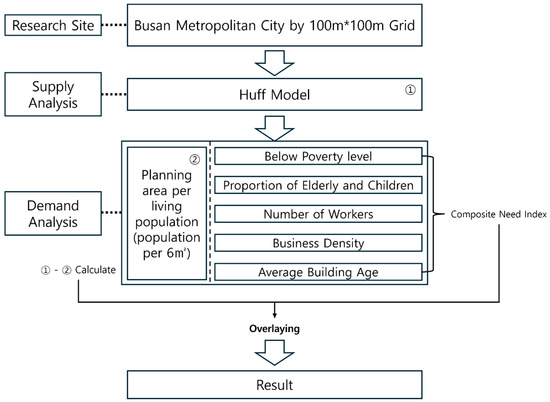
Figure 2.
Research Flow.
However, a per capita-based demand and supply analysis that allocates park areas to everyone based on the same standard by simply reflecting the population size does not reflect the special demand of certain demographic groups or socio-economic classes with greater health-related needs in relation to public health. In other words, the per capita-based population analysis has limitations in distinguishing between areas that absolutely need parks and areas that do not, and does not properly reflect areas with a higher concentration of populations in critical need of parks. For example, parks may be more than areas of recreation in communities with significant elderly populations or children; parks become part of the public health infrastructure [43,44], but this special need is not found by per capita-based analysis alone. Similarly, in areas where the majority of the population falls under the low-income class, parks are likely to be more affordable healthcare spaces due to people’s economic constraints. Hence, the need-based approach is considered in this study by adding socio-economic indicators to have more detailed demand analysis.
To refine the demand analysis, five socio-economic indicators are integrated into the assessment. First, the proportion of people living below the poverty line is considered to highlight areas where economically vulnerable populations require greater accessibility to public parks for recreation and well-being. Second, the average age of buildings is examined to assess the potential of parks in enhancing environmental conditions and revitalizing neighborhoods with aging infrastructure. Third, the number of business employees is included to recognize the role of parks in supporting leisure and welfare for workers in commercially active areas. Fourth, the density of businesses is analyzed to emphasize the necessity of parks in highly congested zones, where they can mitigate environmental stress. Lastly, the percentage of children and elderly residents is incorporated to identify areas where socially vulnerable populations—who are more likely to rely on parks for physical and mental well-being—require prioritized park services. From the equity perspective, the supply of urban parks should reflect the marginalized status [44,45]. The selection of these five indicators may be somewhat subjective, but the social indicators of poverty level, community aging and vulnerable age population reflected the equity perspective, and the indicators representing the business density, number of workers and average building age in the area were chosen to more accurately grasp the arithmetic demand for parks that may arise in the area.
We assigned percentile scores to the five socio-economic indicators collected in this way at the dong level, which is the smallest administrative unit in Korea and also indicates a community. The top 20% of communities received 1 point, and the communities that belonged to the next 20% obtained a score of 0.75. The bottom 20% of communities which have the lowest need based on the indicators received a score of 0. In this way, For each indicator, five percentile scores were assigned to all communities in Busan, and a kind of cumulative index was organized based on these five scores. This composite need index aggregates the scores from different socio-economic indicators to provide a single numerical value representing the overall level of need for urban park services in each. To illustrate, if a community has scores of 1, 0.75, 0.5, 1, and 0.75 points across indicator, then the composite need index is 4 points as all points are summed. Finally, this composite need index was mapped and overlaid with the previously created GIS layer representing the numerical mismatch of park supply and demand to identify and prioritize communities of greater needs.
3. Results
3.1. Arithmetic Gap Between Supply and Demand: Through Huff Model and Living Population Data
We assumed the spatial location where park demand occurs at the center of gravity of each 100 m × 100 m grid, and calculated the distances between 81,297 grid cells and 1865 parks in Busan. Based on these distances, the Huff model produced the supply area (m2) for each cell. The demand was calculated as the product of the living population of each grid cell and the planned area for the park, 6 m2 per person. Figure 3 shows the mismatch between areas of supply and demand by calculating the arithmetic difference. There are 326 grid cells in total where the arithmetic difference is negative, that is, locations where the demand for parks is greater than the supply. Notably, 326 grids out of the total 81,297 grids are not a large number, but they are spread across 100 of the total 205 communities that make up Busan. This means that almost half of the communities in Busan experience a partial shortage of urban parks. The grid with the most insufficient park supply compared to demand is located within the boundary of Myeongji 1-dong, Gangseo-gu. Considering the number of living population and the planned area of parks, our analysis shows that an additional 40,270 m2 of urban park space is necessary. The community with the highest number of insufficient supply grids is Jung 1-dong, Haeundae-gu, which contains a total of 30 grids. This indicates that a part of the community (300,000 m2 calculated as 30 grids, each measuring 100 by 100 m) needs an additional 50,645 m2 of urban park space. Based on the arithmetic gap between supply and demand, the insufficient park area in Busan as a whole is 689,736.74 m2.
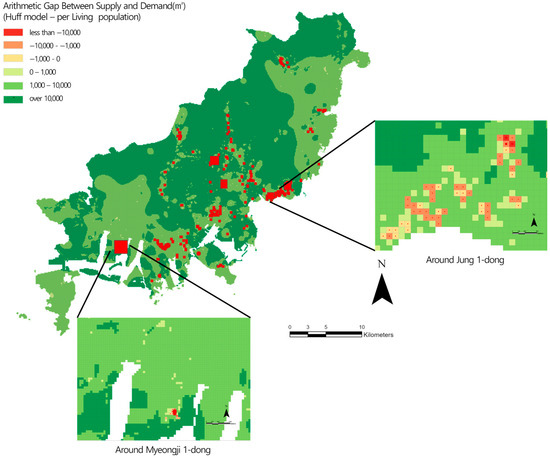
Figure 3.
Arithmetic Gap Between Supply and Demand, Cells shaded in yellow, orange, and red indicate park deficits.
3.2. Spatial Mismatch Between Supply and Demand: Based on Composite Need Index
Figure 4a maps the sum of the scores for each subscale within each indicator, based on the percentage scores for the five indicators of poverty level, community aging, vulnerable age population, business densities, and the number of business employees. The community with the highest composite need index received a total of 4 points, while the next highest received 3.75 and 3.5 points, respectively. The communities that should be prioritized for park provision are identified by overlaying the need index, calculated through socio-economic indicators, with the arithmetically undersupplied areas shown in Figure 4.
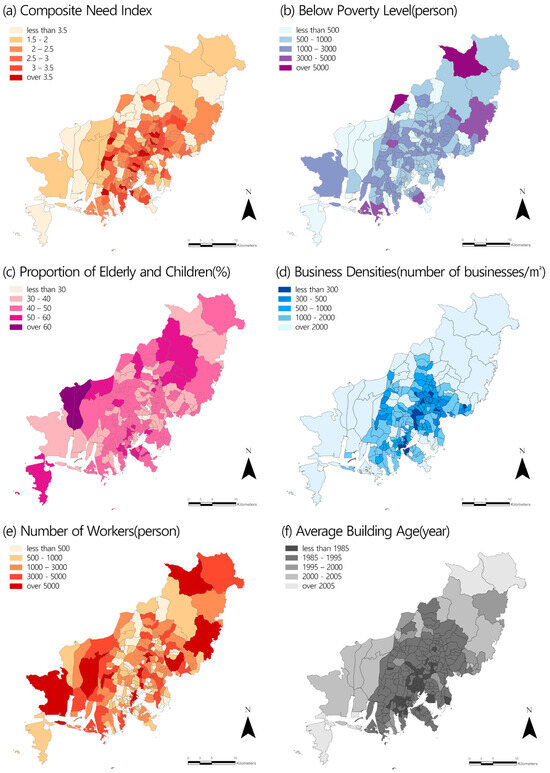
Figure 4.
Composite Need Index and socio-economic indicators.
Figure 4a represents the Composite Need Index which consists of the five socio-economic indicators (b–f). (b) identifies the financially vulnerable population by measuring the number of people living below the poverty level. (c) measures the proportion of elderly and children, considered socially vulnerable populations, within the total population. (d) shows that business density is used to assess how densely businesses are concentrated in a given area (number of businesses/m2). (e) shows the number of workers, reflecting the employment scale within the area. (f) shows the year buildings were constructed and reflects the degree of aging in the community’s built environment.
Figure 5 displays the communities identified through this overlay that should be prioritized for public park provision in the future planning process. Table 2 presents the top 10 communities with the highest composite need index among the 100 arithmetically undersupplied communities and their characteristics. Based on the results for these 10 communities, Busan Metropolitan City as a whole needs 77,248.42 m2 of urban park spaces according to our analysis. A total of 62 grid cells were identified where this supply imbalance occurs. The spatial mismatch between park supply and demand, displayed through these grid cells, highlights locations where park supply should be prioritized based on social vulnerability and the living population, which includes both the working and residential populations.
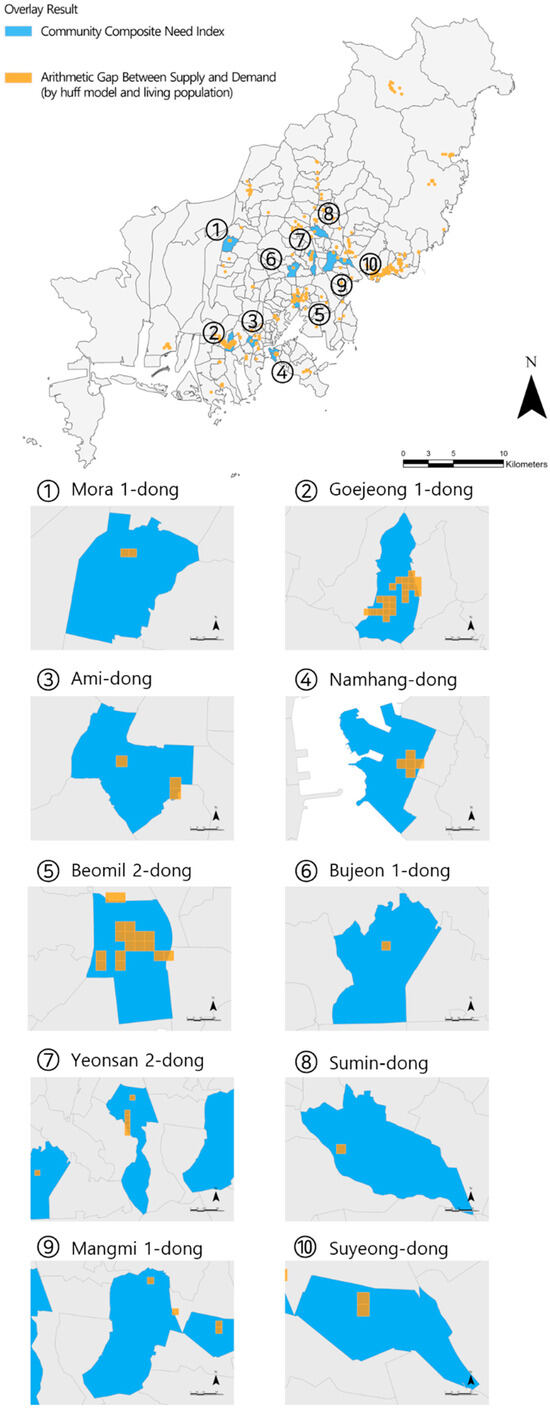
Figure 5.
Overlay Results. Areas, where the blue and orange polygons overlap, indicate locations identified as park-deficit park-deficient both by the arithmetic park-deficit calculation and by the Composite Need Index.
Table 2.
Top 10 communities with the highest composite need index among the 100 arithmetically undersupplied communities.
4. Conclusions and Discussion
4.1. Discussion
As part of its Green space master plan, Busan recently unveiled intentions to increase the number of parks within the city. Nevertheless, the existing plan predominantly focuses on increasing per capita park space, but it neglects to evaluate which regions should be prioritized for park development. Based on the study’s findings indicating an inequitable distribution of parks across ten communities in Busan, where the proportion of children or elderly residents exceeds the citywide average, the Busan Green space master plan needs to transcend the mere objective of increasing park acreage. This approach needs to develop a more refined criterion for prioritizing park provision, thereby pinpointing locations with the greatest demand for parks.
For future decision-making about how to allocate resources, it is crucial to take into account inhabitants’ social vulnerability and health status [46]. Prior studies indicate that restricted access to parks for low-income or elderly groups can intensify physical and mental health inequalities within communities [45,47]. Goejeong 1-dong, Beomil 2-dong, and Ami-dong, identified that need more park supply in this study, can be described as aging residential communities predominantly inhabited by individuals from low- and middle-income levels. The limited access of the park to these communities can have a significant impact on the resident’s health, making them highly vulnerable. Specifically, these economically disadvantaged communities have higher obesity rates and limited access to healthcare, which in turn heightens the risk of chronic disease and obesity-related complications [48,49]. Furthermore, mental illnesses like depression and stress are more common in economically disadvantaged neighborhoods [50]. Given the present community circumstances of Goejeong 1-dong, Beomil 2-dong, and Ami-dong, parks can serve as essential infrastructure that not only improves health but also improves people’s quality of life beyond the simple recreational function.
Furthermore, urban planning for park expansion must take into account both the specific demands of a community and general socio-economic vulnerabilities. As this study documents, there is a significant park shortage in both Yeonsan2-dong and Sumin-dong, two neighborhoods characterized by exceptionally high child densities. In contrast to Busan’s child population ratio of 10% for those under 14 years of age, these two localities have a comparatively elevated child population ratio above 12%. This demographic composition can further emphasize the significance of public health concerns associated with parks. Previous research indicates that children’s access to parks greatly influences their psychological, emotional, and social growth [51]. In particular, parks serve as vital venues for alleviating stress, encouraging physical activity, and facilitating social connection [1,2,3,4,7,8,43,47]. Children represent the forthcoming generation that will significantly contribute to the economic and social advancement of urban regions. Establishing a conducive environment for their health and development is intrinsically connected to the sustainability of cities. This indicates that park-related planning must align with the developmental requirements and welfare of children.
Thus, the Busan Master Plan for Parks and Greenbelts ought to prioritize the provision of urban parks, taking into account the distinctive population structure and socially and economically vulnerable status of each community rather than merely increasing park area. The availability of parks can be a crucial component of infrastructure that enhances the health and quality of life of inhabitants, especially in marginalized communities, which numerous low-income and elderly individuals inhabit. Moreover, in regions characterized by a significant population of children, it is imperative to prioritize the expansion of park spaces, taking into account the positive impacts that parks have on the physical, emotional, and social development of children. This will empower parks to assume a pivotal role in fostering the health and well-being of local communities.
4.2. Limitation
While this study focused on quantitatively analyzing the supply and demand of parks, it did not sufficiently address qualitative aspects such as the ecological value of parks, or residents’ satisfaction with park facilities. However, accessibility and availability alone cannot fully explain whether parks appropriately achieve their intended planning purposes and meet the needs of the local community. Therefore, this remains a methodological limitation in evaluating the supply and demand of parks. Quantitative approaches provide useful insights for identifying the spatial distribution and accessibility gaps across communities, but they may not reflect qualitative factors influencing park use such as citizens’ experiences and perceptions affecting park use. Accordingly, future studies need to conduct a more comprehensive analysis by integrating qualitative factors into the supply and demand assessment. According to several empirical studies [52,53,54], the quality of parks is an important factor in determining not only the intentions of users but also actual use, and may even outweigh the importance of spatial accessibility. According to Aronson et al. [55] and Hobbs et al. [1], if various qualitative factors such as the historical context of the city, ecological value, and satisfaction with maintenance and management status of park facilities are included in the spatial and demographic analysis, the accessibility and utilization of parks can be evaluated more realistically and precisely. However, measuring park quality entails several methodological challenges. While park supply can be objectively evaluated using quantitative spatial data, the qualitative factors in assessing demand aspects are conceptually complex, and considerable time and economic resources are required to accurately investigate and measure them. In particular, qualitative evaluations are often based on field observations, expert evaluations, or surveys of local residents and park visitors, so there is a possibility of subjective bias, and repeated evaluations may be necessary to reflect changes in park conditions [55,56]. Despite these methodological limitations, it is important to reflect on the qualitative elements of parks, as their inclusion can contribute to more fair and realistic park demand and supply assessment and planning [55]. Therefore, future research could benefit from developing a more balanced park evaluation model by combining both quantitative and qualitative approaches.
4.3. Conclusions
This study highlights the importance of implementing a more balanced and comprehensive approach to park development in Busan, going beyond merely expanding the park area per capita. In regions with a high concentration of children and a socially vulnerable population, such as Goejeong 1-dong, Beomil 2-dong, Ami-dong, Yeonsan 2-dong, and Sumin-dong, the results indicate a substantial discrepancy between the supply and demand for parks. This highlights the importance of prioritizing park allocation based on community-specific requirements rather than a uniform expansion strategy, as these disparities serve to exacerbate existing public health and social inequalities.
Quantitative results underscore the extent of these disparities: nearly half of Busan’s communities (100 out of 205) are undersupplied in park space. Even after overlaying a composite need index based on five socio-economic indicators, 62 grid cells still exhibited a supply–demand imbalance. Consequently, ten communities were identified as having the highest need for targeted park provision.
The integration of socio-economic and demographic factors into the formulation of future park policies is necessary to ensure that urban parks serve as a vital infrastructure for public health and well-being. Specifically, addressing inequities in park accessibility can enhance the physical and mental health outcomes of low-income, elderly, and child populations in Busan. Furthermore, aligning park development with broader urban planning strategies will help create a more resilient and inclusive city. In conclusion, a park system that is well-balanced and targeted will not only improve environmental sustainability but also promote social equity, thereby reinforcing the importance of urban parks as a fundamental element of a livable and healthy city.
Author Contributions
Conceptualization, D.P., J.L. and M.P.; methodology, D.P. and J.L.; validation, D.P., J.L., S.P. and M.P.; formal analysis, D.P., J.L. and S.P.; investigation, D.P., J.L. and M.P.; resources, J.L.; data curation, D.P. and S.P.; writing—original draft preparation, D.P. and M.P.; writing—review and editing, J.L., S.P. and M.P.; visualization, D.P.; supervision, J.L.; project administration, J.L.; funding acquisition, J.L. All authors have read and agreed to the published version of the manuscript.
Funding
This work was supported by the National Research Foundation of Korea (NRF), funded by the Ministry of Education (No. RS-2024-00336929), and by the Korea Agency for Infrastructure Technology Advancement (KAIA) grant funded by the Ministry of Land, Infrastructure and Transport (Grant RS-2022-00143404).
Institutional Review Board Statement
Not applicable.
Informed Consent Statement
Not applicable.
Data Availability Statement
The original data presented in the study are openly available in the data sources specified in the manuscript.
Acknowledgments
We appreciate the constructive comments of two anonymous reviewers and the Academic Editor, which have helped to improve the clarity of the manuscript.
Conflicts of Interest
The authors declare no conflicts of interest.
References
- Hobbs, M.; Green, M.A.; Griffiths, C.; Jordan, H.; Saunders, J.; Grimmer, H.; McKenna, J. Access and quality of parks and associations with obesity: A cross-sectional study. SSM Popul. Health 2017, 3, 722–729. [Google Scholar]
- Maas, J.; Van Dillen, S.M.; Verheij, R.A.; Groenewegen, P.P. Social contacts as a possible mechanism behind the relation between green space and health. Health Place 2009, 15, 586–595. [Google Scholar] [CrossRef] [PubMed]
- Sugiyama, T.; Francis, J.; Middleton, N.J.; Owen, N.; Giles-Corti, B. Associations between recreational walking and attractiveness, size, and proximity of neighborhood open spaces. Am. J. Public Health 2010, 100, 1752–1757. [Google Scholar] [CrossRef]
- Sallis, J.F.; Cerin, E.; Conway, T.L.; Adams, M.A.; Frank, L.D.; Pratt, M.; Salvo, D.; Schipperijn, J.; Smith, G.; Cain, K.L.; et al. Physical activity in relation to urban environments in 14 cities worldwide: A cross-sectional study. Lancet 2016, 387, 2207–2217. [Google Scholar]
- James, P.; Banay, R.F.; Hart, J.E.; Laden, F. A review of the health benefits of greenness. Curr. Epidemiol. Rep. 2015, 2, 131–142. [Google Scholar] [CrossRef] [PubMed]
- Sarkar, C. Residential greenness and adiposity: Findings from the UK Biobank. Environ. Int. 2017, 106, 1–10. [Google Scholar] [CrossRef] [PubMed]
- Joye, Y. Architectural lessons from environmental psychology: The case of biophilic architecture. Rev. Gen. Psychol. 2007, 11, 305–328. [Google Scholar]
- Kellert, S.R.; Heerwagen, J.; Mador, M. Biophilic Design: The Theory, Science and Practice of Bringing Buildings to Life; John Wiley & Sons: Hoboken, NJ, USA, 2011. [Google Scholar]
- Chawla, L. Benefits of nature contact for children. J. Plan. Lit. 2015, 30, 433–452. [Google Scholar]
- McCormack, G.R.; Rock, M.; Toohey, A.M.; Hignell, D. Characteristics of urban parks associated with park use and physical activity: A review of qualitative research. Health Place 2010, 16, 712–726. [Google Scholar] [CrossRef]
- Ellaway, A.; Macintyre, S.; Bonnefoy, X. Graffiti, greenery, and obesity in adults: Secondary analysis of European cross sectional survey. BMJ 2005, 331, 611–612. [Google Scholar]
- Park, M.; Lee, J.; Won, J. Navigating Urban Sustainability: Urban Planning and the Predictive Analysis of Busan’s Green Area Dynamics Using the CA-ANN Model. Forests 2024, 15, 1681. [Google Scholar] [CrossRef]
- Rundle, A.; Quinn, J.; Lovasi, G.; Bader, M.D.; Yousefzadeh, P.; Weiss, C.; Neckerman, K. Associations between body mass index and park proximity, size, cleanliness, and recreational facilities. Am. J. Health Promot. 2013, 27, 262–269. [Google Scholar] [CrossRef] [PubMed]
- Wolch, J.R.; Byrne, J.; Newell, J.P. Urban green space, public health, and environmental justice: The challenge of making cities ‘just green enough’. Landsc. Urban Plan. 2014, 125, 234–244. [Google Scholar] [CrossRef]
- Zhang, R.; Zhang, C.Q.; Cheng, W.; Lai, P.C.; Schüz, B. The neighborhood socio-economic inequalities in urban parks in a High-density City: An environmental justice perspective. Landsc. Urban Plan. 2021, 211, 104099. [Google Scholar] [CrossRef]
- Schlosberg, D. Theorising environmental justice: The expanding sphere of a discourse. Environ. Polit. 2013, 22, 37–55. [Google Scholar] [CrossRef]
- Boone, C.G.; Buckley, G.L.; Grove, J.M.; Sister, C. Parks and people: An environmental justice inquiry in Baltimore, Maryland. Ann. Assoc. Am. Geogr. 2009, 99, 767–787. [Google Scholar] [CrossRef]
- Bullard, R.D. Differential vulnerabilities: Environmental and economic inequality and government response to unnatural disasters. Soc. Res. 2008, 75, 753–784. [Google Scholar] [CrossRef]
- Bullard, R.D.; Wright, B. (Eds.) Race, Place, and Environmental Justice After Hurricane Katrina: Struggles to Reclaim, Rebuild, and Revitalize New Orleans and the Gulf Coast; Westview Press: Boulder, CO, USA, 2009. [Google Scholar]
- Mandarano, L.; Meenar, M. Equitable distribution of green stormwater infrastructure: A capacity-based framework for implementation in disadvantaged communities. Local Environ. 2017, 22, 1338–1357. [Google Scholar] [CrossRef]
- Park, M. Persistent Social Vulnerability in Washington DC Communities and Green Infrastructure Clustering. Land 2023, 12, 1868. [Google Scholar] [CrossRef]
- Kim, H.J.; Jung, S.G.; Lee, W.S. Evaluation of supply adequacy of the urban park by spatial imbalance analysis. J. Korean Inst. Landsc. Archit. 2011, 39, 18–27. [Google Scholar] [CrossRef]
- Park, S.H.; Kim, K.S.; Ko, B.O. A Study on the Estimation of Supply and Demand for Children’s Park. Seoul Stud. 2014, 15, 79–93. [Google Scholar]
- Kabisch, N.; Strohbach, M.; Haase, D.; Kronenberg, J. Urban green space availability in European cities. Ecol. Indic. 2016, 70, 586–596. [Google Scholar] [CrossRef]
- Hillsdon, M.; Jones, A.; Coombes, E. Green space access, green space use, physical activity and overweight. Nat. Engl. Comm. Rep. 2011, 67, 30. [Google Scholar]
- Ball, K.; Timperio, A.; Crawford, D. Neighbourhood socio-economic inequalities in food access and affordability. Health Place 2009, 15, 578–585. [Google Scholar] [CrossRef] [PubMed]
- Li, J.; Song, G.; Semakula, H.M.; Dou, Y.; Zhang, S. Food access inequalities in Chinese urban neighborhoods: A case study of the Dalian development zone. Food Secur. 2019, 11, 1087–1099. [Google Scholar] [CrossRef]
- Sturm, R.; An, R. Obesity and economic environments. CA Cancer J. Clin. 2014, 64, 337–350. [Google Scholar] [CrossRef]
- Busan Metropolitan City. 2030 Busan Master Plan For Parks and Greenbelts; Busan Metropolitan City: Busan, Republic of Korea, 2011.
- Chae, J.-H.; Zoh, K.-J.; Kim, S.-J.; Hoh, Y.K.; Hwang, J.-Y. A Study on Operational Systems & Planning Contents of Parks & Green Space Plan—Focused on London, New York, Berlin, Sydney, Seoul. J. Korean Inst. Landsc. Archit. 2014, 42, 91–104. [Google Scholar]
- Lee, J.W. Analysis of Accessibility and Supply Priorities for Urban Parks through Network Analysis; Dong-A University: Busan, Republic of Korea, 2018. [Google Scholar]
- Korea Public Data Portal. Available online: https://www.data.go.kr/ (accessed on 21 April 2025).
- V World from the Ministry of Land, Infrastructure, and Transport. Available online: https://www.vworld.kr/v4po_main.do (accessed on 21 April 2025).
- Korea Statistics Korea. Available online: https://www.kostat.go.kr/ansk/ (accessed on 21 April 2025).
- Haynes, K.E.; Fotheringham, A.S. Gravity and Spatial Interaction Models; WVU Research Repository: Morgantown, WV, USA, 2020. [Google Scholar]
- Huff, D.L. Geographical aspects of consumer behavior. Univ. Wash. Bus. Rev. 1959, 18, 27–37. [Google Scholar]
- Huff, D.L. A probabilistic analysis of shopping center trade areas. Land Econ. 1963, 39, 81–90. [Google Scholar] [CrossRef]
- Lin, T.G.; Xia, J.C.; Robinson, T.P.; Olaru, D.; Smith, B.; Taplin, J.; Cao, B. Enhanced Huff model for estimating Park and Ride (PnR) catchment areas in Perth, WA. J. Transp. Geogr. 2016, 54, 336–348. [Google Scholar] [CrossRef]
- Roksandić, S.; Urošević, D.; Mladenović, N.; Davidović, T.; Carrizosa, E. Huff Location Model of the Bicycle Parking Services. REACT 2011, 2011, 270. [Google Scholar] [CrossRef]
- Wang, S.; Li, M. Green space system design in Luoyang using Huff Model. In Proceedings of the Geoinformatics 2008 and Joint Conference on GIS and Built Environment: The Built Environment and Its Dynamics, Guangzhou, China, 28–29 June 2008; SPIE: Bellingham, WA, USA, 2008; Volume 7144, pp. 1053–1060. [Google Scholar]
- Im, E. Developing a methodological framework for assessing the level of neighborhood park service provision. Korea Spat. Plan. Rev. 2009, 63, 107–122. [Google Scholar]
- Wang, H.; Wei, X.; Ao, W. Assessing Park Accessibility Based on a Dynamic Huff Two-Step Floating Catchment Area Method and Map Service API. ISPRS Int. J. Geo-Inf. 2022, 11, 394. [Google Scholar] [CrossRef]
- Kim, Y.; Byon, Y.J.; Yeo, H. Enhancing healthcare accessibility measurements using GIS: A case study in Seoul, Korea. PLoS ONE 2018, 13, e0193013. [Google Scholar] [CrossRef]
- Rigolon, A.; Flohr, T.L. Access to parks for youth as an environmental justice issue: Access inequalities and possible solutions. Buildings 2014, 4, 69–94. [Google Scholar] [CrossRef]
- Rigolon, A. A complex landscape of inequity in access to urban parks: A literature review. Landsc. Urban Plan. 2016, 153, 160–169. [Google Scholar] [CrossRef]
- Hazlehurst, M.F.; Lanza, H.I.; Rote, W.M.; DeLuca, S.; Anderson, S. Park access and mental health among parents and children during the COVID-19 pandemic. BMC Public Health 2022, 22, 800. [Google Scholar] [CrossRef]
- Cohen, D.A.; Han, B.; Derose, K.P.; Williamson, S.; Marsh, T.; Rudick, J.; McKenzie, T.L. Neighborhood poverty, park use, and park-based physical activity in a Southern California city. Soc. Sci. Med. 2012, 75, 2317–2325. [Google Scholar] [CrossRef]
- Hung, K.; Crompton, J.L. Benefits and constraints associated with the use of an urban park reported by a sample of elderly in Hong Kong. Leis. Stud. 2006, 25, 291–311. [Google Scholar] [CrossRef]
- Drewnowski, A. The economics of food choice behavior: Why poverty and obesity are linked. In Obesity Treatment and Prevention: New Directions; Karger: Basel, Switzerland, 2012; Volume 73, pp. 95–112. [Google Scholar]
- Levine, J.A. Poverty and obesity in the US. Diabetes 2011, 60, 2667–2668. [Google Scholar] [CrossRef]
- Knifton, L.; Inglis, G. Poverty and mental health: Policy, practice and research implications. BJPsych Bull. 2020, 44, 193–196. [Google Scholar] [CrossRef] [PubMed]
- Reuben, A.; James, P.; DeVille, N.V.; Kaufman, J.D.; Ghosh-Dastidar, B.; Mair, C.; Banay, R.F.; Duncan, G.E.; Wang, W.; Boettner, B.; et al. Association of neighborhood parks with child health in the United States. Prev. Med. 2020, 141, 106265. [Google Scholar] [CrossRef] [PubMed]
- Kaczynski, A.T.; Schipperijn, J.; Hipp, J.A.; Besenyi, G.M.; Stanis, S.A.W.; Hughey, S.M.; Wilcox, S. ParkIndex: Development of a standardized metric of park access for research and planning. Prev. Med. 2016, 87, 110–114. [Google Scholar] [CrossRef] [PubMed]
- Kaczynski, A.T.; Hughey, S.M.; Stowe, E.W.; Wende, M.E.; Hipp, J.A.; Oliphant, E.L.; Schipperijn, J. ParkIndex: Validation and application of a pragmatic measure of park access and use. Prev. Med. Rep. 2020, 20, 101218. [Google Scholar] [CrossRef]
- Wang, D.; Brown, G.; Liu, Y.; Mateo-Babiano, I. A comparison of perceived and geographic access to predict urban park use. Cities 2015, 42, 85–96. [Google Scholar] [CrossRef]
- Aronson, M.F.; Clark, J.A.; Hoover, F.A.; Joo, H.E.; Kremer, P.; La Rosa, D.; Larson, K.L.; Lepczyk, C.A.; Lerman, S.B.; Locke, D.H.; et al. Limitations of existing park quality instruments and suggestions for future. Landsc. Urban Plan. 2024, 249, 105127. [Google Scholar]
Disclaimer/Publisher’s Note: The statements, opinions and data contained in all publications are solely those of the individual author(s) and contributor(s) and not of MDPI and/or the editor(s). MDPI and/or the editor(s) disclaim responsibility for any injury to people or property resulting from any ideas, methods, instructions or products referred to in the content. |
© 2025 by the authors. Licensee MDPI, Basel, Switzerland. This article is an open access article distributed under the terms and conditions of the Creative Commons Attribution (CC BY) license (https://creativecommons.org/licenses/by/4.0/).