Article

Integrating Noise into Life Cycle Assessment for Sustainable High-Rise Construction: A Comparative Study of Concrete, Timber, and Steel Frames in Australia

1
Faculty of Science and Technology, Charles Darwin University, Ellengowan Drive, Casuarina, NT 0810, Australia
2
Carbon Neutral, Level 9, 197 St Georges Terrace, Perth, WA 6000, Australia
*
Author to whom correspondence should be addressed.
Sustainability 2025, 17(9), 4040; https://doi.org/10.3390/su17094040
Submission received: 13 March 2025 / Revised: 2 April 2025 / Accepted: 9 April 2025 / Published: 30 April 2025

Abstract

The Life Cycle Assessment (LCA) evaluates the environmental impacts of a product or service throughout its life cycle, from material extraction to end-of-life, considering factors such as global warming, acidification, and toxicity. However, despite its significant health effects, noise has not yet been incorporated into the LCA. This study integrates noise impact into the LCA to assess and compare alternative structural designs for Australian high-rise residential and commercial buildings. Three scenarios were analysed: (1) reinforced concrete frames, (2) hybrid timber designs using engineered wood (e.g., cross-laminated timber and Glulam), and (3) steel-frame structures. The system boundary spans cradle to grave, with a 100-year lifespan. Material quantities were extracted from BIM software 2024 (Revit Architecture) for accuracy. The ReCiPe 2016 method converted inventory data into impact indicators, while noise impact was assessed using Highly Annoyed People (HAP) and Highly Sleep-Deprived People (HSDP). The results show that commercial buildings have more significant environmental impacts than residential structures due to their higher material usage. Steel frames generally exhibit the highest environmental impact, while concrete structures contribute most to noise effects. The total noise-integrated impact ranks as steel > concrete > timber. Additionally, noise accounts for up to 33% of the total impact on densely populated areas but remains negligible in low-population regions. These findings highlight the importance of incorporating noise into the LCA for a more holistic assessment of sustainable building designs.

1. Introduction

The construction industry is responsible for 41% of total energy use, 73% of electricity consumption, and 40% of carbon emissions, making it a key sector in global sustainability efforts [1,2,3,4]. In 2015, all United Nations member states adopted 17 Sustainable Development Goals (SDGs) to be achieved by 2030, with several directly linked to building construction [5]. Notably, Goal 7 (Affordable and Clean Energy), Goal 9 (Industry, Innovation, and Infrastructure), and Goal 11 (Sustainable Cities and Communities) are closely related to the built environment. Various building rating systems, such as LEED (Leadership in Energy and Environmental Design) and BREEAM (Building Research Establishment Environmental Assessment Method), have been developed to benchmark sustainable practices [6,7]. However, some certified green buildings were found to consume more energy than expected, highlighting the need for more comprehensive assessment tools that account for the entire building lifecycle [8]. In recent years, sustainability certifications such as LEED 2009 and Green Globes have incorporated the Life Cycle Assessment (LCA) into their frameworks, providing a more accurate evaluation of a building’s environmental impact [6,9]. The LCA, which quantifies the environmental impacts of products or services from material extraction to disposal or recycling, provides a holistic approach that supports the achievement of SDGs [8,10]. There are various LCA methodologies, such as Impact 2002+, CML IA Baseline, ILCD 2011, ReCiPe 2016, and AusLCA, each utilising different impact indicators like climate change (global warming), ozone depletion, toxicity, and acidification [10]. However, despite being a well-recognised environmental and public health concern, noise pollution is conspicuously absent from conventional LCA frameworks [11,12].
Construction noise occurs at multiple stages, including material production, transportation, on-site construction, and end-of-life processes such as demolition or recycling [13,14,15,16,17,18,19,20]. Noise impact can vary for the same material due to the transportational distance. The duration of the building’s life may range from 50 to 100 years. During this period, materials will need repair and replacement. For example, timber structures, although environmentally friendly, typically require more maintenance and may generate more traffic noise over time compared to steel or concrete frames [16,21]. Additionally, while recycling is a key factor in sustainable development, it can require more energy and produce more noise than landfilling, mainly if recycling facilities are located farther away [16,22,23]. Given these complexities, noise generation fluctuates across the different stages of material life cycles, adding another layer of environmental impact [24]. Therefore, it is essential to calculate and integrate noise impacts into the conventional LCA framework to provide a more comprehensive assessment of high-rise building construction.
Over the past few decades, several researchers have developed frameworks to assess the impacts of noise within the Life Cycle Assessment (LCA) [25]. These studies primarily focused on traffic noise, using indicators such as annoyance and sleep disturbance to assess its environmental impact [26,27,28]. Some researchers have examined the noise impact of building materials using the LCA method [29,30,31,32,33]. The importance of conducting LCAs of high-rise buildings is increasing. According to the Australian Bureau of Statistics (2016), the population living in high-rise buildings increased from 18% to 38% over the decade from 2006 to 2016 [34,35]. The construction of more high-rise buildings is associated with increased material use and environmental impact. Some studies have applied the LCA to high-rise buildings, focusing on specific aspects, such as carbon emissions, steel-frame structures, alternative building materials, and hybrid material use [17,36,37,38,39,40]. Despite advancements in assessing the environmental impact of various building materials and emissions, the consideration of noise impacts within the LCA framework for high-rise constructions has yet to receive adequate attention.
This research aims to assess the integration of noise impacts into the LCA for high-rise building construction. Noise pollution from construction activities primarily depends on population exposure, which varies significantly between urban and rural areas [41,42]. As a case study, a six-story building in Darwin was analysed in two distinct locations: a city area and a rural area. A 100-year building lifespan was used for a comparison of the environmental impacts of three structural types: concrete-frame, steel-frame, and timber-frame buildings. Two high-rise buildings, residential and commercial, were compared to assess the material impact. The study considers material-recycling a critical factor in line with the SDGs. Two end-of-life scenarios, landfill and recycling, were analysed to provide a comprehensive cradle-to-grave LCA for high-rise buildings, considering construction noise impacts and material sustainability.
The materials and method are described in Section 2. The midpoint and endpoint noise-integrated impact assessment result is discussed in Section 3. The limitations are listed in Section 4, and a conclusion and recommendations for future improvements are presented in Section 5.

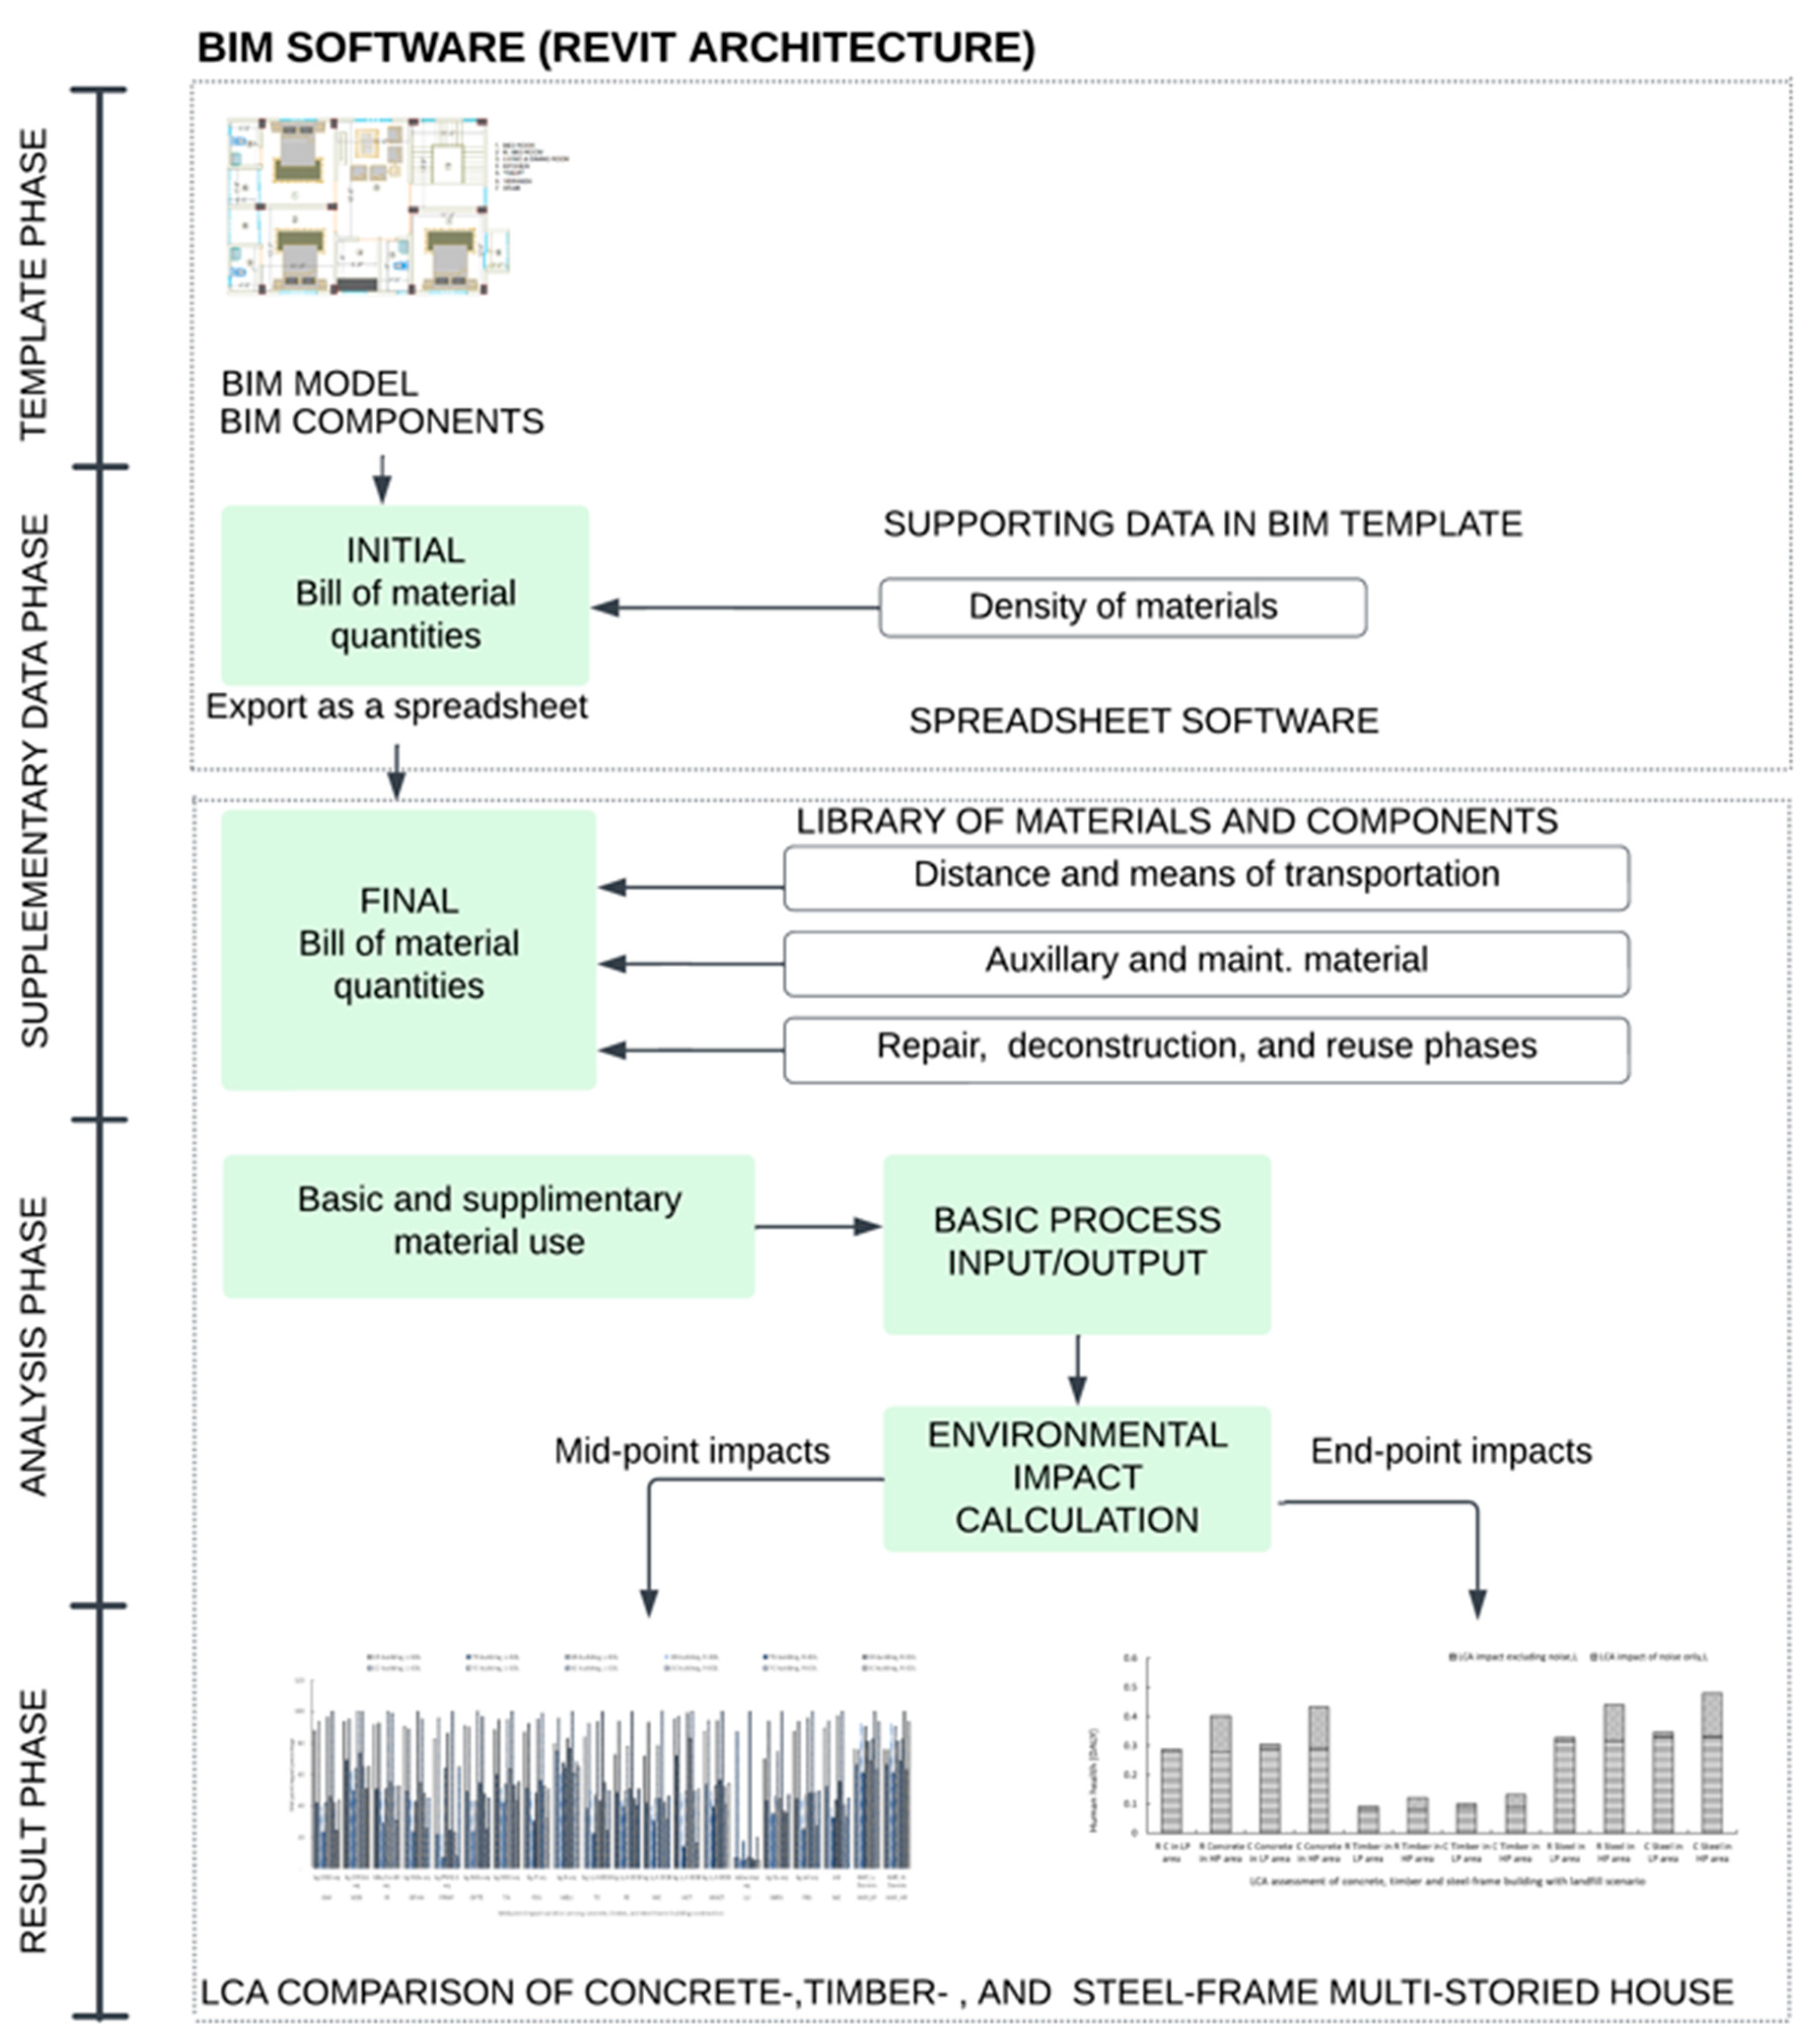
2. Material and Method

The LCA methodology was employed to evaluate, analyse, and compare the environmental impacts of the building materials of a high-rise residential and commercial building. There are four stages in the LCA: goal and scope, life cycle inventory (LCI), life cycle impact assessment, and interpretation [43,44,45].

2.1. Goal and Scope Definition

A 3-bedroom building with a floor area of 119 m2 per floor was selected for an environmental impact assessment (Figure 1). The total floor area for the 6-storey building is 714 m2. The ground floor is designated for parking, while the upper floors are for residential use. The building is located in Darwin, 5 km from the coastal zone. This study compares the LCA of three alternative design scenarios: concrete-frame, steel-frame, and timber-frame structures. For the concrete-frame building, all structural members, including beams, columns, floors, roofs, and foundations, are made of concrete. Structural members in a steel-frame building are typically made of steel, except for the foundation and lift core. The timber-frame building has structural members composed of Glulam (glued laminated timber) and CLT (cross-laminated timber), except for the foundation and lift core. For commercial buildings, the same building plan was used. The same building materials were used for commercial buildings. The primary difference is that a commercial building requires more materials due to its higher load. The total floor area (714 m2) is assumed as the functional unit. The goal was to achieve functional equivalence in structural systems and building envelopes. Critical parameters such as floor area, floor-to-ceiling height, and overall building dimensions were kept identical. The building envelopes (roof, exterior walls, and floors) were designed to have the same thermal resistance, ensuring equivalent operational energy across all design alternatives.
The scope of the work involves collecting data on materials, energy, and transportation to facilitate accurate assessments of environmental impact. A flowchart (Figure 2) outlines the four phases of the environmental impact assessment. The initial phase, the template phase, involves calculating the preliminary material quantities. In the supplementary phase, both the initial and final bills of quantities are determined, with material measurements conducted in accordance with Australian Standards (AS 3600, AS 4100, AS 1684) [46,47,48]. This phase also includes calculating transportation energy, mode, and travel distance data. The collected data are processed using the life cycle assessment (LCA) method during the analysis. Finally, in the results phase, the midpoint and endpoint impacts of the noise-integrated LCA method are compared to evaluate environmental performance.

2.2. Life Cycle Inventory (LCI)

Assessing the environmental impact of construction activities requires a comprehensive and systematic approach that integrates material inventories, energy consumption, transportation logistics, and traffic noise. To address this, Table S1 consolidates the key material inventory data, showcasing the quantities of essential building materials. This table emphasises environmentally impactful materials, including timber, steel, concrete, tiles, plasterboard, glass, brick, and aluminium—selected for their substantial contribution to the overall environmental footprint of construction projects [49,50]. Material quantities were extracted using Revit software 2024 for accuracy and precision [51,52].
Table S2 examines variations in transportation modes and distances for building materials. For instance, heavy lorries (7.5–16 tons) are used for transporting materials such as timber, brick, and steel, while lighter materials are transported by smaller vehicles (3.5–7.5 tons). Transportation’s environmental impact is categorised into fuel consumption, noise pollution, and energy use. Notably, vehicles were assumed to be fully loaded during trips to construction sites and to return empty. For impact calculations, loaded trips were assumed to exert 1.5 times the environmental burden of empty trips. Material and transportation data for the different building types were collected and analysed using the LCA software, SimaPro 9.5.0.2.
Energy consumption was analysed by assessing fuel usage per kilometre for different vehicles, offering a comprehensive understanding of the energy demands across transportation scenarios. Additionally, noise impacts were integrated into the analysis using a noise-integrated Life Cycle Assessment (LCA) framework. Noise calculations consider the cumulative distance travelled to provide a more accurate representation of noise pollution. Details of this method will be discussed in the next section.
The circular economy concept emphasises waste minimisation and material reuse to support sustainability goals. In alignment with the SDGs, this study compares two end-of-life scenarios: recycling and landfill disposal. Table S3 highlights that recycling often requires longer transportation distances than landfill, yet its environmental benefits, such as reduced resource extraction and waste generation, usually outweigh these impacts [50]. In this research, some materials were recycled at an 80% rate. Those materials are concrete, brick, steel, reinforcement, glass, timber, and aluminium. The remaining materials, such as insulation, plasterboard, and paint, were considered landfill.

2.3. Life Cycle Impact Assessment

2.3.1. Traditional LCA Method

In the traditional LCA method, material and energy are responsible for environmental impact. ReCiPe 2016 was used in this research to assess the effect of those materials and energy. There are 18 midpoint impact categories in the ReCiPe 2016 methodology, including global warming, stratospheric ozone depletion, ionising radiation, ozone formation, eutrophication, and toxicity [53,54,55,56,57].

2.3.2. Noise Integration in LCA Method

In this research, the impact of noise has been assessed. There are four steps to determine these impacts: noise emission and propagation, noise exposure, noise effect, and damage effect [58]. Total noise emission and propagation must be analysed to calculate the noise level. This study categorises noise into two primary types: static and mobile. Static noise is generated by the machinery and equipment used during the acquisition, manufacture, construction, maintenance, and repair of materials, as well as at the end-of-life stage of these materials. Examples include jackhammers, bulldozers, and other types of industrial machinery. On the other hand, mobile noise originates from the transportation activities required at every stage of the material lifecycle, such as trucks, cranes, and delivery vehicles [26,59,60,61]. Noise level varies depending on distance and attenuation (A).
Noise level can be calculated as follows [62,63]:
L P A , i = L W A 8 20 log 10 r i A
where sound pressure level is denoted as LPA and measured from a distance (ri) with A-weighted sound power level. A-weighted sound (dBA) adjusts noise levels to reflect human hearing sensitivity, emphasising frequencies between 500 Hz and 6 kHz.
LWA is the sound pressure level in the source. Sound pressure is different for different sources of noises.
ri is distance. Here, 20 m is the distance from the noise source to the receiver.
A represents attenuation, which depends on the geometric divergence of the sound wave, the atmospheric absorption of sound, and reflections and refractions with building and ground surfaces [58]. Here, an average of 10 decibels of noise was assumed to be attenuated due to the building’s exterior wall.
In this research, noise was generated in different time zones. Therefore, the annual average noise level over 24 h periods must be calculated in accordance with ISO 1996-2:1987 [58,64]. Here, the 24 h is divided into three parts: 12 h of daytime (Lday), 4 h of evening time (Levening), and 8 h of nighttime (Lnight). Therefore, the average noise level/equivalent noise level can be calculated as per the following equation:
L A e q = 10 log 10 12 24 log L d a y 10 + 4 24 log L e v e n i n g + 5 10 + 8 24 log L n i g h t + 10 10
After calculating the noise level, GIS software 3.4.8 was used to estimate the amount of the population that was exposed to the noise. Population data from the WorldPop database were incorporated into the QGIS to perform spatial analyses and visualisations. Figure 3 illustrates two road segments analysed for noise exposure. The green line on the map represents an urban road in Darwin City, Northern Territory, measuring 4.5 km in length, which passes through high-density suburbs such as Darwin City, Stuart Park, The Gardens, Parap, and Woolner. The orange line represents a road in low-density areas, spanning 3.3 km and located in Lee Point, Tiwi, and Lyons. Noise levels were assessed 20 m from both sides of the streets, using advanced QGIS tools to calculate population exposure in those zones to obtain granular demographic insights. For a highly dense location (near the green line), with a population density of approximately 1630/km2, approximately 82 people per km2 are exposed to traffic noise (Figure 3). Beside the orange line, with a population density of 334/km2, 17 people per km are exposed to traffic noise (Figure 3). Although the two road segments differ in their start points, destinations, and lengths, they were selected based on their distinct urban and suburban characteristics rather than identical spatial attributes. The comparison focuses on population exposure to noise in high-density versus low-density areas. The difference in road length does not affect the findings, as exposure calculations are normalised per kilometre to ensure consistency.
For effect analysis, two midpoint impact categories were selected: highly sleep-deprived people (HSDP) and highly annoyed people (HAP) [26]. Other researchers suggested these two health impairments [58]. These two health impairments may cause 92% of environmental noise impacts. Miedema and Oushoorn provide the exposure–response relationships used to calculate these two impacts. Those exposure–response relationships are expressed in Equations (3) and (4).
The highly sleep-deprived people (%HSD) who are exposed to a noise level (Lnight) range to 45–65 decibels are expressed as the following equation:
% H S D P = 0.01486 L n i g h t   2 1.05 L n i g h t + 20.8
Lnight, measured specifically from 23:00 to 07:00, assesses noise exposure during sleep-sensitive hours. This is crucial for evaluating nighttime noise pollution and its health impacts.
The percentage of HAP who are exposed to a noise level (LAeq) between 45 and 75 decibels can be expressed as [65]
% H A P = 0.5118 L A e q 42 0.01436 L A e q 42 2 + 0.0009868 L A e q 42 3
LAeq is the average sound level over a specified period, typically measured in dBA, representing continuous noise energy over time. This is expressed in Equation (2).
HSDP and HAP are robust midpoint impacts that require few value judgments. On the other hand, endpoint impacts require more assumptions and are associated with higher uncertainty [66]. In ReCiPe 2016, there are three endpoint impact categories, also known as damage categories:
  • Human Health (measured in Disability-Adjusted Life Years, DALY).
  • Ecosystem Quality (measured in species lost per year).
  • Resource Scarcity (measured in USD increase in extraction cost).
DALY is a metric used in the LCA to quantify the overall burden of disease or environmental impacts on human health. It combines two components, namely Years of Life Lost (YLL) and Years Lived with Disability (YLD). YLL is due to premature mortality. YLD is due to illness or health conditions.
The human health (HH) indicator is expressed as disability-adjusted life year (DALY), which is calculated using the following Equation (4):
H H = D W × C F
where DW is the disability weight suggested by WHO and the disability unit for HAP is between 0.02 and 0.033 [26,67,68,69].
CF is the endpoint characterisation factor. It depends on background noise, traffic speed, population density, and so on. Here, CF is weighted by the magnitude of the elementary traffic. In this research, the CF value varies from 5 to 39.

3. Result and Discussion

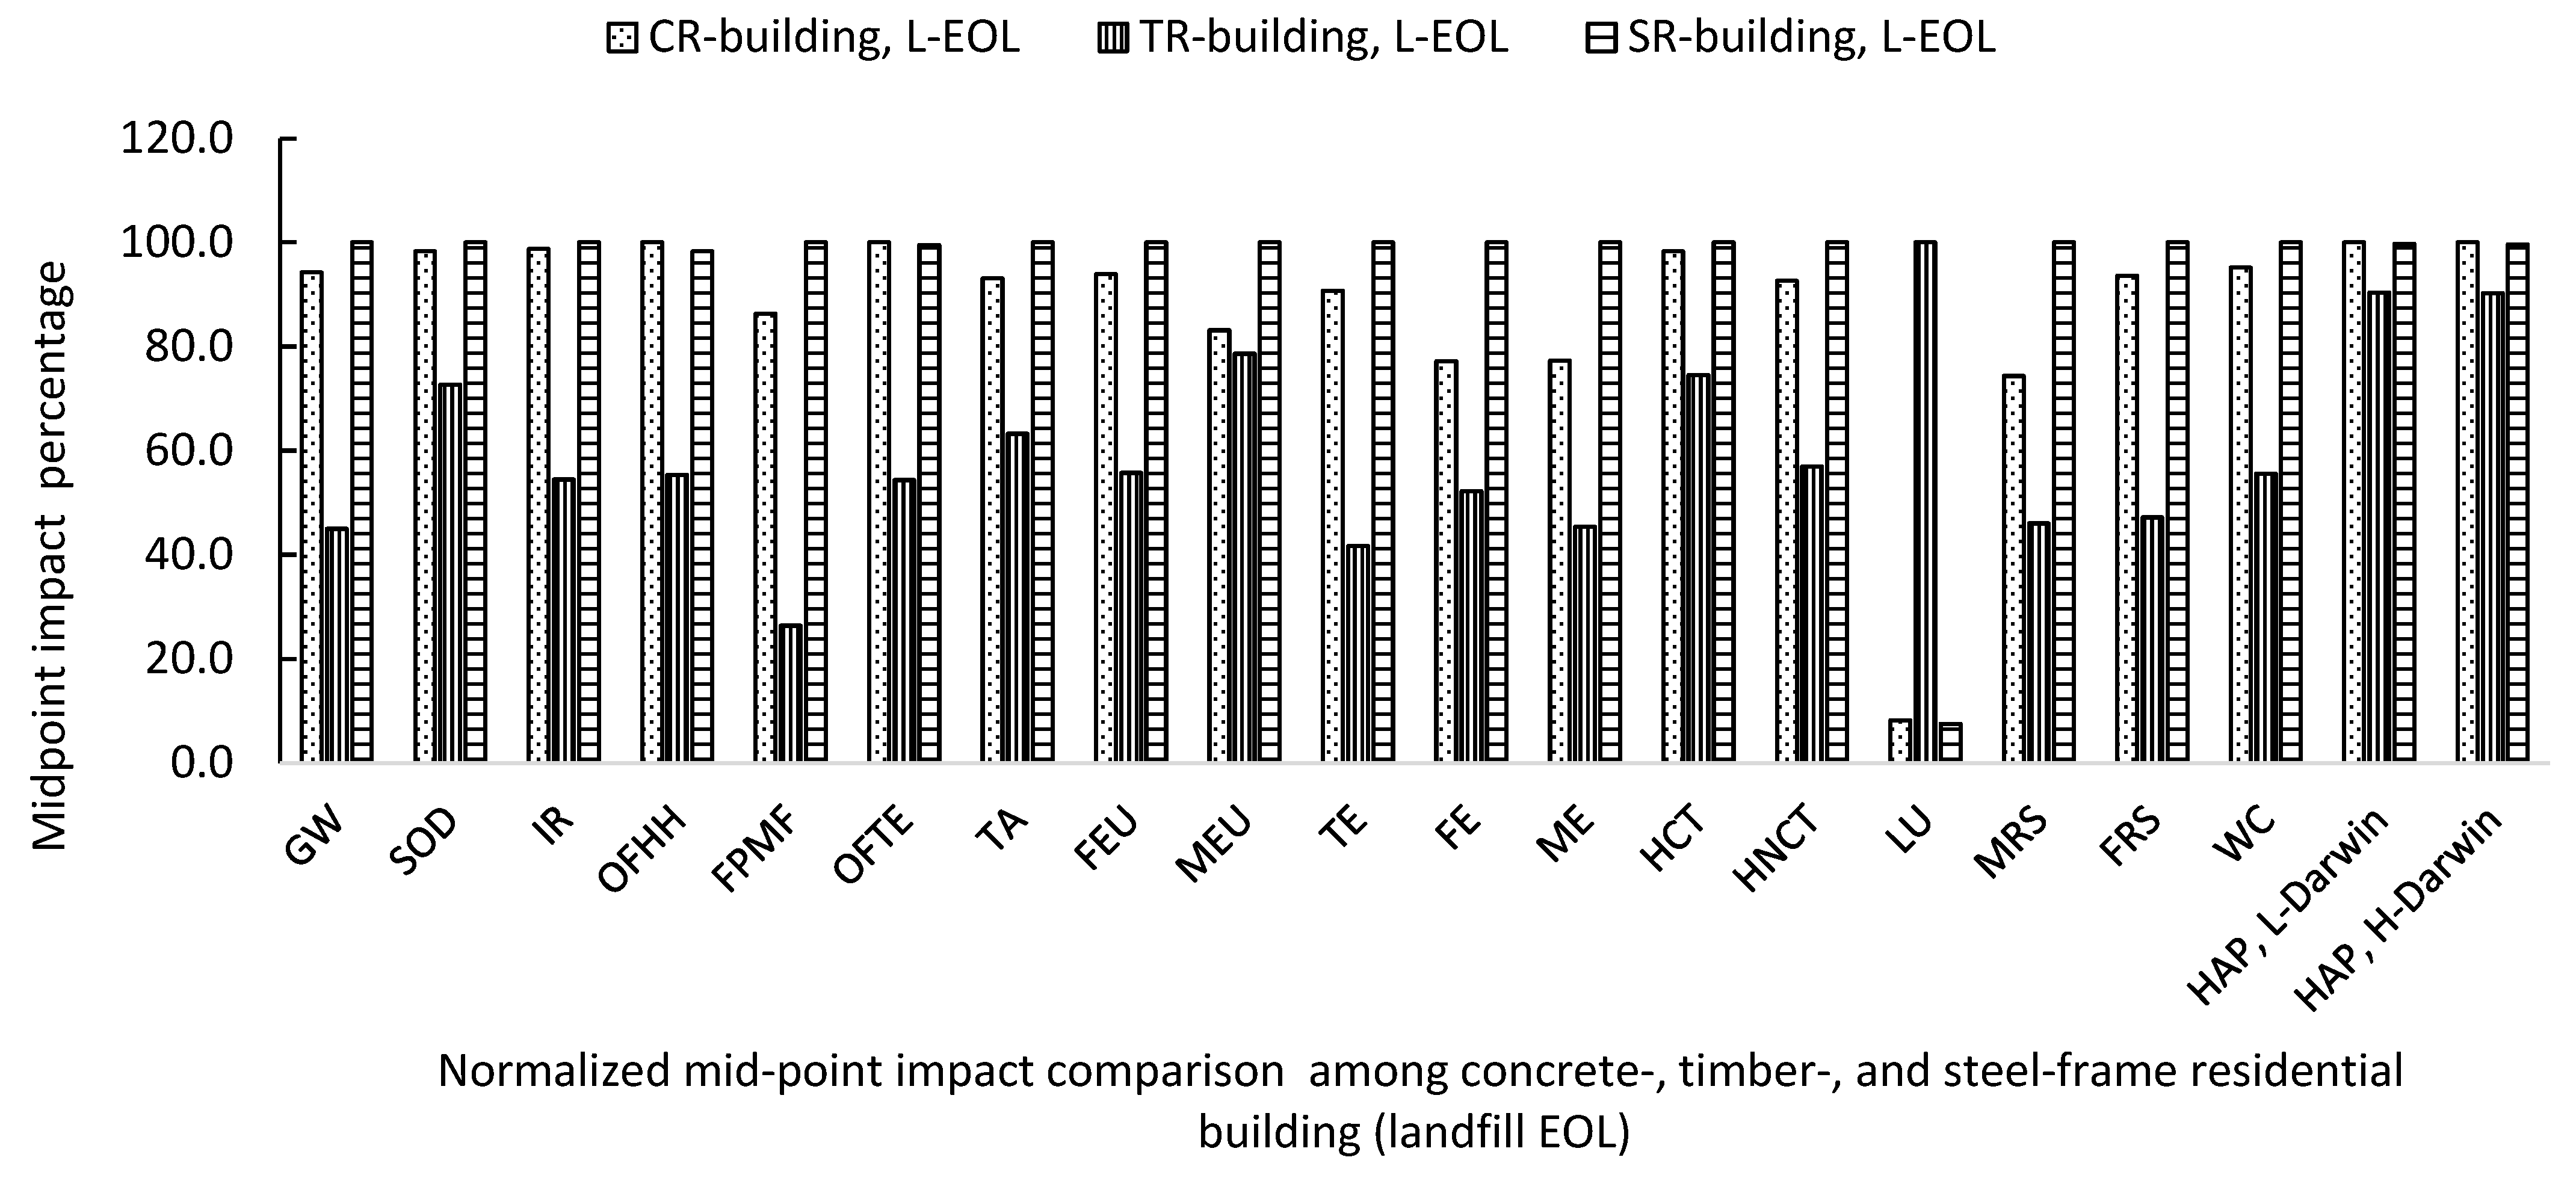
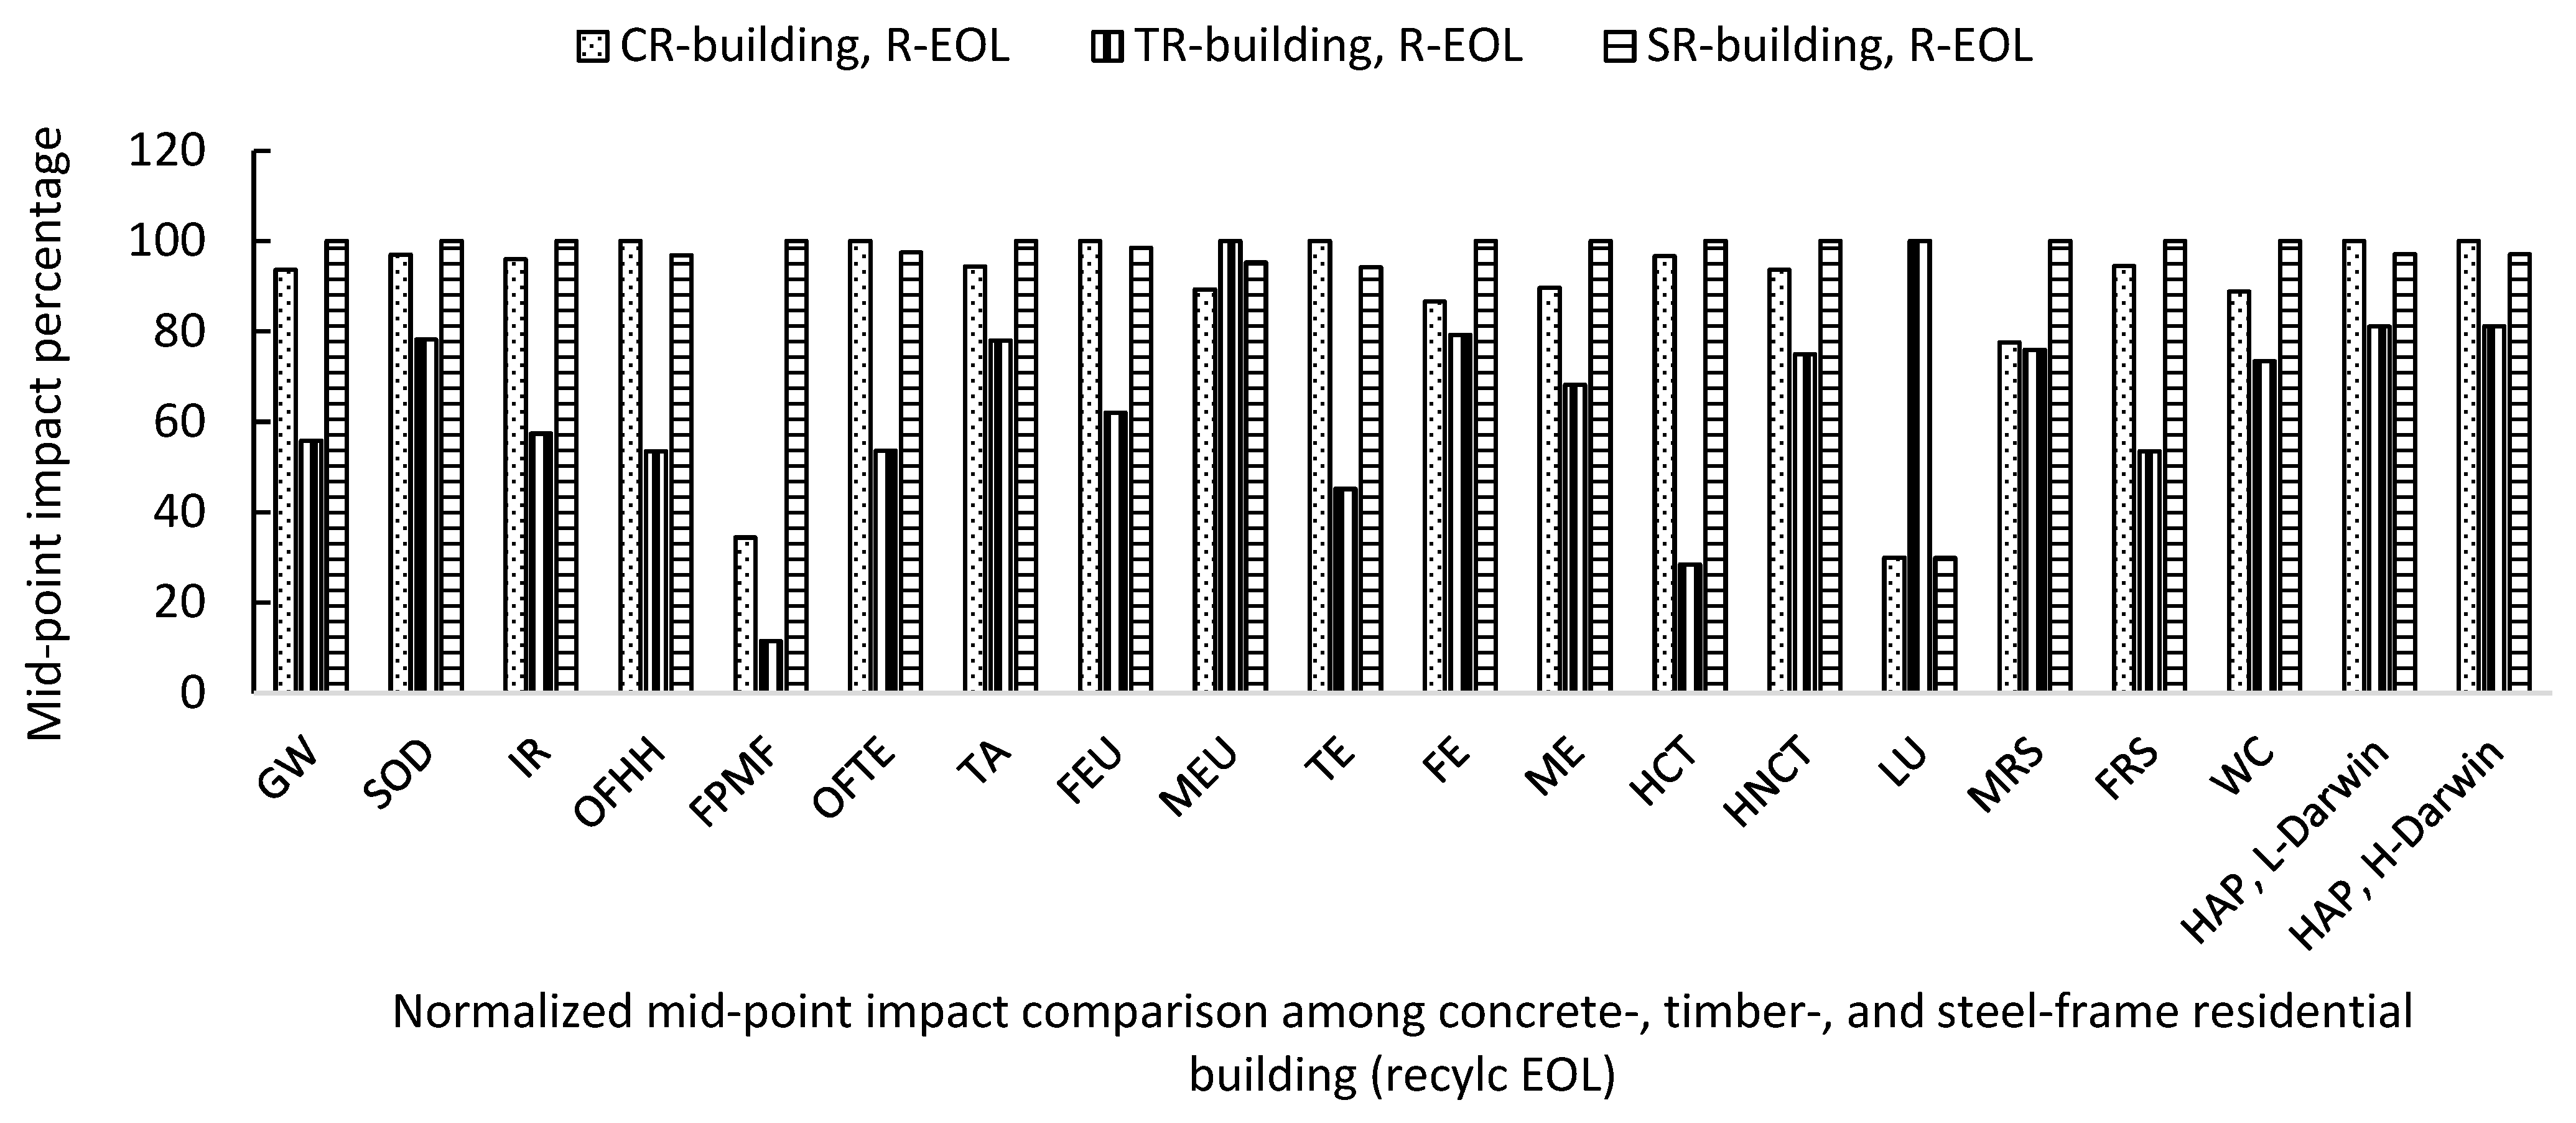
3.1. LCA of Six-Story Concrete-, Timber-, and Steel-Frame Houses

In this research, the environmental impacts of building material and fuel energy use were calculated using the ReCiPe 2016 method. The impacts of the midpoint and endpoint were assessed and compared for both residential and commercial buildings. The Muller Wenk traffic noise calculation model was used for noise integration, and it concluded that the maximum noise level generated by traffic noise is nearly 60 decibels [26]. This noise level annoys people in the traffic and beside the road. The other noise impact indicator is HSDP. The noise level is reduced by 10 decibels at night. Further noise levels can be reduced inside buildings due to the insulation provided by building materials. As a result, the calculated nighttime noise level is reduced to 40 decibels, which has no impact on sleep deprivation [45,70]. Therefore, only the HAP category was calculated in this research.

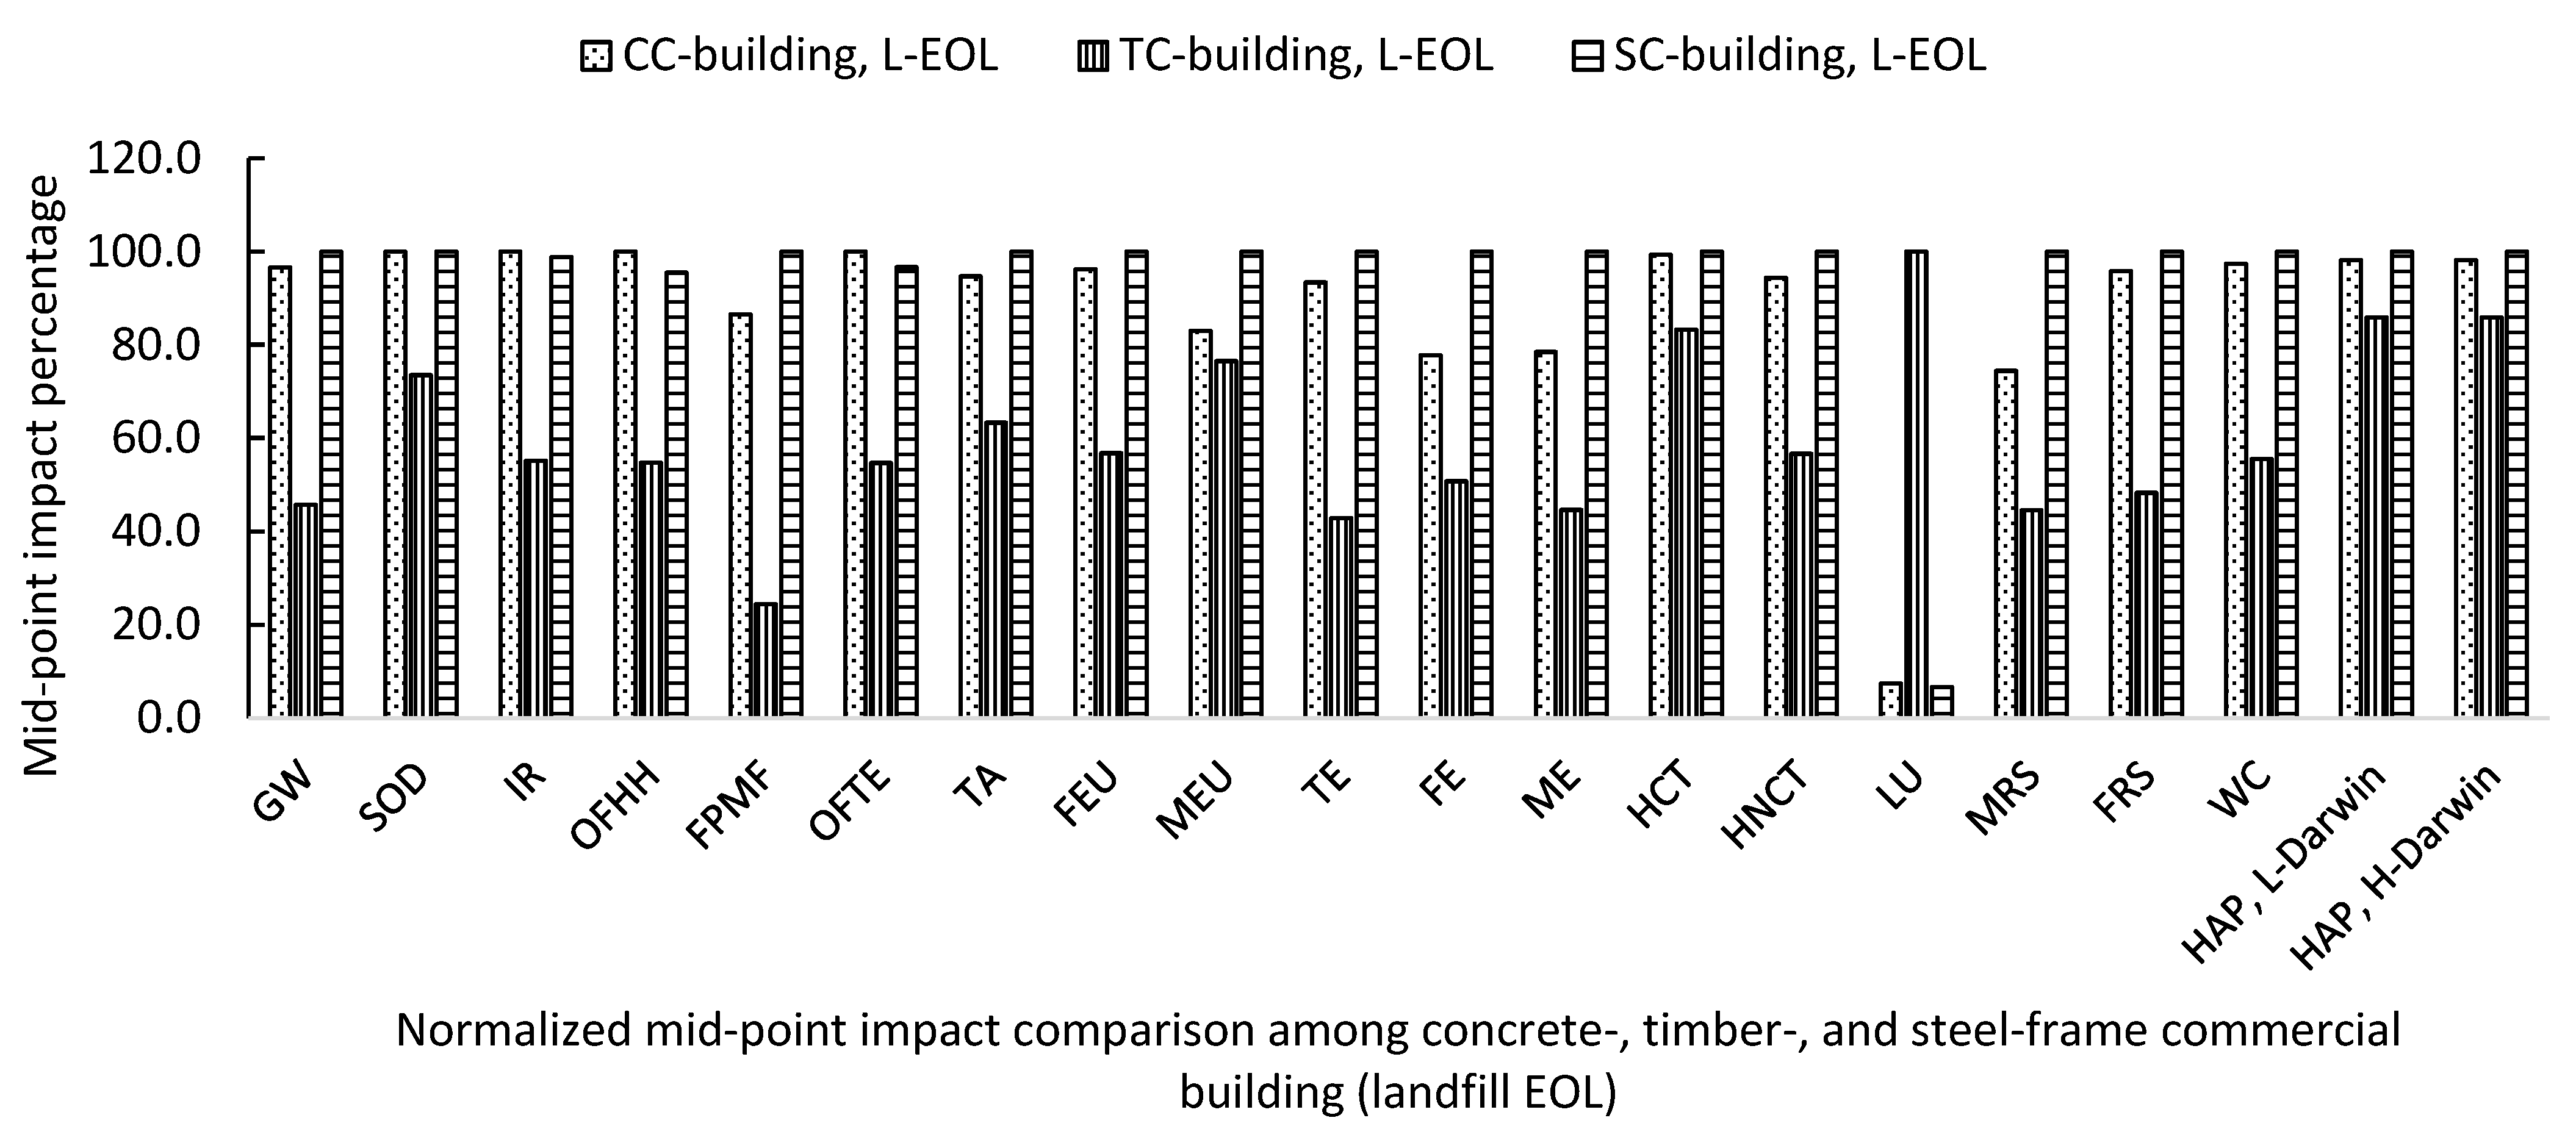
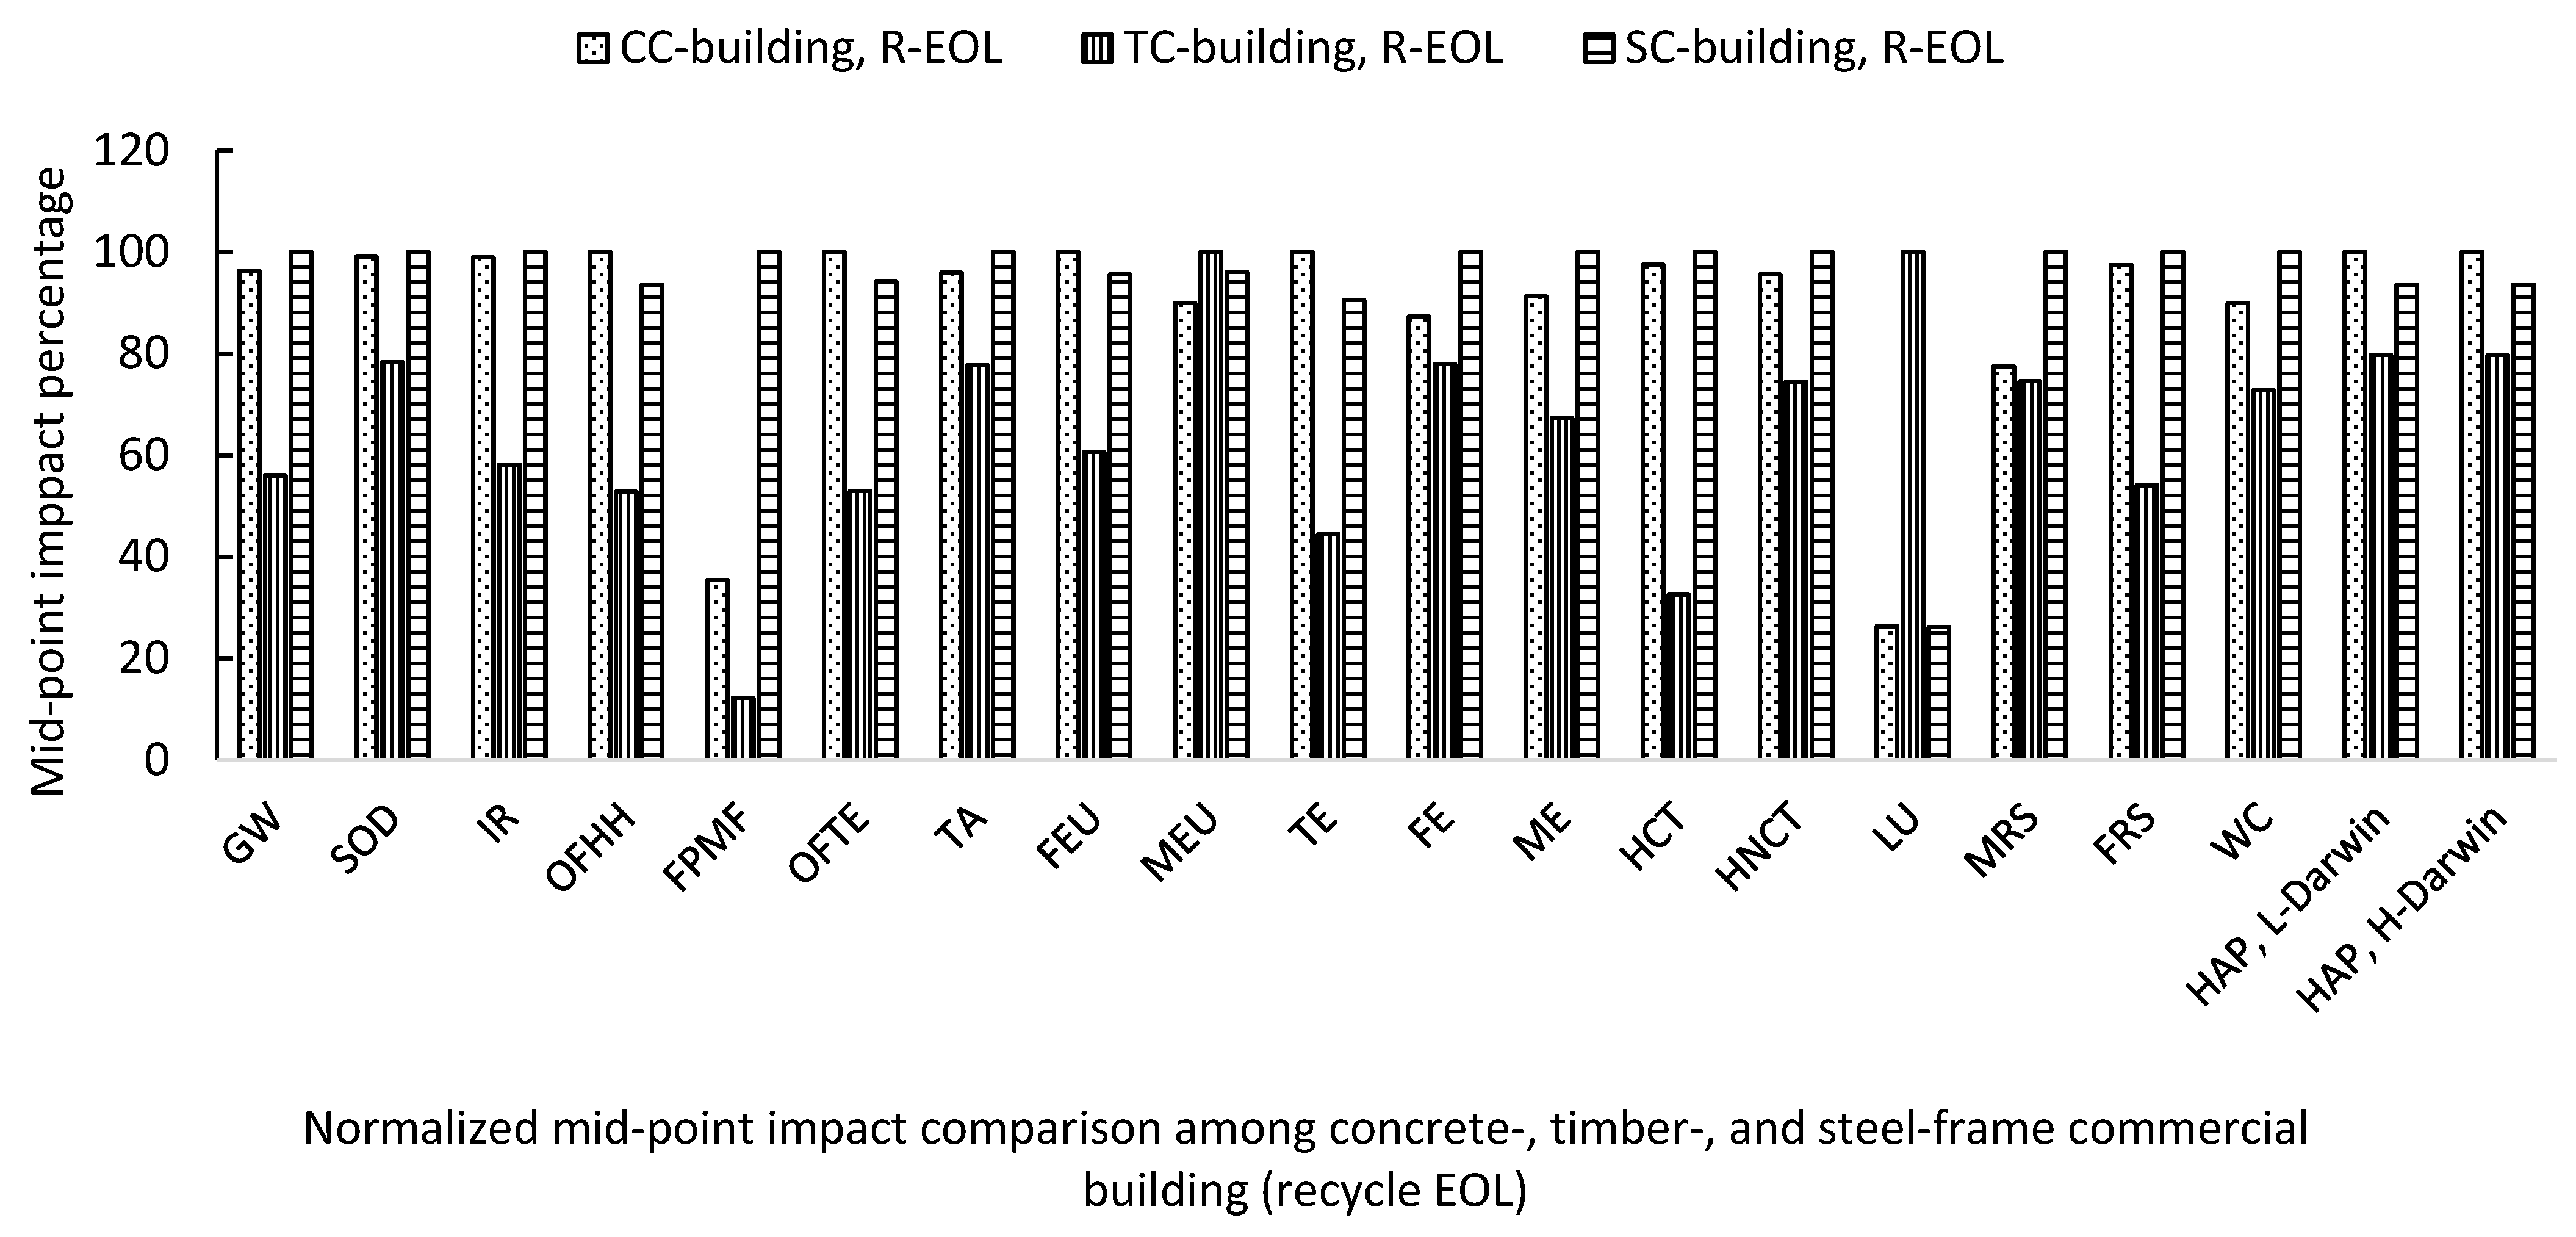
3.1.1. Midpoint Impact Assessment

To compare the material impact and the end-of-life (EOL) processes of building material, four scenarios are analysed:
  • Residential buildings using landfill EOL.
  • Residential buildings using recycled EOL.
  • Commercial buildings using landfill EOL.
  • Commercial buildings using recycled EOL.
In scenario 1, the results indicate that steel-frame residential building construction has the highest environmental impact compared to concrete- and timber-frame houses (Figure 4). Out of 20 impact categories, except ozone formation (human health and terrestrial ecosystem), land use, and noise impact, residential building construction has the highest impact using landfill end-of-life. Steel manufacturing requires a significant amount of energy, contributing substantially to these environmental impacts. However, concrete transport is carried out in trucks with a lower carrying capacity, resulting in more trips and a higher impact on HAP in Darwin. Steel fabrication and concrete factories are assumed to be 500km and 100km from the construction site. Consequently, noise impact is nearly identical for steel and concrete building construction. The total number of HAP for concrete, timber, and steel structures in low-populated areas of Darwin was 2946, 2663, and 2939 people, respectively (Table S4). The totals for highly populated areas in Darwin were 19,342, 17,449, and 19,260 people, respectively. Timber buildings generally have 25-75% lower impacts than steel-frame construction, except for land use and the impact on HAP (Figure 4). Timber extraction from forests has a significant impact on land use, resulting in the highest negative impact compared to concrete- and steel-frame structures. Additionally, the noise impact from timber construction is 90% of that of concrete- and steel-frame construction.
In Scenario 2 (recycle at end-of-life), nearly 50% of the impact was reduced for concrete-, timber-, and steel-frame residential building construction compared to the landfill scenario (Figure 5). Under the landfill scenario, the end-of-life processes contribute significantly to global warming, ionising radiation, ozone formation, acidification, freshwater eutrophication, human carcinogenic toxicity, fossil resource scarcity, and water consumption. Recycling mitigates these effects, with recycled concrete reducing fine particulate matter formation by 73% (Table S4), while recycled timber reduces human carcinogenic toxicity and land use impact by 80% (Table S4).
However, despite the overall reduction in environmental impact, the recycling process leads to higher noise-related effects due to the increased transportation distances and handling activities. As a result, the total number of HAP increased across all building types. For low-populated areas in Darwin, the HAP values for concrete, timber, and steel structures under the recycling scenario were 3622, 2937, and 3513, respectively—higher than in the landfill scenario, where the values were lower due to the reduced transport movement. Similarly, in highly populated areas, the recycling scenario resulted in HAP values of 23,734, 19,249, and 23,025 for concrete, timber, and steel, respectively, whereas the landfill scenario resulted in lower exposure levels (Table S4).
In scenario 3, landfill end-of-life was chosen for commercial concrete, timber, and steel-frame building construction (Figure 6). Similarly to residential buildings with landfill EOL, steel-frame construction had the highest impact in all categories except land use and noise impact. Commercial concrete buildings are primarily responsible for stratospheric ozone depletion, ionising radiation, and ozone formation. Timber frame construction has the highest impact on land use. In commercial steel-frame buildings, an increase in steel amounts led to higher impacts on HAP due to the long-distance traffic movement required for steel extraction and manufacture. The number of HAP was 21,072 for steel-, 20,676 for concrete-, and 18,089 for timber-frame buildings (Table S4).
Scenario 4 (recycling end-of-life) significantly reduces the impact, following a pattern similar to that of residential buildings (Scenario 2) (Figure 7). By applying the recycling scenario, carbon emissions, ionising radiation, ozone formation, freshwater eutrophication, terrestrial acidification, eco toxicity, fossil fuel consumption, and water consumption were reduced by nearly 50% (Table S4). Recycling end-of-life materials has a less significant impact on the scarcity of resources for timber-frame construction. Due to the increased traffic movement required for recycling, the number of people who are highly annoyed increases for all building structures. The total number of HAP was 23,880 for steel-, 25,508 for concrete-, and 20,333 for timber-frame buildings (Table S4). The results indicate that commercial concrete structures have the highest noise impact compared to other types of structures.

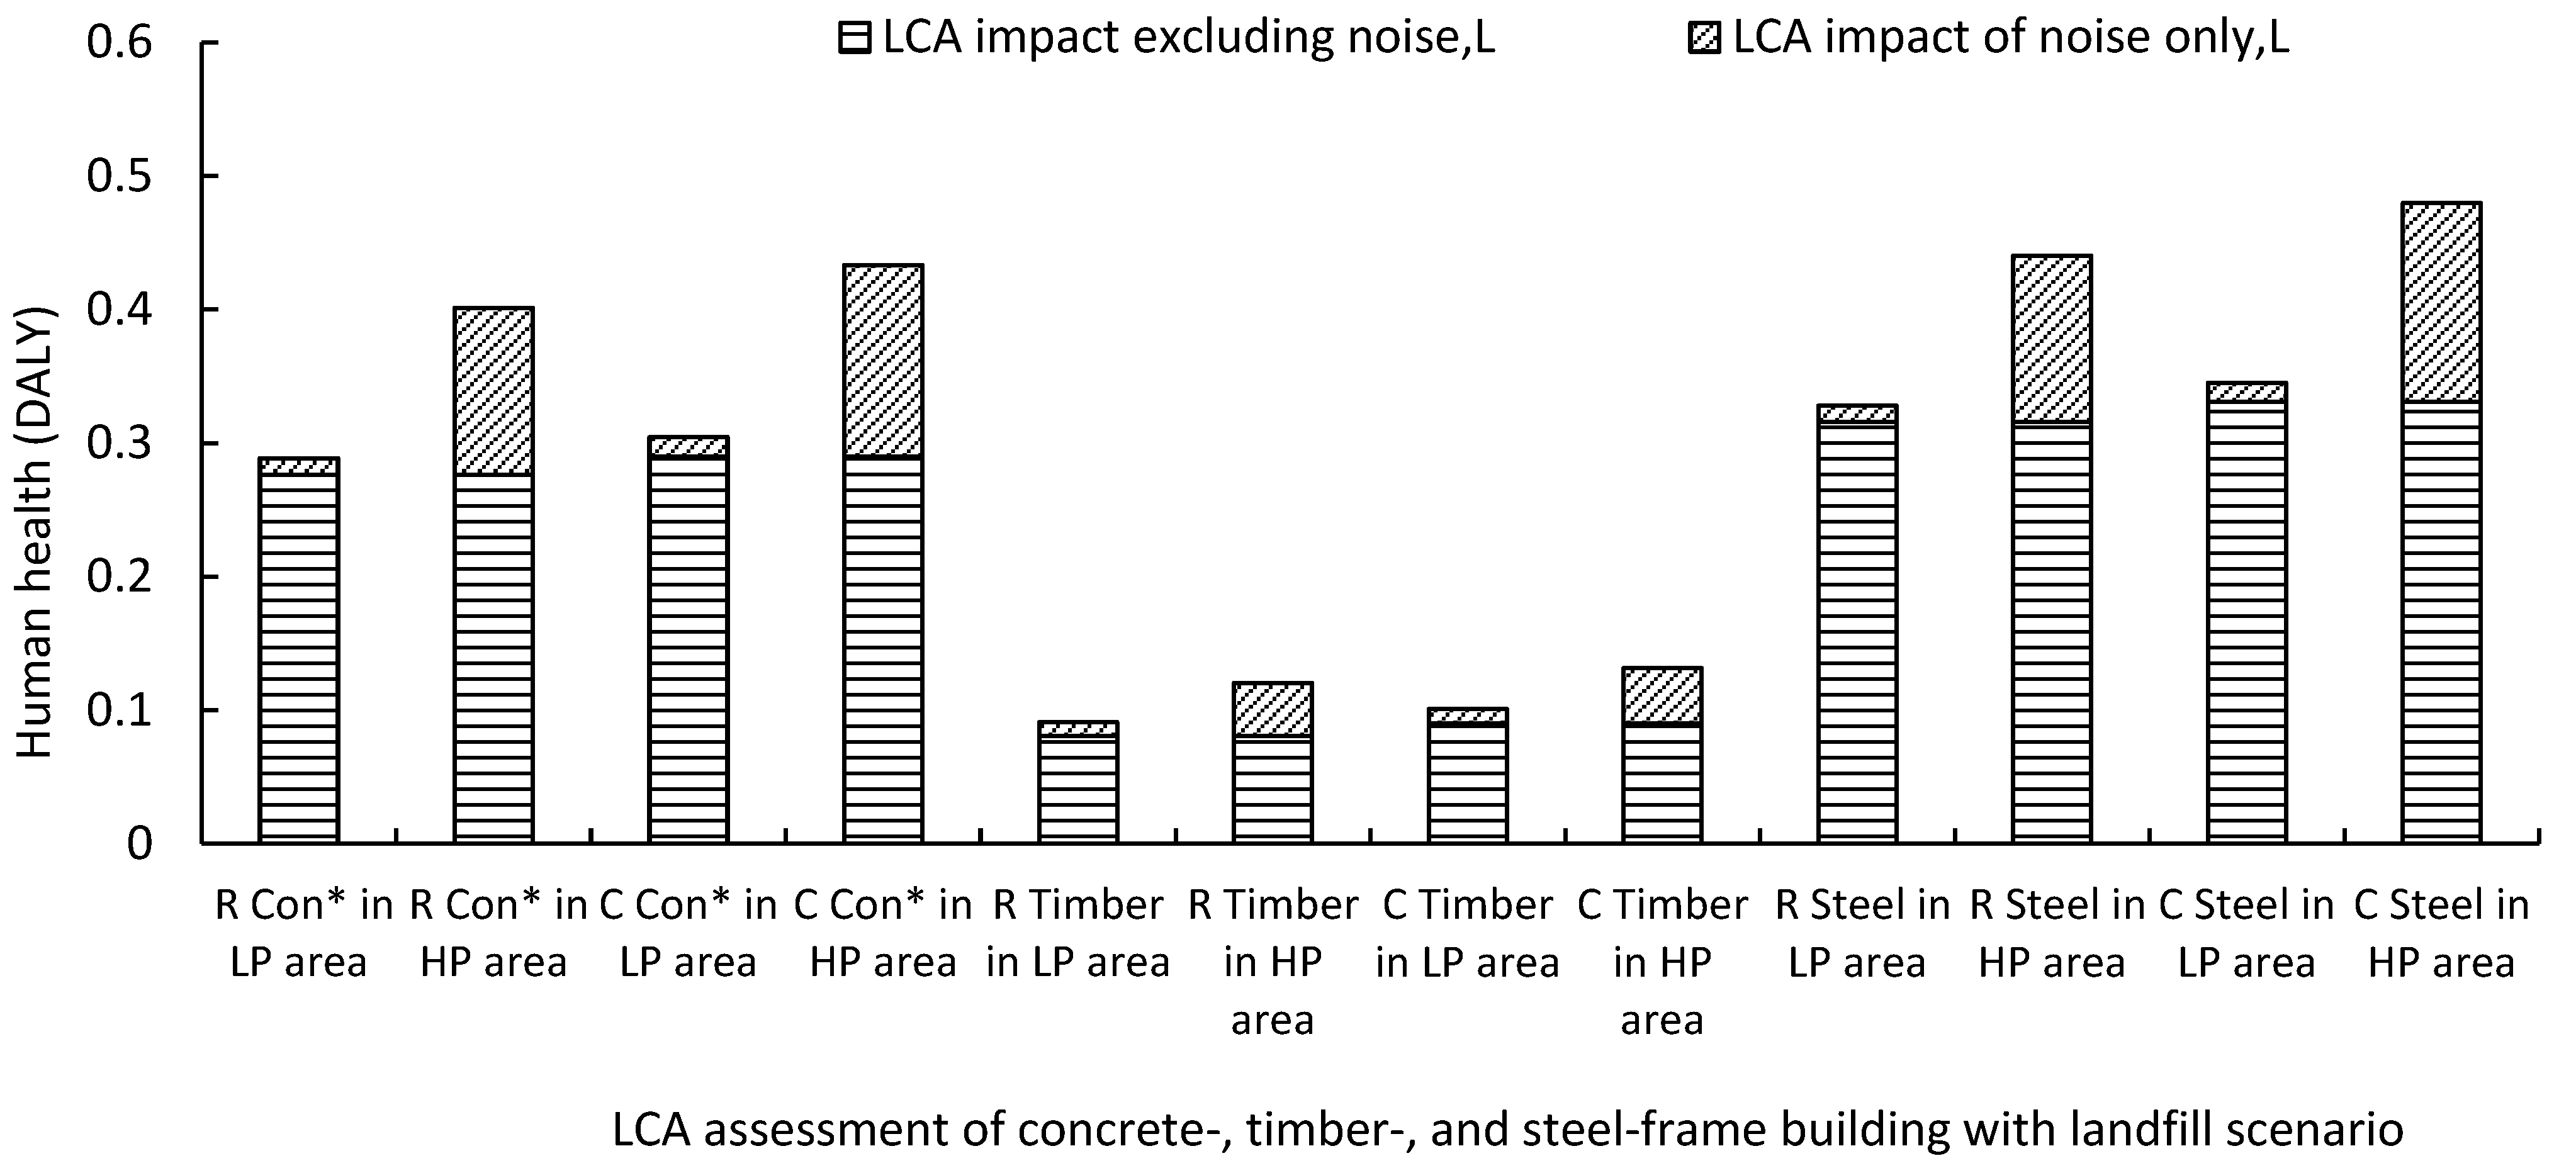
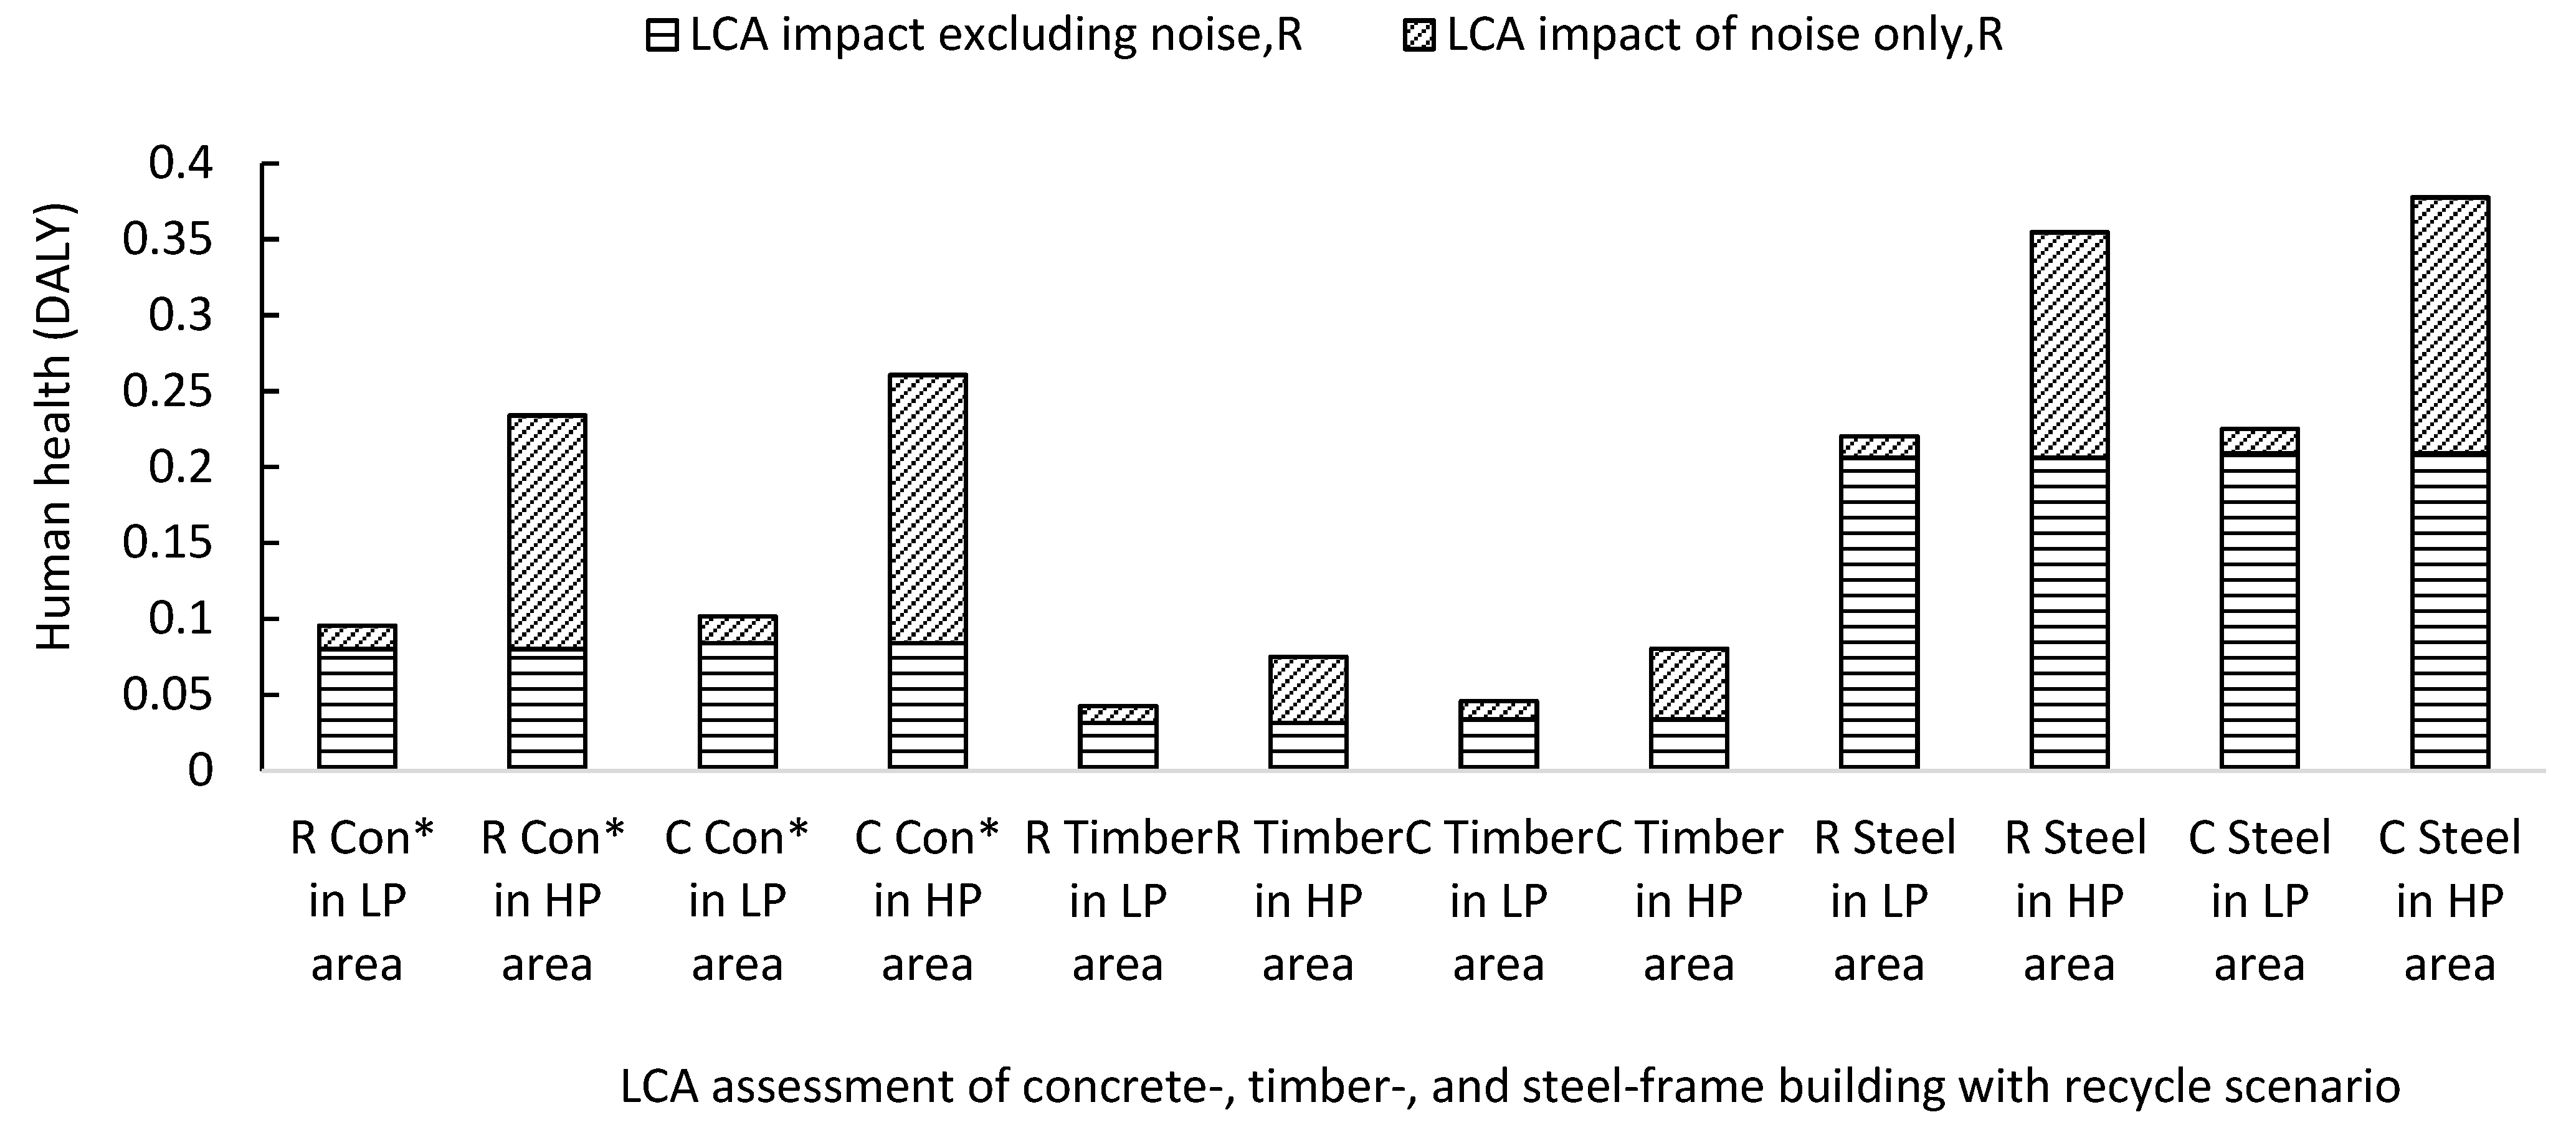
3.1.2. EndPoint Impact Assessment

The endpoint impact assessment is expressed in Disability-Adjusted Life Years (DALYs). Conducting an endpoint impact calculation in the Life Cycle Assessment (LCA) is vital as it translates complex environmental data into comprehensible metrics, facilitating informed decision-making. Endpoint assessments offer a comprehensive view of the environmental footprint of products and services by aggregating midpoint impacts into broader categories, including human health, ecosystem quality, and resource depletion. Using the ReCiPe 2016 method, the endpoint impacts for concrete-, timber-, and steel-frame building constructions were assessed. The effect of these structures on residential and commercial buildings was evaluated. A comparative analysis was conducted between landfill versus recycling scenarios for these building structures.
Without considering noise impact, the endpoint impacts for residential concrete-, timber-, and steel-frame buildings are 0.276, 0.0809, and 0.316 DALY, respectively (Figure 8). These results indicate that the steel-frame building has the highest environmental impact under the landfill scenario compared to concrete and timber. When considering noise impact, the total impact increases with population density. For a low-population area in Darwin, the total impact of residential concrete buildings is 0.2885 DALY, whereas in a highly populated area, it is 0.401 DALY. The results suggest that population density has a significant influence on the noise-integrated LCA method. In low-population areas, noise accounts for 4% of the impact of residential building construction, whereas in high-population areas, noise contributes 31%. Steel-frame residential buildings exhibit a similar pattern, with impacts of 0.328 and 0.440 DALY in low- and high-population areas, respectively. For timber-frame residential buildings, the total impacts are 0.091 and 0.1204 DALY for Darwin’s low- and high-density populated areas, respectively, indicating that noise can increase the impact by 11–33% for these buildings. However, steel-frame residential buildings consistently show the highest LCA impact, regardless of noise integration.
In the recycling scenario (Scenario 2), the endpoint impacts are lower for each type of residential building construction (Figure 9). Without considering noise impact, the endpoint impacts of concrete, timber, and steel are 0.08, 0.032, and 0.21 DALY, respectively. Compared to the landfill scenario, these reductions represent decreases of 71%, 61%, and 35% in concrete, timber, and steel, respectively. However, the impact of noise is higher due to the increased distance required for traffic to access recycling activities. In low-population areas, noise increases the impacts by 16%, 26%, and 6% for concrete-, timber-, and steel-frame buildings, respectively. Noise impact also increased 66%, 58%, and 42% for concrete-, timber-, and steel-frame construction in highly populated areas in Darwin. Residential steel buildings have the highest noise-integrated LCA impact in recycling scenarios compared to timber- and concrete-frame buildings. However, the difference in noise impact between concrete- and steel-frame buildings is insignificant. Due to material impact, steel-frame buildings exhibit the highest impacts compared to other buildings. Integrating noise impact, steel-frame buildings remain the most environmentally impactful type of construction.
Concrete and steel structures exhibit similar LCA impact patterns for commercial buildings with landfill end-of-life (EOL) scenarios (scenario 3). This result indicates that noise in landfill scenarios carries a 4–12% impact in low-population areas, irrespective of building materials and classifications. In contrast, noise impact accounts for 39–46% in high-population areas regardless of building materials and classifications.
For commercial buildings in the recycle scenarios (scenario 4), all buildings showed slightly higher impacts than in the landfill scenarios. Excluding noise, the LCA impacts of concrete-, timber-, and steel-frame buildings for commercial buildings were 1–7% higher than for residential buildings. Integrating noise increased total impacts by 2–11% compared to residential buildings (Figure 9). Noise-integrated LCA impacts were reduced by 35–67% and 21–40% compared to the landfill scenario (scenario 3) in low-populated and high-populated areas, relatively. In this scenario, noise impact was higher for concrete structures. However, the material impact was significantly higher for steel-frame buildings. Consequently, steel-frame buildings had the highest impact in this scenario, while timber was the least impactful building construction, irrespective of noise inclusion.

4. Limitation

This research has limitations, including constraints related to the database, geographic location, and temporal scale. The Ecoinvent database, recognised as a comprehensive global resource, was utilised due to the lack of a suitable Australian-based database. Using an Australian-specific database could potentially provide a more accurate assessment of the impact. Furthermore, the selected locations in Darwin do not exhibit exceptional meteorological conditions. Variations in geographic location can significantly affect live, wind, and earthquake loads, influencing structural design and material quantities. Consequently, these results are only applicable to similar design types, construction methods, and materials used within the same region, specifically for buildings constructed within a 10- to 15-year timeframe. Several assumptions were made for noise calculations, including the exclusion of background noise and noise reflection. While a steady-state analysis assumption was employed, it is essential to note that real-world conditions are dynamic and subject to continuous change. Additionally, it was assumed that the pavement is default asphalt and that the number of vehicles per hour is the same in both directions. However, this noise impact cannot be used for other geographic regions or building types.

5. Conclusions

This research highlights the significant environmental impacts of various building materials—concrete, timber, and steel—across different end-of-life scenarios, with a novel focus on integrating noise into the Life Cycle Assessment (LCA). While the LCA has been widely used to assess the environmental footprint of buildings, its conventional framework has largely overlooked noise pollution. This study addresses this gap by incorporating noise as an indicator of impact in high-rise building assessments.
The findings reveal that steel-frame residential buildings exhibit the highest environmental impacts under landfill scenarios due to the energy-intensive nature of steel production. In contrast, timber-frame structures demonstrate the lowest overall environmental and noise impacts. Recycling significantly reduces environmental effects across all impact categories (by 20–79%); however, it also increases noise pollution due to additional transportation requirements, particularly in densely populated areas.
For commercial buildings, the environmental impacts are generally higher than for residential structures due to the increased material usage. Concrete buildings contribute the most to noise impacts in commercial settings, while steel-frame commercial buildings in landfill scenarios have the highest overall environmental burden. Recycling reduces material impacts but elevates noise levels, emphasising the trade-offs between sustainability strategies.
The Disability-Adjusted Life Year (DALY) metric confirms that noise is a critical factor in environmental assessments. In low-population areas, noise contributes 4–5% of the total impacts for concrete- and steel-frame structures, rising to 11% for timber buildings. However, in high-population areas, noise impacts surge to 28–33%, highlighting the necessity of integrating noise into the LCA for a more comprehensive evaluation of building sustainability.
A key contribution of this study is demonstrating that noise pollution is not just a secondary concern but a significant environmental factor that must be addressed alongside conventional impact categories such as carbon emissions and resource depletion. A more holistic LCA approach that includes noise can improve decision-making in sustainable construction, helping policymakers, architects, builders, and clients select materials and end-of-life strategies that minimise environmental and health impacts.
Future research should build on this foundation by incorporating social and economic indicators into noise-integrated LCA frameworks. Additionally, analysing both embodied and operational energy within a noise-inclusive framework would provide a more complete picture of sustainability in high-rise construction. By integrating noise into environmental assessments, the construction industry can better align with global sustainability goals, enhance green building certification processes, and contribute to creating healthier and more liveable urban environments.

Supplementary Materials

The following supporting information can be downloaded at: https://www.mdpi.com/article/10.3390/su17094040/s1, Table S1: Material quanity of concrete, timber and steel-frame building. Table S2: Types of transportation system with required distance for building materials transfer. Table S3: Variation of materials transportation distance with respect to end-of-life. Table S4: Midpoint impact of concrete, timber and steel-frame residential and commercial building. Table S5: Endpoint impact of concrete, timber and steel-frame building construction.

Author Contributions

Conceptualisation, A.R. (Ahmad Rashedi) and T.K.; methodology, R.S.; software, R.S.; validation, T.K. and A.R. (Ali Rajabipour); formal analysis, R.S.; investigation, R.S.; resources, R.S.; data curation, R.S.; writing—original draft preparation, R.S.; writing—review and editing, T.K. and R.S.; visualisation, T.K. and R.S.; supervision, A.R. (Ahmad Rashedi) and T.K. All authors have read and agreed to the published version of the manuscript.

Funding

This research received no external funding.

Institutional Review Board Statement

Not applicable.

Informed Consent Statement

Not applicable.

Data Availability Statement

Data is contained within the article and Supplementary Materials.

Acknowledgments

This work is supported through an Australian Government Research Training Program Scholarship.

Conflicts of Interest

The authors declare that they have no known competing financial interests or personal relationships that could have appeared to influence the work reported in this review article.

Nomenclature

LCAlife cycle assessment
LCIAlife cycle impact assessment
DALYdisability-adjusted life years
BIMbuilding information modelling
CFcharacterisation factor
DWdisability weight
HAPhighly annoyed person
HSDPhighly sleep-deprived person

References

  1. Fufa, S.M.; Skaar, C.; Gradeci, K.; Labonnote, N. Assessment of greenhouse gas emissions of ventilated timber wall constructions based on parametric LCA. J. Clean. Prod. 2018, 197, 34–46. [Google Scholar] [CrossRef]
  2. Giama, E.; Papadopoulos, A.M. Assessment tools for the environmental evaluation of concrete, plaster and brick elements production. J. Clean. Prod. 2015, 99, 75–85. [Google Scholar] [CrossRef]
  3. Yang, Q.; Kong, L.; Tong, H.; Wang, X. Evaluation model of environmental impacts of insulation building envelopes. Sustainability 2020, 12, 2258. [Google Scholar] [CrossRef]
  4. Ahn, Y.H.; Jung, C.W.; Suh, M.; Jeon, M.H. Integrated Construction Process for Green Building. Procedia Eng. 2016, 145, 670–676. [Google Scholar] [CrossRef]
  5. Glavinich, T.E. Contractor’s Guide to Green Building Construction: Management, Project Delivery, Documentation, and Risk Reduction; John Wiley: Hoboken, NJ, USA, 2008; ISBN 9780470056219. [Google Scholar]
  6. Vierra, S. Green Building Standards and Certification System. 2018. Available online: https://globalgbc.org/wp-content/uploads/2022/07/034_green-building-standards-and-certification-system.pdf (accessed on 12 March 2025).
  7. Hwang, B.G.; Shan, M.; Tan, E.K. Investigating Reworks in Green Building Construction Projects: Magnitude, Influential Factors, and Solutions. Int. J. Environ. Res 2016, 10, 499–510. [Google Scholar]
  8. Khasreen, M.M.; Banfill, P.F.G.; Menzies, G.F. Life-cycle assessment and the environmental impact of buildings: A review. Sustainability 2009, 1, 674–701. [Google Scholar] [CrossRef]
  9. Reeder, L. Guide to Rating Green Buildings; Wiley: Hoboken, NJ, USA, 2010; ISBN 9780470401941. [Google Scholar]
  10. Amoruso, F.M.; Schuetze, T. Life cycle assessment and costing of carbon neutral hybrid-timber building renovation systems: Three applications in the Republic of Korea. Build. Environ. 2022, 222, 109395. [Google Scholar] [CrossRef]
  11. Russell, D.J.F.; Hastie, G.D.; Thompson, D.; Janik, V.M.; Hammond, P.S.; Scott-Hayward, L.A.S.; Matthiopoulos, J.; Jones, E.L.; McConnell, B.J. Avoidance of wind farms by harbour seals is limited to pile driving activities. J. Appl. Ecol. 2016, 53, 1642–1652. [Google Scholar] [CrossRef]
  12. Periodica, P. Acoustical Aspects of the Reconstruction of a Historical Building with a Closed Courtyard. Pollack Period. 2020, 15, 197–208. [Google Scholar] [CrossRef]
  13. Felicioni, L.; Gaspari, J.; Veselka, J.; Malík, Z. A comparative cradle-to-grave life cycle approach for addressing construction design choices: An applicative case study for a residential tower in Aalborg, Denmark. Energy Build. 2023, 298, 113557. [Google Scholar] [CrossRef]
  14. Duan, Z.; Huang, Q.; Sun, Q.; Zhang, Q. Comparative life cycle assessment of a reinforced concrete residential building with equivalent cross laminated timber alternatives in China. J. Build. Eng. 2022, 62, 105357. [Google Scholar] [CrossRef]
  15. Allan, K.; Phillips, A.R. Comparative cradle-to-grave life cycle assessment of low and mid-rise mass timber buildings with equivalent structural steel alternatives. Sustainability 2021, 13, 3401. [Google Scholar] [CrossRef]
  16. Kerr, J.; Rayburg, S.; Neave, M.; Rodwell, J. Comparative Analysis of the Global Warming Potential (GWP) of Structural Stone, Concrete and Steel Construction Materials. Sustainability 2022, 14, 9019. [Google Scholar] [CrossRef]
  17. Hart, J.; D’Amico, B.; Pomponi, F. Whole-life embodied carbon in multistory buildings: Steel, concrete and timber structures. J. Ind. Ecol. 2021, 25, 403–418. [Google Scholar] [CrossRef]
  18. Hegeir, O.A.; Kvande, T.; Stamatopoulos, H.; Bohne, R.A. Comparative Life Cycle Analysis of Timber, Steel and Reinforced Concrete Portal Frames: A Theoretical Study on a Norwegian Industrial Building. Buildings 2022, 12, 573. [Google Scholar] [CrossRef]
  19. de Souza, D.M.; Lafontaine, M.; Charron-Doucet, F.; Bengoa, X.; Chappert, B.; Duarte, F.; Lima, L. Comparative Life Cycle Assessment of ceramic versus concrete roof tiles in the Brazilian context. J. Clean. Prod. 2015, 89, 165–173. [Google Scholar] [CrossRef]
  20. Kern, A.P.; Amor, L.V.; Angulo, S.C.; Montelongo, A. Factors influencing temporary wood waste generation in high-rise building construction. Waste Manag. 2018, 78, 446–455. [Google Scholar] [CrossRef]
  21. Iuorio, O.; Gigante, A.; De Masi, R.F. Life Cycle Analysis of Innovative Technologies: Cold Formed Steel System and Cross Laminated Timber. Energies 2023, 16, 586. [Google Scholar] [CrossRef]
  22. Tighnavard Balasbaneh, A.; Ramli, M.Z. A comparative life cycle assessment (LCA) of concrete and steel-prefabricated prefinished volumetric construction structures in Malaysia. Environ. Sci. Pollut. Res. 2020, 27, 43186–43201. [Google Scholar] [CrossRef]
  23. Vares, S.; Hradil, P.; Sansom, M.; Ungureanu, V. Economic potential and environmental impacts of reused steel structures. Struct. Infrastruct. Eng. 2020, 16, 750–761. [Google Scholar] [CrossRef]
  24. Li, X.; Song, Z.; Wang, T.; Zheng, Y.; Ning, X. Health impacts of construction noise on workers: A quantitative assessment model based on exposure measurement. J. Clean. Prod. 2016, 135, 721–731. [Google Scholar] [CrossRef]
  25. Shi, J.; Hu, J.; Ma, M.; Wang, H. An environmental impact analysis method of machine-tool cutting units based on LCA. J. Eng. Des. Technol. 2021, 19, 1192–1206. [Google Scholar] [CrossRef]
  26. Miiller-wenk, R. A Method to Include in LCA Road Traffic Noise and its Health Effects. Int. J. Life Cycle Assess. 2004, 9, 76–85. [Google Scholar] [CrossRef]
  27. Esmeray, E.; Eren, S. GIS—Based mapping and assessment of noise pollution. Environ. Dev. Sustain. 2021, 23, 15413–15431. [Google Scholar] [CrossRef] [PubMed]
  28. Ongel, A. Inclusion of Noise in Environmental Assessment of Road Transportation. Environ. Model. Assess. 2016, 21, 181–192. [Google Scholar] [CrossRef]
  29. Alwan, Z.; Jones, P. The importance of embodied energy in carbon footprint assessment. Struct. Surv. 2014, 32, 49–60. [Google Scholar] [CrossRef]
  30. Mukkavaara, J.; Sandberg, M.; Sandberg, K.; Pousette, A.; Norén, J. Sustainability evaluation of timber dwellings in the north of Sweden based on environmental impact and optimization of energy and cost. Procedia Manuf. 2020, 44, 76–83. [Google Scholar] [CrossRef]
  31. Röck, M.; Hollberg, A.; Habert, G.; Passer, A. LCA and BIM: Visualization of environmental potentials in building construction at early design stages. Build. Environ. 2018, 140, 153–161. [Google Scholar] [CrossRef]
  32. Santos, R.; Costa, A.A.; Silvestre, J.D.; Pyl, L. Development of a BIM-based environmental and economic life cycle assessment tool. J. Clean. Prod. 2020, 265, 121705. [Google Scholar] [CrossRef]
  33. Barclay, M.; Kang, J.; Sharples, S. Combining noise mapping and ventilation performance for non-domestic buildings in an urban area. Build. Environ. 2012, 52, 68–76. [Google Scholar] [CrossRef]
  34. Alawode, A.; Rajagopalan, P. Feasibility of net zero energy high rise apartment buildings in Australia. Sol. Energy 2022, 231, 158–174. [Google Scholar] [CrossRef]
  35. Daly, D.; Cooper, P.; Ma, Z. Understanding the risks and uncertainties introduced by common assumptions in energy simulations for Australian commercial buildings. Energy Build. 2014, 75, 382–393. [Google Scholar] [CrossRef]
  36. Budig, M.; Heckmann, O.; Hudert, M.; Boon Ng, A.Q. Next Generation Residential High-Rise: Evaluating and comparing the Global Warming Potential of different structural systems and materials. In Proceedings of the IASS Annual Symposia, Barcelona, Spain, 7–10 October 2019; International Association for Shell and Spatial Structures (IASS): Madrid, Spain, 2019; Volume 2019, pp. 1–8. [Google Scholar]
  37. Najjar, M.; Figueiredo, K.; Palumbo, M.; Haddad, A.; Hammad, A.W.A.; Haddad, A.; Su, S.; Wang, Q.; Han, L.; Hong, J.; et al. Integrated optimization with building information modeling and life cycle assessment for generating energy efficient buildings. Appl. Energy 2019, 250, 1366–1382. [Google Scholar] [CrossRef]
  38. Wang, J.; Wu, H.; Duan, H.; Zillante, G.; Zuo, J.; Yuan, H. Combining life cycle assessment and Building Information Modelling to account for carbon emission of building demolition waste: A case study. J. Clean. Prod. 2018, 172, 3154–3166. [Google Scholar] [CrossRef]
  39. Wang, J.; Wu, H.; Duan, H.; Zillante, G.; Zuo, J.; Yuan, H.; Su, S.; Wang, Q.; Han, L.; Hong, J.; et al. Calculation of a building’s life cycle carbon emissions based on Ecotect and building information modeling. J. Clean. Prod. 2016, 112, 453–465. [Google Scholar] [CrossRef]
  40. Zou, C.; Zhu, R.; Tao, Z.; Ouyang, D.; Chen, Y. Evaluation of building construction-induced noise and vibration impact on residents. Sustainability 2020, 12, 1579. [Google Scholar] [CrossRef]
  41. Marcinkowski, A.; Kopania, J. Environmental performance of noise reduction system in cogeneration plants—A life cycle assessment study. Energies 2021, 14, 1324. [Google Scholar] [CrossRef]
  42. Goretti, M.; Cotana, F. Footprint analysis concerning noise: Approaches, tools and opportunities. In Proceedings of the INTERNOISE 2014—43rd International Congress and Exposition on Noise Control Engineering, Fort Lauderdale, FL, USA, 8–10 September 2014; pp. 1–10. [Google Scholar]
  43. Cabeza, L.F.; Rincón, L.; Vilariño, V.; Pérez, G.; Castell, A. Life cycle assessment (LCA) and life cycle energy analysis (LCEA) of buildings and the building sector: A review. Renew. Sustain. Energy Rev. 2014, 29, 394–416. [Google Scholar] [CrossRef]
  44. Sharma, A.; Saxena, A.; Sethi, M.; Shree, V. Varun Life cycle assessment of buildings: A review. Renew. Sustain. Energy Rev. 2011, 15, 871–875. [Google Scholar] [CrossRef]
  45. Janjua, S.Y.; Sarker, P.K.; Biswas, W.K. Sustainability assessment of a residential building using a life cycle assessment approach. Chem. Eng. Trans. 2019, 72, 19–24. [Google Scholar] [CrossRef]
  46. AS 3600. Available online: https://research-repository.griffith.edu.au/server/api/core/bitstreams/1d352b3a-8d66-4b97-bfb2-e4d86e4959f2/content (accessed on 2 April 2025).
  47. AS 4100. Available online: https://www.standards.org.au/standards-catalogue/standard-details?designation=AS-4100-2020 (accessed on 2 April 2025).
  48. AS 1684. Available online: https://www.scribd.com/document/515288316/AS1684-1-Residential-timber-frame-construction (accessed on 2 April 2025).
  49. Roy, K.; Dani, A.A.; Ichhpuni, H.; Fang, Z.; Lim, J.B.P. Improving Sustainability of Steel Roofs: Life Cycle Assessment of a Case Study Roof. Appl. Sci. 2022, 12, 5943. [Google Scholar] [CrossRef]
  50. Ortiz, O.; Castells, F.; Sonnemann, G. Sustainability in the construction industry: A review of recent developments based on LCA. Constr. Build. Mater. 2009, 23, 28–39. [Google Scholar] [CrossRef]
  51. Fnais, A.; Rezgui, Y.; Petri, I.; Beach, T.; Yeung, J.; Ghoroghi, A.; Kubicki, S. The application of life cycle assessment in buildings: Challenges, and directions for future research. Int. J. Life Cycle Assess. 2022, 27, 627–654. [Google Scholar] [CrossRef]
  52. Rajendran, P.; Seow, T.W.; Goh, K.C. Bulding Information Modeling (BIM) in Design Stage to Assist in Time, Cost and Quality in Construction Innovation. Int. J. Concept. Manag. Soc. Sci. 2014, 2, 52–55. [Google Scholar]
  53. Bueno, C.; Pereira, L.M.; Fabricio, M.M. Life cycle assessment and environmental-based choices at the early design stages: An application using building information modelling. Archit. Eng. Des. Manag. 2018, 14, 332–346. [Google Scholar] [CrossRef]
  54. Sultana, R.; Rashedi, A.; Khanam, T.; Jeong, B.; Hosseinzadeh-Bandbafha, H.; Hussain, M. Life Cycle Environmental Sustainability and Energy Assessment of Timber Wall Construction: A Comprehensive Overview. Sustainability 2022, 14, 4161. [Google Scholar] [CrossRef]
  55. Khanam, T.; Khalid, F.; Manzoor, W.; Id, A.R.; Hadi, R.; Ullah, F.; Rehman, F.; Akhtar, A.; Karthik Babu, N.B.; Hussainid, M. Environmental sustainability assessment of biodiesel production from Jatropha curcas L. seeds oil in Pakistan. PLoS ONE 2021, 16, e0258409. [Google Scholar] [CrossRef]
  56. Rashedi, A.; Khanam, T.; Jonkman, M. On reduced consumption of fossil fuels in 2020 and its consequences in global environment and exergy demand. Energies 2020, 13, 6048. [Google Scholar] [CrossRef]
  57. Rashedi, A.; Khanam, T. Life cycle assessment of most widely adopted solar photovoltaic energy technologies by mid-point and end-point indicators of ReCiPe method. Environ. Sci. Pollut. Res. 2020, 27, 29075–29090. [Google Scholar] [CrossRef]
  58. Lavandier, C.; Meyer, R.; Benetto, E. Characterization of damages from road traf fi c noise in life cycle impact assessment: A method based on emission and propagation models. J. Clean. Prod. 2019, 231, 121–131. [Google Scholar] [CrossRef]
  59. Cucurachi, S.; Heijungs, R. Characterisation factors for life cycle impact assessment of sound emissions. Sci. Total Environ. 2014, 468–469, 280–291. [Google Scholar] [CrossRef] [PubMed]
  60. Cucurachi, S.; Hellweg, S.; Schiess, S.; Froemelt, A. Noise footprint from personal land-based mobility. J. Ind. Ecol. 2019, 23, 1028–1038. [Google Scholar] [CrossRef] [PubMed]
  61. Meyer, R.; Meyer, R. Analysis of the different techniques to include noise damage in life cycle assessment. A case study for car tires. Int. J. Life Cycle Assess. 2017, 22, 744–757. [Google Scholar] [CrossRef]
  62. Tokairin, T.; Kitada, T. Study on the Effect of Porous Fence on Air Quality and Traffic Noise Level Around a Double-Decked Road Structure. Environ. Monit. Assess. 2005, 105, 121–143. [Google Scholar] [CrossRef]
  63. Licitra, G.; Ascari, E.; Brambilla, G. Comparative analysis of methods to evaluate urban noise exposure. In Proceedings of the 39th International Congress on Noise Control Engineering 2010, INTER-NOISE 2010, Baltimore, MD, USA, 19–21 April 2010; Volume 3, pp. 2137–2143. [Google Scholar]
  64. ISO 1996-2:1987; Acoustics—Description and Measurement of Environmental Noise—Part 2: Acquisition of Data Pertinent to Land Use. International Organization for Standardization: Geneva, Switzerland, 1987.
  65. Miedema, H.M.E.; Oudshoorn, C.G.M. Annoyance from Transportation Noise: Relationships with Exposure Metrics DNL and DENL and Their Confidence Intervals. Environ. Health Perspect. 2001, 109, 409–416. [Google Scholar] [CrossRef]
  66. Zuo, J.; Pullen, S.; Rameezdeen, R.; Bennetts, H.; Wang, Y.; Mao, G.; Zhou, Z.; Du, H.; Duan, H.; Röck, M.; et al. Green building evaluation from a life-cycle perspective in Australia: A critical review. Renew. Sustain. Energy Rev. 2017, 70, 358–368. [Google Scholar] [CrossRef]
  67. Kobayashi, Y.; Peters, G.M.; Ashbolt, N.J.; Shiels, S.; Khan, S.J. Science of the Total Environment Assessing burden of disease as disability adjusted life years in life cycle assessment. Sci. Total Environ. 2015, 530–531, 120–128. [Google Scholar] [CrossRef]
  68. Garraín, D.; Vidal, R.; Garraín, D.; Franco, V.; Vidal, R.; Moliner, E.; Casanova, S. The Noise Impact Category in Life Cycle Assessment. 2009. Available online: https://www.researchgate.net/publication/47745426 (accessed on 12 March 2025).
  69. Jung, S.; Kang, H.; Choi, J.; Hong, T.; Park, H.S.; Lee, D.E. Quantitative health impact assessment of construction noise exposure on the nearby region for noise barrier optimization. Build. Environ. 2020, 176, 106869. [Google Scholar] [CrossRef]
  70. National Academy of Sciences. Eutrophication: Causes, Consequences, Correctives; Proceedings of a Symposium; National Academy of Sciences: Washington, DC, USA, 1969; pp. 1–661. [Google Scholar]
Figure 1. Floor plan of six-storied high-rise building.
Sustainability 17 04040 g001
Figure 2. Flow chart of the steel-, timber-, and steel-frame building impact assessment.
Sustainability 17 04040 g002
Figure 3. Population distribution of Darwin city. The green line on the map represents an urban road in Darwin City, Northern Territory, measuring 4.5 km in length, which passes through high-density suburbs such as Darwin City, Stuart Park, The Gardens, Parap, and Woolner. The orange line represents a road in low-density areas, spanning 3.3 km and located in Lee Point, Tiwi, and Lyons.
Sustainability 17 04040 g003
Figure 4. Midpoint impact comparison among concrete-, timber-, and steel-frame residential buildings under the landfill scenario. CR = concrete-frame residential; TR = timber-frame residential; SR = steel-frame residential; L-EOL = landfill end-of-life; HAP = highly annoyed people; L-Darwin = low-populated area in Darwin; H-Darwin = highly populated area in Darwin; GW = global warming; SOD = stratospheric ozone depletion; IR = ionic radiation; OFHH = ozone formation, human health; FPMF = fine particulate matter formation; OFTE = ozone formation, terrestrial ecosystems; TA = terrestrial acidification; FEU = freshwater eutrophication; MEU = marine eutrophication; TE = terrestrial eco-toxicity; FE = freshwater eco-toxicity; ME = marine eco-toxicity; HCT = human carcinogenic toxicity; HNCT = human non-carcinogenic toxicity; LU = land use; MRS = mineral resource scarcity; FRS = fossil resource scarcity; WC = water consumption.
Sustainability 17 04040 g004
Figure 5. Midpoint impact comparison among concrete-, timber-, and steel-frame residential buildings with a recycling scenario. CR = concrete-frame residential; TR = timber-frame residential; SR = steel-frame residential; R-EOL = recycle end-of-life; GW = global warming; SOD = stratospheric ozone depletion; IR = ionic radiation; OFHH = ozone formation, human health; FPMF = fine particulate matter formation; OFTE = ozone formation, terrestrial ecosystems; TA = terrestrial acidification; FEU = freshwater eutrophication; MEU = marine eutrophication; TE = terrestrial eco-toxicity; FE = freshwater eco-toxicity; ME = marine eco-toxicity; HCT = human carcinogenic toxicity; HNCT = human non-carcinogenic toxicity; LU = land use; MRS = mineral resource scarcity; FRS = fossil resource scarcity; WC = water consumption; HAP = highly annoyed people; L-Darwin = low-populated area in Darwin; H-Darwin = highly populated area in Darwin.
Sustainability 17 04040 g005
Figure 6. Midpoint impact comparison among concrete-, timber-, and steel-frame commercial buildings under landfill scenarios. CC = concrete-frame commercial; TC = timber-frame commercial; SC = steel-frame commercial; GW = global warming; SOD = stratospheric ozone depletion; IR = ionic radiation; OFHH = ozone formation, human health; FPMF = fine particulate matter formation; OFTE = ozone formation, terrestrial ecosystems; TA = terrestrial acidification; FEU = freshwater eutrophication; MEU = marine eutrophication; TE = terrestrial eco-toxicity; FE = freshwater eco-toxicity; ME = marine eco-toxicity; HCT = human carcinogenic toxicity; HNCT = human non-carcinogenic toxicity; LU = land use; MRS = mineral resource scarcity; FRS = fossil resource scarcity; WC = water consumption; L-EOL = landfill end-of-life; HAP = highly annoyed people; L-Darwin = low-populated area in Darwin; H-Darwin = highly populated area in Darwin.
Sustainability 17 04040 g006
Figure 7. Midpoint impact comparison among concrete-, timber-, and steel-frame commercial buildings under a recycling scenario. CC = concrete-frame commercial; TC = timber-frame commercial; SC = steel-frame commercial; GW = global warming; SOD = stratospheric ozone depletion; IR = ionic radiation; OFHH = ozone formation, human health; FPMF = fine particulate matter formation; OFTE = ozone formation, terrestrial ecosystems; TA = terrestrial acidification; FEU = freshwater eutrophication; MEU = marine eutrophication; TE = terrestrial eco-toxicity; FE = freshwater eco-toxicity; ME = marine eco-toxicity; HCT = human carcinogenic toxicity; HNCT = human non-carcinogenic toxicity; LU = land use; MRS = mineral resource scarcity; FRS = fossil resource scarcity; WC = water consumption; R-EOL = recycle end-of-life; HAP = highly annoyed people; L-Darwin = low-populated area in Darwin; H-Darwin = highly populated area in Darwin.
Sustainability 17 04040 g007
Figure 8. Endpoint LCA impact variation among concrete-, timber-, and steel-frame residential and commercial buildings under landfill scenarios. R = residential; C = commercial; LP = low-populated; HP = highly populated; L = landfill; CON* = concrete.
Sustainability 17 04040 g008
Figure 9. Endpoint LCA impact variation among concrete-, timber-, and steel-frame residential and commercial buildings under a recycling scenario. R = residential; Con* = concrete; C = commercial; LP = low-populated; HP = highly populated; R = recycle.
Sustainability 17 04040 g009
Disclaimer/Publisher’s Note: The statements, opinions and data contained in all publications are solely those of the individual author(s) and contributor(s) and not of MDPI and/or the editor(s). MDPI and/or the editor(s) disclaim responsibility for any injury to people or property resulting from any ideas, methods, instructions or products referred to in the content.

