Article

Using System Dynamics to Analyze Influencing Factors and Emission Reduction Potential of Geothermal Resources Development and Utilization in Tianjin

by
Ruoxi Yuan
1,2,
Guiling Wang
1,2,
Bowen Xu
3,
Sumin Zhao
3,
Xi Zhu
1,2,*,
Wei Zhang
1,2,
Wenjing Lin
1,2 and
Honglei Shi
1,2
1
Institute of Hydrogeology and Environmental Geology, Chinese Academy of Geological Sciences, Shijiazhuang 050061, China
2
Technology Innovation Center for Geothermal & Hot Dry Rock Exploration and Development, Ministry of Natural Resources, Shijiazhuang 050061, China
3
Tianjin Geothermal Exploration and Development Design Institute, Tianjin 300250, China
*
Author to whom correspondence should be addressed.
Sustainability 2025, 17(9), 4005; https://doi.org/10.3390/su17094005
Submission received: 20 February 2025 / Revised: 19 April 2025 / Accepted: 25 April 2025 / Published: 29 April 2025

Abstract

:
Geothermal resources are abundant in China and are distributed mainly in the eastern region where energy demand is high, especially in Tianjin. However, a significant disparity remains between the actual heating area and the potential heatable area of geothermal resources in Tianjin, which indicates the vast untapped potential for development and utilization in the region. In this study, we reviewed the history and current status of geothermal development in Tianjin. We further analyzed the factors affecting the development and utilization of geothermal heat in Tianjin. Subsequently, we constructed a system dynamics (SD) model of geothermal development and utilization in Tianjin. We developed four scenarios, including baseline, policy incentives, technological progress, and economic inputs. The results of the multiscenario forecasts and sensitivity analyses of the SD model showed the following: Tianjin will go through four stages of geothermal development and utilization in the future. Policy support and economic investment were the two main factors influencing the development of geothermal energy, and the influence of technological progress was comparatively smaller. Based on the above results, we proposed recommendations to promote sustainable development of geothermal energy in Tianjin according to three aspects: policy mechanism, economic investment, and technological progress.

1. Introduction

1.1. Contextual Background

Geothermal energy is one of the most competitive resources for reducing reliance on fossil energy, because it is clean, low-cost, low-carbon, and stable [1]. China is endowed with a wealth of geothermal resources. Statistics have shown that the scientific development and utilization of geothermal resources under current technological conditions could save 1 billion tons of coal and reduce 2400 million tons of carbon dioxide (CO2) per year [2]. China has ranked first in the world for its scale of direct utilization of geothermal energy for quite a long time [3]. By the end of 2020, China’s geothermal energy heating and cooling area had reached a total of 1.39 billion square meters. Of this total, China has 580 million square meters of hydrothermal geothermal energy heating, and 810 million square meters of shallow geothermal energy heating and cooling, which can reduce 108 million tons of carbon dioxide (CO2) per year [4]. However, the utilization of geothermal resources accounts for only 0.6% of China’s total energy consumption.
The development and utilization of geothermal resources, which require high initial investments and face uncertainties, long construction cycles, imperfect policy support, and bottlenecks in technology research and development, have garnered increasing attention [5]. In June 2022, the Chinese government outlined a commitment in the “Fourteenth Five-Year Renewable Energy Development Plan” to actively promote large-scale geothermal energy development, thereby creating a favorable policy environment for the development and utilization of geothermal energy in China in the new period [6]. Therefore, the ability to comprehensively analyze the influencing factors of geothermal energy development and utilization and to explore the path of long-term sustainable development of geothermal energy is urgently needed.

1.2. Literature Review

Geothermal resource development and utilization have been the focus of research worldwide. Several scholars have analyzed geothermal development in China [7,8], globally [9,10,11], in Europe [12,13], and in Africa [14,15], and have reviewed various factors affecting geothermal development. Other studies have examined specific issues with geothermal energy, such as the influence of policies on the development of the geothermal industry [16,17], technical bottlenecks in geothermal development [18,19], geothermal and economic investment [20,21], and environmental benefits of geothermal development and utilization [22,23]. Luo and Lu (2023) analyzed the characteristics and prospects of China’s geothermal industry under the “dual-carbon” goal and concluded that it is crucial to tackle technology bottlenecks and introduce appropriate policies to achieve this goal [4]. Hou et al. (2018) analyzed the economic, environmental, and social benefits of geothermal development as well as the unfavorable factors of geothermal energy development and provided both countermeasures and solutions for the future development of geothermal energy in China from the aspects of technology and policy [3]. Wang et al. (2020) summarized the current situation of geothermal energy in China and analyzed the current problems in terms of policies and regulations, technology development, capital investment, and environmental protection [24]. Jiang et al. (2020) focused on the shallow geothermal resources and hydrothermal geothermal resources and examined the fiscal and tax policies for the development of the geothermal industry [25]. Hähnlein et al. (2013) stimulated sustainability and policy for the thermal use of shallow geothermal energy [26]. Guo (2009) believed that a perfect geothermal industry development model should improve the institutional arrangements from the perspectives of market demand, geothermal exploration, utilization of technological innovation, project construction management, and industrial capital investment [27]. Despite the strong stability and high utilization factor of geothermal resources, their development and utilization are still affected by many factors, including resources, economic policies, society, technology, and environmental considerations.
Therefore, to study the sustainable development and utilization of geothermal resources, it is necessary to consider the dynamic and integrated role of various factors that require complex systems. At present, many methods are used to model complex coupled systems for the study of sustainable development and utilization of geothermal energy. Guan (2014) analyzed the methodology of an economic evaluation index system for geothermal development and utilization, evaluated the prospect of China’s geothermal resource development and utilization, and assessed the effect of energy saving and emission reduction [16]. Kong (2014) established an economic evaluation model of geothermal resource development and utilization and conducted an economic evaluation of different utilization modes of low–medium temperature geothermal resources [28]. Noorollahi et al. (2017) adopted thermo-economic modeling and a geographic information system (GIS)-based spatial data analysis of ground-source heat pump systems to achieve an economically based map for 234 cities in Iran [29]. Li (2011) established a new method for evaluating geothermal potential through the organic combination of an evaluation system and artificial neural network theory [30].
Although these studies have highlighted the multifaceted approaches required to address the complexities of geothermal resource development and utilization, we found several remaining research gaps: (1) Previous studies have focused on the effects of single factors on geothermal development but the interactions between these factors have been inadequately described. (2) Existing studies have focused more on resource evaluation and less on actual exploitation and utilization, which in turn has led to less modeling and predictive analysis.
System dynamics (SD) can be the suitable method, because of the advantage of combining qualitative and quantitative analysis for solving these complex system dynamics problems [31]. The SD method emphasizes the dynamic complexity arising from feedback, nonlinearity, and time lags in the system in question. The system dynamics (SD) approach is particularly suitable for long-term forecasting and scenario analysis. In contrast, life cycle assessment (LCA) primarily focuses on the environmental impacts of specific products or technologies, while input–output analysis (IOA) is better suited for short- to medium-term economic impact assessments. Neither LCA nor IOA can adequately capture long-term dynamic changes [22]. System dynamics (SD) has been widely used for the modeling of economic systems [32], social systems [33], and energy systems [34,35,36]. For instance, Jiang (2020) adopted the SD method and used a causal loop diagram to explore the development mechanism of fiscal and taxation policies in the geothermal industry [37]. Shi et al. (2023) summarized the current situation of geothermal resource endowment and industrial development in China; based on this, a system dynamics model of geothermal industrialization is established, and the potential of geothermal industrialization and carbon emission reduction in China is predicted [38].

1.3. Research Objectives

By analyzing the impact mechanisms of geothermal development, it is crucial to explore ways for long-term sustainable geothermal development. In this study, we attempted to use SD to study the relationship between geothermal development and multilevel factors about economy, society, resources, environment, policy, and technology, revealing the factors influencing geothermal development and assessing future scenarios.
Tianjin was selected as the study area, mainly because it was one of the earliest cities in China to develop and utilize geothermal resources, and the direct use of geothermal resources has been continuously ranked first in China in recent years [39]. Challenges remain, however, in the development and utilization of geothermal resources in Tianjin. The pressure of heat storage in the geothermal centralized mining area has declined. Meanwhile, the demand for geothermal resources in the society has grown, resulting in a contradiction between supply and demand [40,41]. Considering the main challenge of the geothermal development in Tianjin, based on the constructed platform, we predicted the trend of Tianjin’s heating area and CO2 emissions reduction from 2021 to 2060. Then, we identified the key influencing factors through sensitivity analysis. Finally, by setting up scenarios (i.e., economic prioritization, technological advancement, and policy enhancement), we used the model to test the effects of different measures. This information will be significant for Tianjin’s future development of geothermal energy and will provide guidance for policymaking.

2. Study Area, Historical Background Related to Geothermal Development, and Status
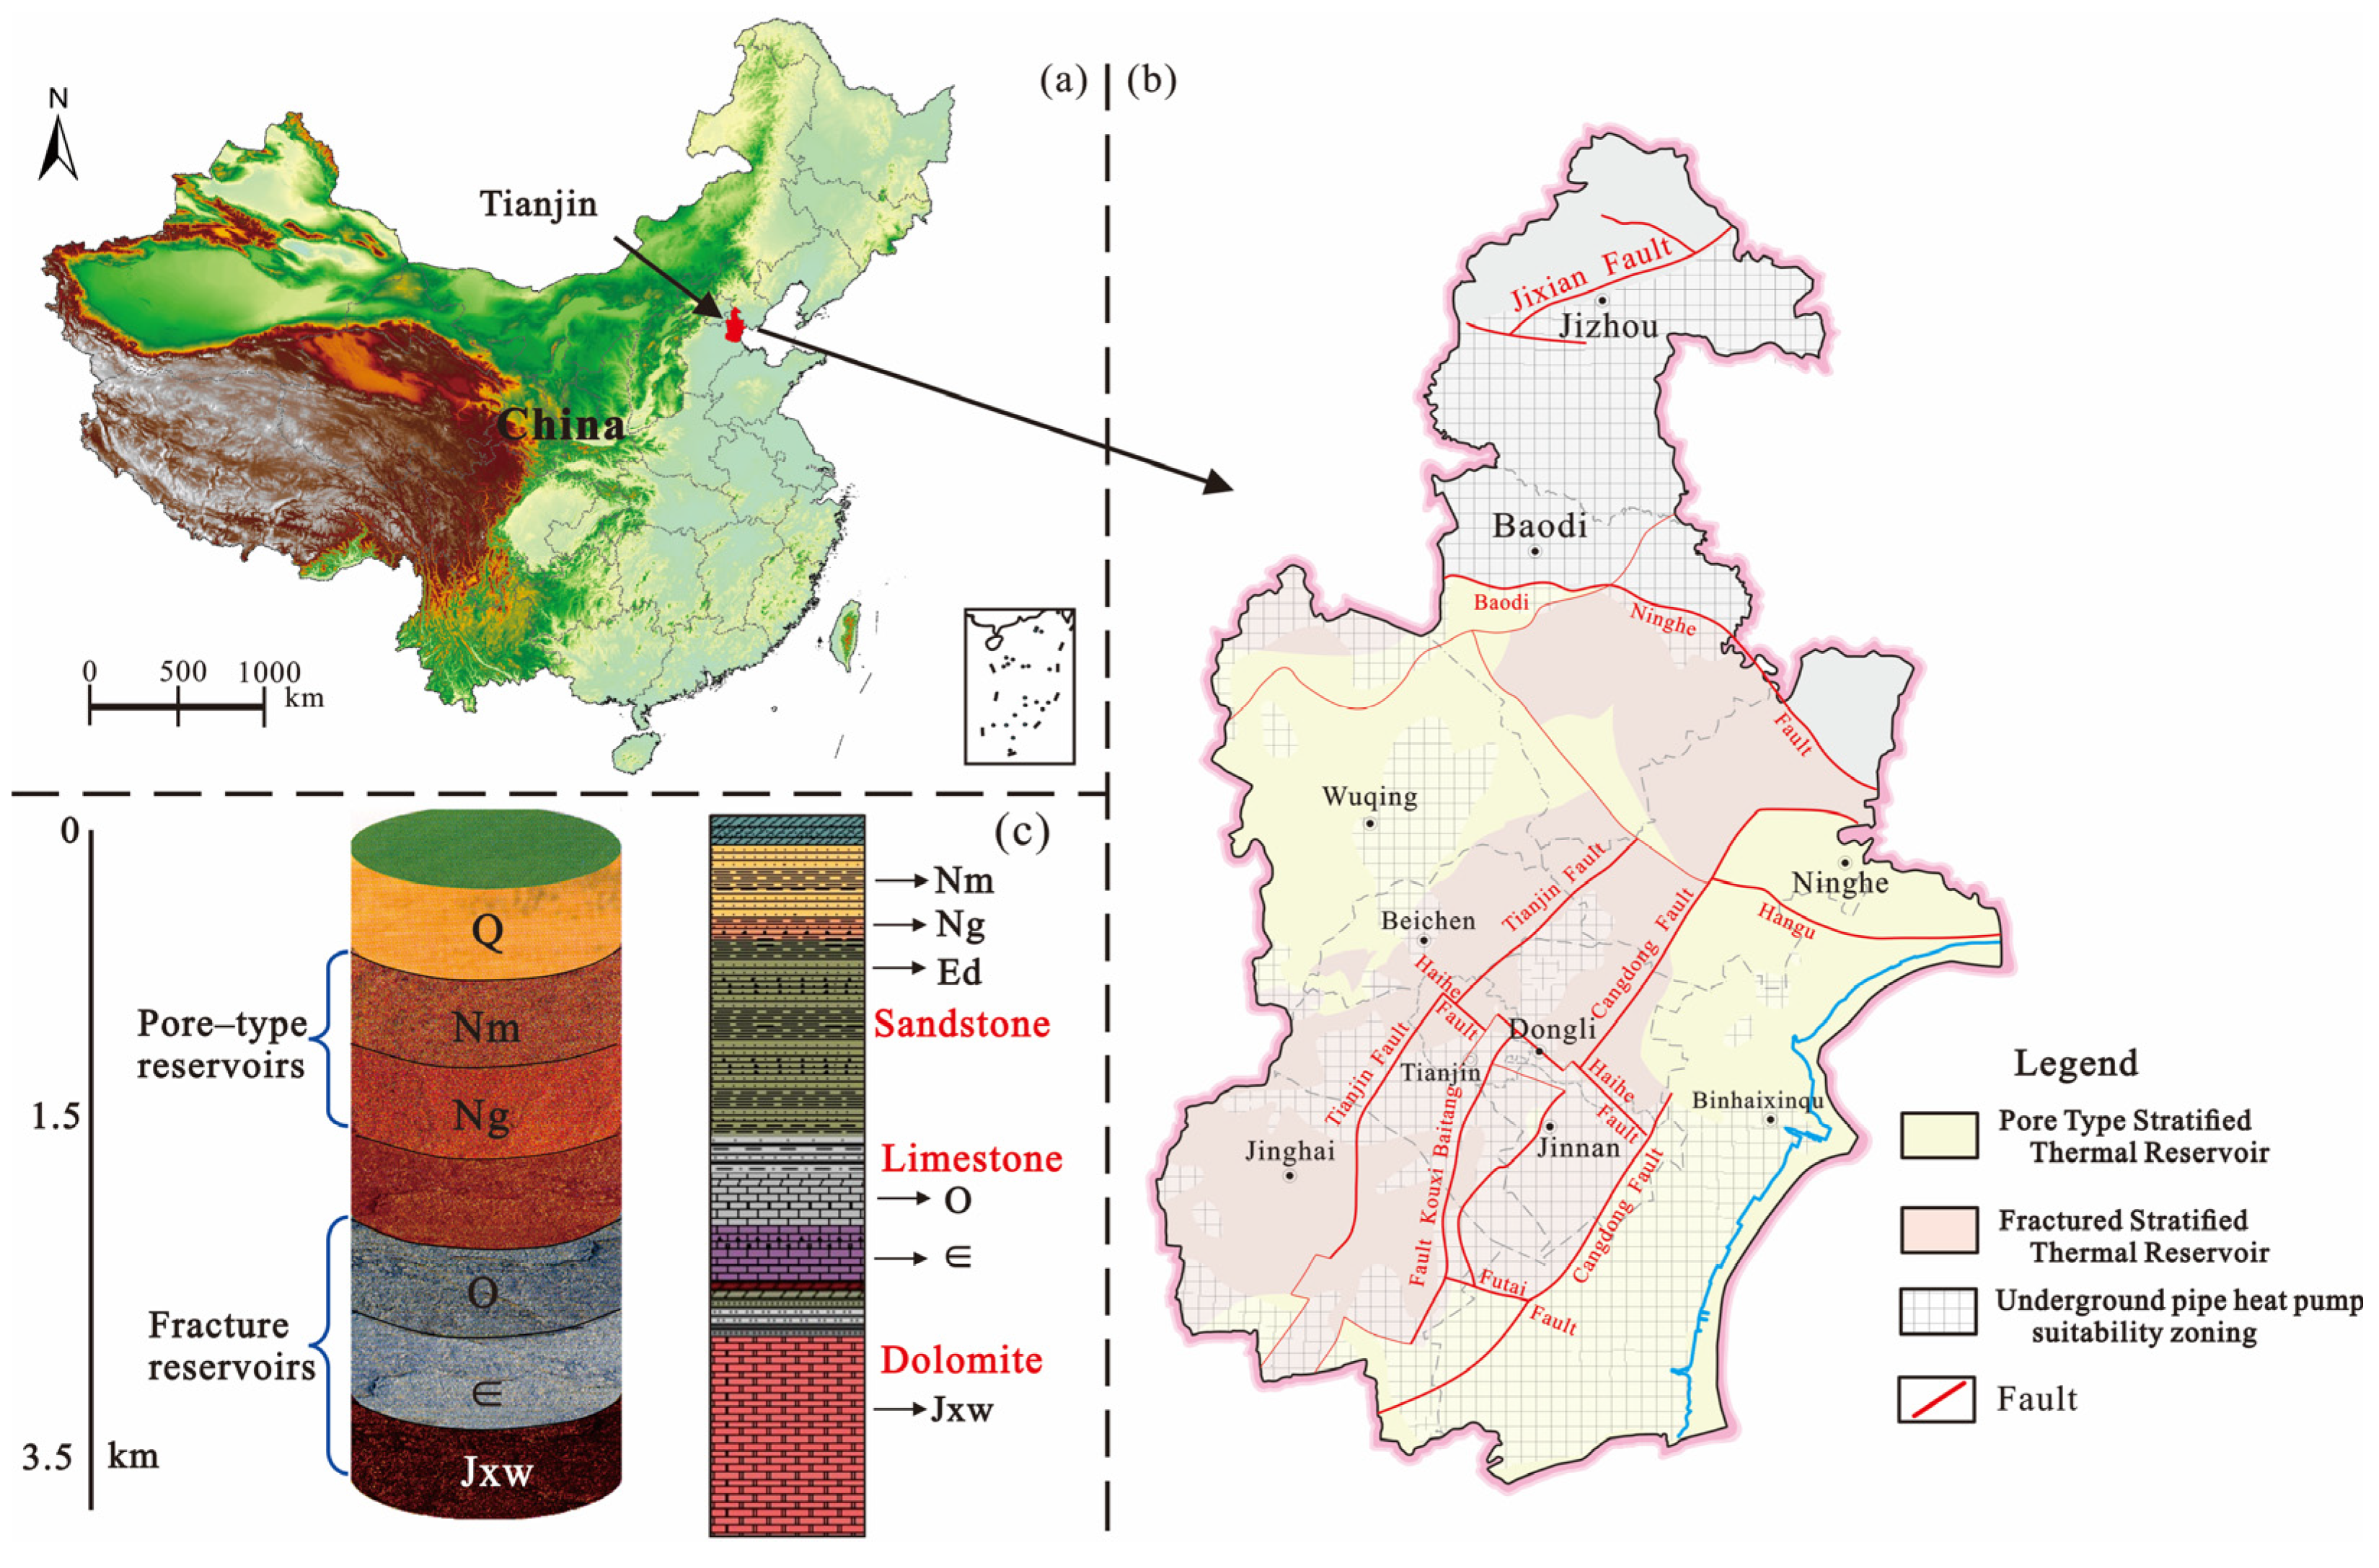
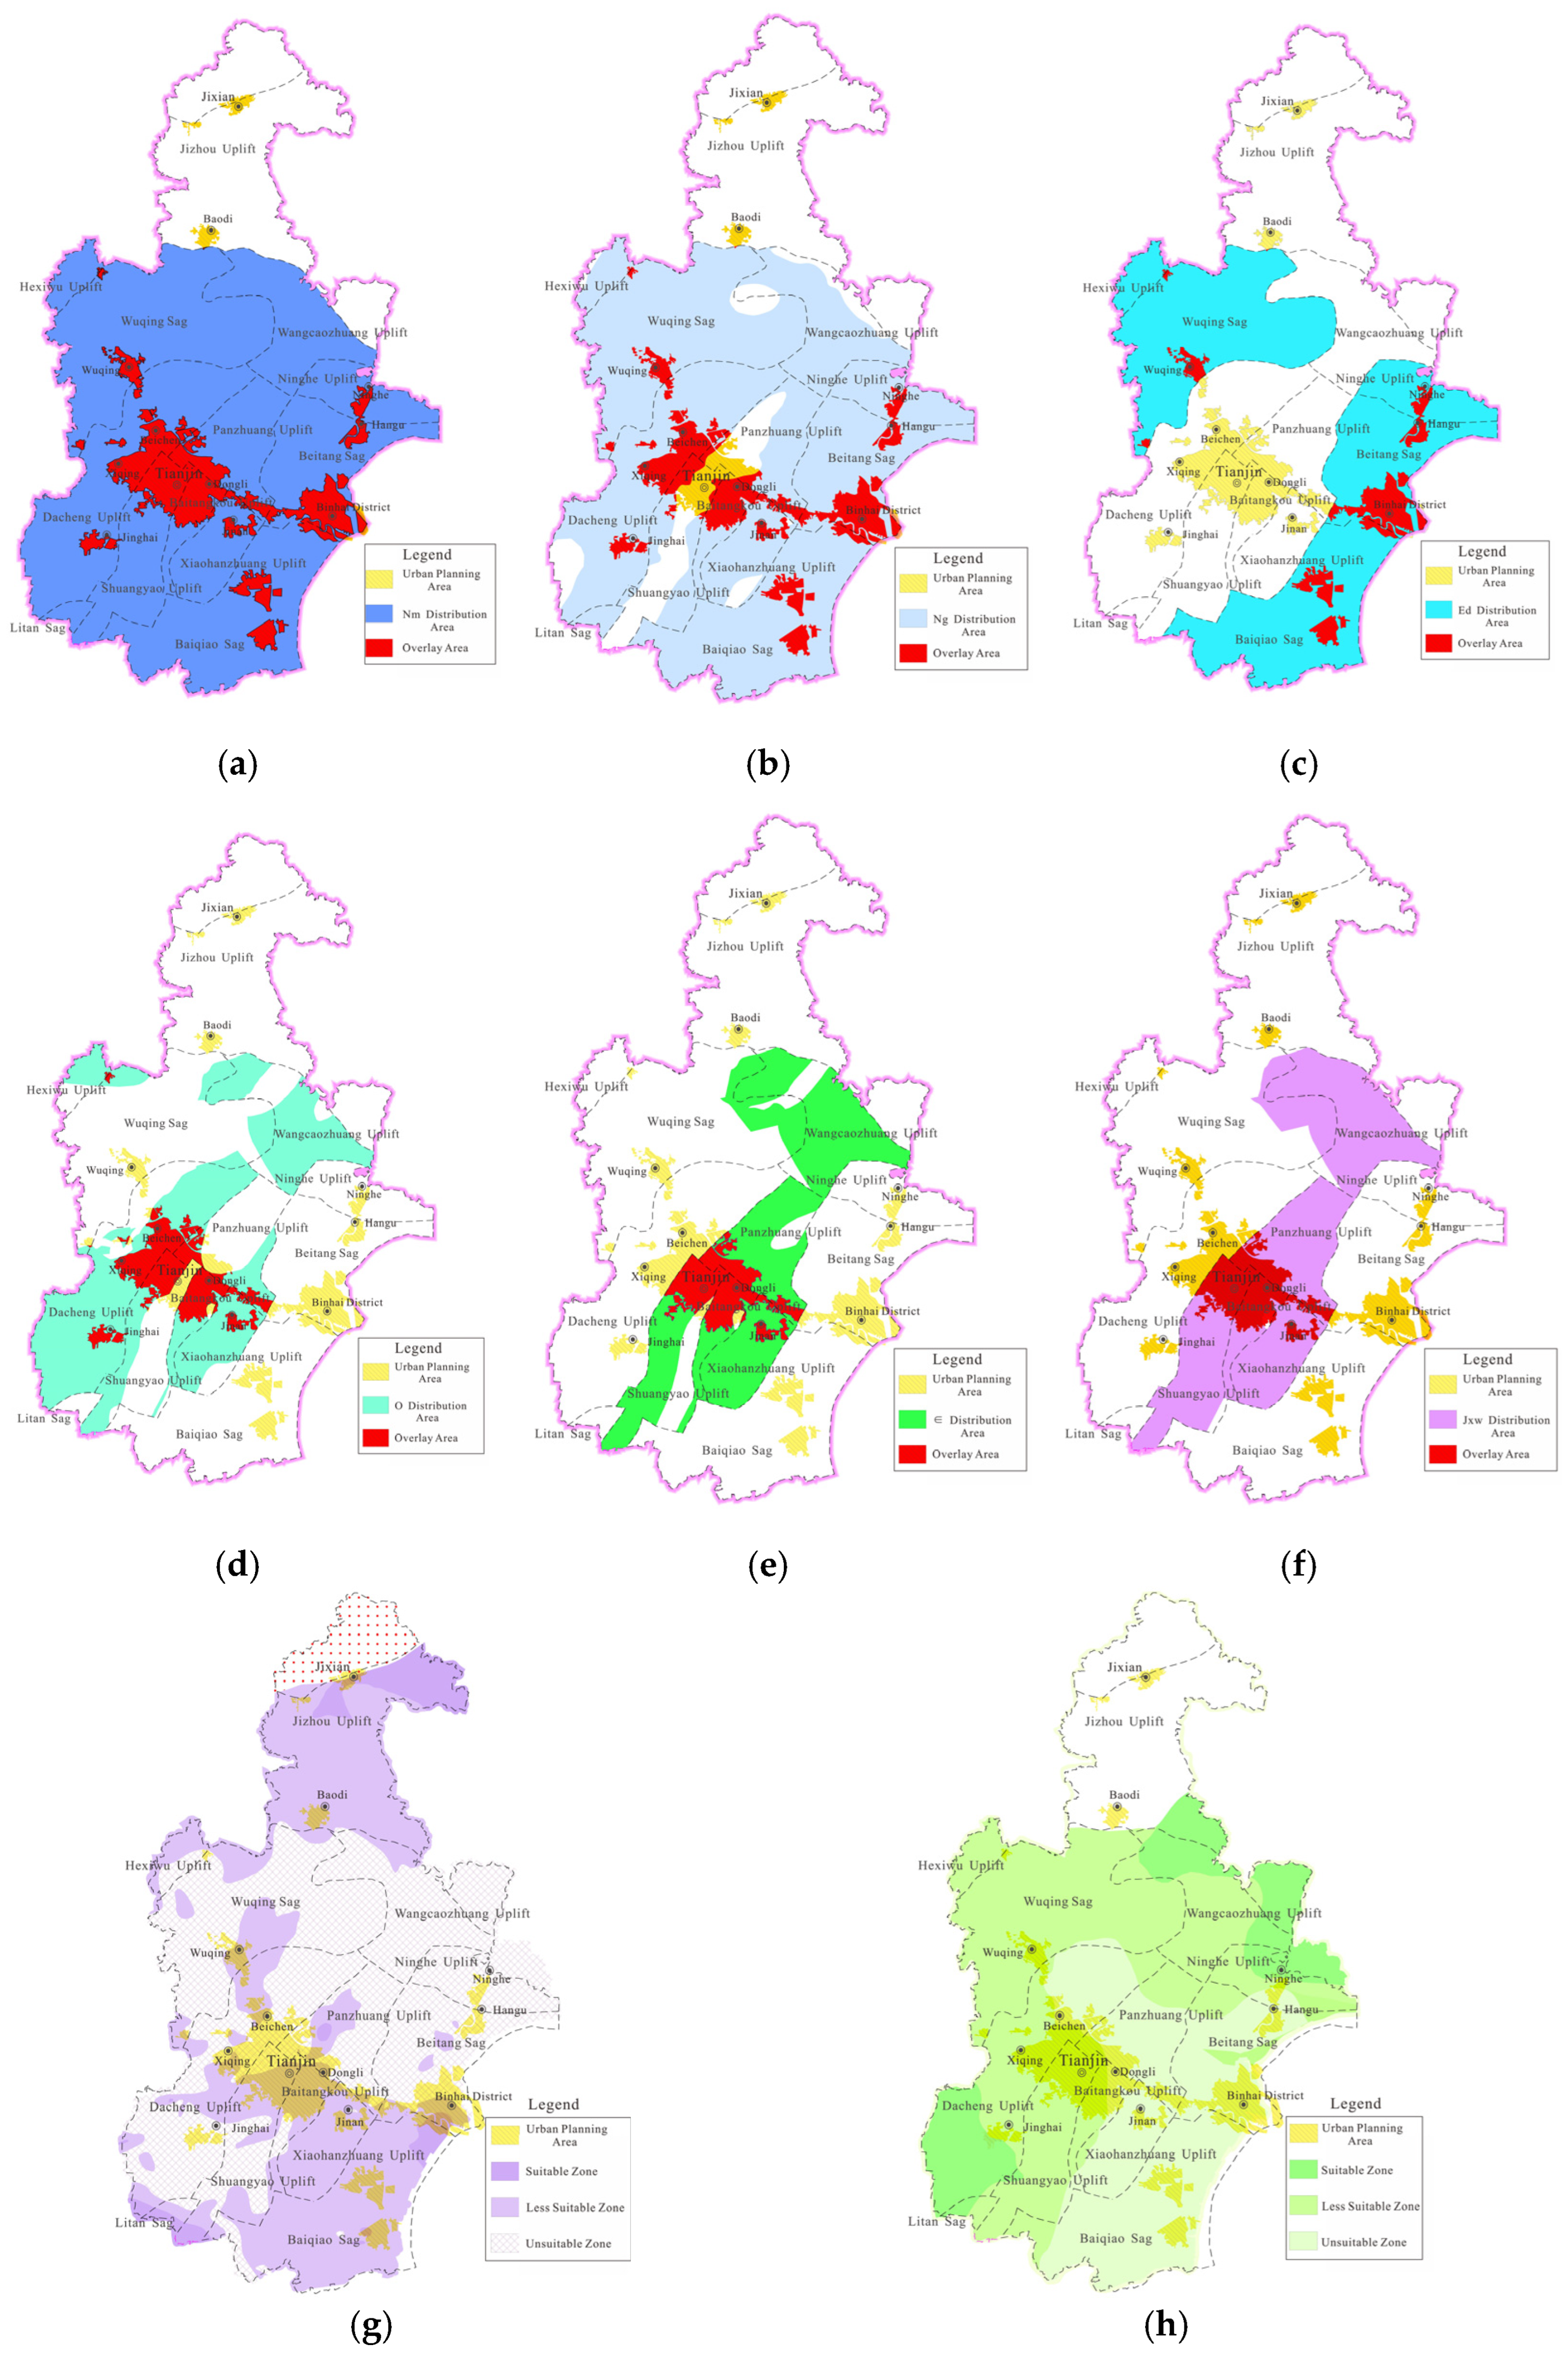
2.1. Study Area

Tianjin is located in the northeastern part of the North China Basin, bordered by the Bohai Sea to the east and the capital city of Beijing to the west. It is endowed with abundant hydrothermal geothermal resources and shallow geothermal energy (Figure 1) [42]. Hydrothermal geothermal resources are distributed mainly throughout the vast plain area south of the Ninghe-Baodi fracture, with a distribution area accounting for 81% of the total area of the city, featuring shallow burial, many reservoirs, good water quality, and high water quantity, and temperature, with six thermal reservoirs in the depth range of 300–4000 m in the vertical direction [43]. Tianjin can be divided into a porous geothermal reservoir, including the Cenozoic Neogene, which consists of the Minghuazhen Group (Nm), Guantao Group (Ng), and Paleogene formation Dongying Group (Ed), and a bedrock geothermal reservoir, which includes the Paleozoic Ordovician, (O), Cambrian (∈), and Mesoproterozoic Jixian Wumishan Group (Jxw) [44]. The Jxw and Ng are the main mining layers, with the water temperature reaching a high of 113 °C in geothermal wells and water output of 40–120 m3/h in single wells.
Shallow geothermal energy resources are stored in water, soil, and rock from the surface to a depth of 200 m below the ground at temperatures lower than 25 °C [45]. These resources can be extracted using heat pump technology for heating or cooling buildings. Shallow geothermal energy is abundant, with an annual available volume of 1.748 billion GJ in Tianjin. Based on the different ways of utilizing heat pumps, they can be classified into two types: (1) groundwater heat pumps and (2) ground-coupled heat pumps [46,47].

2.2. History and Current Status of Geothermal Energy in Tianjin

Tianjin is the first city in China in terms of geothermal development. In the 1930s, the French drilled the first artesian heat well, and in the 1970s, Tianjin discovered two geothermal fields [48]. In the 21st century, geothermal energy has become increasingly popular, and its exploitation has entered a stage of rapid development, with drilling depth gradually increasing and the exploitation of bedrock thermal reservoirs dominating, becoming the largest geothermal heating system in Tianjin [49]. The development of shallow geothermal energy resources in Tianjin has focused mainly on winter heating. The first shallow geothermal energy resources development and utilization project was completed in 2000. The number of shallow geothermal energy buried pipe heat pump and groundwater heat pump projects in Tianjin has been increasing over the past 20 years and the heating area continues to increase [50]. The development of geothermal energy resources in Tianjin, represented by the heating area, has emerged in the three stages shown in Figure 2.
First stage, i.e., budding (2004 onwards): The “Tenth Five-Year Plan” mentioned in “active development of wind energy, solar energy, geothermal and other renewable energy”. At that time, the ground-source heat pumps had just been introduced into China by developed countries, and geothermal development in Tianjin was in the nascent stage.
Second stage, i.e., growth (2005–2012): The Renewable Energy Act was enacted in 2005. On 29 November 2005, the National Development and Reform Commission issued the “Renewable Energy Industry Development Guidance Catalogue”. This guidance catalog included ground-source heat pump systems, geothermal wells, special drilling equipment, geothermal well pumps, water-source heat pump units, and other equipment manufacturing. The national finance focused on supporting renewable energy development and utilization for building heating and cooling. Geothermal development entered a growth stage in Tianjin.
Third stage, i.e., initial stage of industrialization development (2013–2019): The “Guidance on Promoting Geothermal Energy Development and Utilization” was issued in 2013, the “Twelfth Five-Year Plan for Geothermal Energy Development and Utilization” was issued in 2014, and the “Thirteenth Five-Year Plan for Geothermal Energy Development and Utilization Planning” was issued in 2017. Other relevant policy documents have accelerated the scale development of geothermal energy in Tianjin.

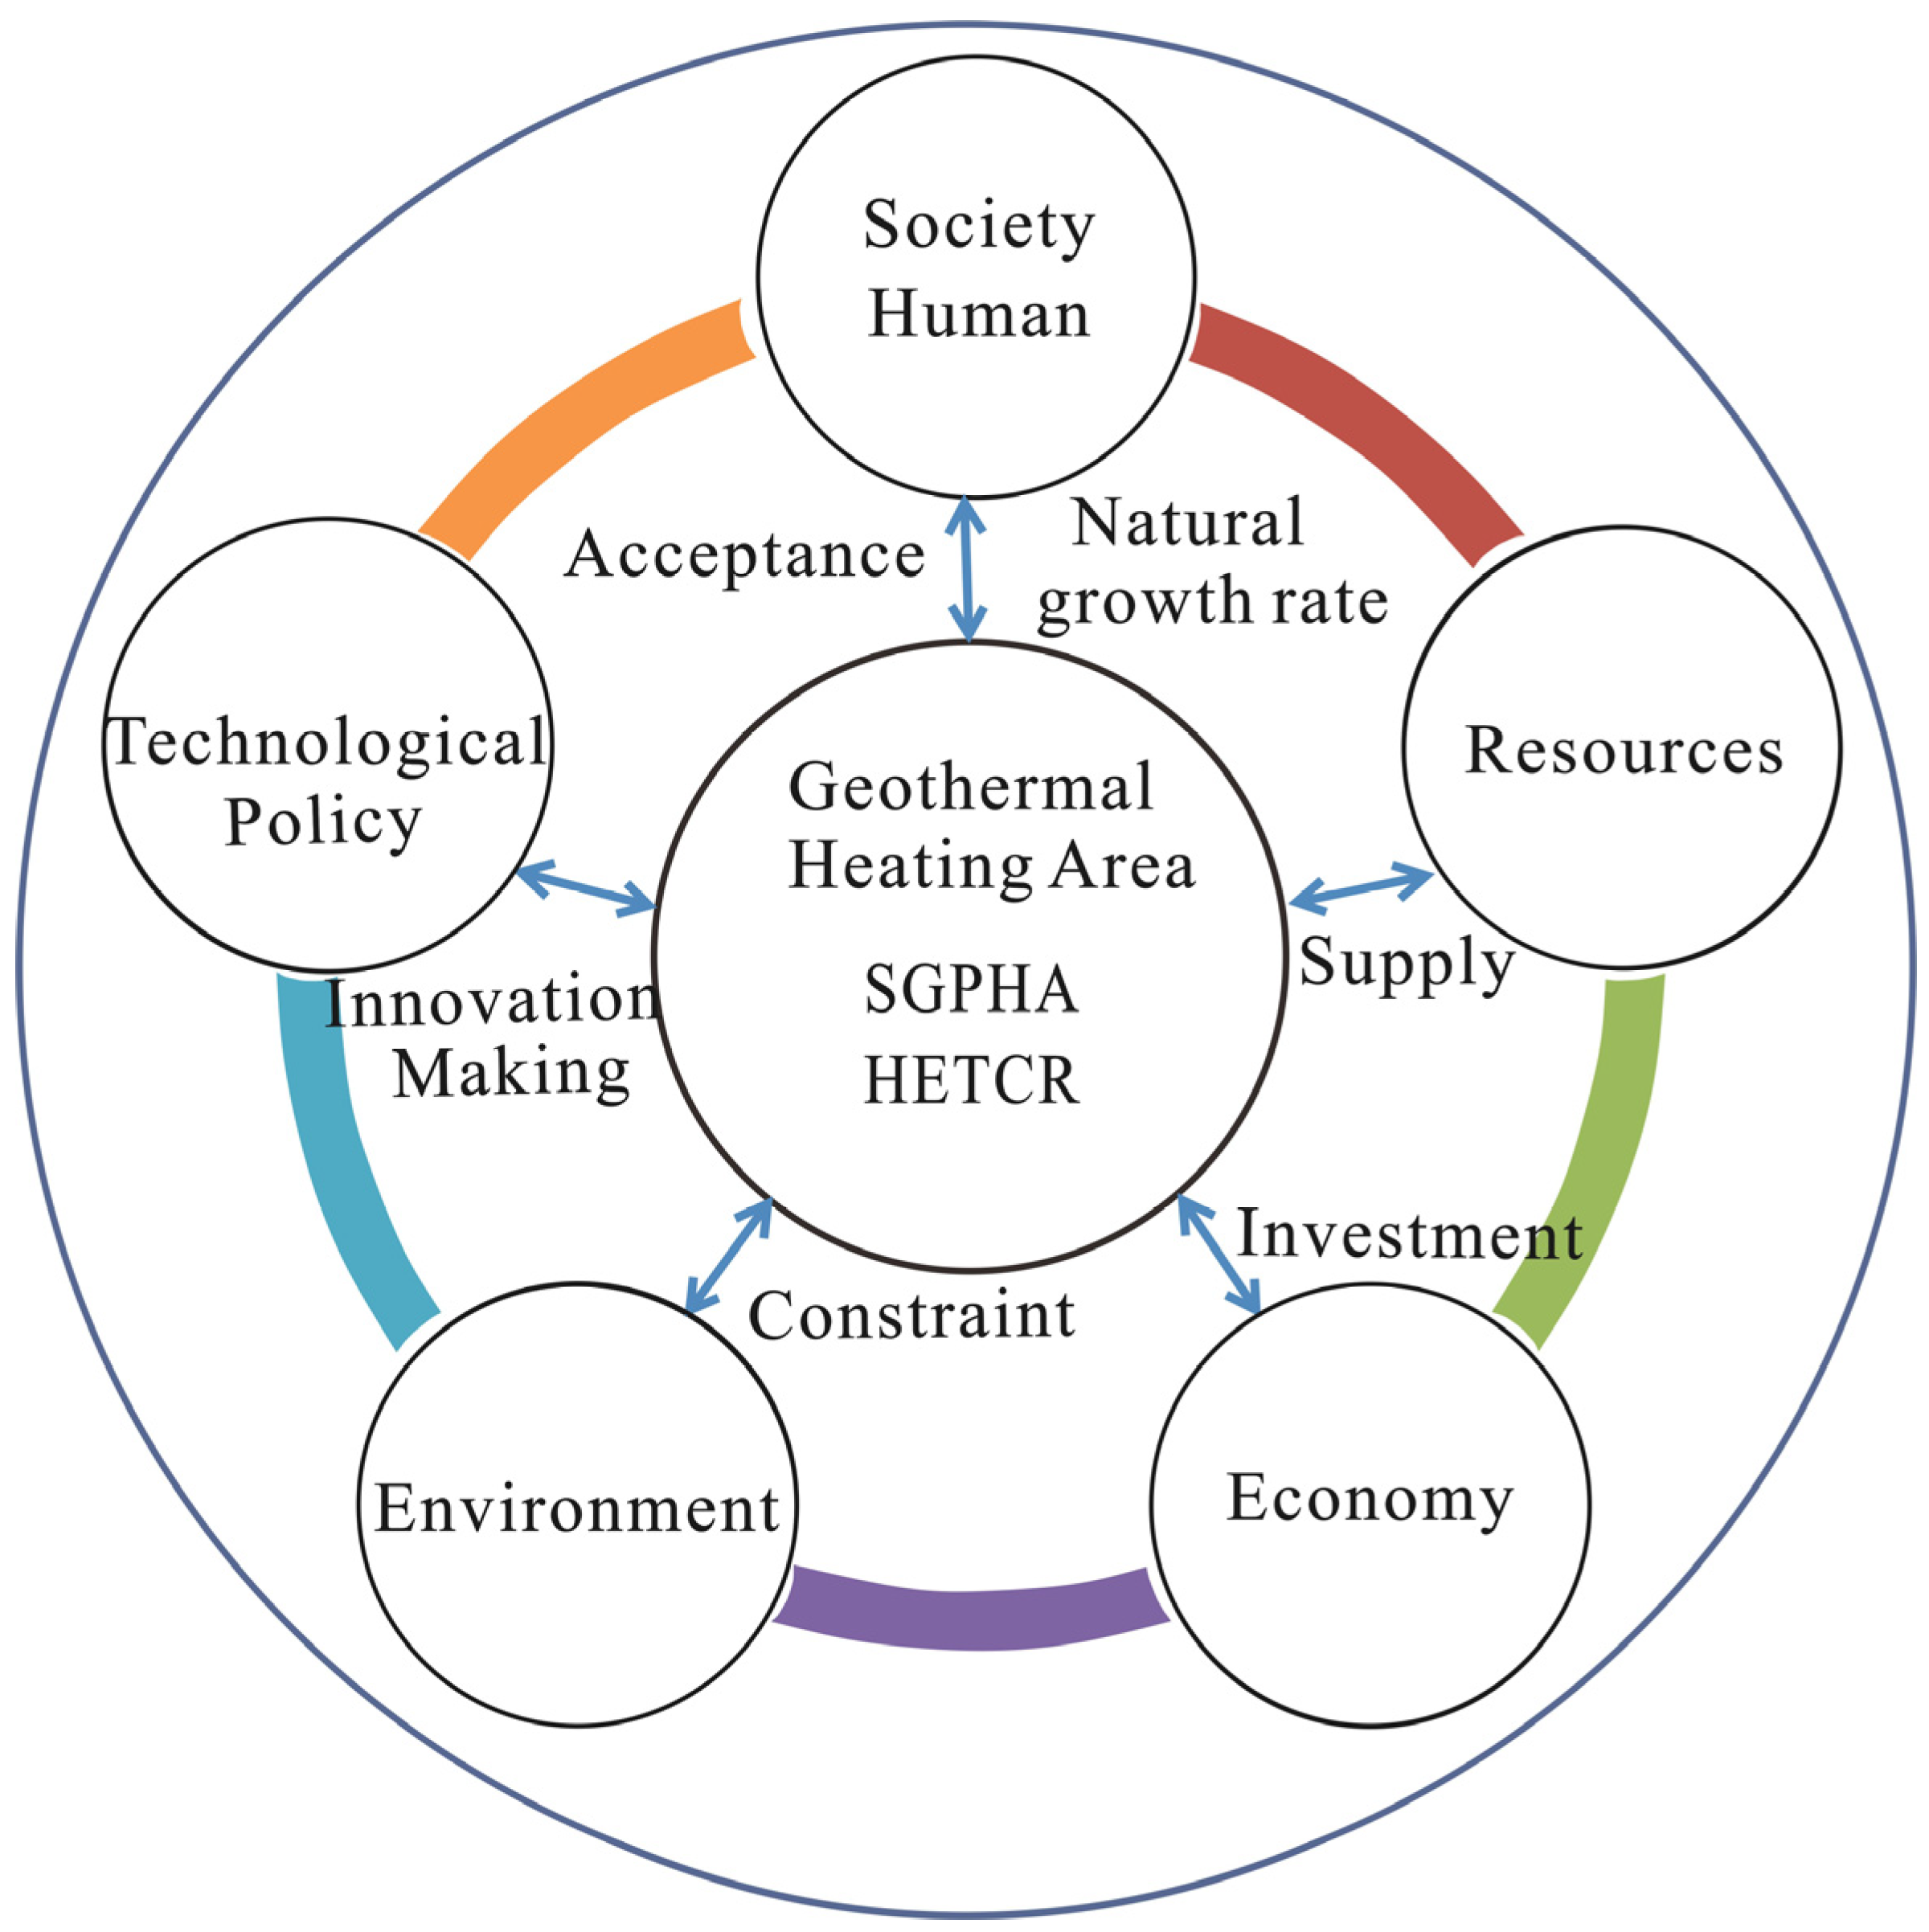
2.3. Influence Mechanism of Geothermal Development in Tianjin

The two types of geothermal energy are hydrothermal geothermal energy and shallow geothermal energy. Externalities are typical in the energy field, and the development and utilization of geothermal clean energy is costly. Because it has the function of saving resources and environmental protection, the positive externality is significant. Geothermal development is closely related to policy, energy, economy, environment, technology, and society. Therefore, to comprehensively analyze the influence systems of geothermal development, we identified the driving factors for geothermal development, which are illustrated in Figure 3.
First, the geothermal industry chain is long, starting with the preliminary geothermal exploration and evaluation and continuing with geothermal drilling and completion and then development and utilization of shallow geothermal and hydrothermal geothermal. Investment is a key factor in facilitating geothermal resource development and utilization because of the large initial investment in geothermal projects. Economic development has a complementary relationship with geothermal projects. Economic growth can boost energy demand as well as demand for geothermal heating. The commissioning of a geothermal station can also improve the energy infrastructure and bring economic benefits to the local government in the future carbon market. Second, geothermal energy is a clean energy, and the use of geothermal heating can reduce fossil energy combustion and pollutant emissions (e.g., coal, etc.), which can improve air quality [51]. Third, regional differences in China’s geothermal resource distribution are obvious. Geothermal development is affected by resource endowment, including the region’s resource conditions such as high temperature and development and utilization of low-cost, high-utilization efficiency. Thus, resources are also indispensable factors [52]. In addition, social acceptance is an important factor affecting geothermal development, such as demographic changes, climate change, technology [53], policy, and other human behaviors that can directly affect geothermal development prospects [54].

3. Methodology

3.1. SD Model Boundaries

For the SD model to capture the complex relationship between geothermal development and various factors, it is essential to define the model boundary and make assumptions [55]. We set the simulation time step for the SD model to one year, with a time boundary of 2000–2060, where the years 2000–2020 are used for model testing and 2021–2060 for scenario forecasting.

3.2. A Framework Based on the System Dynamics Model

The system dynamics model in this paper had four parts: namely, a resources subsystem, a society–economy subsystem, an environment subsystem, and a policy–technology subsystem. These four subsystems interact with each other through various relationships, as shown in Figure 4a,b.

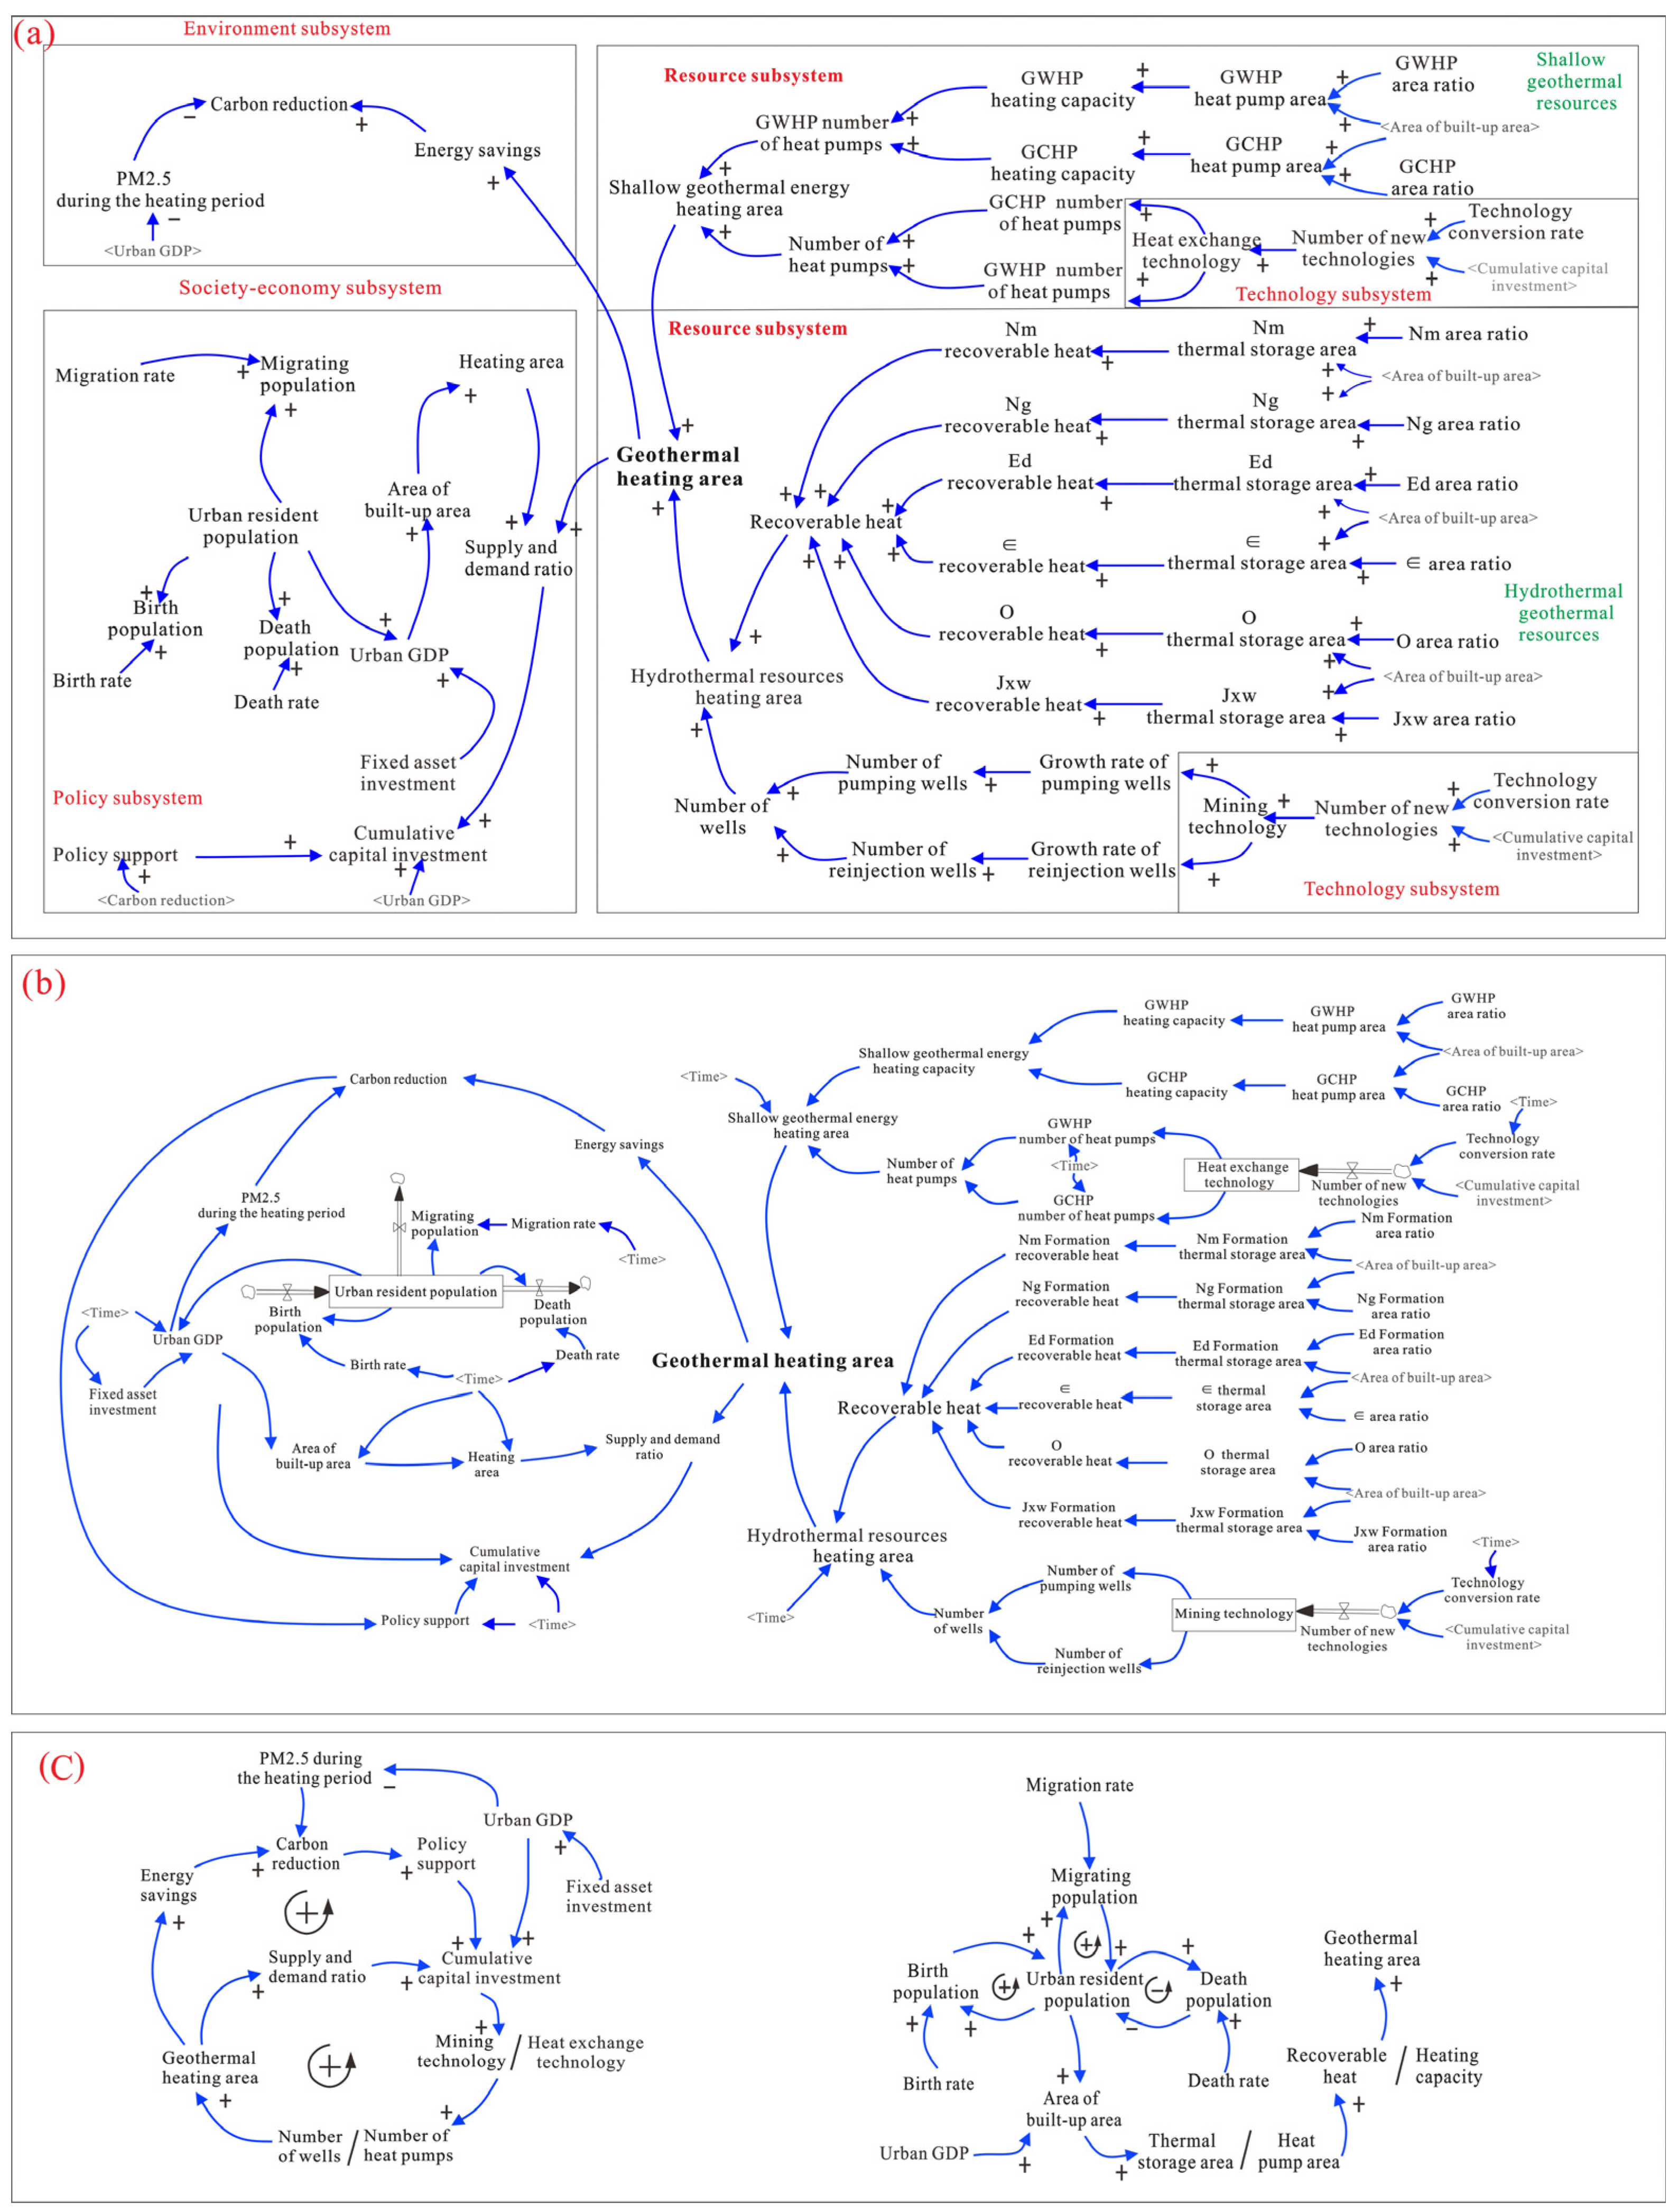
3.2.1. Causal Loop Diagrams (CLD) Analysis

Causal loop diagrams (CLDs) serve as one of the core tools in system dynamics modeling, designed to illustrate the causal relationships and feedback mechanisms among various variables within a system (Figure 4c). In this study, we have constructed the following key feedback loops to capture the complex interdependencies in geothermal resource development and utilization: (1) Policy-Driven Investment Loop. Strengthened policy support → Cumulative capital investment → Mining or Heat exchange technology → Number of wells and heat pumps → Geothermal heating area → Energy savings → Carbon reduction → Policy support. This loop highlights how policy incentives stimulate investment, leading to expanded utilization, energy savings, and reduced emissions, which in turn reinforce policy commitments. (2) Economic Growth and Market Feedback Loop. Cumulative capital investment → Mining or Heat exchange technology → Number of wells and heat pumps → Geothermal heating area → Supply and demand ratio → Cumulative capital investment. This loop demonstrates how economic investment drives technological deployment, increasing geothermal supply to meet rising demand, thereby attracting further investment in a self-reinforcing cycle. (3) Population Dynamics Loop. Urban resident population → Death population/Birth population/Migrating population → Urban resident population. This loop captures demographic changes affecting energy demand, where population growth increases heating needs, while migration and natural population changes modulate demand over time.
These feedback loops collectively shape the long-term evolution of geothermal development, influencing policy effectiveness, economic viability, and environmental sustainability. The specific interactions and quantitative relationships among these variables are further elaborated in Section 3.2.2, Section 3.2.3, Section 3.2.4 and Section 3.2.5, where we detail the subsystems of economy, resources, environment, and policy–technology.

3.2.2. Socioeconomic Subsystem

The socioeconomic subsystem is the main driver of the model, which consists of two main factors, namely, population and gross domestic product (GDP). Studies have identified that a positive relationship exists between GDP growth and geothermal development and utilization [56]. As GDP and population continue to increase, rising per capita building area, the area of central heating demand also increases. At the same time, economic development promotes urban growth and increases energy demand, which in turn boosts the consumption of clean energy, such as geothermal energy. The increase in clean energy sources, such as geothermal energy, promotes the reduction in CO2 emissions and increases corporate enthusiasm to invest in the geothermal industry, which in turn leads to the development of the industry.

3.2.3. Geothermal Resource Subsystem

The geothermal resource subsystem represents the geothermal endowment of a region, which determines the development, utilization, and heating capacity of geothermal resources. The abundance of geothermal resources possessed by different areas is also different. In this study, we selected the city district that reflected the history and current status of geothermal development as the study area. This part of the resource volume is more economical to develop and utilize under current technical conditions. The amount of these exploitable resources gradually increases as the town grows.
Tianjin sedimentary basin-type geothermal resources were 898.484 × 10¹⁸ J, which was equivalent to standard coal 306.57 × 10⁸ t. Among the thermal reservoirs, the Nm group had the largest distribution area (Figure 5a), the Ng group was the second largest (Figure 5b), and the ∈ group had the smallest area of distribution (Figure 5e). From the point of view of resources, the Jxw group had the largest amount of medium-temperature geothermal resources, and the Ed formation had the smallest amount of thermal water resources. The distribution area and geothermal resources of each reservoir are in Table 1.
The area of suitable and more suitable zones for groundwater heat pumps (GWHP) in Tianjin was 5686 km2, which was 51.54% of the total area, as shown in Figure 5g. The area of suitable and more suitable zones for ground-coupled heat pumps (GCHP) was 4899 km2, which was 44% of the total area, as shown in Figure 5h. Considering the peak coefficient of the building cooling and heating loads, the total resource potential of the GWHP suitable and more suitable zones for the summer coolable area was 1 × 10⁷ m2, and the winter heatable area was 8.04 × 10⁶ m2. The total resource potential of suitable and more suitable areas for GCHP that could be cooled in the summer was 1.26 × 10⁹ m2 and the winter heatable area was 1.34 × 10⁹ m2.
In this study, the built-up area of Tianjin was superimposed on different thermal reservoirs (Nm, Ng, Ed, O, Є, and Jxw) and different heat pump-suitable areas. The superimposed distribution is shown in Figure 5a–h.

3.2.4. Environment Subsystem

The environmental subsystem focuses on the relationship between the development of geothermal clean energy and CO2 emission reduction. CO2 emission constraints affect investment in the geothermal industry. As the area of geothermal development and utilization increases, the substitution of fossil energy increases, the consumption of fossil energy decreases, and the emission of CO2 is reduced, thus protecting the environment and resources. At the same time, the government is encouraging enterprises to increase the development of the geothermal industry and to raise investment in the geothermal industry, which in turn is promoting the development and utilization of geothermal energy. CO2 emission reduction is calculated primarily by estimating the net heat provided by geothermal resources in the project activity by converting the annual standard coal savings using the national standard GB/T11615-2010 “Geological Survey Specification for Geothermal Resources” [57]. We used the following formula:
M = ∑Wt/4.1868/7,
QCO2 = 2.386M,
where M is coal saving (t/a); ∑Wt is thermal energy obtained after considering thermal efficiency conversion in one year of geothermal water mining (109 J); and QCO2 is CO2 emission reduction equivalent to coal saving in one year of geothermal water mining.

3.2.5. Policy and Technology Subsystem

The policy and technology subsystem is central to energy conservation and emission reduction and also is a driving influence on the development of the geothermal industry. Geothermal development and utilization has high initial investment and high uncertainty. Its development cannot be separated from policy support and technological progress. The geothermal industry chain is long and complex, including geothermal exploration and evaluation in the early stage, geothermal drilling and completion in the middle stage, and geothermal development and utilization in the late stage. The entire industry chain involves several key technologies, and technological progress has gradually made the use of deep geothermal heat more economical and has allowed for commercialization. At the same time, the influence of policies is unavoidable, including government subsidies for geothermal industry development units and the promotion of sustainable development of the geothermal industry through tax policies.

3.3. Model Tests

3.3.1. History Test

The SD model was tested, both a theoretical test and a historical data test, to ensure that the model could be used to reasonably quantify the relationships between variables and accurately simulate the development of geothermal resources in Tianjin.
The results of the theoretical tests showed that the model boundaries and assumptions were reasonable, the variables and parameters were well defined, and it passed the model checking and unit checking in Vensim 9.x. Therefore, we deemed the system structure was reasonable.
We used historical data to verify the reliability of the model. We calculated the errors between actual and simulated data from 2000 to 2020. As shown in Figure 6, the geothermal heating area (GHA), shallow geothermal energy heating area (SGEHA), and hydrothermal resources heating area (HRHA) simulated data fitted well with the actual data, with an average absolute percentage error of 4.53, 3.65, and 6.34%, respectively. Errors arise from (1) Data Uncertainty: Statistical biases, especially between 2000 and 2010, led to incomplete inclusion of some geothermal projects’ heating areas. (2) Model Simplification: Assumptions like constant parameters (e.g., technology conversion rate, GDP growth) and reducing the system to four subsystems may cause deviations. (3) External Factors: Policies, economics, and technology impact results, but only the annual number of policies was considered, omitting details like fiscal policies.
Therefore, the SD model built in this paper can predict the future development ways of geothermal resources in Tianjin under different scenarios.

3.3.2. Sensitivity Test

Sensitivity analysis uses debugging and modification of structures and parameters in the model, as well as model runs and outputs, to determine the extent of their effect on the model [58]. The sensitivity analysis of the model allowed for the selection of key parameters for model tuning and simulation prediction. The parameters selected in sensitivity analysis generally were constants, including initial values of state variables and coefficients in the system equations. The sensitivity test models are as follows:
S = ( Y t Y t ) / Y t X t X t / X t
where X t and X t are the parameter values before and after the adjustment of the parameter, Y t and Y t are the predicted values at the moment t before and after the adjustment of the parameter, and S is the sensitivity of a variable in the system relative to a parameter at the moment t . If S is calculated to be less than 1, the effect is small.

3.4. Scenario Setting and Parameter Assumptions

3.4.1. Scenario Setting

Geothermal development is influenced by human behavioral factors such as investment, policy, and technology, and the parameters we used in setting up the scenarios are specified in Table 2.
Under the Status Continuation Scenario (SCS), the government will continue to maintain current incentive policies for the geothermal industry. Technology for geothermal development and use will also remain unchanged. Economic and social development will grow in keeping with current conditions.
Under the Policy-Strengthening Scenario (PSS), China will vigorously encourage geothermal development to promote energy transition and achieve dual-carbon targets.
Under the Economic Priority Development Scenario (EPDS), the growth of fixed asset investment (FAI) will be set as the maximum, and the impact of rapid economic development on the environment will be disregarded. At the same time, with economic development and increased demand for geothermal heating in the Tianjin area, the amount of geothermal resources available will increase as the city gradually develops and the built-up area increases. Thus, economic growth will promote the development of technology.
Under the Technological Progress Scenario (TPS), geothermal technology could include heat exchange technology related to shallow geothermal energy and detection and extraction technology related to hydrothermal-type geothermal energy. The impact on the geothermal heating area through the increase in the conversion rate of the extraction technology and the heat exchange technology will represent technological progress.

3.4.2. Parameter Assumptions

The parameter assumptions for different contexts are shown in Table 2; considering the impacts of SARS-CoV-2 according to the relevant policies, we assumed the GDP growth rate, technology conversion rate, urbanization rate, and population from 2021 to 2060. We referenced the following planning documents: “The 14th Five-Year Plan for a Modern Energy System”; “The Fourteenth Five-Year Plan for National Economic and Social Development of Tianjin”; “Tianjin Ecological Protection 14th Five-Year Plan”; “Tianjin Carbon Peak Implementation Plan”; “Tianjin City Territorial Spatial Master Plan (2021–2035)”; “Tianjin Mineral Resources Planning (2021–2025)”; “Tianjin Renewable Energy Development 14th Five-Year Plan”; “Thirteenth Five-Year Plan for Geothermal Energy Development and Utilization”; and the outline of the 2035 Visionary Goals.

4. Results

4.1. Sensitivity Analysis Results and Main Influencing Factors

We established the baseline scenario and performed sensitivity analyses to validate the model’s response to the input parameters. We increased or decreased the same rate for a certain type of parameters, for example 10%, and kept the other input parameters constant to evaluate and compare the effect of different factors on the geothermal heating area. Accordingly, we identified the key influencing factors. Under the same rate of change, the greater the future growth of the geothermal heating area meant that the stronger the driving effect of such factor, the stronger the inhibitory effect, and vice versa. This method revealed the changes in the impact of certain factors on future geothermal heating areas over time. In this study, we selected three types of influencing factors for the sensitivity analysis: fixed asset investment, policy support, and technology transfer rate. In addition to the baseline scenario, we set three scenarios: +10% Policy support (S1), +10% technology conversion rate (S2), and +10% FAI (S3). By controlling the same change rate, we were able to evaluate and compare the influence of different factors on future geothermal development and utilization. The results are shown in Figure 7.
The results showed that economic input had a significant positive impact on geothermal development and utilization, with a 10% increase in fixed asset investment and an 11.68% increase in the geothermal heating area. Compared with the economy, this policy had a certain degree of positive impact on geothermal development and utilization. Policy support increased by 10%, and the geothermal heating area increased by 5%. The contribution of technological progress on geothermal development and utilization had a smaller impact, at 0.4%. The development and utilization technologies for Tianjin’s geothermal resources have reached a relatively mature stage. For instance: Shallow Geothermal Energy: Heat pump technologies (e.g., ground-source heat pumps and groundwater heat pumps) have been applied in Tianjin for over two decades, with high technology adoption rates. Further technological breakthroughs are now limited. Deep Hydrothermal Systems: Geothermal well development technologies (e.g., drilling and completion techniques) in Tianjin are also well established. The primary technical bottlenecks lie in sustainable extraction and reinjection efficiency of geothermal resources. Technological progress typically follows a long-term trajectory, making substantial breakthroughs difficult to achieve in the short term.

4.2. Comparative Analysis of Multiscenario Results

Through different scenario simulations, we predicted the development trend of geothermal heating in Tianjin and calculated the carbon reduction potential of different scenarios. Overall, the future geothermal development and utilization in Tianjin (2020–2060) went through the four stages shown in Figure 8.
The first stage was the stable stage under the novel coronavirus epidemic (2020–2023). After the outbreak of the novel coronavirus epidemic in 2020, various industries were affected to different degrees. At the same time, some geothermal wells without water extraction and mining licenses were shut down in Tianjin, and geothermal development and utilization also entered a stable stage from rapid development.
In the second stage, rapid development was driven by the dual-carbon target (2024–2033). With the introduction of the dual-carbon target in September 2020, Tianjin introduced several related policies. These policies reflected Tianjin’s determination to develop geothermal energy and to promote the comprehensive and efficient utilization of geothermal resources. Under the strong stimulation of policies and combined with the local demand of Tianjin, geothermal development and utilization entered the next stage of rapid development, while also contributing to the achievement of peak carbon.
The third stage was the post-peak carbon stabilization phase (2034–2039). After achieving peak carbon, the relevant policy stimulation gradually slowed down and geothermal development and utilization plateaued.
The fourth stage was the carbon-neutral-oriented rapid development stage (2040–2060). As the energy structure changed, an energy system dominated by new and renewable energy sources was basically formed. With the research and development of new technologies, the improvement of energy utilization efficiency, and the addition of future dry heat rock development and utilization, geothermal development and utilization entered a stage of rapid development with a carbon-neutral orientation.
By setting parameters, we calculated the GHA, and by setting different scenarios, we predicted the dynamic development of geothermal utilization. Accordingly, we also calculated the carbon dioxide emissions reduction (CER) and measured the effect of geothermal energy in terms of energy transition. The main results are summarized in Table 3.

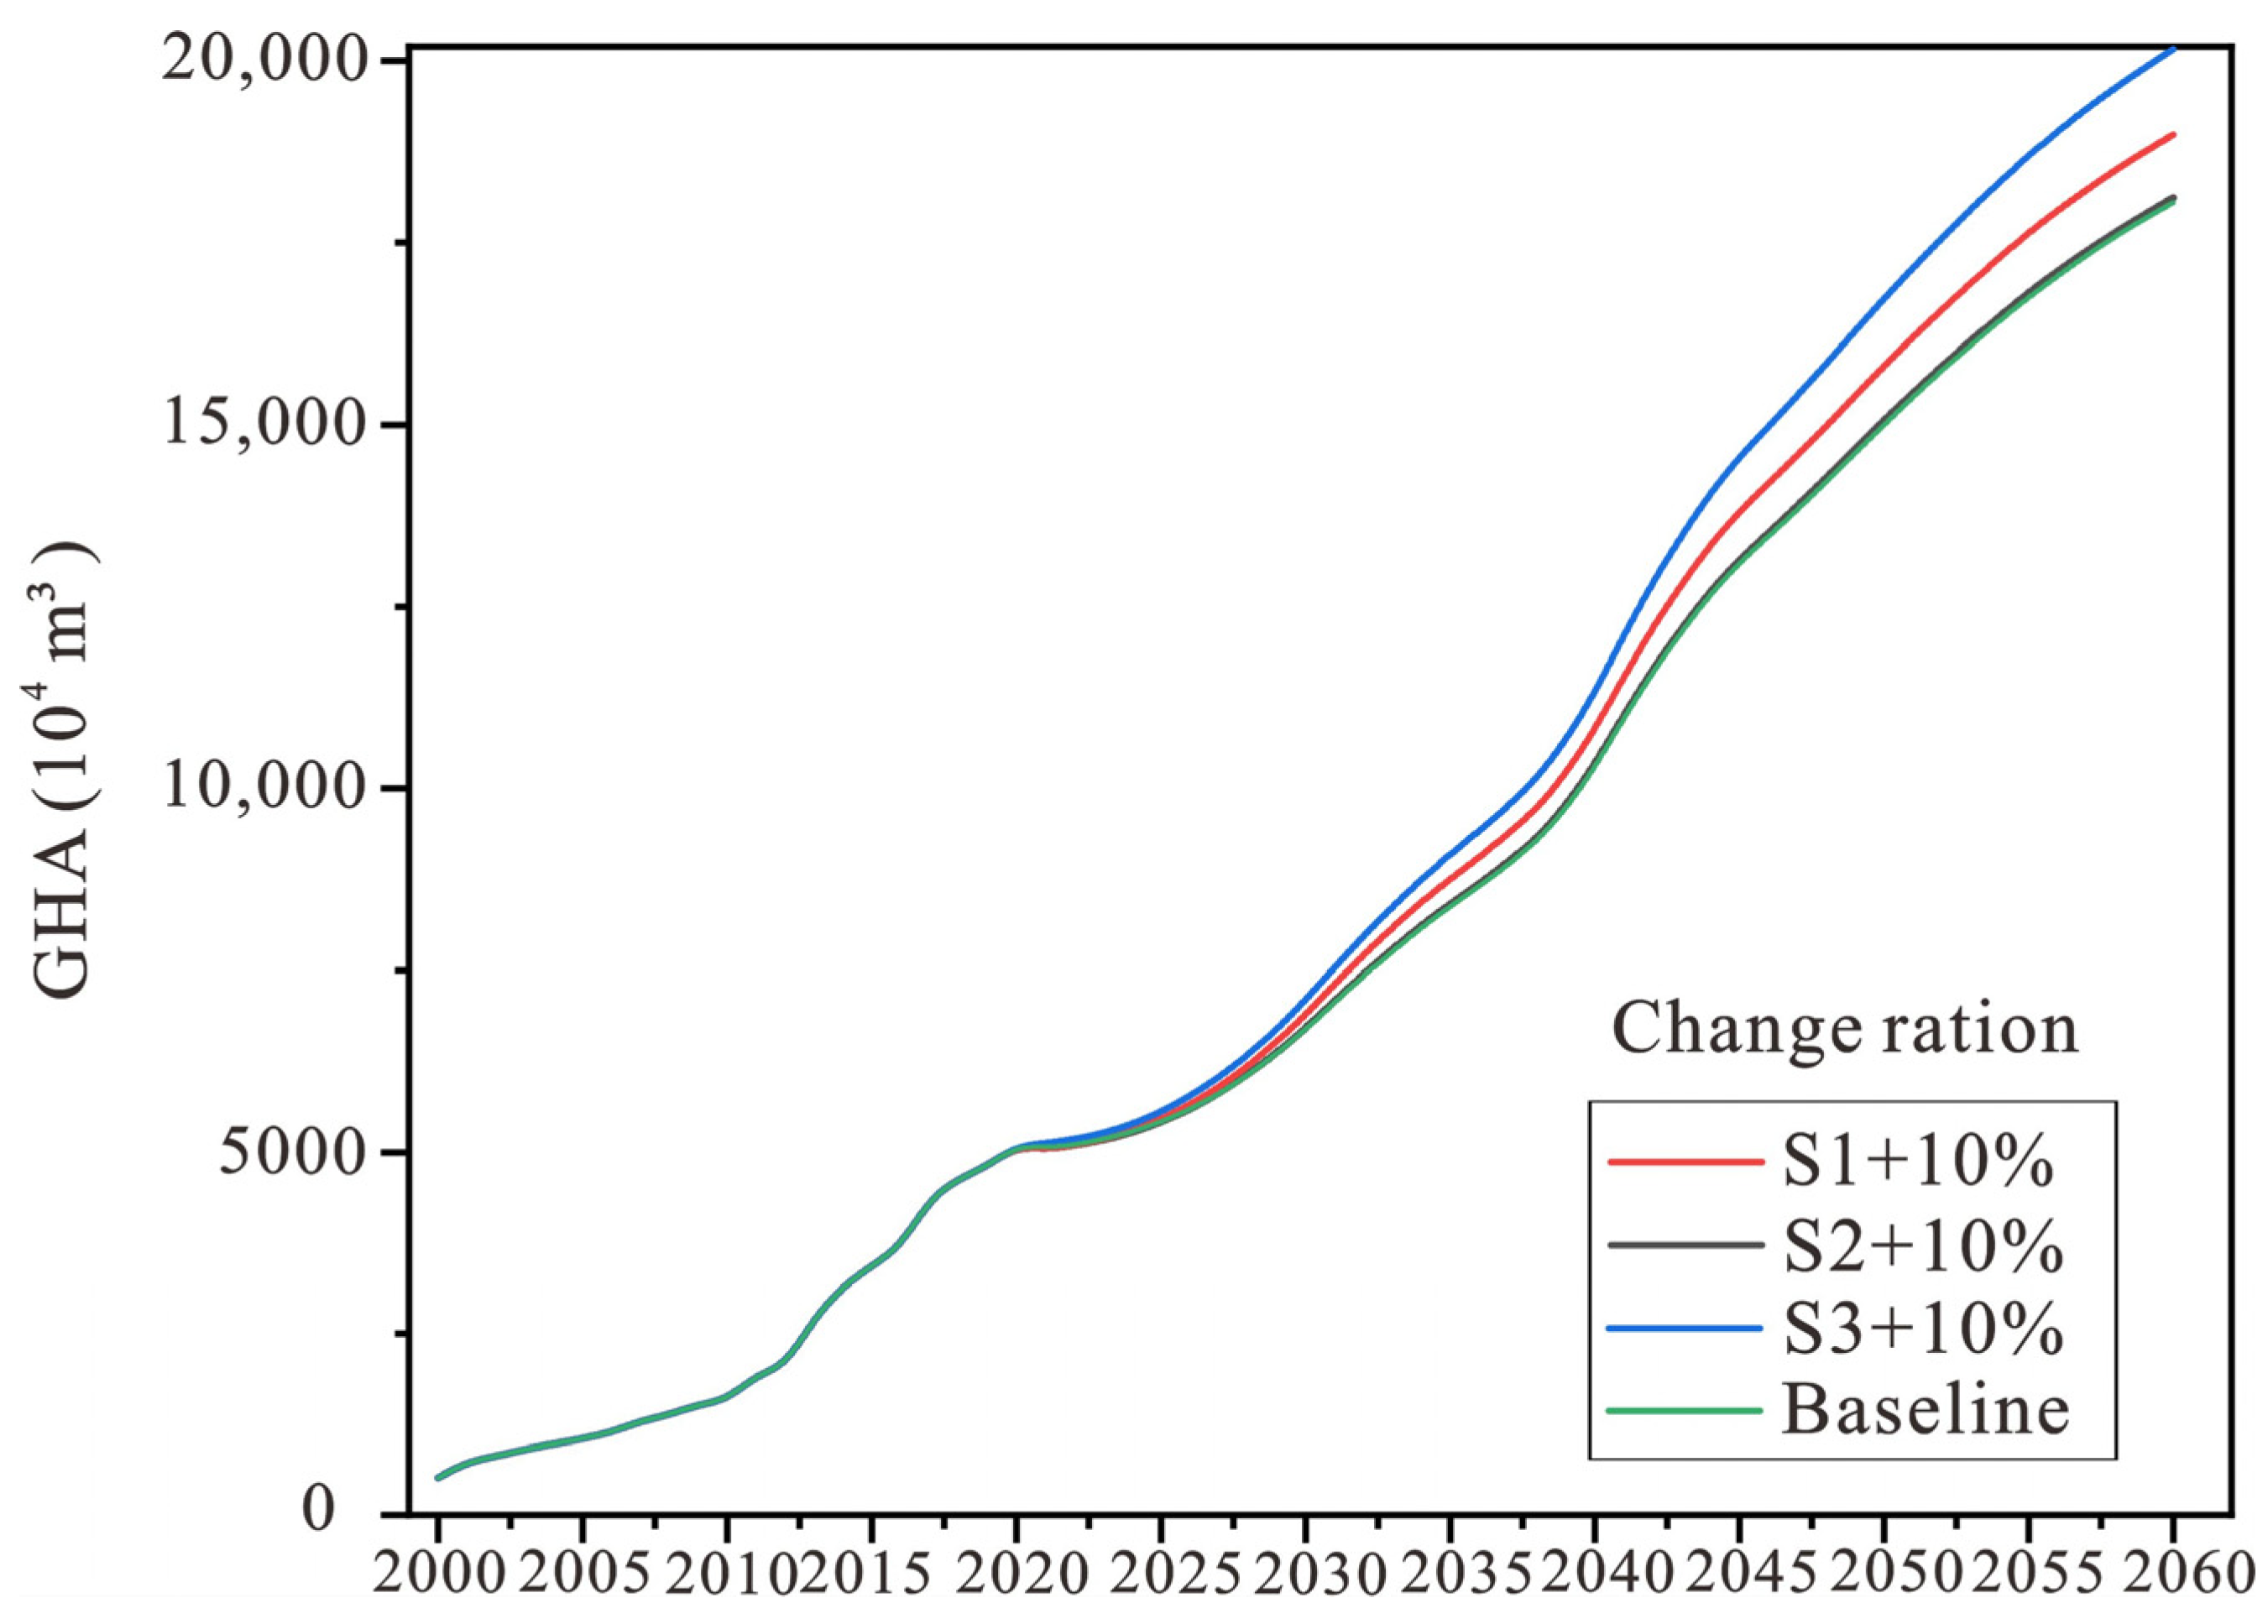
4.2.1. Multiscenario Prediction Results of GHA

GHA had different trends in different scenarios, which suggested that the scenario parameters were set reasonably. In the baseline scenario, the geothermal development was the slowest due to the unchanged policy, technology, and economy, and GHA would reach 5413.13 × 104 m2 in 2025 and 6688.92 × 104 m2 in 2030. The predicted GHA in 2030 under the EPDS scenario was 7249.52 × 104 m2, which was much higher than the 6859.92 × 104 m2 under the TPS scenario. This result indicates that the strength of economic incentives for geothermal development is greater than technological progress in the scenario set in this study. Additionally, under the PSS scenario, GHA would reach 5850.49 × 104 m2 in 2025, and GHA would reach 9101.01 × 104 m2 in 2030, which was much higher than under the other three scenarios. This indicated that the geothermal industry in Tianjin could be well developed under the incentive of the dual-carbon target (Figure 9a). Several factors explain these results. First, geothermal development and utilization had a strong positive externality, which was influenced by the policy regulation, especially under the strong policy stimulation of the dual-carbon target. The policy could change the unequal market environment and promote society to actively utilize geothermal and other clean energy by various means. Second, compared with technological progress, economic growth has had a greater impact on geothermal development and utilization. Economic growth and related financial subsidies could directly promote the growth of geothermal investment. At the same time, with the suppression of carbon tax and a reduction in fossil energy consumption, economic growth and related financial subsidies could also lead to an increase in the demand for geothermal and other clean energy, and promote the development of the geothermal industry. Third, the progress of technology level could improve energy efficiency. The shallow and hydrothermal geothermal energy development and utilization of technology, however, has been relatively mature. Technological innovation is a long process, and it is difficult to have a significant breakthrough in a short amount of time. Note that the GHA for the EPDS scenario was lower than that for the TPS scenario from 2021 to 2025, because the economy has lagged in promoting geothermal development.

4.2.2. Multiscenario Prediction Results of HRHA and SGEHA

As presented in Figure 9b,c, under the baseline scenario, HRHA and SGEHA were the lowest among the four scenarios, and SGEHA would reach 1306.74 × 104 m2 in 2025 and 1503.68 × 104 m2 in 2030. HRHA would reach 5185.24 × 104 m2 in 2025 and 15,330.9 × 104 m2 in 2030. The predicted SGEHA in 2030 under the EPDS scenario was 1670.97 × 104 m2, which was much higher than the 1543.07 × 104 m2 under the TPS scenario. Under the PSS scenario, because of the multiple effects of incentive policies, economic, and technological progress, HRHA and SGEHA grew rapidly. Over time, the gap between PSS and other programs would grow significantly. By 2060, SGEHA would reach 3369.37 × 104 m2, and HRHA would reach 28,362 × 104 m2. These results showed that policy incentives would have a much greater impact on HRHA and SGEHA than economic development and technological progress. Economic development affected HRHA and SGEHA more than technological progress. Compared with shallow geothermal energy, the main geothermal heating in Tianjin was primarily from hydrothermal geothermal energy, and hydrothermal geothermal energy heating would continue to be the primary source of geothermal heating in Tianjin in the future.

4.2.3. Multiscenario Prediction Results of CER

Considering the clean substitution effect of geothermal consumption for coal power, we used GB/T11615-2010 to calculate the CER of geothermal energy. By calculating the heat gained from geothermal water extraction and discounting the equivalent amount of coal saved, we used the amount of coal saved to calculate the amount of CO2 emission reduction and the treatment cost saved. As shown in Figure 9d, the CER under the baseline scenario was the lowest from 2021 to 2060. However, under the PSS scenario, it had the highest growth rate of CER. This was due to policy incentives, technological advances, and economic support. Notably, incentives enhanced the attractiveness of geothermal investment and promoted the development and utilization of geothermal energy. In addition, technological advances increased the efficiency of geothermal energy utilization and reduced the cost of investment, which in turn promoted the development of the geothermal industry. By 2060, the CER of geothermal energy would be approximately 1730.41 × 104 tc under the PSS scenario, which would be much higher than the 975.38 × 10⁴ tc under the baseline scenario.

5. Discussion

Policy, economy, and technology have different impacts on geothermal development in Tianjin. To better utilize the role of geothermal energy in clean heating and energy transition, we make the following recommendations.

5.1. Improve the Policy Mechanism

As shown in Table 3, compared with the EPDS and TPS scenarios, the growth rate of GHA was faster under the incentive policies of the PSS scenario. Geothermal development and utilization was influenced by the policy regulation, especially under the strong policy stimulation of the dual-carbon target. The policy could change the unequal market environment and promote society to actively utilize geothermal and other clean energy through various means. Furthermore, as the geothermal industry is part of the national strategic emerging industries, the government is strongly motivated to promote its development through robust policy support.
From 1995 to the present, Tianjin has issued many policies and industry standards on geothermal development and utilization, as shown in Figure 10a. These policies have contributed obviously to the rapid development of the geothermal industry in Tianjin, as shown in Figure 2. The current scale of geothermal utilization in Tianjin, however, is not able to meet the demand of the society, and the efficiency of resource utilization is not high. In addition, the geothermal industry chain has a long duration, including preliminary exploration and development, resource evaluation, geothermal drilling, geothermal heat pump heat end-use, and other aspects. Therefore, effective policies are crucial for the sustainable utilization of geothermal resources in Tianjin.
Iceland, the United States, Japan, Germany, and other countries have introduced tax incentives, including tax credits, and have given a certain percentage of financial subsidies to geothermal energy development and utilization projects. These supportive policies for the orderly, healthy, and rapid development of the geothermal energy industry have played a significant role in promoting carbon emissions reduction. For example, the US geothermal energy power generation capacity has ranked first in the world for many years. For Iceland, the use of geothermal energy heating has accounted for more than 90% of the national heating floor space [59].
However, policy implementation also carries several potential risks, including the following: The enforcement strength and continuity of policies may fluctuate due to shifting government priorities, fiscal conditions, or political environments; The economic viability of policy incentives may be constrained by fiscal budgets, market responses, or macroeconomic conditions. These factors collectively impact the development and utilization of geothermal energy. Tianjin should introduce fiscal and financial support policies conducive to the development and utilization of geothermal resources and should play an indirect role in the consumer market of geothermal-related products through electricity subsidies and government procurement. At the initial stage of the development of the geothermal energy industry, financial and monetary support policies that are conducive to the development and utilization of geothermal resources should be issued to introduce enterprises to carry out geothermal exploration and development and utilization.

5.2. Improve Economic Investment

Compared with technological progress, economic growth has had a greater impact on geothermal development and utilization (Figure 9a). The input of financial funds holds great importance to the development of geothermal energy, especially since the industrialization of geothermal energy remains in its early stages. Providing special financial subsidies for geothermal energy heating and offering moderate support for geothermal exploration and technological research and development can effectively boost market enthusiasm.
The development and utilization of geothermal resources is characterized by large initial investment, a long payback period, and high operation and maintenance costs. Thus, a significant investment has always been an important factor affecting the development and utilization of geothermal resources. Daniilidis et al. (2017) elaborated on the long construction cycle of up to eight years from geothermal exploration to geothermal utilization [60]. Thorsteinsson et al. (2010) measured a payback period of up to 33 years for geothermal heating [61]. Huculak et al. (2015) determined that the initial cost of geothermal utilization in Poland was much higher than that of coal [62].
Since 2000, Tianjin Municipal Finance has invested CNY 225 million of funds to support the development of the geothermal industry, averaging an annual investment of CNY 11.28 million, without considering the change in the value of funds over time (Figure 10b). By 2022, the geothermal development and utilization in Tianjin, which is based on hydrothermal energy, had replaced 277 million cubic meters of natural gas, creating direct economic benefits of CNY 1.166 billion. Therefore, the investment of funds holds great significance to the sustainable development and utilization of geothermal resources in Tianjin.

5.3. Promote Technological Progress

As shown in Table 3, TPS has less of an impact on geothermal heating in Tianjin than EPDS and PSS. Technological innovation is a long process, and it is difficult to have a breakthrough in a relatively short time compared with EPDS and PSS. The biggest technical problem facing the development and utilization of geothermal resources in Tianjin is the need to recharge. Geothermal recharge is a prerequisite for the sustainable development and utilization of geothermal resources, which can be used to effectively maintain the pressure of the thermal reservoir. Given the technological progress made in recent years, geothermal recharge in Tianjin has become relatively mature. By the end of 2021, the overall recharge rate of thermal storage in Tianjin had reached 81%.
Continued technological innovation, however, remains crucial for the sustainable development and utilization of geothermal resources in Tianjin, as technological advancements can improve energy efficiency. Zwaan found that if the cost of deep geothermal extraction is reduced by 13%, the geothermal investment market could reach USD 500 billion per year. Therefore, it is important to tackle the key technologies of geothermal energy exploration, development, and utilization in Tianjin. This includes strengthening the pore-type recharge technology, especially the recharge technology of the Nm group thermal reservoir, and developing comprehensive geophysical and geochemical technological means that can directly detect the underground temperature field.
Additionally, research and development should focus on high-temperature directional drilling technology and equipment as well as deep geothermal energy exploration and dry-hot rock technology. Breaking through the key technology of reservoir transformation and efficient heat transfer is also essential.

6. Conclusions

This study analyzed the influencing factors of geothermal development, established the SD model of geothermal development, predicted the geothermal development and utilization in different scenarios, and put forward specific policy recommendations. The main conclusions are summarized below.
1. Geothermal development and utilization is a coupled dynamic system closely related to social, economic, technological, policy, and resource endowment; the policy and economic inputs are the key factors driving the development and utilization of geothermal heat in Tianjin. The effect of the policy has a time lag, and compared with technological progress, the economic inputs have had a greater impact on the development of geothermal heat, and the impact of technological progress has been limited.
2. Through this model, we learned that the future geothermal development and utilization in Tianjin could go through four development stages, which include smooth development (2021–2024), rapid development under the dual-carbon target (2025–2031), smooth stage after carbon peak (2032–2036), and the carbon-neutral smooth development stage (2037–2060).
3. Under the baseline scenario, the geothermal heating area of Tianjin region would reach 6688.92 × 104 m2 in 2030 and 18,055.1 × 104 m2 in 2060, and under the PSS scenario, the geothermal heating area of Tianjin region would reach 9101.01 × 104 m2 in 2030 and 32,031.4 × 104 m2 in 2060. Under the PSS scenario, the CO2 emission reductions in the Tianjin region in 2030 and 2060 years would reach 491.66 and 1730.41 × 104 tc, respectively, and the savings of treatment cost would be CNY 492 and 1730 million.
4. The analysis of these results showed that although policy effects had a time lag, they also have had the greatest impact on geothermal development and utilization in Tianjin. Economic inputs have had a greater impact on geothermal development than technological progress, which has had a limited impact. The SD model can provide an open platform for policymakers to identify the key influencing factors of geothermal development. By adjusting relevant parameters and designing feedback, planners can simulate and evaluate the impacts of these different policies.
The development of the geothermal industry in Tianjin is closely related to resource endowment, social development, economic growth, energy constraints, and policy inputs. Tianjin has a strong foundation of geothermal energy resources, and the future market space for geothermal energy in Tianjin is vast. With more distinctive government guidance and policy leadership, including tax relief, financial subsidies, electricity subsidies, and other supportive policies, the geothermal heating area in Tianjin will have rapid growth.

Author Contributions

R.Y.: Conceptualization, Methodology, Writing—original draft, Data curation, Formal analysis, Writing—review and editing. X.Z.: Writing—original draft, Writing—review and editing, Validation. G.W.: Supervision. S.Z.: Resources. B.X.: Resources. W.Z.: Conceptualization. W.L.: Resources. H.S.: Data curation, Formal analysis. All authors have read and agreed to the published version of the manuscript.

Funding

This work was supported by the Geological Survey Project of China Geological Survey (Grant No. DD20221676); the National Key R&D Program (Grant No. 2021YFB1507400); and the General Research Fund of the Chinese Academy of Geological Sciences (Grant No. YK202304).

Institutional Review Board Statement

Not applicable.

Informed Consent Statement

Not applicable.

Data Availability Statement

The original contributions presented in this study are included in the article; further inquiries can be directed to the corresponding author.

Conflicts of Interest

The authors declare no conflicts of interest.

Abbreviations

The following abbreviations are used in this manuscript:
CERCarbon emissions reduction;
CO2Carbon dioxide;
EPDSEconomic Priority Development Scenario;
FAIFixed asset investment;
GCHPGround-coupled heat pumps;
GDPGross domestic product;
GHAGeothermal heating area;
GWHPGroundwater heat pumps;
HETCRHeat exchange technology conversion rate;
HRHAHydrothermal resources heating area;
MTCRMining technology conversion rate;
PGRPopulation growth rate;
PSSPolicy-Strengthening Scenario;
SCSStatus Continuation Scenario;
SDSystem dynamics;
SGEHAShallow geothermal energy heating area;
TPSTechnological Progress Scenario;
NmMinghuazhen group;
NgGuantao group;
EdPaleogene formation Dongying group;
OPaleozoic Ordovician group;
Cambrian group;
JxwMesoproterozoic Jixian Wumishan group.

References

  1. Zhu, X.; Zhang, Q.L.; Wang, W.L.; Liu, Y.G. Study on the influencing factors of rock-soil thermophysical parameters in shallow geothermal energy. J. Groundw. Sci. Eng. 2015, 3, 256–267. [Google Scholar] [CrossRef]
  2. Wang, G.; Zhang, W.; Liang, J.; Lin, W.; Liu, Z.; Wang, W. Evaluation of geothermal resources potential in China. Acta Geosci. Sin. 2017, 38, 448–459. [Google Scholar] [CrossRef]
  3. Hou, J.; Cao, M.; Liu, P. Development and utilization of geothermal energy in China: Current practices and future strategies. Renew. Energy 2018, 125, 401–412. [Google Scholar] [CrossRef]
  4. Luo, Z.; Lu, X. Characteristics and prospect of geothermal industry in China under the “dual carbon” target. Energy Geosci. 2023, 4, 100199. [Google Scholar] [CrossRef]
  5. Zhao, X.; Wan, G. Current situation and prospect of China’s geothermal resources. Renew. Sustain. Energy Rev. 2014, 32, 651–661. [Google Scholar] [CrossRef]
  6. Liu, C.; Lu, C.; Li, Y. Genetic model and exploration target area of geothermal resources in Hongtang Area, Xiamen, China. J. Groundw. Sci. Eng. 2022, 10, 128–137. [Google Scholar] [CrossRef]
  7. Ma, Y. Deep geothermal resources in China: Potential, distribution, exploitation, and utilization. Energy Geosci. 2023, 4, 100209. [Google Scholar] [CrossRef]
  8. Pang, Z.; Hu, S.; Wang, J. A roadmap to geothermal energy development in China. Sci. Technol. Rev. 2012, 30, 18–24. [Google Scholar] [CrossRef]
  9. Lund, J.W.; Huttrer, G.W.; Toth, A.N. Characteristics and trends in geothermal development and use, 1995 to 2020. Geothermics 2022, 105, 102522. [Google Scholar] [CrossRef]
  10. Ma, B.; Jia, L.; Yu, Y.; Wang, H. The development and utilization of geothermal energy in the world. Geol. Chin. 2021, 48, 1734–1747. [Google Scholar] [CrossRef]
  11. Toth, A.N. 7.11—Geothermal Utilization Statistics 2019. In Comprehensive Renewable Energy, 2nd ed.; Letcher, T.M., Ed.; Elsevier: Oxford, UK, 2022; pp. 220–234. [Google Scholar] [CrossRef]
  12. Zheng, R.; Zhou, P.; Tang, J. Current status and enlightenments of geothermal development in Europe. Chin. Min. Mag. 2017, 26, 13–19. [Google Scholar] [CrossRef]
  13. Milanović Pešić, A.; Brankov, J.; Denda, S.; Bjeljac, Ž.; Micić, J. Geothermal energy in Serbia—Current state, utilization and perspectives. Renew. Sustain. Energy Rev. 2022, 162, 112442. [Google Scholar] [CrossRef]
  14. Lebbihiat, N.; Atia, A.; Arıcı, M.; Meneceur, N. Geothermal energy use in Algeria: A review on the current status compared to the worldwide, utilization opportunities and countermeasures. J. Clean. Prod. 2021, 302, 126950. [Google Scholar] [CrossRef]
  15. Benti, N.E.; Woldegiyorgis, T.A.; Geffe, C.A.; Gurmesa, G.S.; Chaka, M.D.; Mekonnen, Y.S. Overview of geothermal resources utilization in Ethiopia: Potentials, opportunities, and challenges. Sci. Afr. 2023, 19, e01562. [Google Scholar] [CrossRef]
  16. Guan, X. Study on Method and Application of Economic Evaluation of Geothermal Resources. Ph.D. Thesis, China University of Geosciences, Beijing, China, 2014. [Google Scholar]
  17. Chen, S.; Zhang, Q.; Li, H.; Mclellan, B.; Zhang, T.; Tan, Z. Investment decision on shallow geothermal heating & cooling based on compound options model: A case study of China. Appl. Energy 2019, 254, 113655. [Google Scholar] [CrossRef]
  18. van der Zwaan, B.; Dalla Longa, F. Integrated assessment projections for global geothermal energy use. Geothermics 2019, 82, 203–211. [Google Scholar] [CrossRef]
  19. Leitch, A.; Haley, B.; Hastings-Simon, S. Can the oil and gas sector enable geothermal technologies? Socio-technical opportunities and complementarity failures in Alberta, Canada. Energy Policy 2019, 125, 384–395. [Google Scholar] [CrossRef]
  20. Sebri, M. Use renewables to be cleaner: Meta-analysis of the renewable energy consumption–economic growth nexus. Renew. Sustain. Energy Rev. 2015, 42, 657–665. [Google Scholar] [CrossRef]
  21. Manzella, A.; Bonciani, R.; Allansdottir, A.; Botteghi, S.; Donato, A.; Giamberini, S.; Lenzi, A.; Paci, M.; Pellizzone, A.; Scrocca, D. Environmental and social aspects of geothermal energy in Italy. Geothermics 2018, 72, 232–248. [Google Scholar] [CrossRef]
  22. Hanbury, O.; Vasquez, V.R. Life cycle analysis of geothermal energy for power and transportation: A stochastic approach. Renew. Energy 2018, 115, 371–381. [Google Scholar] [CrossRef]
  23. Yousefi, H.; Roumi, S.; Ármannsson, H.; Noorollahi, Y. Cascading uses of geothermal energy for a sustainable energy supply for Meshkinshahr City, Northwest, Iran. Geothermics 2019, 79, 152–163. [Google Scholar] [CrossRef]
  24. Wang, G.; Liu, Y.; Zhu, X.; Zhang, W. The statis and development trend of geothermal resources in China. Earth Sci. Front. 2020, 27, 1–9. [Google Scholar] [CrossRef]
  25. Jiang, Y.; Lei, Y.; Liu, J.; Li, L. Examination of the relationship between the exploitation of geothermal sources and regional economies: A Beijing case study. Water Environ. J. 2020, 34, 95–105. [Google Scholar] [CrossRef]
  26. Hähnlein, S.; Bayer, P.; Ferguson, G.; Blum, P. Sustainability and policy for the thermal use of shallow geothermal energy. Energy Policy 2013, 59, 914–925. [Google Scholar] [CrossRef]
  27. Guo, L. Study on the Industry Investment Fund under the Exploitation of Geothermal Resources. Ph.D. Thesis, Jilin University, Changchun, China, 2009. [Google Scholar]
  28. Kong, W. Study on Economic Evaluation of Geothermal Energy Developing and Utilizing. Ph.D. Thesis, China University of Geosciences, Beijing, China, 2014. [Google Scholar]
  29. Noorollahi, Y.; Gholami Arjenaki, H.; Ghasempour, R. Thermo-economic modeling and GIS-based spatial data analysis of ground source heat pump systems for regional shallow geothermal mapping. Renew. Sustain. Energy Rev. 2017, 72, 648–660. [Google Scholar] [CrossRef]
  30. Li, L. The Asian Geothermal Map and the Evaluation on Geothermal Potential. Master’s Thesis, Jilin University, Changchun, China, 2011. [Google Scholar]
  31. Yang, H.; Li, X.; Ma, L.; Li, Z. Using system dynamics to analyse key factors influencing China’s energy-related CO2 emissions and emission reduction scenarios. J. Clean. Prod. 2021, 320, 128811. [Google Scholar] [CrossRef]
  32. Zuo, Y.; Shi, Y.; Zhang, Y. Research on the Sustainable Development of an Economic-Energy-Environment (3E) System Based on System Dynamics (SD): A Case Study of the Beijing-Tianjin-Hebei Region in China. Sustainability 2017, 9, 1727. [Google Scholar] [CrossRef]
  33. Hirsch, G.B.; Levine, R.; Miller, R.L. Using system dynamics modeling to understand the impact of social change initiatives. Am. J. Community Psychol. 2007, 39, 239–253. [Google Scholar] [CrossRef]
  34. Sun, L.; Niu, D.; Wang, K.; Xu, X. Sustainable development pathways of hydropower in China: Interdisciplinary qualitative analysis and scenario-based system dynamics quantitative modeling. J. Clean. Prod. 2021, 287, 125528. [Google Scholar] [CrossRef]
  35. Li, S.; Yue, D.; Feng, Z.; Song, J.; Liu, D.; Song, Z. Sinoprobe and parameters study on deep karst geothermal reservoir in the Donglihu Area, Tianjin and its exploitable potential analysis. Geol. Chin. 2022, 49, 1732–1746. [Google Scholar] [CrossRef]
  36. Liu, Y.; Zheng, R.; Yi, L.; Yuan, J. A system dynamics modeling on wind grid parity in China. J. Clean. Prod. 2020, 247, 119170. [Google Scholar] [CrossRef]
  37. Jiang, Y. Simulation and selection of fiscal and taxation policy in geothermal industry development based on system dynamics. Ph.D. Thesis, China University of Geosciences, Beijing, China, 2020. [Google Scholar]
  38. Shi, H.; Wang, G.; Zhang, W.; Ma, F.; Lin, W.; Ji, M. Predicting the Potential of China’s Geothermal Energy in Industrial Development and Carbon Emission Reduction. Sustainability 2023, 15, 7508. [Google Scholar] [CrossRef]
  39. Yin, X.; Zhao, S.; Cai, Y.; Yan, J.; Xu, L. Dynamic evolution of geothermal reservoir characteristics in Tianjin in the last three decades of large-scale development. Acta Geol. Sin. 2023, 97, 297–313. [Google Scholar] [CrossRef]
  40. Liu, J.; Song, M.; Tian, G. Development situation of the geothermal resources and suggestion on sustainable development utilization in Tianjin. North Chin. Geol. 2012, 35, 67–73. [Google Scholar] [CrossRef]
  41. Ma, F.; Lin, L.; Wang, Y.; Cheng, W.; Zhao, S. Discussion on the sustainable exploitation and utilization of geothermal resources in Tianjin. North Chin. Geol. 2006, 29, 222–228. [Google Scholar] [CrossRef]
  42. Wang, G.; Wang, W.; Zhang, W.; Ma, F.; Liu, F. The status quo and prospect of geothermal resources exploration and development in Beijing-Tianjin-Hebei region in China. Chin. Geol. 2020, 3, 173–181. [Google Scholar] [CrossRef]
  43. Li, X.; Zhang, L.; Hao, Y.; Zhang, P.; Xiong, X.; Shi, Z. System dynamics modeling of food-energy-water resource security in a megacity of China: Insights from the case of Beijing. J. Clean. Prod. 2022, 355, 131773. [Google Scholar] [CrossRef]
  44. Minissale, A.; Borrini, D.; Montegrossi, G.; Orlando, A.; Tassi, F.; Vaselli, O.; Huertas, A.D.; Yang, J.; Cheng, W.; Tedesco, D.; et al. The Tianjin geothermal field (north-eastern China): Water chemistry and possible reservoir permeability reduction phenomena. Geothermics 2008, 37, 400–428. [Google Scholar] [CrossRef]
  45. He, Z.; Feng, J.; Luo, J.; Zeng, Y. Distribution, exploitation, and utilization of intermediate-to-deep geothermal resources in eastern China. Energy Geosci. 2023, 4, 100187. [Google Scholar] [CrossRef]
  46. Yuan, R.; Wang, G.; Feng, L.; Zhang, W.; Wan, W.; Cao, S. Evaluation of shallow geothermal energy resources in the Beijing-Tianjin-Hebei Plain based on land use. J. Groundw. Sci. Eng. 2021, 9, 129–139. [Google Scholar] [CrossRef]
  47. Wang, W.; Wang, G.; Zhu, X.; Liu, Z. Characteristics and potential of shallow geothermal resources in provincial capital cities of China. Geol. Chin. 2017, 44, 1062–1073. [Google Scholar] [CrossRef]
  48. Tian, G.; Lin, L.; Cheng, W.; Zeng, M.; Liu, D.; Song, M. The construction of dynamic monitoring network for the development and utilization of shallow geothermal energy in Tianjin. Geol. Chin. 2011, 38, 1660–1666. [Google Scholar] [CrossRef]
  49. An, Q.; Wang, Y.; Zhao, J.; Luo, C.; Wang, Y. Direct utilization status and power generation potential of low-medium temperature hydrothermal geothermal resources in Tianjin, China: A review. Geothermics 2016, 64, 426–438. [Google Scholar] [CrossRef]
  50. Yang, J.; Wang, D.; Niu, W.; Xiang, Z.; Liu, Y.; Zhao, Z. Prospects and problems of geothermal resources exploitation and utilization in Tianjin. North Chin. Geol. 2022, 45, 1–6. [Google Scholar] [CrossRef]
  51. Pang, Z.; Huang, S.; Hu, S.; Zhao, P.; He, L. Geothermal studies in China: Progress and prospects 1995–2014. Chin. J. Geol. 2014, 49, 719–727. [Google Scholar] [CrossRef]
  52. Wang, Y.; Liu, Y.; Dou, J.; Li, M.; Zeng, M. Geothermal energy in China: Status, challenges, and policy recommendations. Util. Policy 2020, 64, 101020. [Google Scholar] [CrossRef]
  53. Long, H.; Zhu, Q.; Tian, P.; Hu, W. Technologies and Applications of Geophysical Exploration in Deep Geothermal Resources in China. In Proceedings of the World Geothermal Congress, Melbourne, Australia, 19–25 April 2015. [Google Scholar]
  54. Alsaleh, M.; Yang, Z.; Chen, T.; Wang, X.; Abdul-Rahim, A.S.; Mahmood, H. Moving toward environmental sustainability: Assessing the influence of geothermal power on carbon dioxide emissions. Renew. Energy 2023, 202, 880–893. [Google Scholar] [CrossRef]
  55. Laimon, M.; Mai, T.; Goh, S.; Yusaf, T. System dynamics modelling to assess the impact of renewable energy systems and energy efficiency on the performance of the energy sector. Renew. Energy 2022, 193, 1041–1048. [Google Scholar] [CrossRef]
  56. Apergis, N.; Payne, J.E. Renewable energy consumption and economic growth: Evidence from a panel of OECD countries. Energy Policy 2010, 38, 656–660. [Google Scholar] [CrossRef]
  57. GB/T11615-2010; Geological Exploration Specification for Geothermal Resources. Standardization Administration of China, Standards Press of China: Beijing, China, 2010.
  58. Rehan, R.; Knight, M.A.; Haas, C.T.; Unger, A.J.A. Application of system dynamics for developing financially self-sustaining management policies for water and wastewater systems. Water Res. 2011, 45, 4737–4750. [Google Scholar] [CrossRef]
  59. China Geological Survey; Ministry of Natural Resources. China Geothermal Energy Development Report; China Petrochemical Press: Beijing, China, 2018.
  60. Daniilidis, A.; Alpsoy, B.; Herber, R. Impact of technical and economic uncertainties on the economic performance of a deep geothermal heat system. Renew. Energy 2017, 114, 805–816. [Google Scholar] [CrossRef]
  61. Thorsteinsson, H.H.; Tester, J.W. Barriers and enablers to geothermal district heating system development in the United States. Energy Policy 2010, 38, 803–813. [Google Scholar] [CrossRef]
  62. Huculak, M.; Jarczewski, W.; Dej, M. Economic aspects of the use of deep geothermal heat in district heating in Poland. Renew. Sustain. Energy Rev. 2015, 49, 29–40. [Google Scholar] [CrossRef]
Figure 1. (a) Location of Tianjin, (b) geothermal resource distribution map of Tianjin, and (c) hydrothermal reservoir layering.
Sustainability 17 04005 g001
Figure 2. Historical development stages of geothermal energy in Tianjin.
Sustainability 17 04005 g002
Figure 3. Conceptual framework illustrating geothermal development.
Sustainability 17 04005 g003
Figure 4. Geothermal development subsystem diagram (a); stock flow diagram (b); causal loop diagram system diagram (c).
Sustainability 17 04005 g004
Figure 5. The built-up area of Tianjin superimposed on the distribution range of the different thermal reservoirs, including (a) Nm, (b) Ng, (c) Ed, (d) O, (e) Є, and (f) Jxw. The built-up area of Tianjin superimposed on the distribution range of the different heat pump-suitable areas, including (g) GWHP and (h) GCHP.
Sustainability 17 04005 g005
Figure 6. Actual and simulated data of GHA (a), SGEHA, and HRHA (b).
Sustainability 17 04005 g006
Figure 7. The results of sensitivity analysis.
Sustainability 17 04005 g007
Figure 8. Results of the baseline scenario.
Sustainability 17 04005 g008
Figure 9. Results of the scenario analysis. (a) Geothermal heating area (104 m2); (b) shallow geothermal energy heating area (104 m2); (c) hydrothermal resources heating area (104 m2); (d) carbon emissions reduction (104 t).
Sustainability 17 04005 g009
Figure 10. Statistics on the geothermal policies, industry standards, and financial support in Tianjin. Note: The data in the https://www.pkulaw.com/ (accessed on 20 April 2025). (a) Geothermal policies and industry standards; (b) municipal financial support.
Sustainability 17 04005 g010
Table 1. Geothermal resources by thermal reservoir.
Thermal ReservoirDistribution Area/km2Geothermal Resources/1018 JEquivalent Standard Coal/108 J
Nm9467.44260.37788.843
Ng8451.97126.93243.308
Ed4882.8539.1613.362
O3548.86125.37242.778
2753.8354.73418.675
Jxw3440.78259.96699.604
Table 2. Parameter settings of different scenarios.
ScenariosParameters
Economic Priority Development Scenario (EPDS)According to the “Fourteenth Five-Year Plan for National Economic and Social Development of Tianjin City” and the outline of the 2035 Visionary Goals, the growth rate of the GDP in Tianjin will adjust to 6% from 2021 to 2025, 4% from 2026 to 2035, 3% from 2036 to 2050, and 2% from 2051 to 2060.
Technological Progress Scenario (TPS)The increase in heat exchange technology conversion rate (HETCR) and mining technology conversion rate (MTCR) in Tianjin will be 5% from 2021 to 2030. After carbon peaking, the increase in HETCR and MTCR will be 2% from 2031 to 2050. In consideration of the carbon neutrality goal, the increase in HETCR and MTCR will be 1% from 2051 to 2060.
Policy-Strengthening Scenario (PSS)Tianjin City Territorial Spatial Master Plan (2021–2035): Tianjin’s resident population will reach 15 million in 2025. The planned population of Tianjin City in 2035 is controlled at about 20 million. Under the above the EPDS and TPS scenarios, the proportion of the urban population in 2035 will be 85%.
Table 3. Results under each scenario in key years.
Year202520302060
Baseline (104 m2)GHA5413.136688.9218,055.1
HRHA4106.395185.2415,330.9
SGEHA1306.741503.682724.14
CER292.43361.35975.38
EPDS (104 m2)GHA5554.87248.5222,739.2
HRHA4152.855578.5519,420.6
SGEHA1401.941670.973318.56
CER300.08391.641228.43
TPS (104 m2)GHA5472.356859.9218,952.5
HRHA4153.155316.8516,087.1
SGEHA1319.201543.072865.41
CER295.63370.591023.86
PSS (104 m2)GHA5850.499101.0132,031.4
HRHA4418.187318.4728,362
SGEHA1432.311782.543369.37
CER316.06491.661730.41
Disclaimer/Publisher’s Note: The statements, opinions and data contained in all publications are solely those of the individual author(s) and contributor(s) and not of MDPI and/or the editor(s). MDPI and/or the editor(s) disclaim responsibility for any injury to people or property resulting from any ideas, methods, instructions or products referred to in the content.

