Abstract
Rural livability is the essence of people’s well-being and rural revitalization, in which social networks in daily life play important roles. However, the role of social interactions has long been ignored. This study aims to develop an index system for rural livability evaluation considering social interactions. We chose Ezhou city as an example, and two potential social networks were constructed, and the multi-scale characteristics of social networks at the village level and patch level were used as the proxy indicator of social convenience, then together with ecological livability and economic vitality to comprehensively evaluate rural livability. The empirical results showed a heterogeneous spatial distribution in two social networks. It also presented a tendency of “poor social convenience, general economic vitality and benign ecological livability” of rural areas in each dimension, and a complex pattern of stripped and concentric distribution in the spatial distribution of the total rural livability. It further verified that the social interactions had a direct impact on rural livability by a comparison of two evaluation results. This study advances our understanding of the role of social interactions in rural livability evaluation and provide reasonable suggestions for policymakers in future construction of livable countryside.
1. Introduction
Over the past few decades, with the increasing social concerns about environmental deterioration, strong calls for sustainable development have proliferated in all countries [1]. The idea of “human needs” was highlighted in the influential definition of sustainable development in the Brundtland commission back in 1987 [2]. Livability, as a vision for aspired or desired life of residents, can help authorities continuously meet the needs of current residents through adjusting and formulating opportune policies. Consequently, livability evaluation has become an effective tool for planners and policymakers to determine rural development trajectories and improve the quality of human life [3]. In fact, the sustainable development is impossible without a better livability [4].
China’s post-1978 reform and opening-up era has witnessed unprecedented industrial expansion and urban growth, precipitating complex sustainability dilemmas that manifest most acutely in rural–urban bifurcation [5]. The entrenched urban-centric development paradigm has engendered systemic constraints on rural revitalization [6]. This situation of rural–urban bifurcation has triggered a self-reinforcing cycle of rural depopulation, with approximately 250 million rural people pouring into cities and towns between 2000 and 2020, fundamentally altering rural demographic landscapes and productive capacities [4,7,8]. As the largest developing nation, China has 2.6 million villages and a rural population of 600 million. Rural development is closely bound up with the future and human well-being of China [9,10]. In view of this, China’s government has enacted the No.1 Central Document (2015), aiming to improve the rural human settlement environment and build a beautiful and livable countryside. Then, in 2017, it further put forward the Rural Vitalization Strategy (RVS) in the report of the Nineteenth National Congress of the Communist Party of China. Under the general requirements of “prosperous industry, livable ecology, civilized rural style, effective governance and affluent living”, rural livability has been positioned as both an operational mechanism and teleological objective for sustainable rural transformation [4]. Based on this, fully understanding the current situation and exploring the spatial characteristics of rural livability are significant tasks for providing new insights into future livable countryside construction, as well as the improvement of the rural human settlement environment.
However, what exactly is the so-called livability? What are its components? Current academic studies predominantly conceptualize rural livability as a multidimensional construct, evaluating place-based conditions related directly to quality of life and well-being. Existing metrics typically emphasize material determinants of the rural human settlement environment, such as geographical location and public facility conditions. For instance, Khorasani analyzed and explained the spatial factors on rural livability of suburban villages in Varamin County in terms of economic, social and environmental dimensions [11]. Li et al. has sorted out the connotation of rural livability and quantified rural livability by comprehensively considering infrastructure conditions, public facility accessibility, employment opportunities and environment sustainability [4]. In addition, Li et al. constructed an ecological livability index through rural ecological sustainability and rural livable sustainability, and concluded that rural sustainable development in China was unbalanced and inadequate [12]. Nevertheless, a livable place is more than that: it is made up of people who live in rural areas. Rural residents are ultimately the direct beneficiaries, and the people-centric philosophy stands as the paramount guiding principle in fostering habitable rural communities [13]. In fact, the needs of rural residents stem not merely from the physical environment, but equally from intangible social dimensions pertaining to communal engagement [14]. These interpersonal dynamics constitute fundamental determinants of quality of life and well-being [15,16]. In particular, rural China is usually described as an “acquaintance society”, in which the social structure resembles a set of concentric circles with the center as the “self” reflecting the hierarchical differentiation in the closeness of relations [17]. Close-knit villages or rural communities with deeply rooted social bonds facilitate communal support mechanisms, in which people share public facilities, disseminate agricultural innovations and receive help promptly for difficulties in daily life to the greatest extent. Thus, these relational assets constitute a vital provisioning system for fulfilling both the material requisites and psychosocial well-being in rural China [18]. Evidently, in addition to the physical factors of place, people can feel a strong willingness to live in a place because of close ties among people.
Although the existing research that have been carried out evaluate rural livability from the physical conditions of place, there is, to date, insufficient attention on the application of social networks in rural livability evaluation. In reality, with the emergence of transportation and information networks, rural living spaces have evolved into interconnected social ecosystems shaped through communal interactions to address daily livelihood requirements within local communities. Social network analysis has been widely applied to address diverse issues of rural development, as it rejects isolated explanations of individuals and instead emphasizes on the structural patterns of interpersonal relationships within communities [19]. Moreover, a growing body of the literature has also examined how social networks shape rural development trajectories, providing predictive insight into community engagement levels [20,21,22]. However, these findings have rarely been integrated into rural livability evaluation. Therefore, it is urgent to integrate social interactions into rural livability evaluation for rural revitalization and sustainable development.
To fill this research gap, this paper constructs a theoretical framework for rural livability assessment that systematically incorporates inter-settlement social interactions. Specifically, this paper would like to complete the following three objectives: (1) to construct social networks at a village level and patch level based on daily life needs; (2) to establish a multidimensional index system of rural livability evaluation considering social interactions and (3) to conduct deep geospatial pattern analysis of rural livability to provide targeted suggestions for rural revitalization.
2. Study Area
In this paper, we have chosen Ezhou city as the study area, which lies in the east of Hubei province in the central China, located between 30°00′–30°06′ N and 114°32′–115°05′ E (Figure 1). Ezhou city includes 21 towns and 4 sub-districts, covering a land area of 1596 km2 and a permanent population of 1.07 million in 2023.
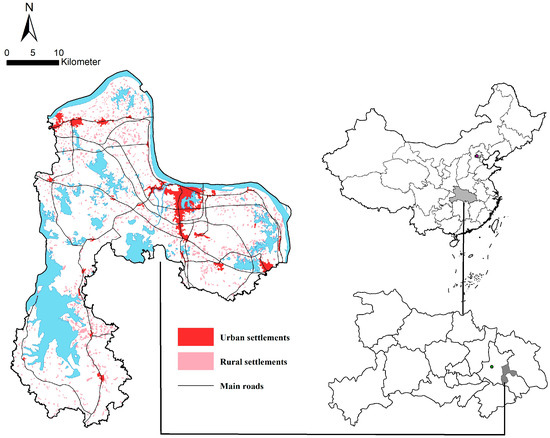
Figure 1.
Location of the study area and spatial distribution of public facilities.
In recent years, Ezhou city has also experienced rapid urbanization, of which the urbanization rate has increased from 30% in 1990 to 67.9% in 2023. Meanwhile, the incomes of urban and rural residents have seen stable growth, as the per capita income of rural residents is CNY 24,929.00 and that of urban residents is CNY 36,982.00 in 2023. As a nation-level demonstration of urban–rural integration development in China, Ezhou city has actively promoted the reconstruction of rural residential lands and the improvement of rural living environment for beautiful countryside construction in recent years. The city’s “Beautiful Livable Village Demonstration Project” (2015–2021) transformed 21 villages into ecological and economic hubs, emphasizing village cohesion and infrastructure modernization. The rate of pollution-free treatment of household waste and household sewage are, respectively, 100% and 73%. These results illustrate that the rural residential environment has been improved greatly in Ezhou city. Therefore, Ezhou city could serve as a prototype and model for other regions to extract the developing characteristics under the context of RVS in China. Secondly, Ezhou is renowned as the “Jiangnan Watertown” of Hubei, which provides a microcosm of China’s rural ecological diversity. Additionally, the accessibility of public facilities is not an issue for Ezhou city, with a relatively high urbanization level. Thus, the blend of ecological richness, socioeconomic complexity and living environments’ homogeneity makes it an exemplary region for evaluating rural livability, with findings offering transferable lessons for similar contexts nationwide.
3. Materials and Methods
3.1. Construction of Index System Based on the Concept of Rural Livability
Rural livability is a general concept that is closely tied to many connotations such as sustainability, quality of life and healthy communities. However, it varies from place to place and over time. Thus, there is no precise and consistent definition and measurement strategy for rural livability. Most early studies did not necessarily use the discourse of “livability”, but often refer to “suitability for living” to describe the human–environment interdependencies [7,23]. On the other hand, scholars also frequently conceptualize rural livability as rural residents’ quality of life and well-being, laying emphasis on geographical location, public service provision and employment opportunities [4,24]. In recent years, increasing attention has been paid to ecological livability amid growing rural eco-environmental challenges. Especially in China, the creation of ecologically livable villages has become central to the Rural Revitalization Strategy. Consequently, rural livability is now operationally defined as a combination of livelihood and ecological sustainability [12,25].
Considering that villages are the carriers of massive production, living and ecological spaces for rural residents, rural livability refers not only to physical settings but also to social interactions within living spaces [26]. Therefore, on the premise of coordinated and sustainable development of human living and the ecosystem, rural livability in this paper is defined as a place equipped with the ability to accommodate the individual requirements and desires of physical and social living environments. It shows the conceptual model of rural livability in this study (Figure 2), in which the desires include three dimensions: ecological livability (EL), economic vitality (EV) and social convenience (SC). Notably, unlike traditional methods that measure SC through the public facility accessibility, this study quantifies SC from the perspective of social networks. The details of each dimension and index choice were shown in Table 1.
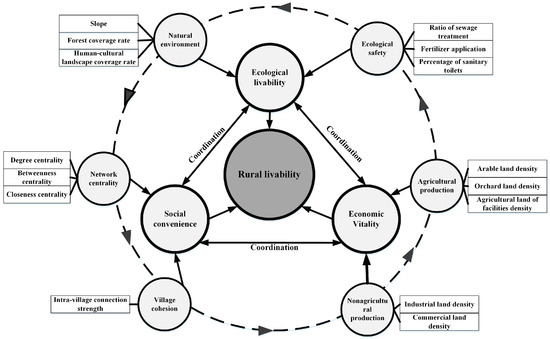
Figure 2.
Conceptual model of rural livability.

Table 1.
Evaluation dimensions and indicators for rural livability.
3.1.1. Ecological Livability (EL)
EL reflects the benign interaction between rural residents and the eco-environment, characterized by a stable ecosystem, affluent ecological services and material resources for rural production and living activities [27]. A pleasant rural ecological environment not only brings physical and mental health for rural residents, but also indirectly promotes sustainable rural development [28]. There are multiple factors influencing ecological livability. In this paper, we evaluate it through two aspects: natural environment and ecological safety. The former emphasizes residents’ needs for natural conditions such as abundant water resources, smooth terrain and extensive coverage of human-cultural landscapes and forests, while the latter focuses on ecological safety needs, for instance, the usage of fertilizer and waste disposal can cause adverse environmental impacts.
3.1.2. Economic Vitality (EV)
EV possesses the capacity to provide essential material resources and enhance income for rural residents [29]. Effective economic development should enable the fulfillment of rural residents’ needs in both agricultural and non-agricultural production, which primarily encompass favorable tillage conditions and adequate employment opportunities in secondary and tertiary industries. Thus, this paper employs the density of farmland, orchard and agricultural facility land to assess the agricultural production capacity, while utilizing commercial and industrial land density to evaluate the non-agricultural employment potential.
3.1.3. Social Convenience (SC)
SC enhances the well-being by residents’ daily life requirements [14], primarily including access to education, healthcare and social participation. Existing works predominantly emphasize public facility accessibility, particularly regarding education, healthcare and recreation, while neglecting participatory dimensions inherent in social interactions. A series of network centrality indicators, including degree, betweenness and closeness, are measured to express individual role and participation in obtaining public facilities [22]. Moreover, intra-village connection strength is calculated to assess village cohesion. It is said that settlements with high centrality, to some extent, possess enhanced capacities for securing both essential and advanced public facilities while maintaining close ties with others. Villages with strong cohesion foster intensified social place attachment [20]. Instead, even places with superior facility accessibility prove nonviable as livable spaces if they fail to cultivate social connectivity, resulting in detrimental isolation. Specific modelling methods of social networks will be introduced in Section 3.2.
3.2. Measurement of Social Convenience
3.2.1. Modeling Social Networks Among Rural Settlements
Given the significant decline in kinship networks in rural areas, scholars have increasingly focused on social relationships emerging from residents’ daily interactions within specific geographical boundaries [22]. Despite the multifaceted nature of inter-settlement connections, empirical challenges persist in first-hand data acquisition. In daily living spaces, social relationships are produced through interpersonal communications and socialization with local residents, predominantly manifested in the travel behavior of local residents and routines aimed at fulfilling essential needs such as employment, healthcare access, education and shopping [30]. Therefore, rural public facilities serve as critical analytical lenses for our understanding of a wide range of social relations. Obviously, in addition to affording the primary function of meeting residents’ needs, public facilities perform vital social roles to strengthen local ties and foster social cohesion [20]. Thus, public facilities have become indispensable intermediaries in maintaining social relationships. Social networks in this study were simulated based on residents’ needs for various public facilities. A specific illustration of social networks is as shown in Figure 3.
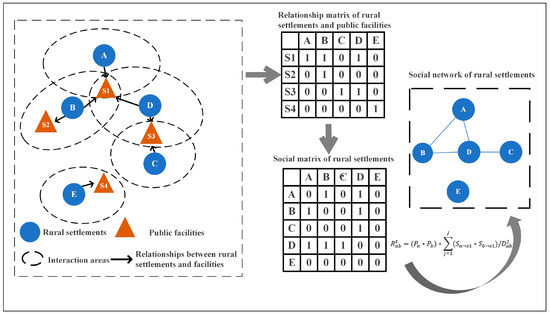
Figure 3.
Illustration of social network modelling.
In this paper, eight types of public facilities are employed to simulate social interactions in rural living spaces. Given the diversified needs for public facilities in rural areas, social networks are classified into two types. One is the basic social network (BSN), which is modeled based on the essential needs, encompassing kindergartens, primary schools, clinics and cultural stations, while the other is the extended social network (ESN), which is derived from high-level needs of public facilities, including secondary schools, health centers, cultural centers and fairs. As shown in Figure 3, the node represents each settlement, while the edge denotes social connections. A link exists between two settlements (i.e., node A and B) if they can arrive at the same facilities (i.e., S1) within interaction zones. In terms of interaction strength, it is closely related to population and distances between two settlements in the traditional spatial interaction model, i.e., gravity model. In this study, we have modified the population variable by the number of sharing facilities, which is equal to the sum of population visiting to sharing facilities. Thus, the interaction strength of a certain type t of public facility between settlement m and n is calculated as follows:
where is the interaction strength for a certain type t of public facility between settlement m and n; and are the population of settlement m and n; and are the possibility of settlement m and n visiting to the sharing facility j, representing the comprehensive adjustment of actual population flow and is the travel time from settlement m to settlement n. J is the amount of sharing facilities in the type t of facility.
In general, residents demonstrate higher propensity to utilize facilities with greater service capacity and proximate spatial accessibility when multiple options coexist in ideal interaction zones. Thus, the probability of settlement m accessing specific facilities is obtained using the Huff model [31]. Assuming constant service capacity (standardized to 1 for all facilities), the possibility of settlement m accessing facility k can be mathematically expressed as follows:
where is the possibility that settlement m attending to facility k and is the travel time from settlement m to facility k. K is the number of facilities in the interaction area of settlement m.
Then, the total interaction strength between settlement m and n is viewed as the sum of interaction strength of all types of public facilities, which is calculated as follows:
where is the total interaction strength between settlement m and n and is the weight of the type t connection, determined by the Delphi method.
In this paper, the time residents spend moving between places is typically determined by the vehicle choices and land-use types [30]. The average speeds of different means of transportation are shown in Table 2. Based on the cost value, the cost rater (10 m × 10 m) can be calculated using the cost distance tool in ArcGIS 10.2. Ideal interaction areas of rural settlements differ significantly across public facility types. According to our investigation, motorbikes, public buses and private cars dominate access to the secondary schools, health centers, cultural centers and fairs, while walking is the main choice for residents to go to the kindergartens, primary schools, clinics and cultural stations. We set the interaction time to the average shortest time, 1.5 times, 2 times and 3 times, and found that with extended interaction time thresholds, the number of links become gradually greater, which also resulted in massive spurious and statistically insignificant connections. After repeated experiments, the ideal interaction time of each type of public facilities was calibrated at 1.5 times the average shortest time. The ideal interaction times of various public facilities are presented in Table 3.
Table 2.
Time costs in different situations in Ezhou city.
Table 3.
The ideal interactive time of each public facility.
3.2.2. Description of Characteristics of Social Networks
In order to better explain social convenience from the network perspective, we analyzed the multi-scale characteristics of social networks at the village level and patch level. The former is a description of village cohesion while the latter describes an individual settlement’s characteristics, such as degree, betweenness and closeness centrality. A village with strong social cohesion could provide social convenience in physical and emotional aspects. It is defined as the sum of interaction strength of settlements within every village in this paper.
In terms of the individual node, many previous studies have confirmed that the role of each node in social network affected willingness, performance and accessibility of the resources [21,22,32,33]. Similarly, the roles of rural settlements in social networks in daily life could reflect their abilities to provide public facilities and impacts on other settlements. Degree centrality depicts the amount of ties a node has with other nodes [34,35]. A settlement with a higher degree centrality is expected to have access to more resources. Betweenness centrality measures the probability of a node being on the shortest path between any two nodes [18,22]. A settlement with higher betweenness generally captures an intermediary position, serving as a bridge to facilitate interactions between other settlements so that it has greater capacity to provide public services for other settlements. Closeness centrality refers to the sum of the shortest paths from a given nodes to other nodes [35]. A settlement with higher closeness is closely related to other settlements so that it can obtain public services more quickly and efficiently. The formulas of the three centrality indicators can be found in [35,36]. However, given that the abovementioned centrality indicators lay stress on a certain aspect of settlements, an integrated centrality is developed using the entropy method to compound three indicators. It not only embodies the connections of a settlement with other settlements but considers the roles of serving as bridges in the network. It can be defined as follows:
where, is a weighted centrality of node i. , and represent degree, betweenness and closeness centrality of node i, respectively. , and are the corresponding weights of each centrality indicator.
3.3. Data Sources and Preprocessing
According to the index system of rural livability, two kinds of data were obtained in this study: spatial data and statistical data. Spatial data came from the Ezhou Municipal Bureau of Land and Resources, involving land use and cover data of 2018 (spatial resolution of 30 m), administrative boundaries of towns and villages and the digital elevation model (DEM). The public facilities and enterprises were obtained from the point of interest of Baidu map (http://lbsyun.baidu.com, accessed on 30 December 2020) and field investigation. The statistical data, i.e., population of villages and per capital income, were acquired from the Statistical Yearbook of Ezhou (2018).
3.4. Index Weight Determination
The weight of each individual indicator in each dimension was determined through combining the Expert Scoring Method with Analytic Hierarchy Process (AHP). The method of AHP often includes several steps such as building a hierarchy model, constructing a pairwise comparison matrix, calculating the indicator weight, and calculating comprehensive evaluation. In this paper, we first invited some experts to make a paired comparison and scoring process for each dimension. Referring to the literature [4] and the experts’ suggestions, the three dimensions of EL, EV and SC were considered equally important, and were assigned 0.333, 0.334 and 0.333, respectively. Then, we began to compare between indexes of each dimension, and the weights of the indexes were successfully calculated by constructing a judgment matrix and checking for consistency using the Yaahp 7.0. The specific attributes and weights of the indicators are shown Table 1.
3.5. Evaluation Model of Rural Livability
Comprehensive rural livability was measured through the weighted summation of each evaluation index. The evaluation model is shown as follows:
where is the rural livability of cell and is the score of each index. is the weight of different indexes.
4. Results
4.1. Description of Social Networks in Daily Life
The characteristics of social networks in daily life were presented in Figure 4. There were 7576 links with an average value of 6.9 in BSN, while there were 11,862 links with an average value of 10.9 in ESN. These results indicated that as the interaction areas expanded, settlements could be connected more in daily life. Moreover, the village cohesion and network centrality showed heterogeneous spatial distributions in both BSN and ESN.
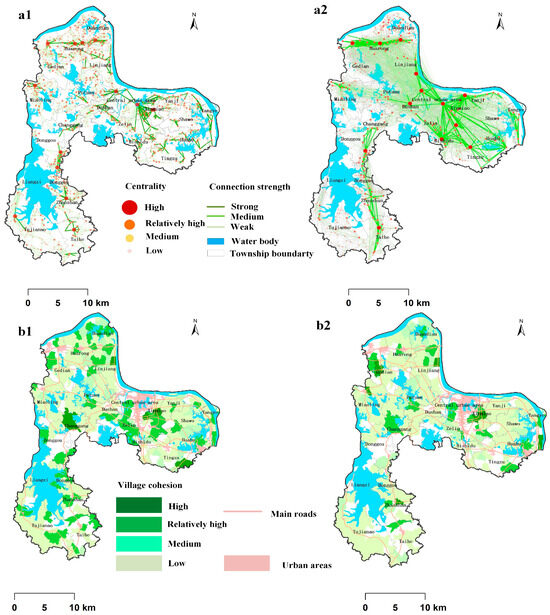
Figure 4.
Characteristics of BSN and ESN. Network centrality in BSN and ESN (a1,a2). Village cohesion in BSN and ESN (b1,b2).
(1) Village cohesion. The value of village cohesion in BSN ranged from 0 to 242.667, with an average of 1.936. For BSN, approximately 20% of villages have high and relatively high values in village cohesion. In contrast, the value of village cohesion in ESN ranged from 0 to 8.185, with an average of 1.152, and the number of high-value villages in ESN was obviously less than that in BSN. This is because rural residents exhibited lower mobility when accessing basic public facilities in BSN, preferring to obtain services locally and maintaining intra-village interactions. Conversely, in order to seek high-level public facilities, extended interaction areas in ESN allowed residents to connect with more people outside villages. Thus, social interactions within villages were more active than outside in BSN, but it is the opposite in ESN, reflecting village cohesion in BSN as stronger than that in ESN. Additionally, it was found that most villages with strong cohesion both in BSN and ESN were located in the northern and eastern regions, characterized by flat terrains, convenient traffic, compact settlement patterns and diverse public facilities, which are usually conducive to social interactions. Conversely, low-cohesion villages were predominantly distributed in southern mountainous areas marked by fragile settlements, inadequate transportation and public facilities.
(2) Individual network centrality. The integrated centrality in BSN ranged from 0.009 to 0.938, with an average value of 0.073, whereas it ranged from 0.001 to 1 with an average value of 0.011 in ESN. This implies that the significance of settlements diminishes somewhat in ESN. Specifically, except for urban settlements, high-centrality rural settlements were primary concentrated in the northern regions and peri-urban zones, while the low-value settlements were largely distributed in the east and south in BSN. By contrast, centrality was overwhelmingly dominated by urban settlements, with minimal high values in rural settlements in ESN. The results revealed that compared with ESN, except for urban settlements, a few rural settlements were still easy to obtain goods and services and generate social interactions, playing important roles in daily life, whereas cities and towns occupied absolutely dominated positions in ESN. Additionally, northern and peri-urban settlements demonstrated superior facility access across two networks, showing locational advantages in resource acquisition.
4.2. The Spatial Differentiation of Each Dimension in Rural Livability
The scores of the three dimensions were calculated and divided into five groups based on grading criteria: the mean plus and minus one standard deviation, as well as the mean plus and minus 0.5 standard deviation [37,38]. The classification criteria was as follows: mean +1 standard deviation, mean +0.5 standard deviation, mean −0.5 standard deviation and mean −1 standard deviation. Table 4 showed the basic mathematical statistics of each dimension. Obviously, the variation coefficient was above 10%, indicating that there was a significant difference in each dimension. Moreover, the overall performance was EL > EV > SC, and the sequence of difference was SC > EV > EL. Thus, it can be seen that the ecological livability was the best, and its disparity also was the least, while the economic and social dimensions were biased, with the largest differences.
Table 4.
The basic mathematical statistics of each dimension.
From the grade structure of each dimension, the proportion of each group was calculated, as shown in Figure 5. Obviously, the value of EV was mainly in the low grades, and the proportion was 34.11% while the proportion of relatively high and high grade only accounted for 20.02% and 6.52%, respectively. The score of SC was also mainly in the low grade, with a proportion of 39.81%. For EL, its score was mainly in the relatively low and medium grades, with proportions of 26.88% and 23.07%, while the proportion of low grade only accounted for 17.27%. These results also showed that EL was the best, as the proportion above medium grade (higher than medium grade) arrived at 55.85%, while the SC was the worst, as the proportion above average value only accounted for 41.21%. The results indicated the tendency of “poor social convenience, general economic vitality and benign ecological livability” of rural areas in Ezhou city.
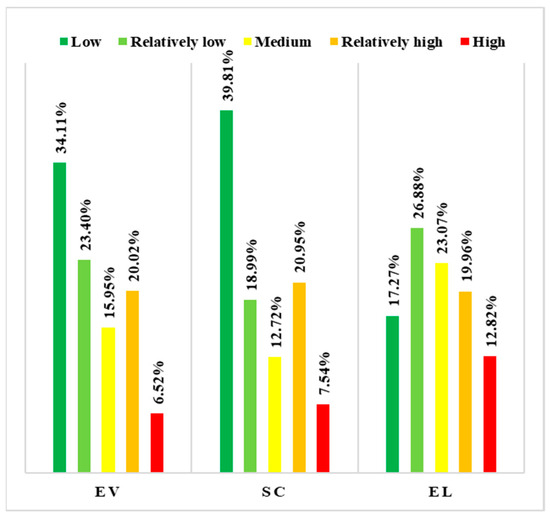
Figure 5.
Grade structure of three dimensions of rural livability in Ezhou city.
In terms of spatial distribution of the three dimensions, there were evident spatial disparities in Ezhou city, with spatial agglomeration of the high and low values observed in some local areas (Figure 6). The EV presented a significantly concentric distribution centered on the downtown and township cores. Four high-EV clusters were identified in the industrial zones: Gedian, Miaoling, the downtown and Huahu. There were also many spot-shaped distributions of high EV in Putuan and Yanji due to their superior agricultural conditions. The scores of other towns, like Yanji, Zhaoshan and Donggou were mostly in the medium grade. The SC showed a spatial distribution of “spot-axle”. Specifically, high-value areas were distributed around urban centers and along major roads, while low-value areas were mainly scattered in Putuan and southern towns. The SC in the north was fairly good, while massive rural areas in the south had the relatively low and low scores. In terms of EL, it presented a striped spatial pattern, with high-value zones aligned along the Yangtze River and resource abundant areas such as Shawo, Tingzu and Taihe. Rather, low EL scores were primarily concentrated in Putuan, Changgang and Donggou, as insufficient attention was paid to ecological safety. Overall, the areas above medium grade in EV, SC and EL gradually decreased from north to south, implying the needs of rural residents living in north were better met in terms of economy, living and ecology.
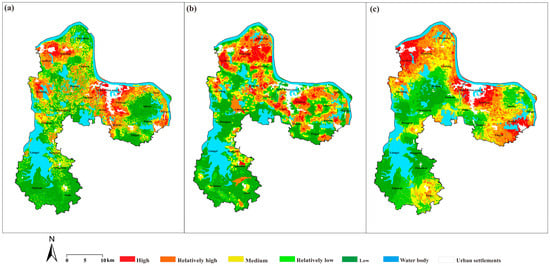
Figure 6.
Spatial distribution of three dimensions of rural livability. (a) EV; (b) SC and (c) EL.
4.3. The Total Evaluation of Rural Livability
Under the aforementioned framework and methodology, the evaluation results of rural livability in Ezhou city were obtained, as shown in Figure 7a. The total score of rural livability ranged from 2.58 to 5.89, with an average score of 3.87. Similarity, the rural livability was divided into five categories based on the natural breaks method, high (4.91–5.89), relatively high (4.31–4.90), medium (3.87–4.30), relatively low (3.41–3.86) and low (2.58–3.40). Approximately 40.76% of villages fell into the low and relatively low grades, implying significant improvement potential for rural livability in Ezhou city.
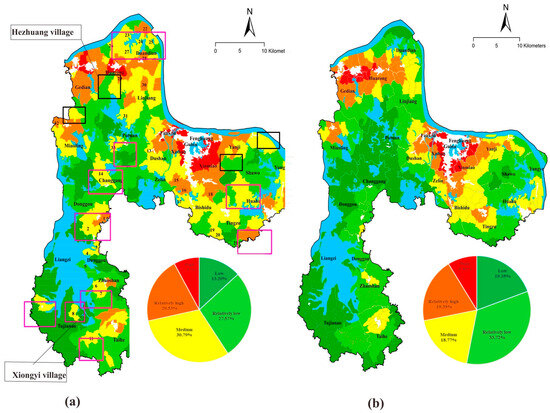
Figure 7.
Spatial distribution of rural livability in Ezhou city. (a) Rural livability evaluation considering social dimension (RLs). (b) Rural livability evaluation without considering social relationships (RLp). Notes: Red box represents areas livable in RLs but unlivable in RLp, and the black box is the opposite.
In terms of the spatial distribution of rural livability, the spatial heterogeneity was obvious. The rural livability of Ezhou city showed a complex stripped and concentric pattern. High and relatively high livability zones were predominately located in the urban peripheries, extending from town centers to the peri-urban areas along the main roads. It can be seen that rural livability has a strong dependence on the economic development level and public facilities’ availability. These high-livability areas, being adjacent to key towns and economic development zones (Gedian and Huahu), often function as the industrial agglomerations, providing substantial employment opportunities for farmers while boasting superior public facilities in terms of quality and diversity to meet the farmers’ daily needs and strengthen social place attachment. Conversely, the low-livability area were primarily distributed in the central and southern areas, including Putuan, Changgang, Donggou and Tujianao. Limited by complex terrain, a backwards economy and loose social interactions, the needs of residents in these regions cannot be satisfied sufficiently. Additionally, the sparse distribution of settlements further hinders daily interactions and the formations of robust interpersonal ties.
On the whole, the spatial differences of rural livability reflected the unbalanced and inadequate development in rural areas of Ezhou. The rural livability in the north and east were evidently better than that in the south. Those regions in low livability have great development potential in the future.
5. Discussion
5.1. The Impact of Rural Social Relationships on Rural Livability
Rural livability is a comprehensive reflection of ecology, economy and society, and the interplay of these factors has caused the regional disparities of rural livability from different directions. The existing research has pointed out that rural residents were not satisfied with a range of rural issues, most of which extended beyond the physical elements. These issues are closely tied to their perspectives on social dimensions, reflecting human belonging [13,21]. Daily social interactions can meet the physical and emotional needs to some extent, thereby strengthening the living willingness of residents [20]. Considering that the everyday life of rural residents is largely managed through public facilities in the local area, two types of social networks were developed based on service areas and levels of public facilities: BSN and ESN. Social convenience, comprehensively reflected by the social roles of rural settlements at the patch level and village cohesion at the village level, was facing severe imbalance in rural areas. Social interactions within villages were more active than those outside in BSN, whereas the opposite holds in ESN. Rural settlements located in regions with dense spatial distribution and proximity to urban areas or main roads were often easier to obtain high social convenience in in daily life.
In order to further explain the impact of social interactions on rural livability, we also attempted to evaluate rural livability through replacing social interactions with the accessibility of public facilities (Figure 7). The spatial distribution between the two methods differed significantly: RLp exhibited an evidently concentric pattern decreasing outward from urban centers, while RLs presented a complex pattern of stripped and concentric circle distribution. Villages in the red box were livable in RLs but unlivable in RLp, and those in the black box were the opposite.
We selected two villages for a comparative analysis: Xiongyi village in the red box and Hezhuang village in the black box. Field investigation revealed that Xiongyi village maintains strong social connectivity, with residents expressing high belongingness and social place attachment. Nearly no residents report relocation intentions. The village has produced hundreds of jobs, attracting a large number of returnees by vigorously developing rural tourism and poverty alleviation projects. The proportion of migrant workers has decreased from 45.03% in 2010 to 8.06% in 2020. The social relations among residents are becoming increasingly close, and it is useful to strengthen the cohesion of the village to a certain extent. At the same time, the village is equipped with infrastructure such as primary schools and cultural squares, so it has become a social center in the surrounding villages, and people gather in Xiongyi village in daily life to exchange information and resources. It shows that Xiongyi village plays a very important role in the entire social network. In contrast, Hezhuang village scores highly in RLp but poorly in RLs. Its registered residence population is 4909, but the proportion of migrant workers is up to 59.65%, and the proportion of people over the age of 60 has reached 15.11%. Due to the close distance to towns, nearly two-thirds of residents are more willing to move to the towns. These factors impose a serious impact on the closeness of social interactions. Additionally, although equipped with public facilities such as primary schools, it does not have a strong radiation effect on the surrounding villages. Due to its proximity to Huarong and Gedian towns, residents in the Hezhuang village are more inclined to go to the towns for reading, medical treatment and shopping, so the village does not play much of a role in the entire social network.
Additionally, we have checked the List of Provincial Beautiful and Livable Village Demonstration Project in Hubei province from 2015 to 2021, and found that 33 villages are included in the list, and 85% of them also have high livability in this paper (Figure 7). The results indicated that the evaluation results basically conform to the actual situation of Ezhou city.
5.2. Implication for Rural Revitalization
RVS is perceived to dominate China’s rural development in the next 30 years, with livable village construction constituting the core agenda of rural revitalization [4]. Given the structural and spatial disparities in rural livability stemming from economic, social and ecological determinants, differentiated planning policies are imperative for the implementation of RVS. It should implement tailor-made strategies for rural development according to the actual local situation, avoiding the occurrence of one-size-fits-all. In this paper, four development types and the corresponding strategies of rural revitalization are proposed, ranging from urbanization-oriented, priority development, restricted development and relocation, based on the level of EV, SC and EL (Figure 8).
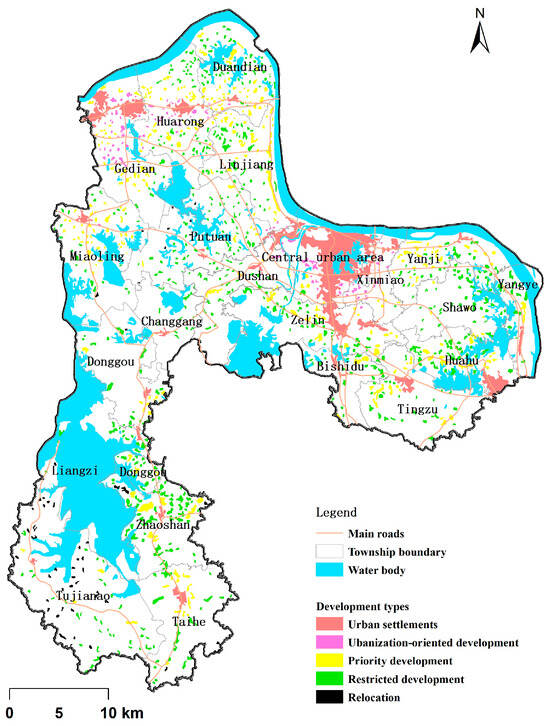
Figure 8.
Spatial distribution of rural settlements under different development strategies.
(1) Urbanization-oriented development. The strategies of urbanization-oriented development target rural settlements exhibiting superior EV, SC, EL and proximity to the city and towns. It can be seen that these settlements are spatially gathered around the central city and the town of Gedian. Due to dominant advantages in production efficiency, quality of life and ecological services, the settlements demonstrate pronounced urban integration tendencies, largely shaped by urban spillover effects and lifestyle diffusion. Policymakers should prioritize phased on-site urbanization through enhanced non-agricultural employment opportunities and infrastructure modernization, facilitating residents’ transition to the secondary and tertiary industries while preserving rural cultural identity. Additionally, sufficient effort should be devoted to implementing stringent farmland protection quotas to mitigate urban encroachment impacts, thereby achieving coordinated urban–rural development equilibrium.
(2) Priority development. It has been found that there exists an apparent spatial conflict in the three dimensions of rural livability. Only a few settlements have high scores in all dimensions, while the advantages of most settlements are often in one certain aspect. Therefore, rural settlements with a high score in each dimension are generally defined as the priority development, and the tripartite spatial incongruence in rural livability dimensions necessitates targeted interventions. The government should make use of the advantages and bypass the disadvantages, giving priority development to settlements with absolute dominance in a certain aspect. Firstly, for settlements with high EL but relatively low EV and SC, policymakers should commit to developing cultural or eco-tourism clusters, and transform resource advantages into economic advantages through the construction of characteristic villages (folk villages, ecological villages and cultural villages). The improvement of their supporting infrastructures and the rural tourism supply chain is also required. It can not only increase employment opportunities for local residents, but meet their daily needs for public facilities as greatly as possible, improving interpersonal relationships among rural residents. Secondly, for settlements with high EV but low EL or SC, they often have certain industrial advantages, acting as core economic areas. Policymakers should optimize agricultural value chains through “Production-Processing-Marketing” integration, and actively implement digital village pilot programs to improve the intelligence of agricultural production. Thirdly, for settlements with high SC but low EV or EL, policymakers should help them to make full use of their advantages in information and policies to expand the scope of goods and services. This can grant other settlements convenient access to public facilities, thus strengthening daily interactions among settlements and attracting the migration and agglomeration of scattered, small-scale rural settlements.
(3) Restricted development. The strategy for settlements with medium level in EV, SC and EL is defined as restricted development. These settlements mostly are distributed far from urban areas, less affected by urban economic development. In addition, the shortage of farmland as a resource, sparse distribution of rural settlements and hollowing are also the main characteristics. Policymakers should revitalize abandoned homesteads to promote effective circulation and improve rural life and ecological conditions through homestead revitalization programs such as leisure agriculture and, specifically, homestays. Meanwhile, with the further promotion of rural revitalization, a few settlements will finally move towards natural decline through smart shrinkage planning to gradually direct the population outward.
(4) Relocation. Settlements located in unlivable areas are defined as relocation type. Most of these settlements are largely located in ecologically sensitive areas near the lakes in the south. A sparse population and inconvenient transportation have limited their development. The government should encourage rural residents to move by the separation of the three rights of farmland and rural settlement circulation. In the relocation process, flexible relocation options should be provided to farmers. They can make their own decisions about where to move: the city and towns, the nearer central villages or villages with strong social connections. Meanwhile, the lands should be used for farmland reclamation or returned to the forest to protect ecological environment.
5.3. Limitations and Future Work
Although this study constructed an analytical framework and evaluated the rural livability from the aspects of production, living and ecology in Ezhou city, several limitations still exist. Firstly, for the social interactions among rural residents, only a few connections were considered in this paper due to the lack of actual population flow data. Secondly, the index system needs to be further improved. There is still a lack of indicators that better reflect rural production, living and ecological conditions. Thirdly, the needs of rural residents with various characteristics are different, which is not considered in this study. Field observations of rural residents may promote the estimation of rural livability. Thus, the future study should pay more attention to these limitations.
6. Conclusions
Rural livability, as the core of RVS, is essential to sustainable rural development and residents’ well-being. It is defined as a place equipped with abilities to accommodate the individual requirements and desires of the physical and social living environments in this paper. Thus, it is a combination of physical environments and social activities. This paper has evaluated rural livability through the exploration and development of an analytical framework and indicator system in Ezhou City. The indicators were designed to cover three aspects of residents’ needs: ecological livability, economic vitality and social convenience.
In accordance with the connotation and indicator system, the following results of rural livability in Ezhou city could be highlighted. First, social networks (BSN and ESN) modeled based on the daily life needs for public facilities differ significantly in village cohesion and centrality. The imbalance in intra-village cohesion and the spatial pattern of “Northern and Eastern stronger than Southern” are exhibited persistently. Second, each dimension of rural livability is significantly different in terms of score and spatial distribution. It presents a tendency of “poor social convenience, general economic vitality and benign ecological livability”, with three different spatial distribution patterns: concentric pattern in EV, “spot-axle” in SC and stripped pattern in EL. Lastly, under the integrated influence of EL, EV and SC, notable spatial disparities of rural livability emerge, with northern and eastern regions demonstrating superior livability compared to the south. Additionally, the low livability scores of numerous villages indicate substantial potential for future rural sustainable development, necessitating focused attention on low-value rural areas in rural revitalization, especially in the southern villages of Ezhou.
Improving rural livability constitutes a key solution proposed by the Chinese government in the progress of rural revitalization to address “rural issues” and achieve sustainable rural development. This paper clarified and defined the connotation of rural livability under the context of China, and emphasized the critical role and significance of social interactions in the evaluation of rural livability. Empirically, this paper extended and enriched rural livability assessment methodologies while providing policymakers with alternative strategies for bottom-up, endogenous rural revitalization.
Author Contributions
Conceptualization, Q.Y.; methodology, L.Z. and S.C.; validation, Q.Y. and J.L.; formal analysis, Q.Y. and J.L.; investigation, L.Z. and J.L.; resources, Q.Y.; data curation, L.Z. and S.C.; writing—original draft preparation, L.Z. and Q.Y.; writing—review and editing, Q.Y. and J.L.; visualization, L.Z. and S.C.; supervision, J.L.; project administration, Q.Y.; funding acquisition, Q.Y. and L.Z. All authors have read and agreed to the published version of the manuscript.
Funding
This research was funded by Undergraduate Training Programs for Innovation and Entrepreneurship, grant number S202410513097.
Institutional Review Board Statement
Not applicable.
Informed Consent Statement
Not applicable.
Data Availability Statement
The data will be made available should the manuscript be accepted.
Conflicts of Interest
The authors declare no conflicts of interest.
References
- Zang, Y.; Liu, Y.; Yang, Y.; Woods, M.; Fois, F. Rural decline or restructuring? Implications for sustainability transitions in rural China. Land Use Policy 2020, 94, 104531. [Google Scholar] [CrossRef]
- WCED. Our Common Future; Oxford University Press: Oxford, UK, 1987. [Google Scholar]
- Liu, J.; Bi, H.; Wang, M. Using multi-source data to assess livability in Hong Kong at the community-based level: A combined subjective-objective approach. Geogr. Sustain. 2020, 1, 284–294. [Google Scholar] [CrossRef]
- Li, Y.; Qiao, L.; Wang, Q.; Karácsonyi, D. Towards the evaluation of rural livability in China: Theoretical framework and empirical case study. Habitat Int. 2020, 105, 102241. [Google Scholar]
- Jia, K.; Qiao, W.; Chai, Y.; Feng, T.; Wang, Y.; Ge, D. Spatial distribution characteristics of rural settlements under diversified rural production functions: A case of Taizhou, China. Habitat Int. 2020, 102, 102201. [Google Scholar] [CrossRef]
- Li, J.; Liu, Y.; Yang, Y.; Jiang, N. County-rural revitalization spatial differences and model optimization in Miyun District of Beijing-Tianjin-Hebei region. J. Rural Stud. 2019, 86, 724–734. [Google Scholar] [CrossRef]
- Wang, Y.; Jin, C.; Lu, M.; Lu, Y. Assessing the suitability of regional human settlements environment from a different preferences perspective: A case study of Zhejiang Province, China. Habitat Int. 2017, 70, 1–12. [Google Scholar] [CrossRef]
- Tian, Y.; Kang, X.; Liu, Y.; Wang, H. Restructuring rural settlements based on an analysis of inter-village social connections: A case in Hubei Province, Central China. Habitat Int. 2016, 57, 121–131. [Google Scholar] [CrossRef]
- Wang, X.; Wang, X.; Wu, J.; Zhao, G. Social Network Analysis of Actors in Rural Development: A Case Study of Yanhe Village, Hubei Province, China. Growth Change 2017, 48, 869–882. [Google Scholar] [CrossRef]
- Long, H.; Liu, Y.; Li, X.; Chen, Y. Building new countryside in China: A geographical perspective. Land Use Policy 2010, 27, 457–470. [Google Scholar] [CrossRef]
- Khorasani, M.; Zarghamfard, M. Analyzing the Impacts of Spatial Factors on Livability of Peri-Urban Villages. Soc. Indic. Res. 2017, 136, 693–717. [Google Scholar] [CrossRef]
- Li, X.; Yang, H.; Jia, J.; Shen, Y.; Liu, J. Index system of sustainable rural development based on the concept of ecological livability. Environ. Impact Assess. Rev. 2021, 86, 106478. [Google Scholar] [CrossRef]
- Zhao, X.; Sun, H.; Chen, B.; Xia, X.; Li, P. China’s rural human settlements: Qualitative evaluation, quantitative analysis and policy implications. Ecol. Indic. 2019, 105, 398–405. [Google Scholar] [CrossRef]
- Li, W.; Edward, N. Evaluation of the social dimension of sustainability in the built environment in poor rural areas of China. Archit. Sci. Rev. 2018, 61, 319–326. [Google Scholar]
- van den Berg, P.; Sharmeen, F.; Weijs-Perrée, M. On the subjective quality of social Interactions: Influence of neighborhood walkability, social cohesion and mobility choices. Transp. Res. Part A Policy Pract. 2017, 106, 309–319. [Google Scholar] [CrossRef]
- Delmelle, E.C.; Haslauer, E.; Prinz, T. Social satisfaction, commuting and neighborhoods. J. Transp. Geogr. 2013, 30, 110–116. [Google Scholar] [CrossRef]
- Yan, Y. ‘Chaxu geju’ and the notion of hierarchy in Chinese culture. Sociol. Stud. 2006, 4, 210–213. [Google Scholar]
- Hang, X.; Payne, D. Characteristics of Chinese rural networks: Evidence from villages in central China. Chin. J. Sociol. 2017, 3, 74–97. [Google Scholar]
- Rockenbauch, T.; Sakdapolrak, P. Social networks and the resilience of rural communities in the Global South: A critical review and conceptual reflections. Ecol. Soc. 2017, 22, 10. [Google Scholar] [CrossRef]
- Gieling, J.; Haartsen, T.; Vermeij, L. Village Facilities and Social Place Attachment in the Rural Netherlands. Rural Sociol. 2019, 84, 66–92. [Google Scholar] [CrossRef]
- Kong, X.; Liu, D.; Tian, Y.; Liu, Y. Multi-objective spatial reconstruction of rural settlements considering intervillage social connections. J. Rural Stud. 2019, 84, 254–264. [Google Scholar] [CrossRef]
- Xia, H.; Li, C.; Zhou, D.; Zhang, Y.; Xu, J. Peasant households’ land use decision-making analysis using social network analysis: A case of Tantou Village, China. J. Rural Stud. 2020, 80, 452–468. [Google Scholar] [CrossRef]
- Halik, W.; Mamat, A.; Dang, J.H.; Deng, B.S.H.; Tiyip, T. Suitability analysis of human settlement environment within the Tarim Basin in Northwestern China. Quat. Int. 2013, 311, 175–180. [Google Scholar] [CrossRef]
- Wang, Y.; Zhu, Y.; Yu, M. Evaluation and determinants of satisfaction with rural livability in China’s less-developed eastern areas: A case study of Xianju County in Zhejiang Province. Ecol. Indic. 2019, 104, 711–722. [Google Scholar] [CrossRef]
- Ruth, M.; Franklin, R.S. Livability for all? Conceptual limits and practical implications. Appl. Geogr. 2014, 49, 18–23. [Google Scholar] [CrossRef]
- Hankins, K.B.; Powers, E.M. the Disappearance of the Statefrom “Livable” Urban Spaces. Antipode 2009, 41, 845–866. [Google Scholar] [CrossRef]
- Neama, W.A.S.A. Protect our Environment through Developing Architectural Design towards Sustainability by Applying its Principles into Design Tools. Procedia Soc. Behav. Sci. 2012, 68, 735–751. [Google Scholar] [CrossRef][Green Version]
- Wang, Y.; Zhu, Y.; Yu, M.; Xu, J. Quantitative evaluation and spatial differentiation of ecoenvironmental livability in Zhejiang Province, China. J. Mt. Sci. 2020, 17, 1491–1508. [Google Scholar] [CrossRef]
- Qu, Y.; Jiang, G.; Zhao, Q.; Ma, W.; Zhang, R.; Yang, Y. Geographic identification, spatial differentiation, and formation mechanism of multifunction of rural settlements: A case study of 804 typical villages in Shandong Province, China. J. Clean. Prod. 2017, 166, 1202–1215. [Google Scholar] [CrossRef]
- Tian, Y.; Kong, X.; Liu, Y. Combining weighted daily life circles and land suitability for rural settlement reconstruction. Habitat Int. 2018, 76, 1–9. [Google Scholar] [CrossRef]
- Huff, D.L. A probalistic analysis of shopping center trade areas. Land Econ. 1963, 39, 81–90. [Google Scholar] [CrossRef]
- Liu, D.; Kong, X.; Zhou, B.; Tian, Y.; Liu, Y.; Wang, H. Spatial optimization of rural settlement relocation by incorporating inter-village social connections under future policy scenarios. Trans. GIS 2019, 23, 688–704. [Google Scholar] [CrossRef]
- Isaac, M.E.; Matous, P. Social network ties predict land use diversity and land use change: A case study in Ghana. Reg. Environ. Change 2017, 17, 1823–1833. [Google Scholar] [CrossRef]
- Cao, W.; Feng, X.; Zhang, H. The structural and spatial properties of the high-speed railway network in China: A complex network perspective. J. Rail Transp. Plan. Manag. 2019, 9, 46–56. [Google Scholar] [CrossRef]
- Opsahl, T.; Agneessens, F.; Skvoretz, J. Node centrality in weighted networks: Generalizing degree and shortest paths. Soc. Netw. 2010, 32, 245–251. [Google Scholar] [CrossRef]
- Erath, A.; Löchl, M.; Axhausen, K.W. Graph-Theoretical Analysis of the Swiss Road and Railway Networks Over Time. Netw. Spat. Econ. 2009, 9, 379–400. [Google Scholar] [CrossRef]
- Gu, X.; Xie, B.; Zhang, Z.; Guo, H. Rural multifunction in Shanghai suburbs: Evaluation and spatial characteristics based on villages. Habitat Int. 2019, 92, 102041. [Google Scholar] [CrossRef]
- Liu, Y.; Liu, Y.; Chen, Y. Territorial Multi-functionality Evaluation and Decision-making Mechanism at County Scale in China. Acta Geogr. Sin. 2011, 66, 1379–1389. [Google Scholar]
Disclaimer/Publisher’s Note: The statements, opinions and data contained in all publications are solely those of the individual author(s) and contributor(s) and not of MDPI and/or the editor(s). MDPI and/or the editor(s) disclaim responsibility for any injury to people or property resulting from any ideas, methods, instructions or products referred to in the content. |
© 2025 by the authors. Licensee MDPI, Basel, Switzerland. This article is an open access article distributed under the terms and conditions of the Creative Commons Attribution (CC BY) license (https://creativecommons.org/licenses/by/4.0/).