1. Introduction
In recent decades, the escalating levels of ecological degradation have emerged as an indispensable threat to economic and social sustainability [
1,
2]. In response, a vast majority of nations enacted stringent environmental regulations, such as the U.S. Clean Water Act of 1972, the U.K. Control of Pollution Act of 1974, and China’s 2013 Straw Burning Prohibition, aiming to curb this adverse trajectory and foster sustainable development. Theoretically, the efficacy of market-based environmental regulations is inherently contingent upon the quality of market mechanisms [
3]. In contrast, command-and-control policies frequently demonstrate greater effectiveness, particularly in developing economies characterized by pronounced governmental intervention. It is of immense importance to investigate the impact of command-and-control environmental policies on pollution emission reduction and explore the underlying mechanisms.
China provides an ideal research scenario for analyzing this question with twofold advantages. Firstly, despite the great efforts toward market-oriented reform, China’s economy has the prominent feature of strong governmental involvement, as with other Eastern Asian countries and the Soviet Union. Meanwhile, China, as the largest developing country, encompasses the complete industry categories of manufacturing sectors worldwide. Therefore, the conclusions have universal implications for other developing countries seeking to promote their industrial green transition initiatives. Secondly, to determine causal inference, this paper deploys a quasi-natural experiment formed by the imposition of environmental target constraints in 2007. That is, the State Council in China integrated the main pollutant reduction targets into the performance evaluation criterion for government officials in 2007, which has directly associated local pollution discharges with the career advancement prospects of officials. This quasi-natural experiment provides a unique opportunity to disentangle the causal effect of command-and-control environmental regulation, enabling a rigorous assessment of its influence on firms’ pollution emissions.
Leveraging data from Chinese industrial enterprises and the green development database, this paper delves into the impact of ETC on pollution discharges and investigates the possible mechanisms within a DID framework. To obtain a clean estimator, a full range of sensitivity checks has been conducted, such as the parallel trend test, the DDD method, placebo tests, PSM-DID, and so on. The results indicate that environmental target constraints can lead to a substantial and robust decline in firm pollution discharges. Next, this paper extends the baseline results to scrutinize the plausible mechanisms through which ETC affects pollution levels. The findings suggest that the output scale compression is an effective channel, especially for small and medium enterprises. The emission reduction effects can be achieved by stimulating technical innovation and optimizing energy and water resource utilization efficiency and total factor productivity. Furthermore, to identify the asymmetric effects, this paper examines the influence of firm ownership, export activity, and resource endowments. The results suggest that the inhibitory effects appear to be more pronounced for private firms, exporting firms, and enterprises located in non-resource-based cities.
This paper contributes to the literature threefold. Firstly, it provides novel empirical evidence on the role of performance-based incentives for bureaucrats. By examining the impact of cadres’ performance targets on emission reductions, this study expands the research scope and offers new insights into the potential channels through which environmental target constraints (ETCs) affect pollution reduction, including production-scale adjustments, technological innovation, and resource reallocation. In this regard, the study enriches the broader theoretical framework of performance target management. Secondly, this paper adds to an important topic in the environmental economics literature—the tool of environmental policy and its effectiveness. This study leverages a quasi-natural experiment induced by environmental target constraints and investigates its effect on firm pollution emissions within a DID approach. Meanwhile, abundant heterogeneous analyses based on ownership, exporting activity, and resource endowments present a comprehensive picture of the causal linkage, which adds a new understanding of the economic effects of environmental policies. Thirdly, China’s manufacturing, the largest in scale worldwide, has the most complete industry categories. By examining manufacturing firms in China, the findings offer valuable insights that are applicable to other countries facing significant ecological challenges.
The remainder of the paper is structured as follows:
Section 2 put forward the literature review.
Section 3 outlines the policy background and formulates the hypotheses.
Section 4 details the model specification, data sources, and variable definitions.
Section 5 and
Section 6 present the baseline findings, robustness checks, mechanism analysis, and heterogeneity assessments. Finally,
Section 7 provides the conclusion.
2. Literature Review
This study is closely linked to a significant body of literature on the effectiveness of environmental policies. Public economic theory has underscored the critical role of environmental regulations in mitigating the negative externalities associated with industrial production. However, existing studies yielded conflicting findings. On the one hand, Extensive studies highlighted the positive effects of environmental regulations [
4,
5,
6,
7]. Andersson [
4] documented that by following the implementation of carbon taxes in Sweden, carbon dioxide emissions from the transport sector decreased by nearly 11 percent. On the other hand, many academics have supported the nonlinear effect of environmental policies [
8,
9,
10]. Wang and Shen [
9] pointed out that the relationship between the degree of environmental regulation and environmental productivity exhibited an “inverted U” shape, with three distinct thresholds.
The divergence among research conclusions might have arisen from several factors. Firstly, regarding the measurement of environmental regulation, prior literature has often employed carbon taxes [
4], emission trading systems [
5,
6,
8], and pollution control expenditures [
11], which were highly subjective with prominent endogeneity. Secondly, the validity of environmental policies was conditional on the regional economic level, resource endowment, and various firm traits, leading to disparities in policy effects among regions or firms.
This paper is also associated with the growing literature on incentivizing bureaucrats with concrete performance targets. Lockwood and Porcelli [
12] emphasized the critical role of the performance evaluation system in England in facilitating public service quality and insignificant effects on efficiency. Conversely, concrete targets in Nigeria were demonstrated to downscale service delivery [
13,
14]. Most scholars devoted their efforts to analyzing the performance evaluation system in China, particularly the economic growth target. On the regional level, economic growth targets significantly inhibited green total factor productivity [
15,
16], and exacerbated environmental pollution in local and adjacent areas [
17,
18]. For example, Liu et al. [
19] emphasized that promotion evaluations driven by economic performance distort the allocation of fiscal expenditures and impede sustainable economic development. Additionally, some scholars extended the scope of the research from micro perspectives such as corporate investments in environmental conservation [
20] and firm productivity [
21].
The most relevant strand of literature to this study directly examined the impact of environmental target constraints. Existing research provided extensive empirical support for its favorable impacts on green innovation [
22,
23], economic growth quality [
24], and export product quality [
25]. For instance, He and Tang [
25] analyzed data from Chinese firms between 2002 and 2009 and revealed that environmental constraints resulted in a 3.57% decline in the quality of firms’ export products.
In summary, prior studies have extensively examined the effects of environmental regulations, emphasizing their impact on economic outcomes. However, the literature presents mixed findings regarding the effectiveness of such policies, with some studies supporting their positive effects and others suggesting non-linear or unintended consequences. Additionally, existing research has largely focused on the economic influence of environmental target constraints, while the direct emission-abatement effects of environmental target constraints remain underexplored. Moreover, the exploration of the underlying mechanisms was limited, necessitating further investigation. To fill this void, this paper investigates the possible role played by output scale adjustment, technological change, and resource allocation in pollution emissions from the perspective of environmental target constraints within a DID framework.
3. Policy Background and Hypothesis Development
3.1. Policy Background
In China, the State Council adopts a promotion evaluation system associating the career prospects of local bureaucrats with target achievement to supervise and motivate subordinate governments [
19,
26]. For decades, economic targets have permeated all levels of government except for the central government. To increase the possibility of being promoted, local bureaucrats often prioritize rapid economic growth at the sacrifice of environmental damages [
16]), resulting in incomplete enforcement of environmental policies [
17,
27], which is perceived as an indispensable determinant of the escalating ecological degradation [
16].
During the 10th Five-Year Plan (2001–2005), the central government launched a quantitatively defined pollution control policy and designated the reduction in main pollutant emissions as an expected target. However, some cities listed emission reduction goals in government working reports, while others did not due to the lack of stringent enforcement. To strengthen local officials’ initiatives in environmental regulation, in 2007, a notice formulated by the State Council designated the emission reduction targets as the critical evaluation criterion for local bureaucrats. With this assessment, failing to achieve pollution reduction targets could result in a demotion of local bureaucrats or, at a minimum, heighten the risk of reassignment to a less influential position. Conversely, successfully meeting these environmental objectives enhanced the likelihood of career advancement for local officials.
3.2. Hypothesis Development
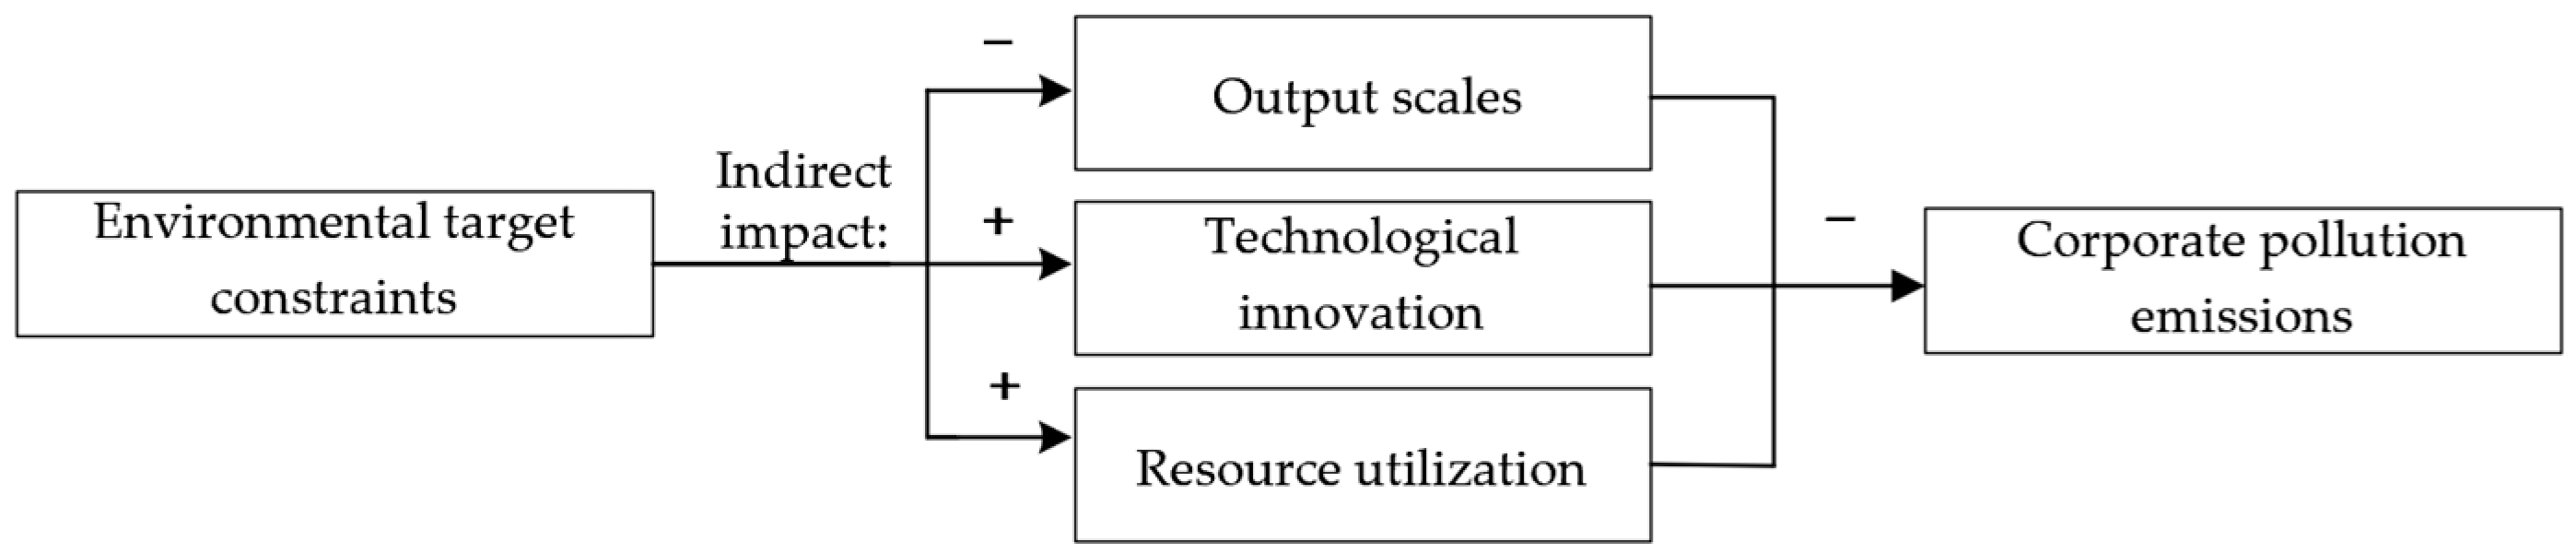
Environmental target constraints have completely transformed the utility function of local bureaucrats, impacting their efforts in environmental supervision and the allocation of various resources [
22,
23]. In this subsection, this paper provides descriptive evidence for the link between ETCs and pollutant discharges. Specifically, this paper elucidates the underlying mechanisms behind the relationship, including reducing output scales, enhancing corporate innovation, and optimizing resource utilization.
Figure 1 illustrates these transmission mechanisms.
To stand out in the promotion tournament, local bureaucrats might introduce more stringent pollution standards and stricter enforcement of existing laws. Business survival is increasingly under pressure. In response to regular environmental performance evaluations by higher-ranking officials, local authorities typically take compulsory actions such as closing, suspending, merging, or transitioning pollution-intensive firms to other production lines [
28,
29]. Likewise, when the marginal cost notably exceeds the marginal revenue, cutting the output scale becomes a sensible option for polluting firms [
28].
Undoubtedly, scale adjustment can generate an immediate and significant effect on the decline of pollution discharge. Grossman and Krueger [
30] highlighted that if the nature of economic activity remains unchanged, the expansion of the output scale will cause increasing combustion of fossil fuels and environmental deterioration. The most common methods used to achieve emission reductions generally include pollution treatment and production compression. A rational enterprise typically selects the appropriate responsive measure based on its own resource endowments to reach the given pollution-reduction targets. Small firms bounded by financial and technological dilemmas fail to innovate and develop clean production processes [
31] and choose to narrow down the output level to achieve targeted emission reductions. In contrast, large firms can also introduce clean energy and upgrade pollution disposal facilities [
32] to deal with the pressure of emission reductions.
Technological innovation also serves as an indispensable path to polishing environmental performance and pollution control [
16]. Existing studies have shown that process innovation and upgraded decontamination ability play a predominant role in the reconstruction of the eco-environment [
32,
33]. However, environmental target constraints may exert a dual influence on firms’ innovation activities. On one side, ETCs would disrupt firms’ production routines and magnify compliance costs, thus prompting under-performance of regulated firms [
34,
35]. On the other, ETCs may act as a catalyst for innovation by compelling firms to engage in R&D, thereby fostering advancements in energy-efficient and emission-reducing technologies [
36], with potential benefits that outweigh compliance costs [
37]. Moreover, to reduce the emission level, local governments will lubricate industry–university cooperations and encourage scientists and researchers to engage in green innovative projects [
38]. Additional complementary measures (e.g., tax breaks, subsidies, loans, tariffs, etc.) can relieve innovation risks and boost green investment projects.
Resource allocation optimization also contributes to coordinating ecological conservations and economic growth [
35,
39,
40]. To pursue pollutant-reducing schemes, local officials will push industrial firms to not only enhance the use of clean energy and reduce the reliance on traditional energy [
41,
42], but also downscale industrial water use and raise the water recycling rate in the production processes. Meanwhile, environmental target constraints lead to an outstanding selection effect on firms’ entry and exit [
27,
43]; that is, local officials eliminate emissions-intensive-based manufacturing and attract more clean enterprises to settle within their jurisdiction [
27]. Under the conditions of unchanged technological levels, ETC encourages firm relocations and factor transfer from low-efficiency to high-efficiency sectors, thereby facilitating productivity and environmental performance. According to the theoretical discussions, this paper has two testable hypotheses:
Hypothesis 1. ETCs can significantly inhibit the pollution emissions of manufacturing firms.
Hypothesis 2. The reduction in pollution emissions due to ETCs is achieved by abating output scales, enhancing technological innovation, and optimizing resource allocation.
4. Empirical Framework
4.1. Methodology
To evaluate the relationship between local environmental target constraints and the pollution discharges of manufacturing firms, a basic regression model is constructed as follows:
The subscripts , , , and index the firm , city , industry , and year . The dependent variable, , denotes the pollution level of firm at year . takes a value of 1 if 2007 and zero otherwise, and equals 1 if city discloses the reduction targets of major pollutants and zero otherwise. The interaction term, , represents the independent variable, local environmental target constraints. represents a set of covariates possibly related to pollution discharges. and indicate firm- and year-fixed effects, controlling for all time-invariant firm traits and year shocks that unanimously affect all regions. is the error term.
The dependent variable is the pollution level (
), which is calculated using the synthetical index method [
44,
45]. This paper considers four different types of pollutant emission, i.e., sulfur dioxide, wastewater, chemical oxygen demand, and ammonia nitrogen. The specific steps are as follows: (i) linearly normalize pollution discharges,
, and calculate the adjustment factors,
, respectively,
in which
denotes the logarithm of pollutant
for firm
at year
; and (ii) calculate the comprehensive index of pollution emissions. The bigger this indicator
is, the greater firm
pollution emission is.
This paper deploys a quasi-natural experiment formed by emission reduction target settings. Consistent with Yu et al. [
46], this paper classifies the sample into treatment and control groups according to whether local governments formulate the reduction targets of main pollutants or not. To be specific, this paper defines a dummy treatment measure,
, which identifies whether a firm is in the treatment group or not. If it is,
equals 1 and zero otherwise.
takes a value of 1 if
2007 and zero otherwise. The interaction term
represents the independent variable, local environmental target constraints.
To reduce the omitted variable bias and achieve a better fit of the model, this paper incorporates a battery of control variables possibly associated with pollution emissions based on existing literature [
6,
44,
47]. These control variables include firm size (Size), financial leverage (Leverage), firm age (Age), export activities of the enterprises (Export), capital structure (Tang), and the nature of ownership (SOE).
Table 1 reports the definitions of control variables.
4.2. Data Sources and Processing
The emission reduction targets are manually collected from governmental working reports using the context analysis method. The Chinese industrial enterprise database, provided by the National Bureau of Statistics, includes all state-owned and above-size private enterprises, covering basic firm information and financial conditions. The year 2010 is excluded from the regression analysis due to poor statistical quality. The green development data include information on industrial output, energy consumption, pollution emissions, etc. Following the existing literature [
48,
49], this paper cleans the sample. To remove the disturbance of outliers, this paper winsorizes all continuous variables at the 1st and 99th percentiles.
Table 2 presents the descriptive statistics of the variables. It can be observed that the minimum and maximum values are 0.04 and 0.89, respectively, indicating a noticeable and wide disparity in the pollution levels among enterprises. The control variables have reasonable value ranges, consistent with Jiang et al. [
44], which provides ideal research circumstances for investigating the impact of environmental target constraints on the pollution discharges of manufacturing enterprises.
This paper chooses the period of 2004 to 2012 as the sample time window. This selection helps mitigate estimation bias caused by the new clean production industry standards formally implemented in 2003. Additionally, this period was chosen due to data accessibility restrictions, as the green development database has only been updated until 2012. The period coincides with the significant changes in pollution levels in China. According to the National Bureau of Statistics, sulfur dioxide emissions have increased from 22.55 million tons in 2004 to 25.89 million tons in 2006 and have declined to 21.18 million tons in 2012. This paper attempts to illustrate the dynamics of the pollution level from the perspective of environmental target constraints implemented in 2007.
5. Empirical Results
5.1. Univariate Analysis
Table 3 presents the univariate analysis of the differences in corporate pollution emissions. Before refers to the period before the implementation of emission abatement targets (2004–2006), while After indicates the period after the implementation (2007–2012). It can be observed in this paper that the average values of
witnessed a significant decrease in both the treatment and control groups. Comparatively, the pollution level of treated firms decreases significantly (
p = 0.000), with a policy effect of −0.0202. However, the univariate test might not effectively evaluate the policy impact since it fails to deal with endogeneity issues well.
5.2. Baseline Results
Table 4 shows the results of the baseline regression analysis. This paper just includes firm- and year-fixed effects to take into account unobservable time-invariant characteristics and common trends of enterprises in column 1. The estimated coefficients of
are negative and statistically significant at the 1% level, indicating that ETCs do indeed lead manufacturing firms to emit fewer emissions in China, as expected. In column 2, this paper further includes a battery of control variables, and the results still show a robust effect that ETCs can lead to a substantial and robust decline in pollution levels. This result is economically significant as well. According to the magnitude of the coefficient, ETCs can decrease the pollution level by 0.47% for manufacturing enterprises.
This policy effect benefits from the possibility that ETCs exert a significant influence on firms’ production management and pollution control. The introduction of ecological performance targets has dramatically changed the utility function of local officials and reinforced environmental monitoring and enforcement of penalties. To reach the assigned emission reduction goals, manufacturing enterprises will constantly endeavor to adjust their output scales, improve energy efficiency, and upgrade pollution treatment equipment [
22,
28], as hypothesized above.
From the viewpoint of control variables, the estimation results show that firm size is negatively linked to pollution levels, possibly due to local governments’ tendency to allow small enterprises to pollute more to alleviate local employment pressures [
44]. There is some evidence that firm age can ameliorate corporate environmental performance at the 10% significance level in line with the conclusions of Caloghirou et al. [
47]. In addition, financial leverage can distinctly aggravate environmental pollution, which signals that corporate overinvestment behaviors and ecological quality are negatively correlated [
50]. Moreover, export activity, firm ownership, and tangibility have no noticeable impacts on the pollution discharges of the enterprises, indicating that these firm-level characteristics are not critical determinants of pollution levels in this research framework.
In summary, the baseline results demonstrate that ETCs can lead to a substantial decline in the pollution discharges of manufacturing enterprises in China. This main conclusion remains robust after including a range of control variables, thus preliminarily corroborating Hypothesis 1. However, this causal nexus might be endangered by endogeneity issues. This paper performs a string of sensitivity checks to verify the credibility of the main results.
5.3. Parallel Trend and Dynamic Effects
The validity of the DID approach relies on the premise that there are no significant pre-existing differences in trends between the treatment and control groups and that the parallel trend assumption is satisfied. This paper further constructs a dynamic DID model to test the validity of the results and investigate the dynamic nonlinear impacts of ETCs on pollution levels. The specific estimation equation is as follows.
where
denotes the year dummy variable. This paper excludes the year 2006, thus capturing the influence of ETC on firms’ pollution discharges relative to 2006. If
−2, the coefficients
represent the effect of years before this policy shock. If they are insignificantly different from zero, there are no systematic differences between the firms in the treatment and control groups, thus meeting the parallel trend assumption.
Figure 2 depicts the regression results of the parallel trend test. The coefficients
and
are not significant at the 95% confidence interval, indicating that before the exogenous shock, there is little evident disparity between the treatment and control groups. The critical identification assumption for the DID method is tenable. It is noteworthy that the coefficients became significant in the second year (2008), indicating a time-lag effect of ETCs on pollution levels. This result is in line with the economic intuition: firms require time to research and utilize new technologies and readjust their operation activities. R&D investment is a time-consuming, slow-acting, and uncertain activity requiring large-scale capital [
51], meaning it is difficult to achieve immediately.
5.4. Robustness Checks
5.4.1. Results with Alternative Measures of Pollution Emissions
To reinforce the creditability of the conclusion, this paper also conducts a principal component analysis to construct an alternative proxy for firm-level pollution discharge, as shown in column 1 of
Table 5. Columns 2 to 5 exploit the intensity of pollutant emissions as the dependent variable, respectively. The regression results show that after using the alternative measures of pollution emissions of manufacturing firms, the effect of ETCs on pollution emissions remains significant and negative, consistent with the main conclusion.
5.4.2. DDD Estimation
One possible concern is that other policy shocks, which may yield evident impacts on pollution emissions, could lead to estimation bias during the sample period. Since environmental policies may exert greater influence on industries with higher pollution levels, following Bu et al. [
41], this paper divides the samples into clean and dirty industries. Accordingly, this paper adopts the difference-in-difference-in-differences method to disentangle the effect of ETC with the following model.
where
denotes the dirty industry dummy variable, which equals 1 if firm
is in the dirty industry and zero otherwise. The coefficient
for
is the triple difference estimator that captures the effect of ETC on the dirty industries’ pollution emission.
Table 6 presents the regression results estimated by the DDD model. In column 1, the coefficient of
is significantly negative, suggesting that the emission levels of manufacturing firms in dirty industries remain sensitive to the alteration of the performance evaluation system. Column 2 further strengthens the analysis by incorporating year-by-area joint fixed effects, which effectively absorb covariate-specific temporal variations across geographical units. Columns 3 to 6 show that ETCs have no marked effect on ammonia nitrogen discharges and suppress SO
2, COD, and wastewater emissions.
5.4.3. PSM-DID
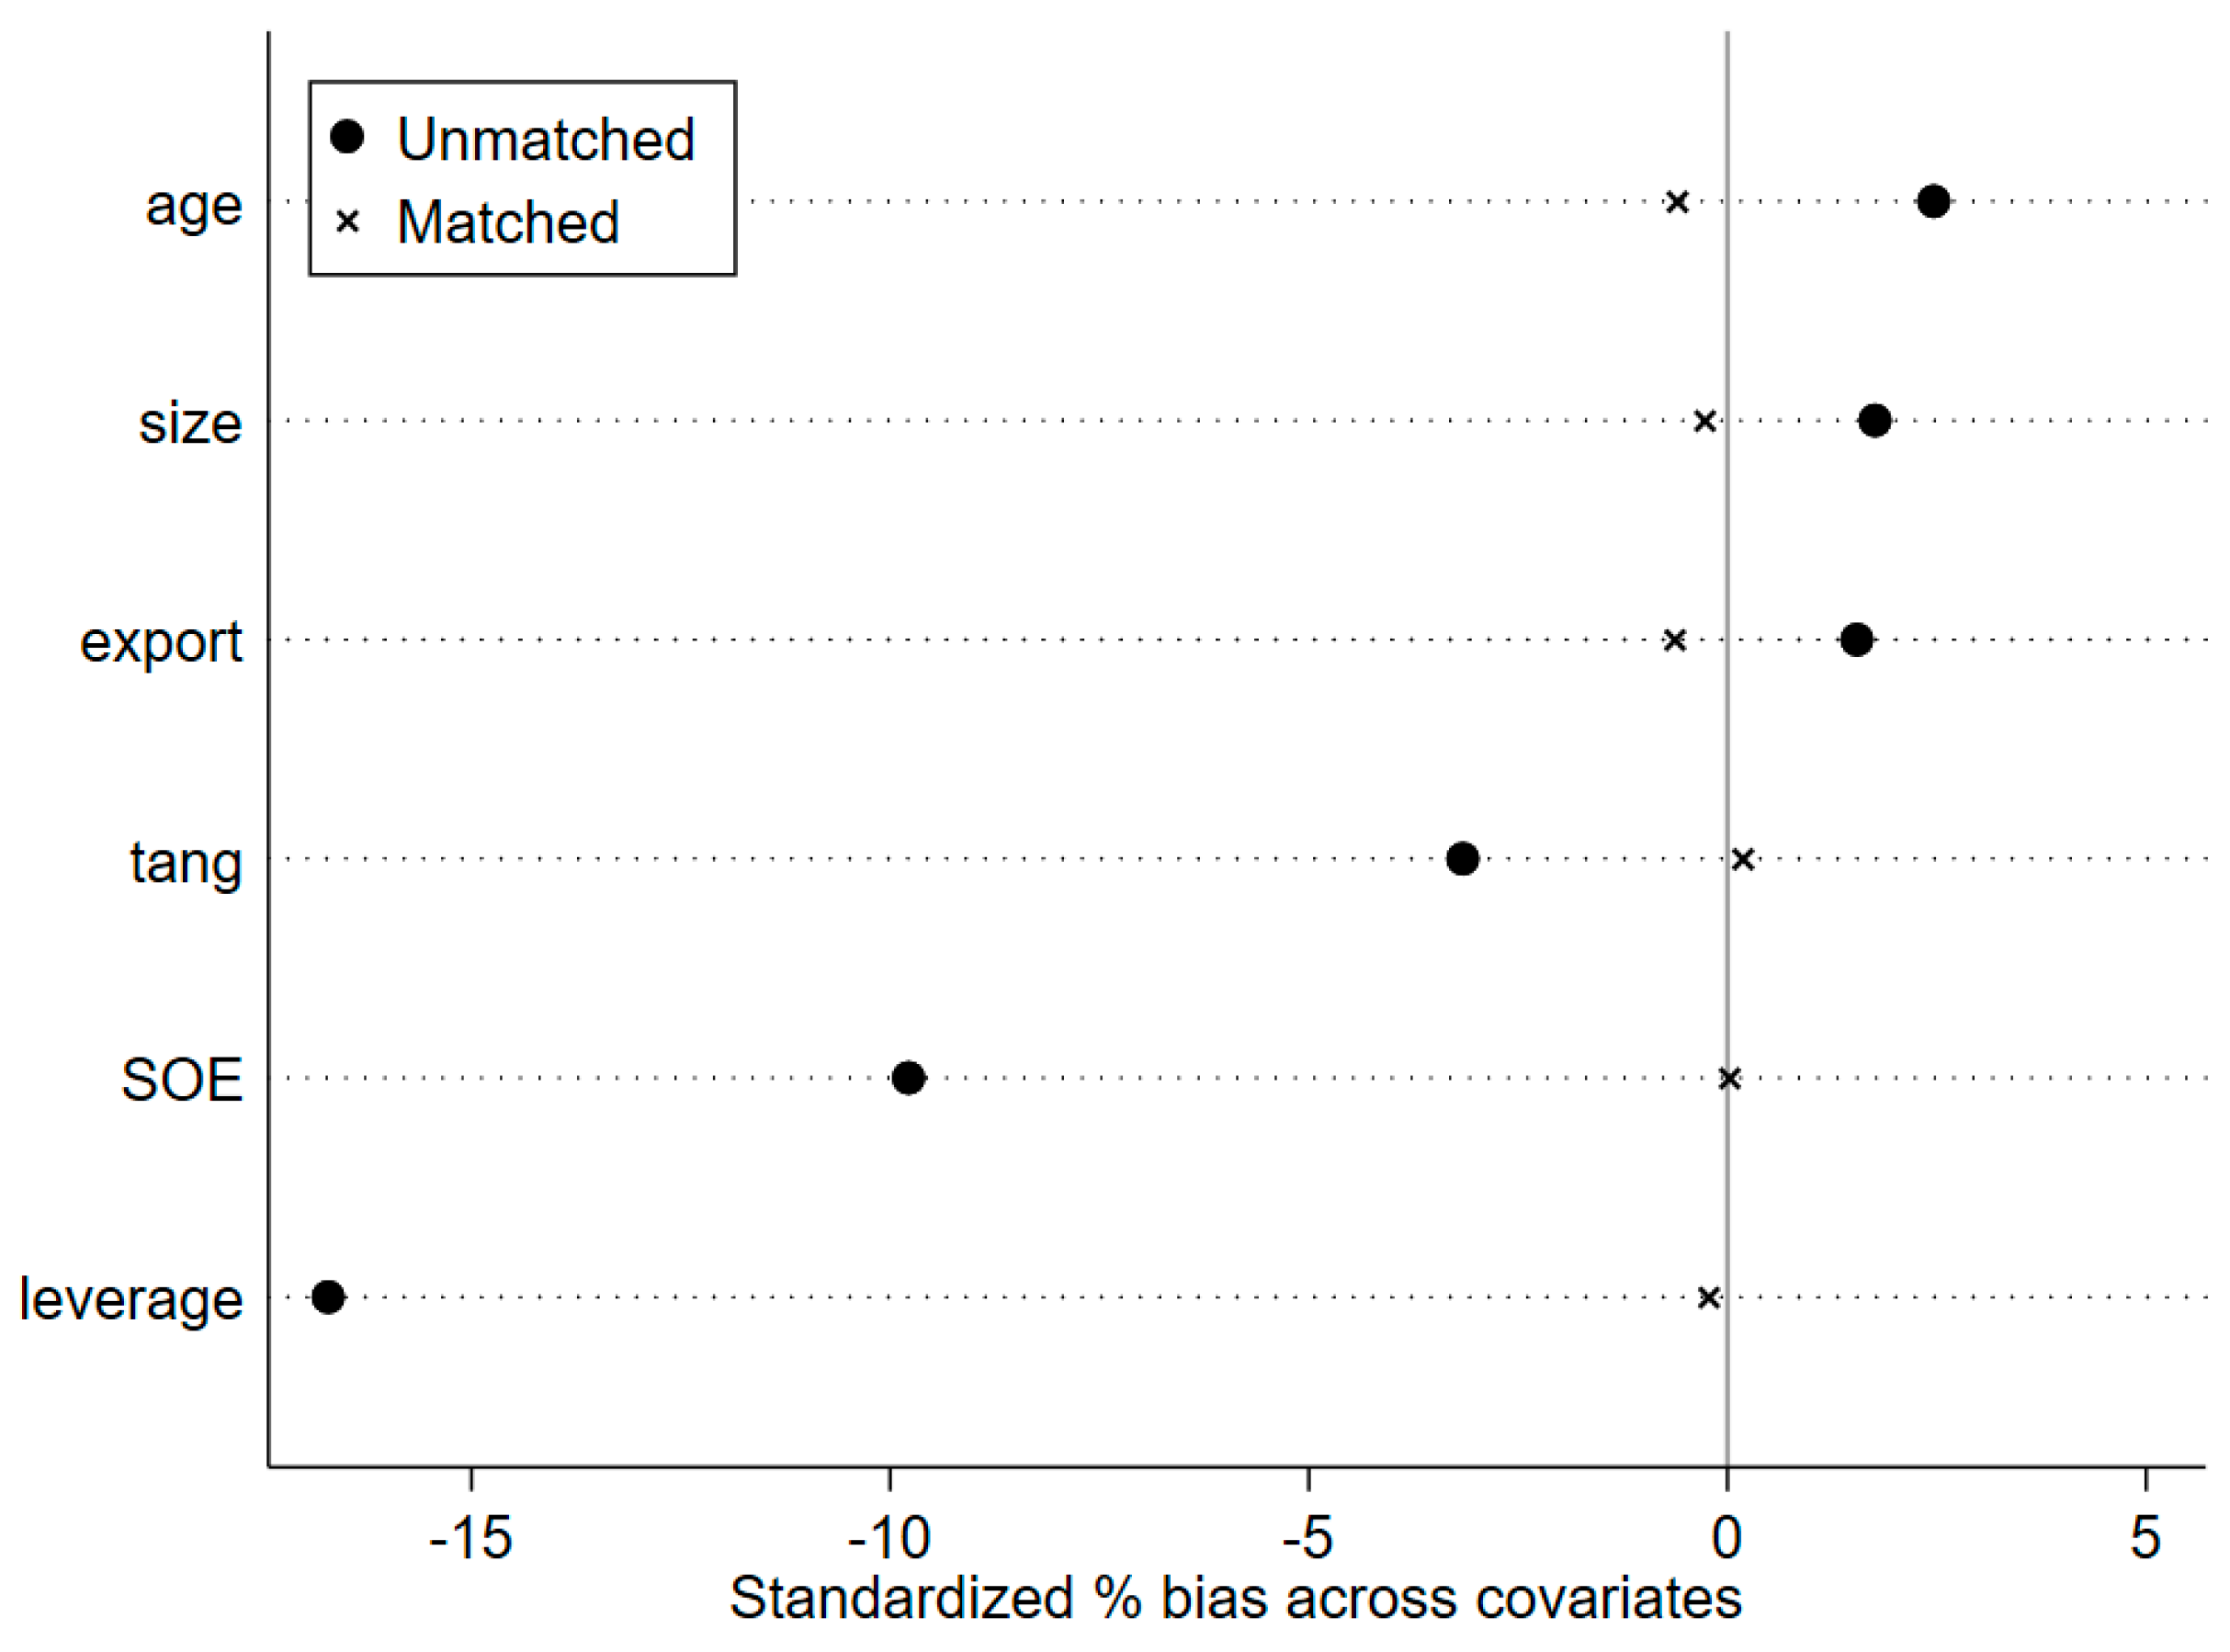
To mitigate potential selection bias, this paper employs the PSM-DID approach to reassess the impact of ETCs on pollution control. Propensity score matching (PSM) is employed to construct a more comparable control group by matching treated firms with non-treated firms based on observable characteristics, thereby reducing potential selection bias. Specifically, this paper first implements a 1:3 nearest-neighbor matching algorithm to construct a comparable control group, ensuring that treated and non-treated firms exhibit similar pre-treatment characteristics. A balancing test is then conducted to evaluate the standardized bias of covariates before and after matching. As
Figure 3 presents, the standardized bias of all covariates drops dramatically after matching, and their figures are all around zero, suggesting a satisfactory balance after matching.
Following the matching procedure, the DID estimation is performed on the matched sample to control for unobservable factors that may influence pollution emissions. By combining PSM and DID, this paper mitigates selection bias while strengthening causal inference. The regression results reported in column 1 of
Table 7 show that after fully considering the sample selection bias, ETCs lead to a substantial and robust decline in the pollution emissions of Chinese manufacturing.
5.4.4. Excluding Some Special Samples
Given these tremendous disparities in environmental, social, political, and economic resources across regions due to political hierarchy, this paper excludes certain special cities and further clarifies the causal relationship. Inspired by Zhu et al. [
23], column 2 in
Table 7 excludes province-level municipalities, provincial capital cities, and independent plan cities. In column 3, cities with good air quality are excluded, including Huizhou, Lishui, Zhuhai, Taizhou, Fuzhou, Guiyang, Shenzhen, Zhongshan, Yantai, Kunming, and Qingdao. It is apparent that after removing special cities from samples, the pollution-reduction effect of ETCs still stands.
5.4.5. Placebo Test
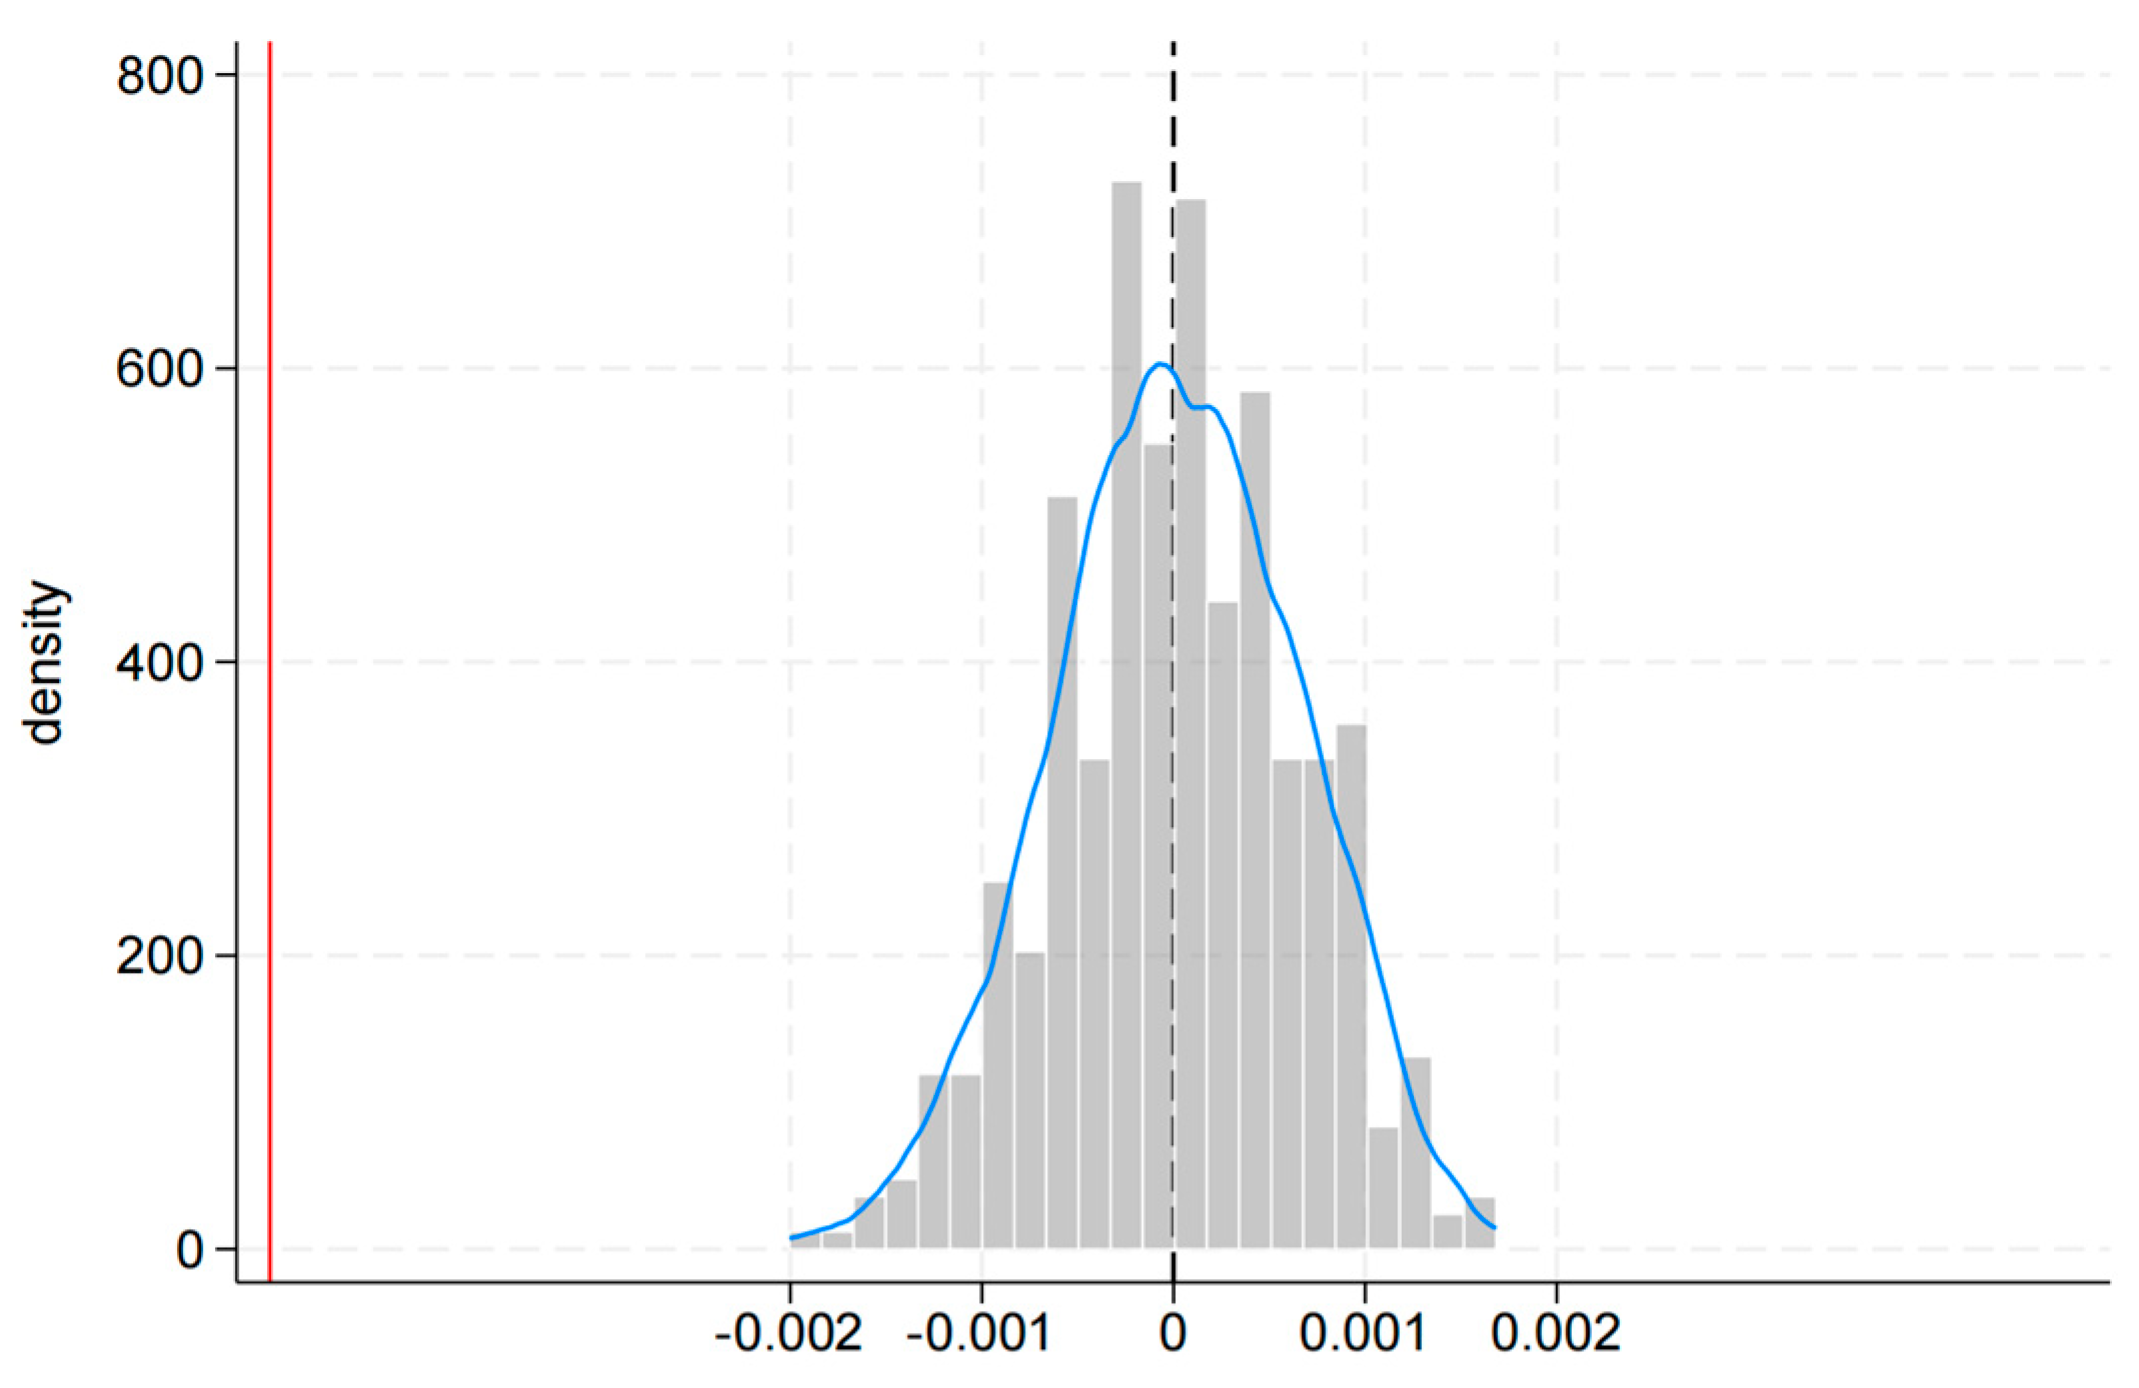
While the main findings suggest that ETCs significantly reduce pollution discharges in manufacturing firms, the observed effect may be potentially influenced by confounding factors that introduce selection bias. To address this concern and ensure robust identification, this paper conducts a placebo test to assess whether the results are primarily driven by omitted variables. Specifically, this paper randomly reassigns treated cities from the full sample and performs 500 bootstrap samplings.
Figure 4 plots the kernel density distribution of the estimated coefficients, which cluster around zero and are substantially larger than the baseline estimate. Consequently, it suggests that the main findings are unlikely to be driven by selection bias.
5.4.6. Results with Additional Macro-Level Confounding Factors
Local bureaucrats in China are multitasking agents [
29]. In addition to achieving pollution control, ensuring economic growth and fiscal revenue increases are fundamental criteria in the cadres’ performance appraisal system [
15,
16,
18]. As Ren et al. [
17] highlight, economic growth target constraints notably aggravate environmental pollution in local and adjacent areas. Therefore, this paper controls for the logarithm of GDP growth targets (GDP) and fiscal revenue increase targets (Fiscal) in columns 1 and 2 of
Table 8. Indeed, many place-based strategies and industrial policies have been carried out with huge implications during the sample period. To attenuate the potential bias driven by confounding unobservable factors, this paper adds the joint fixed effects for both the year and provinces in column 3 and the joint fixed effects for both the year and four-digit industry dummies in column 4. The results obtained across specifications in
Table 8 are negative and significant, further consolidating the reliability of the core conclusion.
5.4.7. Other Robustness Checks
In addition, this paper conducts other robustness tests to reinforce the reliability of the main conclusion. The related regression results are presented in
Table 9. (1) Using alternative standard error adjustments in the baseline analysis, all standard errors are adjusted for clustering at the four-digit industry level. This paper chooses other forms of standard errors to address serial correlation and heteroskedasticity issues. Column 1 adopts the heteroskedasticity-robust standard error, and columns 2 to 4 utilize the robust standard error clustering at the firm level, province–year level, and industry–year level, respectively. (2) Using an alternative outlier handling method, namely the median absolute deviation method (ADM), this paper excludes the interference from potential outliers in column 5. As reported, the magnitudes and significances of the independent variables hardly change. The basic conclusion exhibits favorable robustness.
6. Further Research
6.1. Mechanism Tests
Table 10 reports the results of the mechanism analyses. To examine the output scale adjustment effect, this paper exploits the logarithm of the industrial output value as a proxy for production level. As illustrated in column 1 of Panel A in
Table 10, the coefficient for
on the production scale is significantly negative, suggesting that ETCs significantly reduce output scales and that output scale abatement is an important channel associating ETC with pollution levels. The results imply that there is a noticeable substitution impact between pollution abatement and economic outcomes under local bureaucrats’ emission-reduction target management, in line with Chen et al. [
29].
Furthermore, this paper investigates the potential heterogeneous responses by firm size in columns 2 and 3 of Panel A in
Table 10. In light of the classification criteria published by China’s National Bureau of Statistics in 2011, this paper divides all firms into two groups, i.e., large firms and small and medium enterprises (SMEs), based on whether the number of employees exceeds 1000. The regression results indicate that ETCs lead SMEs to compress the output scale but have little influence on large firms. This follows the economic intuition: small enterprises bounded by financial and technological dilemmas fail to innovate and develop clean production processes [
31] and must narrow the output level to complete targeted emission reduction. In addition to output compression, large firms can introduce clean energy and upgrade pollution disposal facilities [
32] to deal with emission reduction targets.
To verify the innovation mechanism, this paper utilizes the patent database from the State Intellectual Property Office. Panel B reports the regression results. In column 1, following Zhu et al. [
23], this paper uses the number of green patents plus one logarithmically as a proxy for a firm’s green innovation. The estimated coefficient of
on green innovation is 0.0029, indicating that ETCs promote green innovation. This suggests that the innovative benefits completely offset firms’ compliance expenses incurred by ETCs, thus facilitating competitiveness [
36]. ETCs notably inhibit pollution emissions by advancing technological innovation.
Meanwhile, this paper explores its impact on innovation quality. In columns 2 and 3, radical and incremental innovation are measured by invention and non-invention patent outputs [
52], respectively. The results show that ETCs significantly promote radical innovation, while they have no visible effects on incremental innovation. The reason for this lies in the fact that incremental innovation reflects the exploitation of existing knowledge, while radical innovation typically appears to explore new areas and break new ground, thus contributing to competitiveness and market value [
52,
53]. To balance the rising costs triggered by ETCs, rational enterprises usually concentrate human resources and R&D funds on breakthrough innovation projects with higher expected profit margins, resulting in more invention patents than utility and design patents.
To discern the resource allocation effect, this paper follows Bu et al. [
41] and uses the ratio of coal consumption and fuel coal to total sales as a proxy for energy intensity, with the former serving as the primary industrial boiler fuel. Water resource utilization is described by the proportion of recirculating cooling water in industrial water use. Given that total factor productivity (TFP) reflects overall efficiency, this paper estimates firm-level TFP growth using the Olley–Pakes and OLS methods, following Aghion et al. [
54]. As shown in Panel C, ETCs exert a positive effect on the recycling water rate in column 1 and cause a significant energy-saving effect and less reliance on traditional energy in columns 2 and 3. In columns 4 and 5, ETCs contribute to an increase in TFP. Consequently, the results indicate that ETCs significantly promote resource utilization efficiency and advance emission-reduction effects.
6.2. Heterogeneity Analysis
6.2.1. Firm Ownership
ETCs might yield heterogeneous impacts in terms of the nature of firm ownership. As De Villiers et al. [
55] emphasized, it is easy for state-owned enterprises to obtain preferential treatment in environmental law enforcement due to their political background. Moreover, the annual “GDP championship” would force local state-owned enterprises (SOEs) to make productive investments rather than green investments [
56]. In contrast with SOEs, private firms have more incentives to innovate [
36] and apply clean energy and water reuse to offset the compliance costs to meet the environmental requirements. Therefore, this paper postulates that, compared to SOEs, private enterprises exhibit greater sensitivity to ETCs. To examine these differential effects, the samples are classified into two groups (i.e., SOEs and private firms) following the approach of Jiang et al. [
44]. Columns 1 and 2 of
Table 11 illustrate that ETCs have an invisible impact on the SOE group but are negatively associated with pollution emissions in the private enterprise group at the 1% significance level. The empirical
p-values obtained by Fisher’s permutation test further confirm the statistical significance of these differences.
6.2.2. Exporting Activity
Caloghirou et al. [
47] regard export activities as a form of knowledge stock, highlighting that exporting firms can effectively leverage distinctive intangible knowledge-based assets, including management experience in international business, technological knowledge, and market intelligence [
57]. Access to the international market facilitates regulated enterprises improving energy-consuming structures and lessening reliance on traditional energy [
41,
42]. In contrast, non-exporting enterprises fail to upgrade and meet emission-reduction requirements due to insufficient knowledge accumulation. Accordingly, this paper suspects that the emission levels of exporting firms may decrease more significantly than those of non-exporting firms. To ascertain whether the roles of ETCs noticeably vary due to exporting activity, this paper divides the samples into two groups (i.e., exporting and non-exporting firms) based on whether the firm reports export delivery values. Columns 3 and 4 suggest that ETCs inhibit pollution levels in both exporting and non-exporting firms. Comparatively, non-exporting firms are less sensitive to ETCs than exporting ones.
6.2.3. Resource Endowment
As the “resource curse hypothesis” underlines, economies with abundant resources often depend excessively on primary product sectors to obtain profits, which have the prominent features of low human capital, weak innovation capacity, and inadequate technology spillovers [
58]. A resource boom can trigger deindustrialization in non-resource sectors, along with worsening political institutions, ultimately stifling R&D activities [
59]. Moreover, an abundance of natural resources may foster a complacent reliance on resource wealth, prompting local governments to underestimate the strategic importance of innovation [
60]. Consequently, this paper conjectures that the ETCs may produce more favorable pollution-reduction effects in non-resource-based cities than in resource-based areas. To authenticate the heterogeneous impacts, this paper applies the classification by the State Council in 2013 based on resource reserves and utilization conditions, separating the whole sample of cities into two groups (i.e., resource-based cities and other cities). Columns 5 and 6 in
Table 11 imply that ETCs have little influence in resource-based cities and can yield a discernible and negative impact on pollution levels in other cities, as expected.
7. Conclusions and Policy Implications
Combining Chinese industrial enterprise data and the green development database, this paper attempts to explore the causal nexus between ETCs and pollution discharges of manufacturing firms from 2004 to 2012 using DID, DDD, and PSM-DID estimation. The results indicate that ETCs lead to a significant decline in pollution emissions. After conducting a battery of sensitivity tests, the main conclusion remains robust. Our heterogeneity analysis indicates that the emission-reduction effect is bigger for private enterprises and insignificant for SOEs. ETCs exert stronger impacts on exporting firms and in non-resource-based areas. In addition, the plausible mechanisms are further investigated, revealing that the pollution-reduction effect is achieved by inhibiting production scales, improving technological innovation, and promoting resource utilization efficiency.
The findings of this study offer important policy insights, particularly for countries with similar institutional frameworks and industrial structures, such as other East Asian economies undergoing environmental and economic transitions. Given the shared challenges in balancing industrial development and environmental regulation, the evidence presented in this paper may provide valuable references for policymakers seeking to design effective environmental policies. To extend the main conclusion, the policy implications of this paper mainly include the following aspects: (i) The central government should optimize performance assessment standards and increase the weight of environmental indicators. In light of the main results, ecological deterioration can be substantially relieved by integrating local bureaucrats’ promotion incentives into environmental policies. The central government must gradually perfect local administrative accountability mechanisms and increase support for the construction of administrative accountability systems. To achieve this, specific quantifiable environmental metrics, such as carbon emission reduction targets and pollution abatement performance, should be embedded into the assessment criteria. Furthermore, the central government should strengthen local administrative accountability mechanisms by gradually improving oversight frameworks and enhancing financial and technical support for policy enforcement. (ii) In terms of establishing a differentiated environmental regulatory system, local environmental agencies should reduce the “one-size-fits-all” approaches and establish a differentiated environmental regulatory system. Heterogeneity analyses suggest that firm characteristics, including ownership type, export activity, and firm locations, should be factored into setting emission-reduction obligations. For instance, beyond enforcing stringent environmental monitoring, local policymakers should implement targeted financial incentives and technological assistance to support non-exporting firms and SMEs in meeting their emission-reduction targets more efficiently and sustainably.


