1. Introduction
In the realm of highway research, the correlation between crash rates and various road design elements has garnered significant attention. Prior research has demonstrated that truck crash rates are three to four times higher on horizontal curves than on similar tangent segments [
1,
2]. Moreover, in traffic crash analysis, it has been observed that trucks traveling on curves to the left tend to have more significant speed fluctuations than those traveling on curves to the right, indicating that there are differences in driving behavior and risk perception in the two scenarios and the crash rates on curves to the left are also relatively high. During a turn, the driver’s line of sight may be directed to the inside of the curve [
3], and the driver’s speed choice is also related to the spatial position of the truck on the road. Studies have shown that curves to the right have a better adjustment effect on the driver’s subjective perception than curves to the left [
4]. In addition, scholars who have suggested higher crash rates on curves to the left are more likely to come from countries with left-hand drive, where the driver’s turning trajectory in the innermost lane of the curves to the left will deviate more than expected due to the “sidewall effect,” resulting in a smaller trajectory radius and increased centrifugal forces. Although various safety management strategies for circular curves are required in many countries, such as Singapore [
5], China [
6], and the United States [
7], many crashes still occur on the curve every year. According to statistics, 19% of traffic crash deaths in China are related to trucks [
8], and 44% of truck traffic crashes occur on curves [
9]. Therefore, analyzing the reasons for the difference in truck collision crashes between curves to the left and right from the speed perspective and proposing different safety assurance measures for curves with different deflection directions is crucial to improving the effectiveness of safety management strategies.
The crash rate for trucks on curves of freeways remains high. The fundamental reason is that the geometric design indicators of the curve are not consistent with the driving characteristics of the trucks. This includes the poor matching of design indicators such as the length and radius of the curve with the speed adjustment requirements of the trucks. The limiting values of the geometric design indicators of some curves cannot fully guarantee the smooth turning of trucks, and the transition of horizontal and vertical indicators is relatively frequent. Compared with passenger cars, trucks have lower braking ability, worse steering stability, and more complex dynamic force states, making them prone to rear-end collisions, side collisions, rollovers, and other crashes on curves [
10]. Due to the limited quality and quantity of crash analysis reports on curved segments of freeways, researchers used speed analysis indicators to investigate traffic safety on curved segments. Through a series of data collection methods such as radar speed measurement, video data extraction, and simulation [
11], indicators such as speed variability, acceleration, and speed consistency are proposed to analyze the speed changes of trucks on curves to evaluate the degree of speed change and speed uniformity, thereby gaining a deep understanding of the risks that may be caused by speed mutations and evaluating the safety level of the curve. However, using traditional indicators and data to evaluate the safety level of curves brings the following challenges: (a) it is difficult to obtain continuous and universal data through cross-sectional data collection and simulation; (b) existing research mainly focuses on the combination of horizontal curves and vertical curves on low-grade highways. For high-grade freeways, the effect of the deflection angle on the safety is often ignored; (c) traditional indicators make it difficult to comprehensively evaluate the safety level of the entire curve.
Driving characteristics such as speed, acceleration, and speed difference can truly reflect the adaptability of trucks on the curve. A comprehensive and accurate grasp of the speed behavior of trucks on curves is the key basis for solving the above difficulties [
12]. A variety of speed behavior collection methods have been proposed, mainly including FCD, simulated driving, real truck driving, drone aerial photography, road video monitoring, etc. Among the many data collection technologies, the full-time domain and full-road section high-precision speed data obtained regarding freight floating trucks have a series of significant advantages [
13]. Compared with general trajectory data, these data have multiple characteristics such as full-time domain, large range, high precision, high frequency, and no environmental and human interference, which is conducive to comprehensively and accurately grasping the continuous driving characteristics of trucks on different segments of curves [
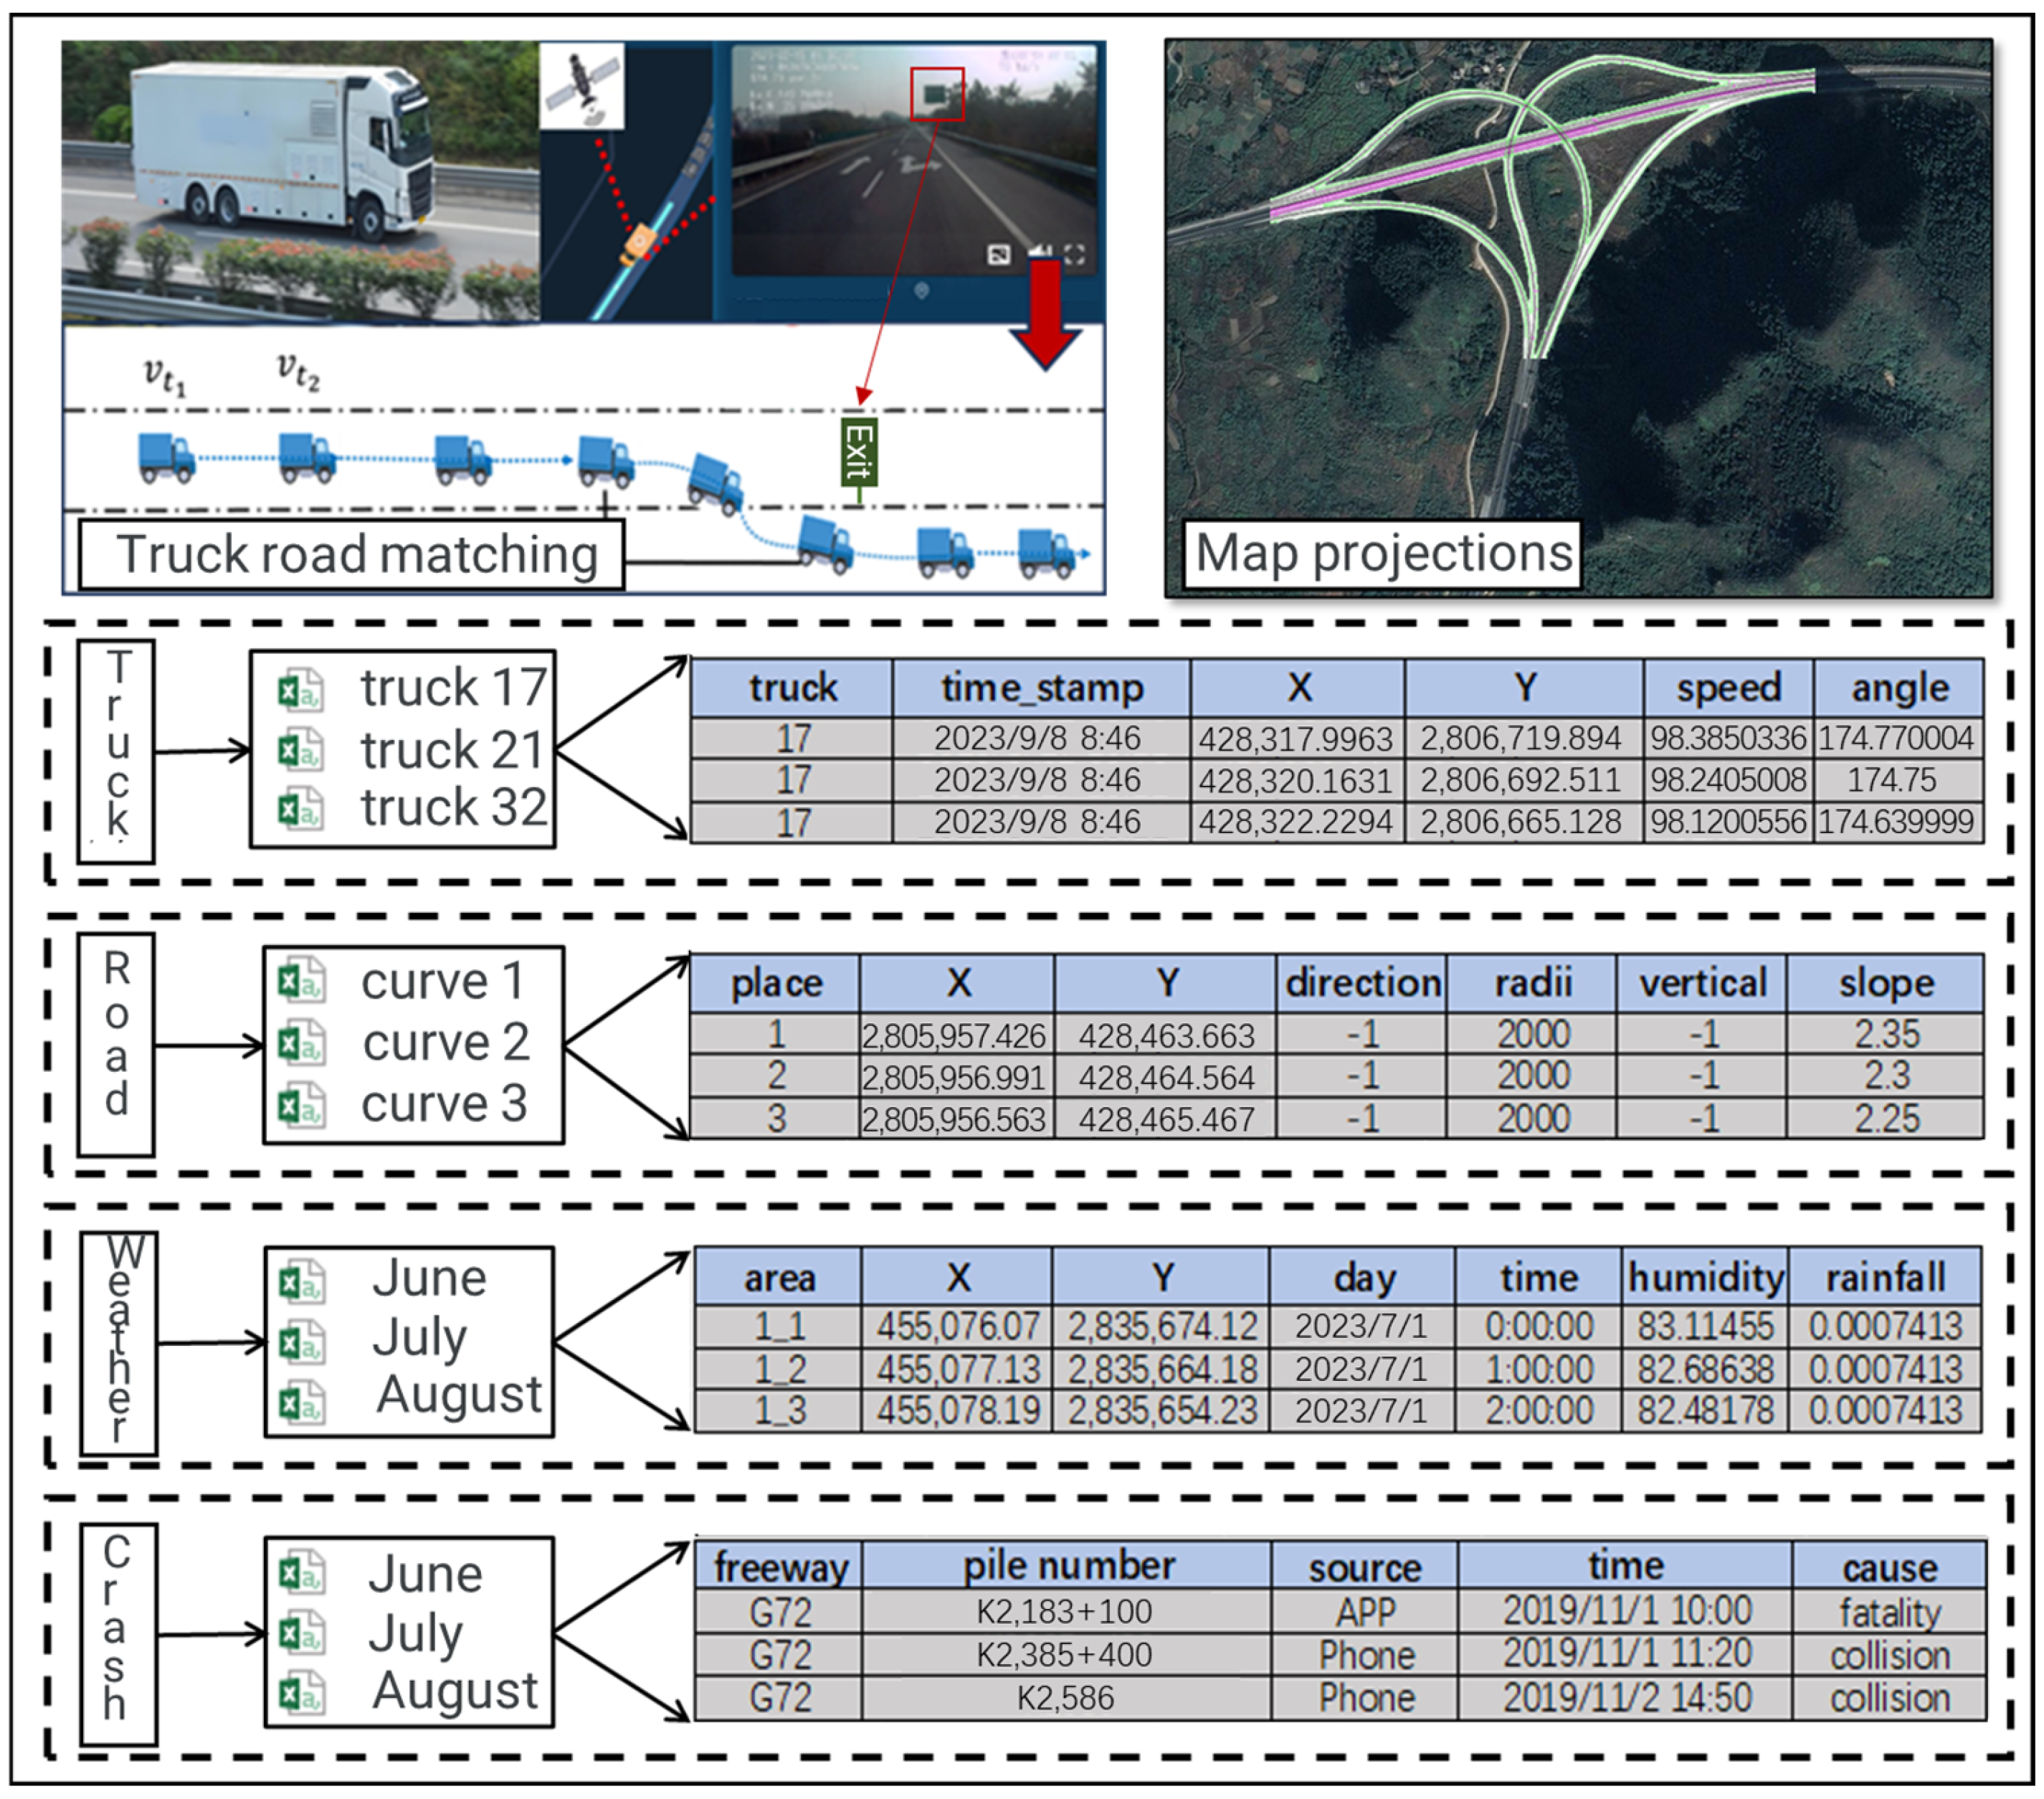
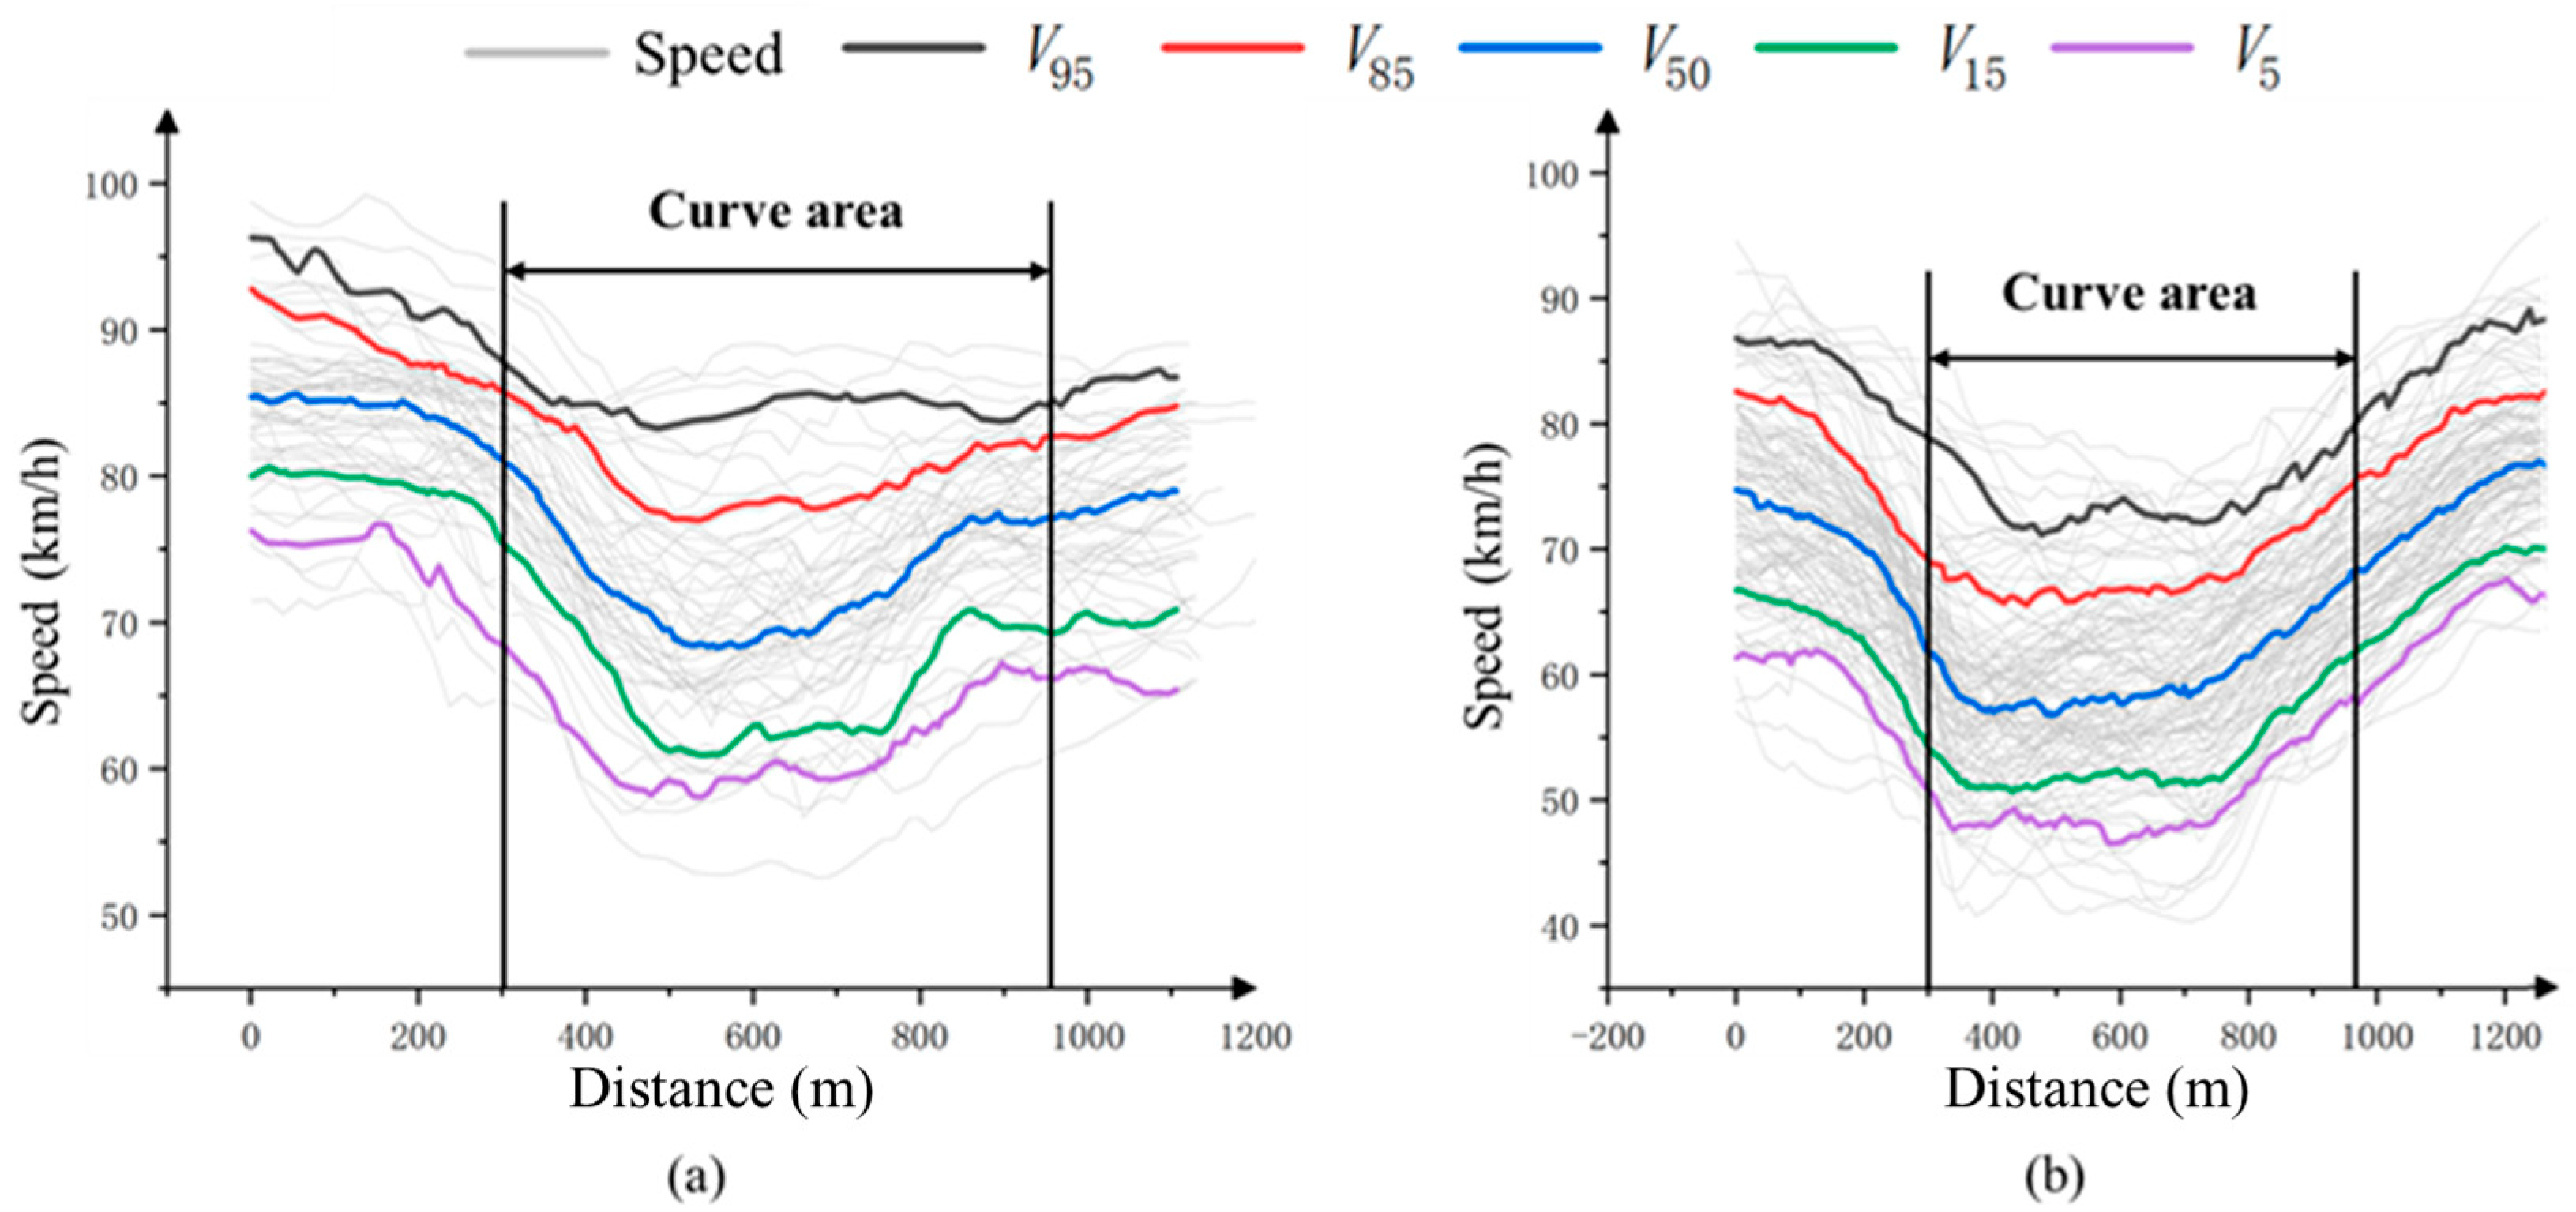
14]. In the early stage of this study, the real-time trajectories of more than 5000 trucks from the Guangxi region of China was obtained. The driving skills of the drivers were similar, and all of them drove left-hand drive. About 110 million trajectory data points were generated every day, with a speed measurement accuracy of 1 km/h and a timing accuracy of 1 s. In addition, the geometric design data for two freeways, including deflection angles from 20 to 65 degrees and radii from 763 to 2500 m, were obtained. Using the truck traffic data extracted from FCD and freeway geometric design data can effectively expand the research sample size and allowed us to obtain continuous trajectory data on curves at the second level. This lays the foundation for exploring the differences in truck crash rates on curves and evaluating the safety level of curves.
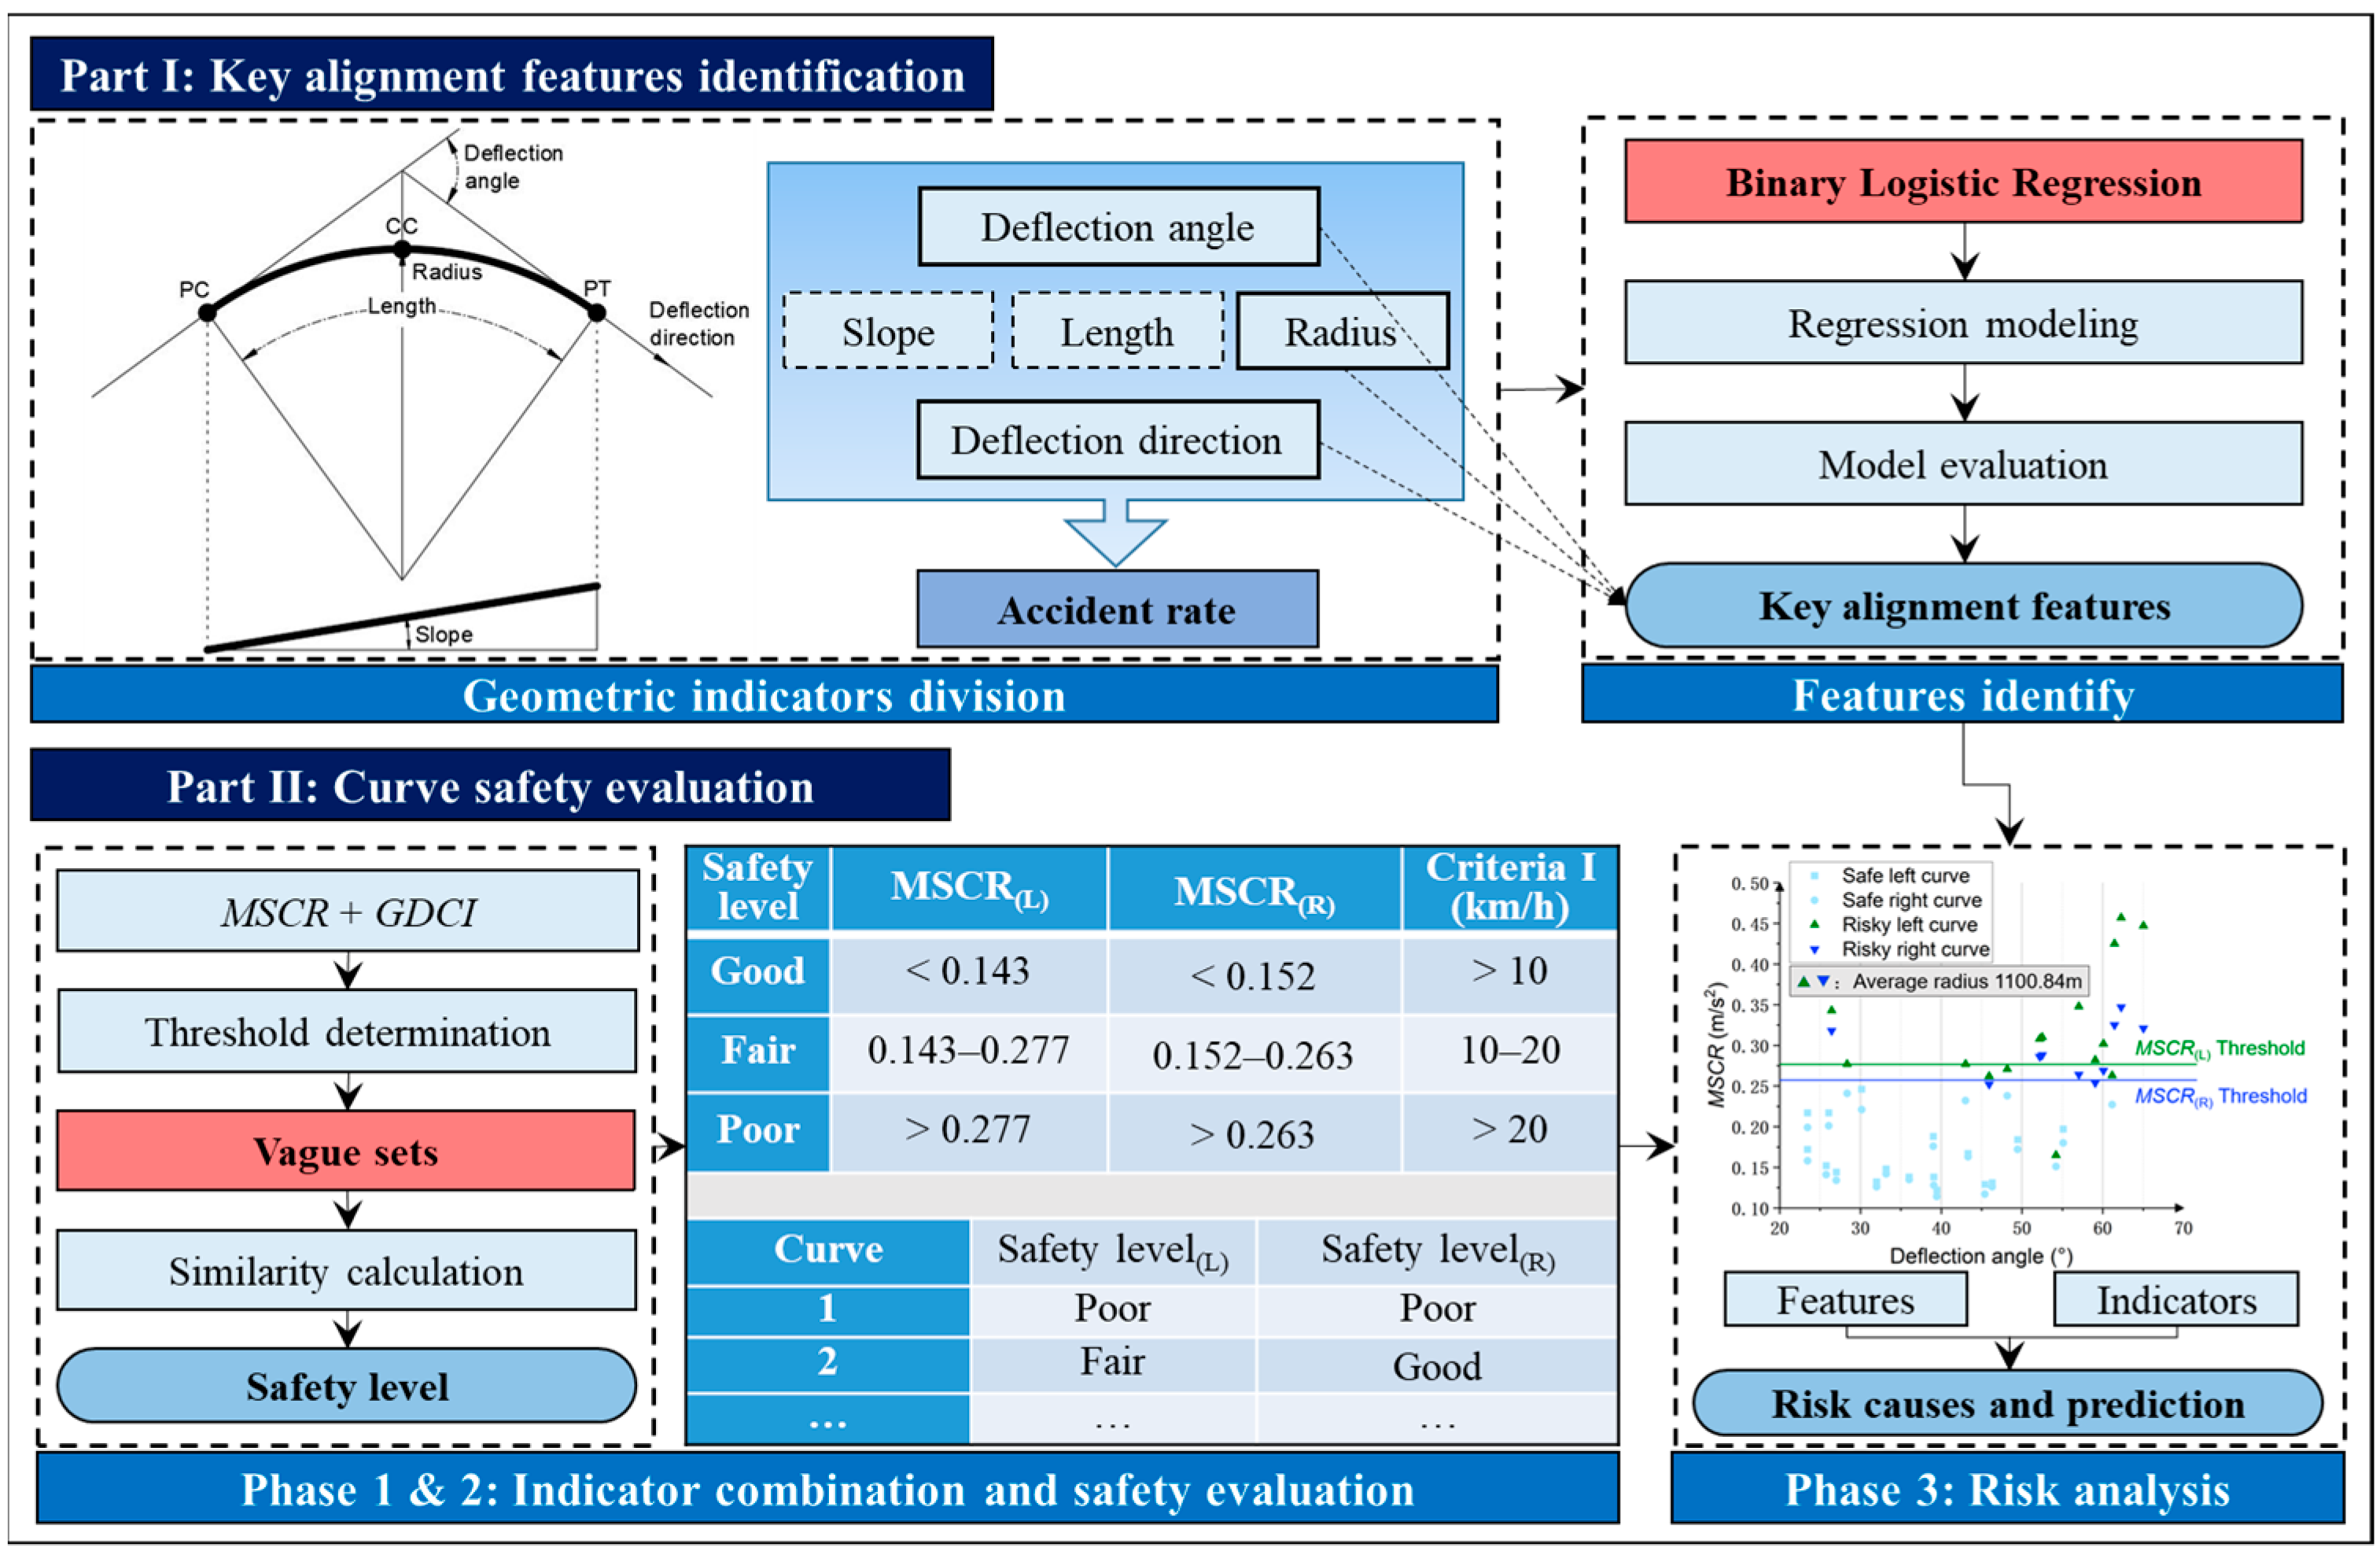
To summarize, in this study, a safety evaluation indicator—an MSCR indicator based on GDCIs—is proposed to evaluate the safety level of curves and to analyze the difference in crash rates between curves to the left and right. This MSCR indicator can further combine GDCIs to complete the safety evaluation of curves to the left and right. After identifying key features and determining the indicator threshold, the vague sets are used to assess the safety level of the curve, and the difference in crash rates between curves to the left and right is analyzed. As a case study, the truck traffic data extracted from FCD for the 32 circular curve segments on freeways are used to verify and evaluate the proposed method. This study offers two key contributions. First, at the methodological level, we employed binary logistic regression (BLR) to identify the key features influencing the crash rate of curves and introduce the MSCR as a novel safety evaluation indicator. This methodological advancement not only enhances the precision of crash-rate assessments but also aligns with sustainability goals by promoting safer road designs that reduce crash-related environmental impacts and resource consumption. By integrating the GDCIs, a more practical and comprehensive analysis of crash-rate differences between curves to the left and right is possible, thereby supporting sustainable transportation infrastructure development. Secondly, at the analytical application level, the research findings on safety indicators elucidate the underlying causes of crash-rate disparities between curves to the left and right. This insight is crucial for freeway management departments to evaluate the safety levels of curves more effectively. By implementing targeted safety management strategies for curves with different deflection directions, the crash rate can be significantly reduced, further reducing emissions from traffic congestion, reducing material waste from vehicle maintenance, and minimizing medical costs related to injuries, thereby contributing to the achievement of sustainable development goals.
6. Conclusions
In this study, based on a series of indicators, the reasons for the difference in crash rates between trucks on curves to the left and right were analyzed from the perspective of speed, and the safety level of curves was evaluated. The primary contributions are summarized as follows. First, the features that lead to crashes on curved roads are identified at the methodological level, and a new safety evaluation indicator based on geometric design consistency, the MSCR indicator, is proposed. Through multi-angle analysis, the MSCR indicator is seen to be more practical than traditional acceleration indicators. Combined with geometric consistency indicators, it is more suitable for evaluating the safety level of curves. Secondly, at the analytical application level, we used floating trucks to collect a large amount of truck speed data from 32 curves with different corners on the freeway. On this basis, the accuracy of the MSCR indicator and GDSI in identifying high-risk curves was compared, and the analysis indicators were used to evaluate the safety level of the curves through examples to find out the reasons for the difference in crash rates between the curves to the left and right. The conclusions are as follows:
(1) BLR was used to comprehensively analyze the relationship between the geometric indicators of the test segments (including radius, length, average longitudinal slope, deflection angle, and deflection direction) and crash-rates’ analysis. The study found that there may be a collinear relationship between the length and other features. Because the test segments are mainly a freeway in a plain area, the geometric indicators value is relatively high. The average longitudinal slope has no significant impact on crash rates. BLR analysis further found that curve radius, deflection angle, and deflection direction significantly impact crash rates, so this study selected the above influencing factors for analysis.
(2) Vague sets can express fuzzy information more comprehensively. Based on this, the safety level of curves with different deflection directions is considered by combining the MSCR and GDSI. The combination of indicators can significantly improve the accuracy of curve safety level evaluation.
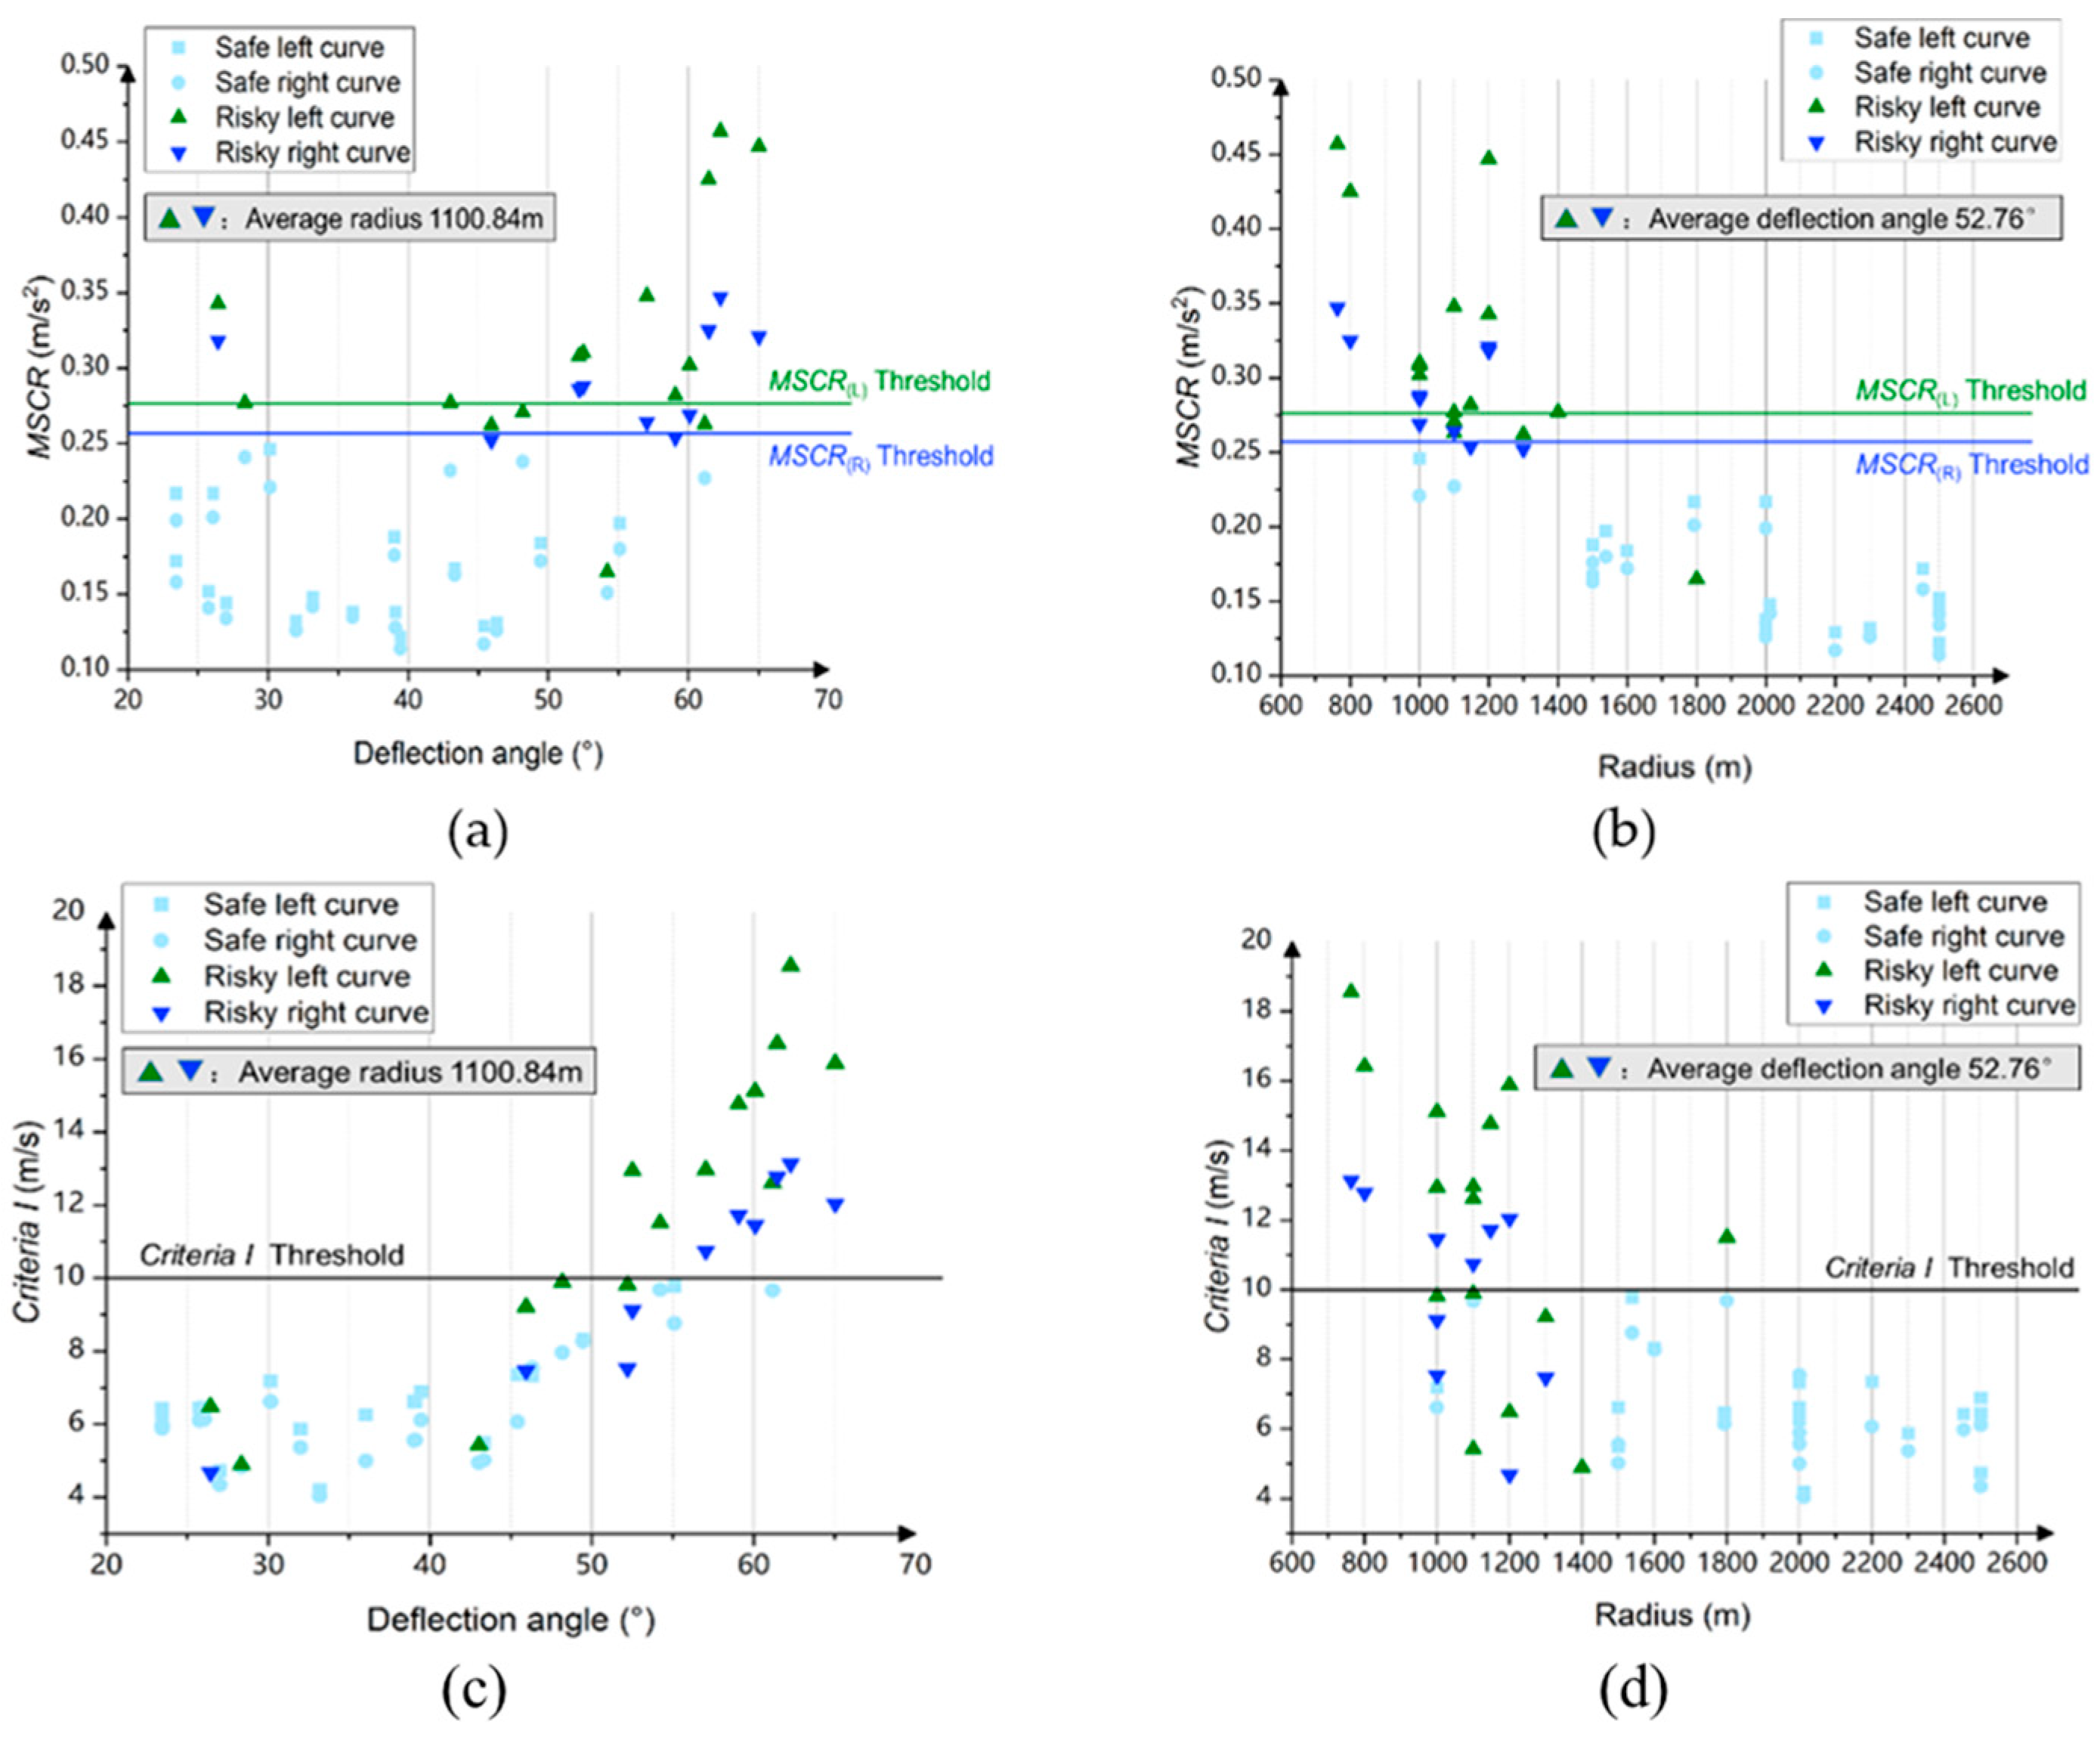
(3) Whether considering the MSCR or Criteria I values, the change value of the curves to the left consistently surpasses that of the curves to the right at the same deflection angle and radius. Furthermore, as the deflection angle increases or the radius decreases, the divergence between the curves to the left and right becomes progressively more pronounced. The disparity in safety indicators may constitute one of the underlying factors contributing to the variation in crash rates between curves to the left and right.
However, this article only extracts the features of a single curve and analyses its safety level. It is impossible to effectively evaluate the safety level of trucks on special forms of curves, such as oval curves and S-shaped curves. Furthermore, the operating environment of the freeway is highly complex, with factors such as road alignment conditions, the driver’s physiological characteristics (such as handedness, gender, age, etc.), weather, traffic volume, and cross-segmental elements all exerting some influence on driving safety. The research results of this paper can be applied to the safety evaluations of highways that have been put into operation, but the factors considered in the fitting subset are relatively few. In the future, it is necessary to further expand the sample size and consider more factors affecting truck driving, improve the accuracy and applicability of the evaluation, build a more accurate collision risk prediction model, and use geometric design indicators to predict collision risks, so as to provide stronger theoretical support for highway driving safety research, contributing to the sustainable development goals.


