1. Introduction
Currently, the issue of global climate warming is becoming increasingly severe. In the process of urbanization, carbon dioxide emissions from production and daily life have become the main source of greenhouse gases [
1]. Cities, as areas with high concentrations of human activities, contribute more than 80% of global carbon emissions. Therefore, promoting low-carbon transformation in cities, improving energy utilization efficiency, and achieving green development have become topics of concern worldwide [
2]. The United Nations Human Settlements Programme’s “World Cities Report 2022” notes that in the next 30 years, the global urbanization rate will increase from the current 56% to 68%, with the highest contributions coming from countries such as India, China, and Australia. During the 75th session of the United Nations General Assembly, China, recognized as the largest developing nation and leading carbon emitter, contributing roughly one-third of the world’s carbon emissions, pledged to tackle global climate change. China set a target to reach peak carbon emissions by 2030 and to become carbon neutral by 2060.
Urban industrial production, transportation, building development, and other human activities are increasing year by year [
3]. The continuously rising urbanization rate will inevitably lead to the aggregation of large populations and economic activities, accompanied by the construction of new urban form structures. Urban form structure is the spatial basis of resource allocation, economic activities, production, and life. Smart growth theory aims to make full use of urban space to create maximum benefits at the lowest cost.
The urban morphological structure is not only limited to describing the shape of the urban boundary but also covers multiple dimensions of land resource development and urban spatial layout. Compared with previous studies, the contribution of this paper is that it innovatively explores the action mechanism and intermediary path of various urban form structure indicators on carbon emission efficiency and analyzes how the interaction of each indicator affects carbon emission efficiency from a multi-factor perspective.
The urban agglomerations of Beijing–Tianjin–Hebei, the Yangtze River Delta, and the Pearl River Delta are the regions with the most concentrated economic activities in China and also the regions with the highest level of urbanization [
4]. The purpose of this study is to explore which urban form structure can effectively improve carbon emission efficiency and sort out the transmission paths and mechanisms through which urban form and structure affect carbon emission efficiency, with the aim of providing a reference for creating a high-quality urban form and structure model and exploring the spatial governance and planning paths for low-carbon transformation.
The research question and contribution of this paper lie in extracting the built-up areas of cities in the three major urban agglomerations of China in the long time series from 2013 to 2022 by using night light data and constructing the urban form structure index set based on the two dimensions of land resource development and urban spatial layout based on the super-efficiency SBM model, the carbon emission efficiency is calculated from the perspective of input–output. Then, using geographic detectors and econometric models, the influence degree and action path of the interaction of single and multiple factors of urban form structure on the carbon emission efficiency are analyzed from the perspective of economic activities, and the mediating transmission mechanism played by the economic agglomeration effect therein is analyzed. The Beijing–Tianjin–Hebei, Yangtze River Delta, and Pearl River Delta urban agglomerations have the highest regional concentration of economic activities and the highest levels of urbanization in China. Ensuring improved carbon emission efficiency on the basis of steady development and creating exemplary urban form structures can provide model examples for promoting new urbanization strategies in the future and facilitating coordinated economic and social development.
2. Literature Review
The urban form structure refers to the physical space layout and land resource development mode in a city [
5]. Land economic efficiency and industrial structure layout are two important issues in urban economics; however, existing studies have focused mainly on two of their processes: one is the form change in urban built-up areas in the process of urban expansion, and the other is the spatial layout within the existing urban area.
The process of urban development and expansion is inevitably accompanied by resources and energy consumption. Excessive urban expansion and excessive development intensity will directly increase the carbon emissions of the construction industry, leading to a heat island effect in a short period [
6]. Overly slow urban expansion or insufficient development will result in a mismatch between the degree of land development and the demand for economic activities, which will cause resources to be wasted in each development process. Therefore, appropriate land development intensity and urban expansion intensity can improve energy efficiency and carbon emission efficiency [
7].
Currently, research on urban spatial layouts has focused primarily on aspects such as urban accessibility characteristics, urban compactness, and central urban features. Among these, urban accessibility reflects the operational efficiency and dispersal function of a city, with the most direct manifestation being the urban transportation system. A well-developed transportation system not only enhances travel efficiency and promotes traffic-related carbon reduction but also stimulates economic development in the surrounding areas; this process facilitates the formation of new subcenters and thus alleviates the functional load of the central urban area, thereby mitigating the negative environmental impacts of urban congestion [
8]. The degree and density of street connectivity, as the framework of urban form, have a long-term impact on urban land use and traffic carbon emissions [
9]. The compact urban form is a prominent topic in current research. Some studies have revealed that, from population, economy, and landscape perspectives, a compact and contiguous urban layout is beneficial for creating an efficient transportation structure and reducing transportation energy consumption [
10]. However, some studies have argued that compact urban forms do not always achieve the expected carbon reduction effects [
11]. While compact cities can improve energy utilization efficiency and reduce carbon emissions in the industrial and residential sectors, they may not meet expectations in public transportation and can contribute to localized temperature increases due to the creation of urban heat islands. Centrality is reflected in the concentration of economic activities and the multicentral characteristics of a city [
12]. The concentration of economic activities enhances the coordination of residential, transportation, and production activities, supports a centralized energy supply, prevents transportation-related losses, and improves both energy utilization efficiency and production efficiency [
13]. In addition, relevant studies have shown that the internal architectural form of a city affects the carbon emissions of urban energy by influencing energy demand and supply, while the three-dimensional urban form affects the carbon emissions of building energy consumption by influencing the density of urban functional areas and the compactness of three-dimensional buildings [
14,
15].
There are abundant studies on the impact of a single index of urban form structure on carbon emission efficiency, but the process of land resource development and urban spatial layout does not exist in isolation; the process of land development and expansion itself is a process of coordinated promotion, and the spatial layout activities carried out after this process are also carried out on the spatial basis of the existing available land. In terms of urban space layout, accessibility, compactness, and concentration, respectively, represent the function of urban space dispersal, the shape characteristics of the urban boundary, and the concentration degree of urban activities, and there is a strong correlation among the three characteristics. Therefore, further analysis of the interaction mechanism of different characteristic indicators on carbon emission efficiency can provide a scientific basis for urban form optimization more comprehensively.
Research indicates that the urban form structure impacts economic activities related to carbon emissions. Liu et al. [
16] argued that the evolution of urban form structure is closely related to industrial structure upgrades, manifesting primarily in changes in land use structure, adjustments in regional functions, and optimization of spatial forms. Li et al. [
17] reported that a high-quality urban spatial structure can reduce the spatial distance of economic activities, enhance information exchange efficiency, facilitate technology spillovers, and generate positive externalities, thereby increasing economic efficiency. On the one hand, efficient urban economic activities can directly affect capital input and economic output, and on the other hand, they can reduce energy input and carbon emissions through technological progress. Currently, focusing solely on carbon emissions is insufficient to meet the needs of urban development. Determining how to maximize economic benefits and improve carbon emission efficiency by optimizing urban form structure on the basis of pollution reduction and carbon reduction is the key to achieving sustainable economy-environment-society development [
18]. The layout of green infrastructure under the high-quality urban form structure can effectively coordinate sustainable supply chains and green supply chains and further promote digital transformation and low-carbon transformation [
19,
20].
While significant advances have been made in the study of urban form structures, notable gaps remain. First, the impact of the urban form structure on carbon emissions remains limited to single or multiple independent indicators, with relatively few studies examining the interaction effects of multiple indicators. Second, with respect to influence pathways, the urban form structure does not directly affect carbon emissions; rather, carbon emissions are indirectly reflected via urban activities. Empirical analyses that explore the mediating pathways of carbon emission efficiency from an economic activities perspective are lacking.
3. Theoretical Analysis and Hypotheses
In the process of urban development and construction, the expansion of urban boundaries and the spatial layout within a city jointly determine the urban form structure; these include development intensity (DEV), expansion coefficient (EXP) and compactness (COM), radius fractal dimension (FRA), and central concentration (CEN), respectively. This structure, in turn, influences the economic development model, land development and utilization, industrial scale, and residential lifestyles, all of which affect energy consumption, economic output, and environmental performance, thereby impacting carbon emission efficiency. Research has demonstrated that both excessive and insufficient urban development and expansion intensities hinder improvements in carbon emission efficiency [
21,
22]. Blindly pursuing rapid expansion without optimizing the internal spatial layout of the city also leads to issues such as resource wastage and inefficiency. Development intensity and expansion intensity are more related to energy use efficiency and land use efficiency; blind development and expansion not only cause a waste of resources in the short term but also may lead to idle land resources, blocked land transfer, land function mismatch, and other problems due to the lack of long-term planning so that corresponding economic benefits cannot be obtained [
23]. Coordinate the relationship between development and expansion, avoid resource waste and heat concentration caused by too fast and too slow, avoid high-intensity carbon emissions from the development process, and then improve carbon emission efficiency.
At the same time, taking into account the process of land resource development and urban space layout, the newly developed land provides reserved space for urban function relaxation, and the expansion direction and expansion intensity are coordinated with the transfer direction of urban economic activities to form a high-quality urban function organization space, ensuring the high efficiency and order of urban central activities [
24]. The central concentration and radius fractal dimensions reflect the aggregation and dispersion of activities within a city. The concentration of urban activities reduces energy losses, while a more focused allocation of labor and capital is achieved. The dispersion of urban functions, in turn, helps avoid overcrowding and resource misallocation. On the basis of the existing development intensity and expansion intensity, urban spatial layout focuses on the concentration of core activities and the dispersion of peripheral space, which makes it easier to form coordinated industrial clusters, improve energy utilization efficiency and industrial operation efficiency [
25], innovate production technology through knowledge spillover, optimize resource allocation, and improve carbon emission efficiency. During the construction of compact cities, enhancing central activity concentration while reserving adequate space for dispersion can efficiently improve the operational efficiency of internal city activities, integrate urban industrial spaces, and form an organized urban functional structure. It can improve transportation accessibility, reduce the hindrance of spatial distance [
26], realize the reasonable layout of residence and employment and the balanced distribution of public facilities, and promote carbon emission reduction from the aspects of construction, production, and life, thereby enhancing carbon emission efficiency from multiple perspectives. Under the influence of multiple dimensions and factors and with consideration given to socioeconomic benefits [
27], the interactive effects of various urban form structure indicators on carbon emission efficiency can exhibit a dual-factor enhancement effect.
Hypothesis 1. The interactions of multiple indicators ofthe urban form structure enhance carbon emission efficiency through a dual-factor mechanism.
Research in urban economics indicates that external characteristics such as spatial structure, population density, and urban scale influence behavioral activities within a city [
28]. Appropriate urban development and expansion activities provide a foundation for internal urban layout and reconstruction, which increases investment returns through infrastructure construction [
29]. In addition to providing external space for urban development, the process of land resource development itself, as one of the economic activities, also affects carbon emission efficiency through the input–output ratio. A centralized and orderly development process can efficiently use energy, gather human capital, generate land benefits, and improve the carbon emission efficiency of the construction industry [
30]. Establishing an efficient urban functional dispersal system and enhancing the concentration of central activities can reinforce functional specialization, improve the dispersibility of spatial structure to speed up the outward radiation of knowledge and technology, promote the expansion of industrial scale and the extension of industrial network, build a regional cooperation system, avoid the negative externalities brought by congestion effect, and promote urban spatial planning and industrial transfer adjustment [
31], and provide spatial support for the spillover effects of agglomeration economies. A compact urban structure can reduce the spatial distance among economic activities, lower commuting and transportation costs, improve economic exchange efficiency, efficiently combine various production factors, and strengthen spatial agglomeration by accelerating technology sharing, knowledge spillover, and resource compensation; the city can build an industrial network, realize cross-industry and cross-regional collaboration, and give full play to the positive externalities of agglomeration [
32]. Through infrastructure sharing, play the role of labor reservoir, accelerate knowledge spillover and the spread of green technology, and carry out technological innovation to achieve cost reduction and efficiency and low-carbon production of enterprises. Under the influence of urban form structure, the existence of industrial agglomeration economic effect and spillover effect may improve urban carbon emission efficiency. The detailed influence mechanism is shown in
Figure 1.
Hypothesis 2. The urban form structure enhances carbon emission efficiency by promoting economic agglomeration effects.
4. Methodology and Data
4.1. Methodology
4.1.1. Urban Built-Up Area Extraction
Measurements of urban form structure at the prefecture-level city scale focus primarily on dimensions such as land resource development control and urban spatial layout [
33]. Compared with population distribution raster data and impervious surface data, nighttime light data can reflect population distribution and industrial activity intensity differences while excluding the impact of idle land within a city, thereby more objectively reflecting the form structure of built-up urban areas [
34]. In this study, the research was based on the corrected formed long-term nighttime light dataset from 2013 to 2022; it was corrected and formed for the years 2013–2022 via change detection methods based on the PyCharm2024 software, that could extract built-up urban areas and further calculate the urban development intensity, urban expansion coefficient, spatial compactness, central concentration, and radial fractal dimension [
35].
4.1.2. Super Efficient SBM Model
On the basis of the input-output perspective, the nonradial and nonoriented super-efficiency SBM model using MatlabR2022b is employed to calculate the carbon emission efficiency of cities within the three major urban agglomerations. The super-efficiency SBM model considers slack variables, further differentiating effective decision-making units. By radially adjusting slack variables of the input-output, the model incorporates undesirable output elements and improves the efficiency values [
36]. In summary, the nonradial and nonoriented super-efficiency SBM model is used to compute the carbon emission efficiency of the three major urban agglomerations, as represented by the following model:
Suppose there is a production system with n decision-making units. Each decision-making unit is composed of three input–output vectors: input, expected output, and unexpected output. The expected output of
S1 and the unexpected output of
S2 are generated using m units of input. The three input–output variables can be expressed as:
. Among them, the definitions of matrices
X,
Yg, and
Yb are as follows:
Suppose
X > 0,
Yg > 0, and
Yb > 0, then the production possibility set can be defined as:
In the formula: The actual expected output is lower than the ideal expected output level at the forefront, while the actual unexpected output is higher than the unexpected output level at the forefront. Based on the production possibility set, the SBM model incorporates non-expected outputs into the evaluation decision unit (
,
,
) according to Tone’s SBM model is:
In the formula,
S = (
S−,
Sg,
Sb) represents the slack variables of input, expected output, and non-expected output. The objective function value of
is the efficiency value of the decision unit, and its range is between 0 and 1. For a given decision unit (
x0,
,
), if and only if
= 1, that is,
S− =
Sg =
Sb = 0, This decision-making unit is effective. If 0 ≤
< 1, the evaluated unit is inefficient, and at this time, the input and output need to be improved. Since the above-mentioned model is a nonlinear model, it is not conducive to the calculation of efficiency. Through the Charnes–Cooper transformation, the nonlinear equation is transformed into a linear model, and its equivalent form is as follows:
In most studies on efficiency evaluation, there exists a common phenomenon that multiple decision-making units have a 100% “efficiency state”. Therefore, when ranking efficiency, it is very important to distinguish these efficiency decision-making units from the influencing factors. In order to ensure that the efficiency analysis generates a more reasonable efficiency evaluation value, combined with the research of Tone, this paper selects the super-efficiency SBM model for measurement, and its model is expressed as follows:
In the formula: The objective function value of is the efficiency value of the decision unit, and the size of the value can exceed 1. The definitions of other variables are similar to the previous formula. All of the above models are based on the assumption of a constant scale.
4.1.3. Geographic Detector
The geographic detector is a spatial analysis method used to assess spatial differentiation, detect the explanatory power of driving factors, and analyze the interaction between variables; it is widely applied in fields such as environmental ecology and social development [
37]. By employing single-factor detection and interaction detection, this method can be used to investigate the explanatory power of single factors and double-factor interactions related to the carbon emission efficiency of various urban form structure indicators. By calculating and comparing the q value of each single factor and the q value after the superposition of two factors, we can determine whether there is interaction between them and the strength, direction, linearity, or nonlinearity of the interaction during 2013–2022. The factor detector formula is as follows:
Differentiation and factor detection: Detecting the spatial differentiation of
Y. Moreover, to detect to what extent a certain factor
X explains the spatial differentiation of attribute
Y, measured by the
q value, the expression is:
In the formula: h = 1, …, L represents the stratification of variable Y or factor X, that is, classification or partitioning; Nh and N are, respectively, the number of units in layer h and the entire area; and are, respectively, the variances in the Y values of layer h and the entire region. SSW and SST are, respectively, the sum of the variances within the layer and the total variance of the entire region. The range of q is [0, 1]. The larger the value, the more obvious the spatial differentiation of Y. If the layering is generated by the independent variable X, the larger the q value, the stronger the explanatory power of the independent variable X for the attribute Y; conversely, the weaker it is. In extreme cases, a q value of 1 indicates that factor X completely controls the spatial distribution of Y, while a q value of 0 indicates that factor X has no relationship with Y, and the q value indicates that X explains 100 × q% of Y.
A simple transformation of the
q value satisfies the non-central
F distribution:
In the formula, λ is a non-central parameter and is the mean of layer h.
Interaction detection: Identify the interaction among different risk factors
XS, that is, evaluate whether the combined action of factors
X1 and
X2 will increase or weaken the explanatory power for the dependent variable
Y or whether the influence of these factors on
Y is independent of each other. First, calculate the
q values of the two factors
X1 and
X2 for
Y, respectively:
q (
X1) and
q (
X2), and calculate the
q values when they interact (the new polygon distribution formed by the tangency of the two layers of superimposed variables
X1 and
X2):
q (
X1∩
X2), and compare
q (
X1),
q (
X2) and
q (
X1∩
X2). The relationship between these two factors can be classified into the following categories (
Table 1):
Among them, Min(q(X1), q(X2)) is the minimum value taken between q(X1) and q(X2). Max(q(X1), q(X2)) is the maximum value taken between q(X1) and q(X2), q(X1) + q(X2) is the sum of q(X1) and q(X2), q(X1∩X2) is the interaction between q(X1) and q(X2).
4.1.4. Mediation Effect Model
Previous research indicates that the influence pathway of the urban form structure on carbon emission efficiency not only resides in the form structure itself but also affects carbon emission efficiency through the economic effect of agglomerations. In this study, the mediation effect model, drawing from the research of Wen et al. [
38], was adopted to conduct empirical research on the impact pathways of carbon emission efficiency. The linear regression equations of the model are as follows:
where
Y is the dependent variable of carbon emission efficiency,
X is the independent variable of the urban form structure indicators,
M is the mediating variable of the degree of economic agglomeration,
c is the effect of
X on
Y,
a is the effect of
X on the mediating variable
M,
b is the effect of
M on
Y after controlling for
X,
c′ is the effect of
X on
Y after controlling for
M, and
e1,
e2 and
e3 represent residuals.
The first step is to use a fixed effects model to study the effect of the urban form structure on carbon emission efficiency. The baseline regression model used in the study is as follows:
The second step is to test the effect of each urban form structure indicator on the mediating variable of the effect of economic agglomeration with the following formula:
The third step involves testing whether the effect of economic agglomeration acts as a mediating variable in the process through which the urban form structure affects carbon emission efficiency. For this test, the mediating variable is introduced into the baseline model via the following formula:
where
i represents the individual,
t represents time, and
and
are carbon emission efficiency and urban form structure indicators, respectively.
represents control variables such as economic development level, population density, industrial structure, and environmental regulation.
controls for time-fixed effects.
and
c represent error and intercept terms, and
α1,
α2,
β1,
γ1, and
δ1 are the coefficients of the variables.
The first step tests the significance of the core explanatory variable on the dependent variable; the second step judges the effect of the core explanatory variable on the mediating variable; the third step examines the significance of the regression coefficients in Equation (9) to determine the type of mediation effect. If the core explanatory variable coefficient is not significant but the mediating variable coefficient is significant, the mediation effect is complete; if both coefficients are significant, the mediation effect is partial.
4.2. Variable Selection
4.2.1. Dependent Variable
Carbon emission data are calculated according to the basic equation of carbon accounting in the IPCC2006 guide and the energy consumption in the energy statistical yearbook of each city [
39]. The carbon emission efficiency of the three major urban agglomerations in China during 2013–2022 is calculated via the SBM model, which incorporates energy consumption, fixed capital stock, and urban employment as input variables. The fixed capital stock is deflated using 2011 as the base year, following the perpetual inventory method referenced by Zhang et al. [
40]. Energy consumption is represented by the total electricity consumption of the entire society. Actual GDP (in billions of yuan) is used as the desirable output, whereas carbon emissions are considered the undesirable output (
Table 2). The input–output indicators refer to the study of Zeng et al. [
41].
4.2.2. Core Independent Variables
In this study, the urban form structure (UFS) is measured through two dimensions, i.e., land resource development and urban spatial layout, and nighttime light data are used to extract built-up urban areas. Five core independent variables are calculated: development intensity (DEV) [
42], expansion coefficient (EXP) [
43], compactness (COM) [
44], radial fractal dimension (FRA) [
45], and central concentration (CEN) [
46]. These variables are used in both single-indicator and multi-indicator empirical studies to examine their impact on carbon emission efficiency (
Table 3).
4.2.3. Other Variables
Control Variables: Carbon emission efficiency is also influenced by other factors, including the economic development level, population density, industrial structure, and environmental regulations. The level of economic development (PGDP) affects residents’ consumption habits and lifestyles. Population density (POP) affects carbon emissions related to transportation, resource utilization, and production and living activities. The industrial structure (IS) is a crucial aspect of economic and social development. They are represented by the proportion of value added in the tertiary industry. Environmental regulation (ER) can compel enterprises to innovate production technologies. Environmental regulation is expressed by industrial wastewater, soot, and sulfur dioxide emissions per unit output value. After standardized treatment, the entropy weight method is used to calculate the weight and calculate the comprehensive index.
Mediating Variable: The degree of economic agglomeration (ECAG) denotes the clustering of regional development factors and economic activities within a specific space. Drawing from the research of Zeng et al. [
47], the degree of economic agglomeration is represented by the ratio of the sum of the value added in the secondary and tertiary industries to that in the administrative area.
4.3. Data Sources
Original data for the night light data selected for this study originated from the National Environmental Information Center under the National Oceanic and Atmospheric Administration (NOAA) of the United States. Meanwhile, to reduce the influence of abnormally bright areas, research data from Wu et al. [
48] were selected for this study, and the “pseudo-pixel invariance method” was used to calibrate the DMSP-OLS data. Additionally, consider the consistency of the temporal resolution of DMSP-OLS and NPP-VIIRS data, and repair these original monthly data before synthesizing annual NPP-VIIRS data. Further combined with calibrated DMSP-OLS (1992–2013) data, NPP-VIIRS (2013–2023) data were further transformed and processed to obtain a DMSP-OLS-like dataset, with the gray value range of data from 1 to 63. Various socioeconomic data are obtained from the “
China Urban Statistical Yearbook”, “
China Electric Power Statistical Yearbook”, the energy statistical yearbooks of various cities, and various statistical bulletins. Missing data are supplemented by the interpolation method.
5. Results
5.1. Spatiotemporal Evolution Characteristics of Urban Form Structures
The results of
Figure 2 indicate that the built-up areas of the three major urban agglomerations in China exhibit a pattern of “core cities expanding outwards, with surrounding cities emerging in a dispersed manner”. The Beijing-Tianjin-Hebei urban agglomeration, which is based on the spatial layout of “one core, dual cities, and two wings”, radiates outwards, with Beijing as the core and Beijing and Tianjin as the key points. Under the driving effect of the dual-city growth poles, Beijing and Tianjin effectively concentrate resources from the surrounding cities, achieving rapid agglomeration of production factors and economic activities, with the urban scope continuously expanding. This expansion stimulates the development of surrounding cities through a trickle-down effect, forming a dispersed polycentric structure. The Yangtze River Delta urban agglomeration forms a three-layer structural model extending from Shanghai as the core to the central and western regions. Shanghai, as the first layer, attracts surrounding cities, which expand eastwards on the basis of its well-developed status, leading to a high degree of integration in the second layer. Furthermore, the “small Yangtze River Delta” region (Shanghai, southern Jiangsu, and northern Zhejiang) is gradually forming an integrated model in urban space. A comprehensive transportation network further drives inland cities to form a multipoint expansion pattern. The Pearl River Delta urban agglomeration, with Guangzhou and Shenzhen as the core, extends along the east and west banks of the Pearl River estuary. Compared with the other two urban agglomerations, the Pearl River Delta has the highest degree of agglomeration and more pronounced regional integration, presenting a linear expansion characteristic.
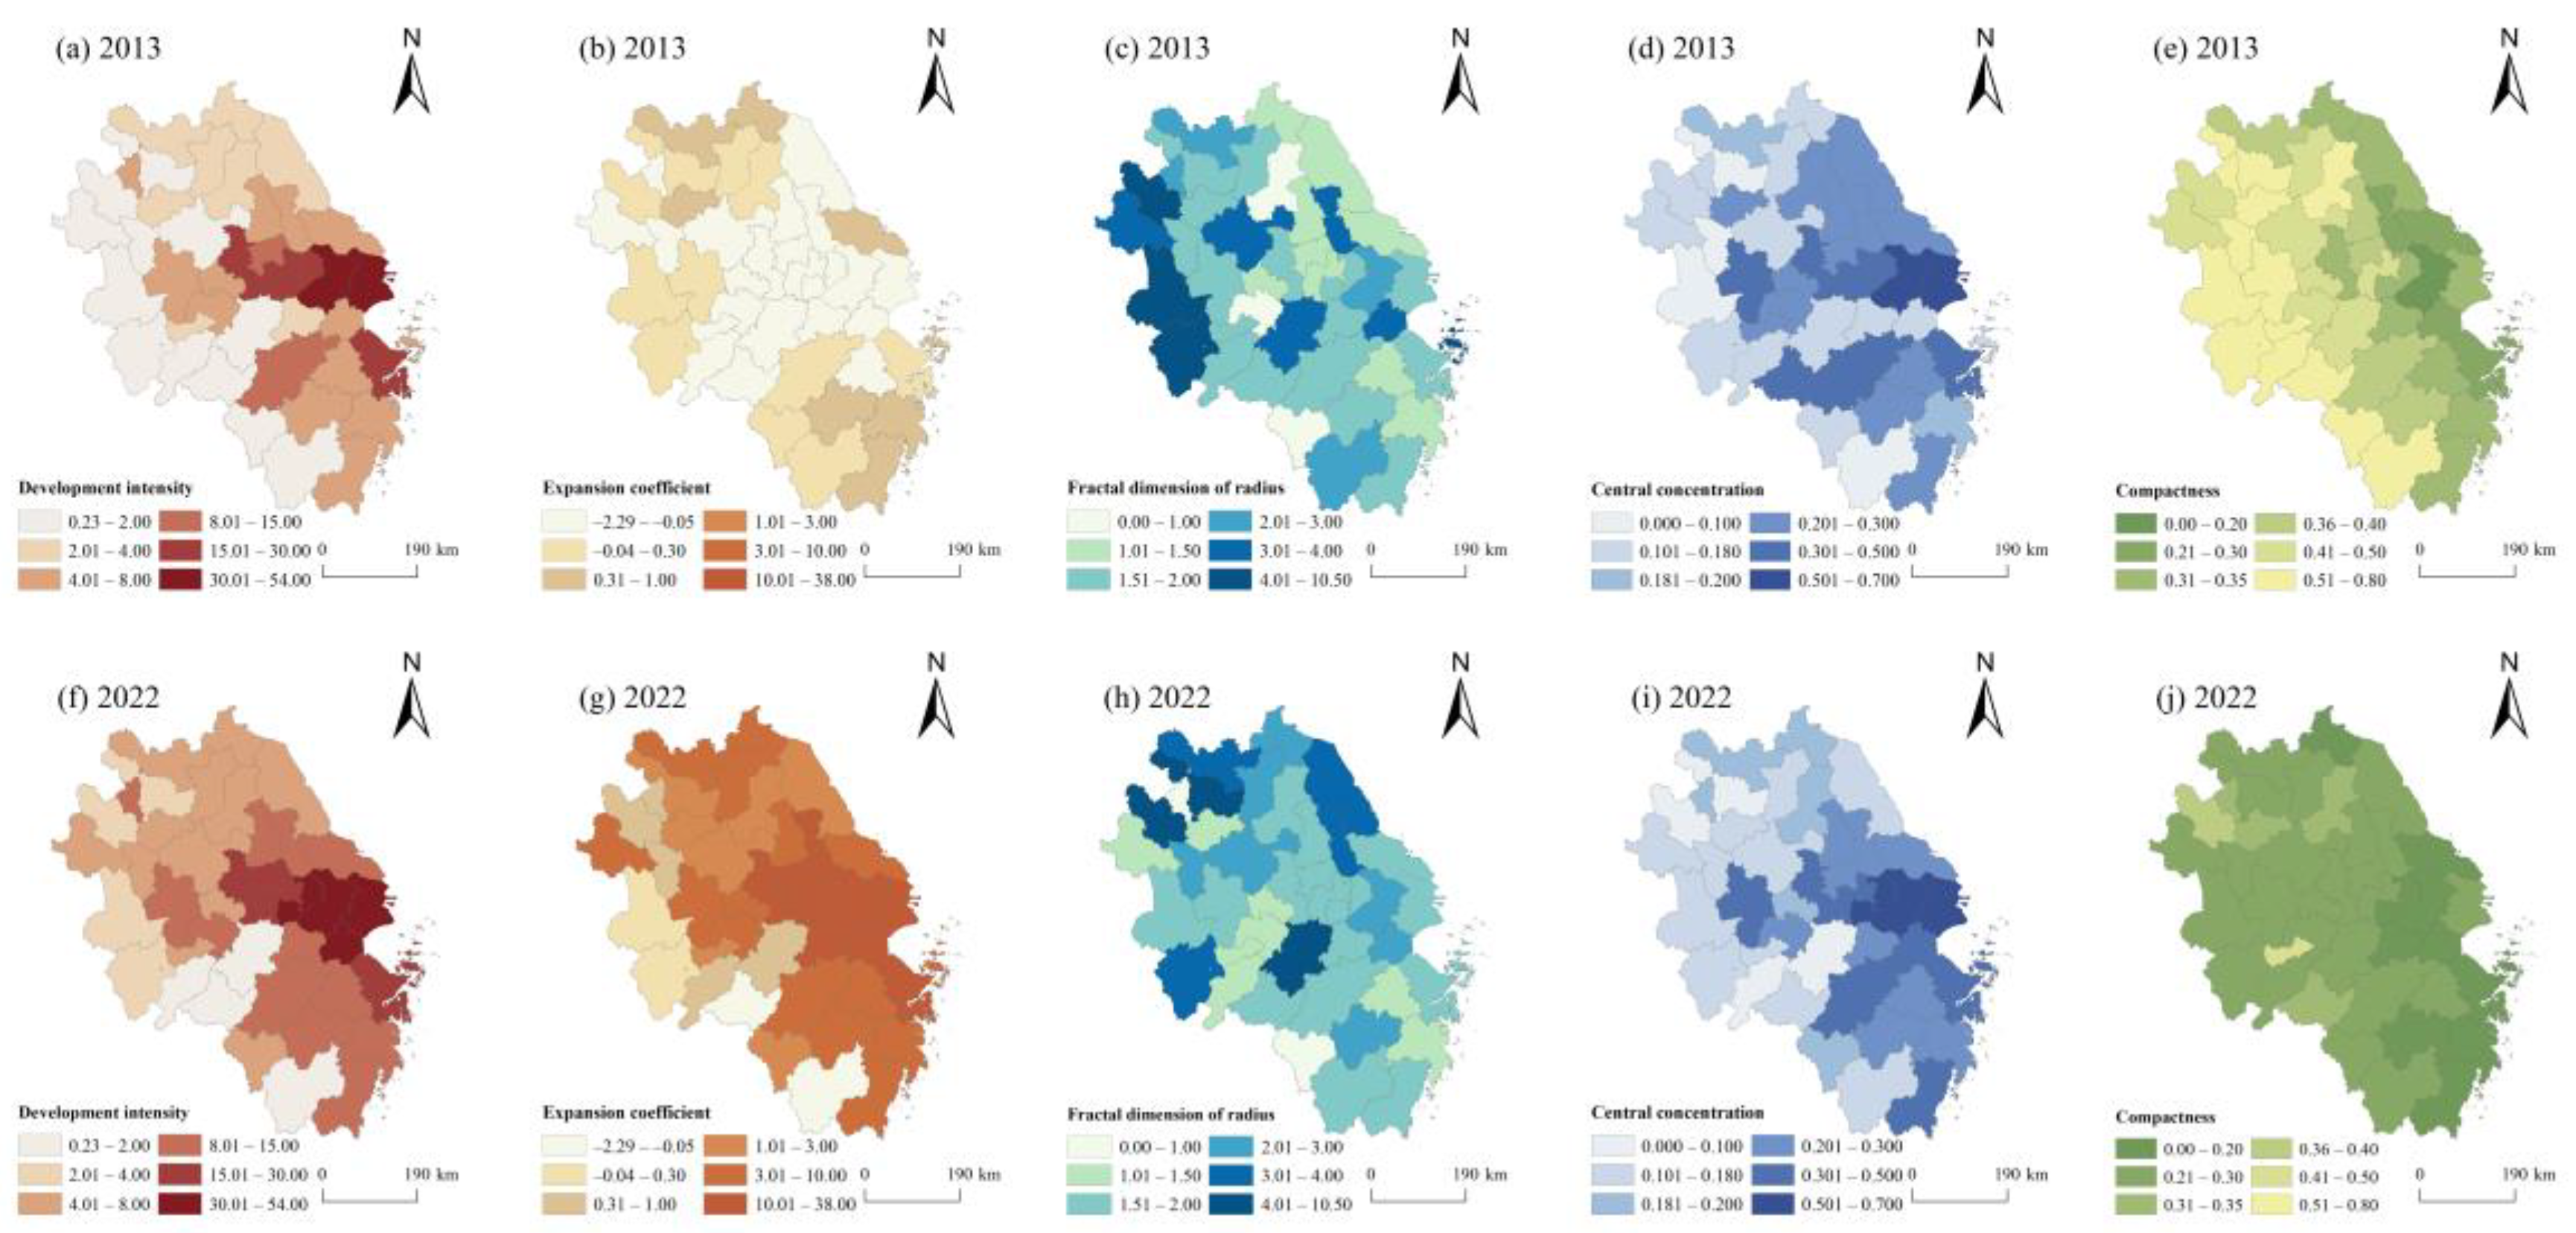
The results of
Figure 3 show that the development intensity and expansion intensity of the Beijing–Tianjin–Hebei urban agglomeration are significantly increasing, with Beijing and Tianjin consistently remaining at high levels. Shijiazhuang and Tangshan, as the strategic “two wings”, drive the development and expansion of surrounding cities to the north and south, respectively, thus forming a cluster distribution. The radial fractal dimension characterizes the degree of dispersion from the city center to the periphery. Over nine years, the radial fractal dimension of large cities has not significantly increased, whereas the dispersion functions of medium and small cities such as Xingtai, Baoding, and Qinhuangdao have gradually strengthened. The urban activities within the Beijing-Tianjin-Hebei urban agglomeration are becoming concentrated towards city centers, with a significant increase in the concentration of central activities in all cities except Zhangjiakou and Hengshui. Beijing, Tianjin, Shijiazhuang, and Tangshan are experiencing the most notable increases. As multiple dispersed built-up areas emerged, the overall compactness index of the cities gradually decreased, most prominently in peripheral cities.
The urban form structure indicators of the Yangtze River Delta urban agglomeration exhibit a spatial pattern radiating inland from Shanghai as the core (
Figure 4). The high-intensity development range extended from the initial seven cities to fifteen cities, centering on the “small Yangtze River Delta” region and spreading to northern Jiangsu, northern Anhui, and northern Zhejiang. Except for peripheral cities such as Lishui, Huangshan, Anqing, Lu’an, Bozhou, and Huainan, the Yangtze River Delta region experienced high-speed expansion with significantly increased expansion intensity. The radial fractal dimension indicates that large cities have lower values than medium- and small cities, but the overall index is increasing, indicating that the Yangtze River Delta urban agglomeration is effectively balancing macro development with micro regulation. High-value cities, in terms of central concentration, are gradually forming an agglomeration trend centering on Shanghai, with a significant siphon effect. The decrease in compactness is evident across various cities, with the southeastern region showing a more pronounced reduction than the northwestern region.
Figure 4.
Evolution characteristics of the urban form structure index in the Yangtze River Delta urban agglomeration. The results of
Figure 5 indicate that the evolution characteristics of the urban form structure in the Pearl River Delta urban agglomeration are similar to those of the aforementioned two urban agglomerations. Core cities such as Shenzhen, Dongguan, Guangzhou, Foshan, and Zhongshan exhibit significantly higher development and expansion intensities than other cities, with clear agglomeration characteristics within the urban agglomeration. The urban activity intensity and central concentration in cities such as Zhaoqing, Jiangmen, and Huizhou are relatively weak, and they have not fully integrated into the core cities of the Pearl River Delta. However, their dispersion functions are strong, serving as important nodes for the extension of the Pearl River Delta to northern, western, and eastern Guangdong, with considerable future development potential. In summary, China’s three major urban agglomerations exhibit a distinct core–periphery structure. Core cities have high development and expansion intensities, with a high concentration of central activities exerting a radiation effect on surrounding cities, clearly demonstrating siphon effects and agglomeration trends. Multiple centers in medium and small cities are emerging in a dispersed manner, and their effective dispersion functions provide ample space for accelerating urban development and regional integration.
![Sustainability 17 03984 g004]()
Figure 5.
Evolution characteristics of the urban form structure index in the Pearl River Delta urban agglomeration.
Figure 5.
Evolution characteristics of the urban form structure index in the Pearl River Delta urban agglomeration.
5.2. Impact of the Urban Form Structure on Carbon Emission Efficiency
5.2.1. Univariate Detection
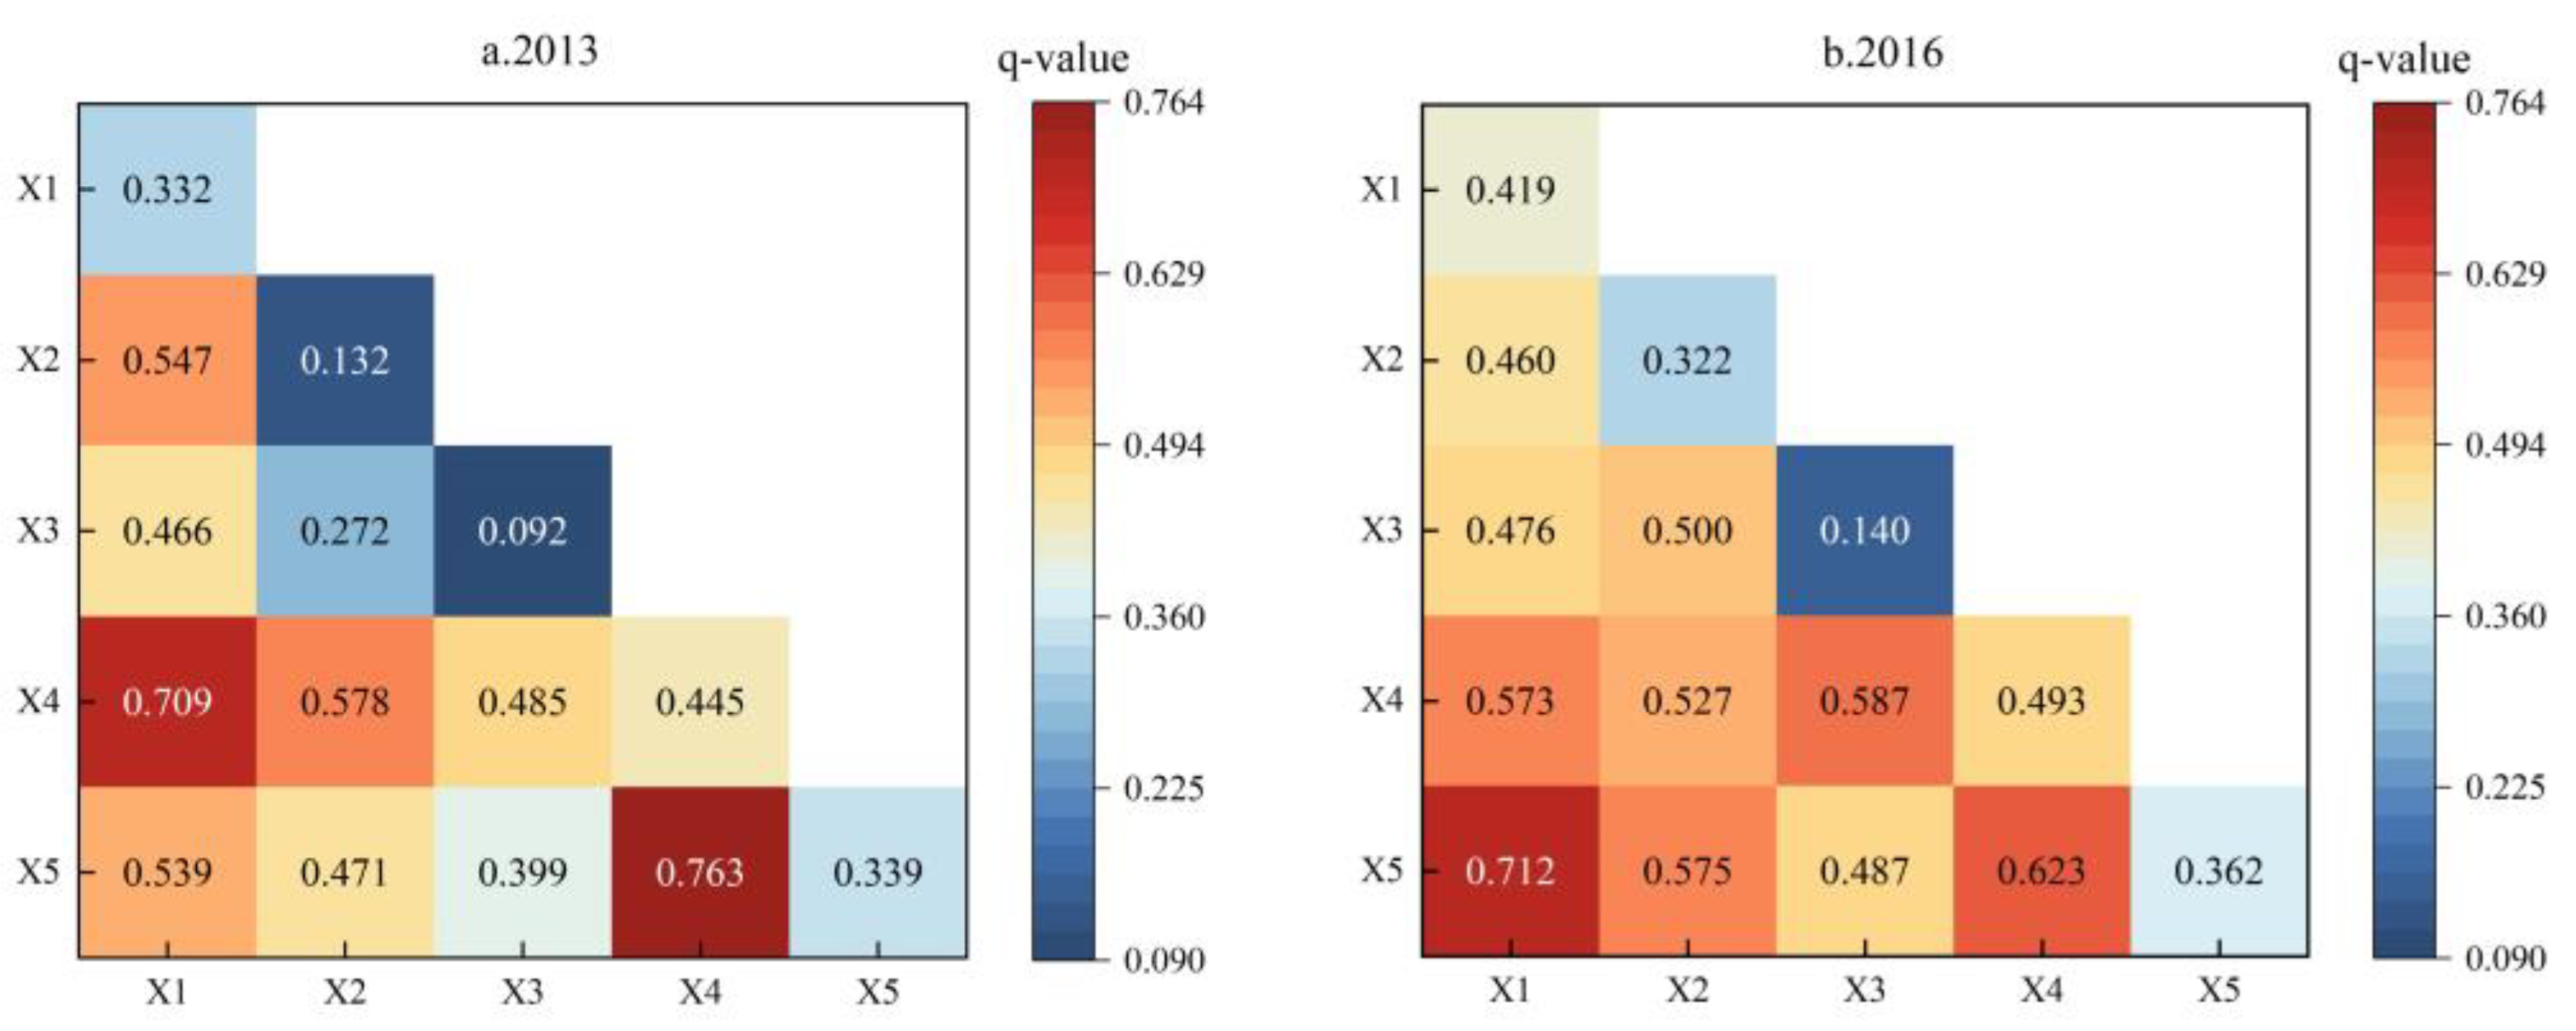
The results of the univariate analysis via Geodetector (
Table 4) indicate that, except for the expansion intensity in 2013, which does not pass the significance test, the development intensity (
X1), expansion intensity (
X2), compactness (
X3), central concentration (
X4), and radial fractal dimension (
X5) all pass the significance test. The urban form structure continuously affects carbon emission efficiency, with the average explanatory power in descending order being
X4 >
X1 >
X5 >
X2 >
X3. Central concentration (
X4) has the greatest impact, suggesting that urban economic activities remain the primary influencing factor on urban carbon emission efficiency. Development intensity (
X1) and expansion intensity (
X2) pertain to the spatial boundaries of macrolevel urban development. The efficiency of resource and energy use in urban development and expansion activities affects building carbon emissions. The detection results show that ordinary urban boundary expansion has a limited impact on carbon emission efficiency, whereas the development process, which involves more human activities, has a greater influence. The radial fractal dimension (
X5) represents the dispersion of urban activities. The appropriate dispersion of urban functions helps avoid diseconomies of agglomeration, actively promoting low-carbon urban development. Compactness (
X3) has the least impact on carbon emission efficiency. On the one hand, compact cities can form an efficient transportation structure and improve commuting efficiency; on the other hand, excessive compactness can lead to congestion effects and thus hinder effective land use adjustments.
5.2.2. Interaction Detection
The results of the multi-indicator interaction detection of the urban form structure (
Figure 6) reveal that all dual-factor interaction detection outcomes exhibit either nonlinear enhancement or dual-factor enhancement, with no instances of nonlinear weakening or independence. This finding indicates that the impact of dual-factor interactions is greater than the independent effect of single factors, suggesting that the influence of the urban form structure on carbon emission efficiency results from the combined action of multiple dimensions. The interactions between
X1∩
X4,
X1∩
X5,
X2∩
X4,
X3∩
X4,
X3∩
X5, and
X4∩
X5 are particularly strong. These findings demonstrate that, during urban development and expansion, simultaneously focusing on the expansion of external boundaries and the optimization of internal spaces can maximize carbon emission efficiency. Balancing concentration and dispersion functions within urban activities is crucial for leveraging the positive externalities of agglomeration to enhance production efficiency, thereby validating Hypothesis 1.
5.3. Mediating Effect of the Urban Form Structure on Carbon Emission Efficiency
Following the Hausman test, a fixed effects model was introduced for benchmark regression analysis and mediation effect analysis. The results of the benchmark regression are presented in
Table 5. The impact coefficient for development intensity is 1.996 and passes the significance test at the 5% level, indicating that appropriate development intensity can efficiently utilize resources and improve carbon emission efficiency. The impact of expansion intensity on carbon emission efficiency is significantly negative, suggesting that ordinary spatial expansion does not positively affect carbon emission efficiency. If blind expansion leads to inefficient land use, carbon emission efficiency is reduced. The impact coefficient for the radial fractal dimension is 0.458, which passes the significance test at the 1% level. Effective dispersion functions can not only avoid congestion effects but also reserve space for subsequent industrial layout adjustments, thereby promoting efficient urban operations. The impact of central concentration is significantly positive at the 5% level, indicating that the concentration of urban activities can leverage agglomeration effects to increase production efficiency. The impact coefficient for compactness on carbon emission efficiency is 0.105 and passes the significance test. Compact cities can achieve efficient resource utilization through reduced losses in energy transmission and decreased travel distances, thereby promoting carbon emission reduction.
The results of the economic agglomeration effects test on the impact of various urban form structure indicators on carbon emission efficiency are presented in
Table 6. Column (1) shows the impact of each urban form structure indicator on economic agglomeration, while columns (2) to (6) present the empirical results after the economic agglomeration level is incorporated into the benchmark regression model. The results in column (2) indicate that, after accounting for the economic agglomeration effect, the impact of development intensity on carbon emission efficiency is significantly positive at the 1% level, whereas the economic agglomeration effect is significantly negative. The direct and indirect effects have opposite signs, suggesting that economic agglomeration exerts a masking effect on the impact of development intensity on carbon emission efficiency. During urban development, unplanned and disordered development leads to inefficient land use, and the lack of effective coordination between development zones results in diseconomies of agglomeration. The impact of expansion intensity on economic agglomeration is significantly positive at the 1% level. When the mediating variable is added to the regression model, the impact of economic agglomeration on carbon emission efficiency is significantly positive, whereas the impact of expansion intensity becomes insignificant. Here, economic agglomeration has a full mediating effect, indicating that the influence of expansion intensity on carbon emission efficiency can be transmitted only through economic agglomeration.
The impact of the radial fractal dimension on carbon emission efficiency remains significantly positive when the economic agglomeration variable is included, and the impact of economic agglomeration on carbon emission efficiency is significantly positive at the 1% level. This finding indicates that the mediating variable exerts a positive partial mediation effect, with effective dispersion functions providing a buffer space to avoid diseconomies of agglomeration. It alleviates the congestion pressure in the central urban area. The existence of the peripheral industrial land space improves the operational efficiency of the road network, avoids the environmental cost constraints of the congestion effect, and provides a spatial foundation for building a circular economy mechanism of industrial collaboration.
The coefficient of the impact of central concentration on carbon emission efficiency becomes insignificant when the economic agglomeration variable is included, whereas the coefficient of the mediating variable is significantly positive. This suggests that economic agglomeration exerts a full mediating effect on this process. The concentration of urban activities enhances the interconnectivity between industries, accelerates industrial agglomeration and integration, and fully leverages the positive externalities of agglomeration. The concentration of urban activities can save the cost of factor flow, accelerate the diffusion and flow of green and low-carbon technologies, and further accelerate knowledge spillover. At the same time, by sharing infrastructure over shorter distances, production and transaction costs can be reduced, path dependence and technology lock-in can be removed, and the technology diffusion effect and intermediate product sharing effect can be leveraged to lower the energy intensity per unit of output and enhance carbon emission efficiency.
The results in column (6) show that the impact coefficient of compactness on carbon emission efficiency is 0.211 and passes the significance test when the mediating variable is included, while the impact of economic agglomeration on carbon emission efficiency is also significantly positive. This finding indicates that economic agglomeration exerts a positive partial mediation effect on the process of compactness, thus driving improvements in carbon emission efficiency. The compact urban form provides a foundation for reducing spatial distance barriers and enhancing the degree of geographical agglomeration. Compact urban layout and industrial activities are conducive to shortening the spatial distance between enterprises, accelerating the dissemination of tacit knowledge, and promoting the formation of functional mixed zones, providing a spatial basis for cross-industry knowledge reorganization and exerting the scale effect of infrastructure concentration. The urban form and structure optimize the spatial organization of economic activities, give full play to the positive externalities of economic agglomeration, avoid negative externalities offsetting the benefits of emission reduction, reduce costs and increase efficiency, and systematically improve the efficiency of carbon emissions. Thus, Hypothesis 2 is validated.
6. Discussion
The urban form structure, as the spatial foundation of urban economic activities, is a crucial factor influencing the efficiency of production activities and carbon emissions. The two major evolutionary processes of land resource development and urban spatial layout significantly affect urban carbon emissions at the macro level [
49].
First, the interaction of urban form structure has a stronger impact on carbon emission efficiency. In this study, an index set of urban form structures was constructed based on land resource development and urban spatial layout, and the impact of their interaction on carbon emission efficiency was analyzed by using geographic detectors. It is found that the interaction between the two indicators has a stronger explanatory power on carbon emission efficiency, indicating that the coordination of the relationship between urban development and urban layout, as well as the rational optimization of urban space allocation in multiple dimensions, can give consideration to economic efficiency and energy utilization efficiency to a greater extent, and thus affect carbon emission efficiency.
Second, urban form structure affects carbon emission efficiency by influencing the economic agglomeration effect. Urban spatial form, as the spatial base of urban economic activities, profoundly affects the agglomeration degree and distribution pattern of various economic activities. This study believes that under the construction of a compact city, the economic activities are concentrated in an orderly manner, the peripheral dispersion function is stable, the agglomeration effect of economic activities can be fully exerted, and the agglomeration diseconomy phenomenon can be effectively avoided. This corresponds to the research conclusion of Huang et al. [
50]. Excessive agglomeration and excessive expansion will accelerate carbon emissions. Therefore, when optimizing urban form, taking into account the agglomeration of core regional activities and the dispersion of external space, effectively pulling the spatial distance of economic activities and avoiding the crowding effect can give full play to the positive externalities of economic agglomeration, reduce costs and increase efficiency, alleviate environmental pressure, and further improve carbon emission efficiency. There are some similarities with Li et al.’s [
51] view that a compact but multi-centered urban form structure should be adopted to achieve the emission reduction target. Meanwhile, this study holds that a multi-centered structure can be applied at the scale of urban agglomerations. Multi-core urban agglomerations can disperse the dispersion function to surrounding cities by giving full play to the spillover effect of the core city. It can more effectively promote the integrated development and coordinated emission reduction of urban agglomerations.
Third, the existing research deficiencies and prospects. Due to insufficient data acquisition and limited research time, there are some limitations in this paper. The use of night light data to extract urban built-up areas may overestimate the impact of some abnormal high-light values. In the future, multi-source data will be used to enrich the extraction methods of urban built-up areas. The index system needs to be further improved to include more indicators related to urban functions and three-dimensional indicators. In addition, we can explore the influence path of multiple carbon emission efficiency and carry out multi-scale and multi-level urban heterogeneity analysis.
7. Conclusions and Policy Implications
This study analyzed the spatiotemporal evolution characteristics of the urban form structure and the impact of single-factor and multi-factor interactions on carbon emission efficiency. From an economic activities perspective, it explored the pathways through which the urban form structure influences carbon emission efficiency. This study reached the following conclusions:
(1) The built-up areas of the three major urban agglomerations in China collectively exhibit the characteristic of “core cities expanding outwards, with dispersed emergence of surrounding cities”. The Beijing-Tianjin-Hebei urban agglomeration is centered on Beijing and Tianjin and extends in a northeast-southwest direction; the Yangtze River Delta urban agglomeration is centered on Shanghai and radiates from the coast inland; the Pearl River Delta urban agglomeration forms a clustered distribution at the mouth of the Pearl River. From the perspective of various dimensional indicators, core cities exhibit higher development intensity and expansion intensity, with a higher concentration of central activities and more vigorous economic activities. In contrast, small and medium-sized cities emerge in a dispersed, multicentered manner, demonstrating good urban dispersion functions and development space.
(2) Each urban form structure indicator has varying degrees of impact on carbon emission efficiency, with dual-factor interactions having a greater influence. This finding indicates that during urban development and construction, the coordinated expansion of external boundaries and the optimization of internal spatial adjustments can jointly affect carbon emission efficiency. The spatial layout process within cities that balances agglomeration and dispersion can enhance the operational efficiency of economic activities, promote industrial optimization and transfer, facilitate the balanced distribution of public facilities, and achieve a balance between jobs and housing.
(3) Economic agglomeration factors play a mediating role in the process by which the urban form structure influences carbon emission efficiency. The optimization of the urban form structure can directly enhance carbon emission efficiency and indirectly improve it by influencing the agglomeration effects within a region, thereby achieving low-carbon development. Specifically, the effects of economic agglomeration can manifest as a masking effect during the development process, a positive complete mediation effect in terms of expansion intensity and central concentration, and a positive partial mediation effect in terms of the radial fractal dimension and compactness.
In terms of theoretical contribution, by establishing a low-carbon economic analysis framework of ‘urban form structure—economic agglomeration transmission—carbon efficiency improvement’, the spatial interaction mechanism between urban form and carbon emissions is analyzed, further expanding the theoretical system of urban economics. In terms of practical significance, it enriches the spatial governance paths for enhancing carbon emission efficiency from the perspective of morphological structure, providing reference and inspiration for promoting the coordinated development and refined governance of urban agglomerations, as well as the coupled optimization of urban form structure and industrial space.
On the basis of the above research findings, targeted policy recommendations are proposed:
(1) Enhance urban macroplanning capabilities and microallocation efficiency. Disorderly urban expansion should be avoided. In the process of coordinated development and expansion, attention should be paid to building urban dispersion function and reserving appropriate buffer zones to enhance the concentration of central activities and give play to the positive externality of agglomeration and development space for the construction of new industrial parks and the renovation of traditional parks should be preserved. The relationship between industrial agglomeration and dispersion within cities should be coordinated to avoid diseconomies of agglomeration caused by congestion effects.
(2) Focus on regional spatial diversification and urban spatial specialization. Multinodal, networked urban spaces should be created to accelerate the spatial spillover of knowledge elements within the city. The relationship between industrial agglomeration and dispersion within cities should be coordinated to avoid diseconomies of agglomeration caused by congestion effects, thereby reducing energy and industrial carbon emissions and improving carbon emission efficiency from input–output perspective.
(3) Based on the differentiated characteristics of China’s three major urban agglomerations, targeted low-carbon spatial governance paths should be proposed. The Beijing–Tianjin–Hebei urban agglomeration has a distinct dual-core agglomeration feature. Beijing and Tianjin have a high proportion of service industries, while Hebei has a high proportion of heavy industry. Attention should be paid to the role of non-capital functions in the surrounding areas and the spillover effect of the growth poles of Beijing and Tianjin. The transformation of traditional industries should be accelerated, and a low-carbon industrial corridor should be built. As a global manufacturing center, the Yangtze River Delta urban agglomeration is a typical multi-center, high-density continuous area with obvious characteristics of fan-shaped radiation and westward divergence. Further attention should be paid to the sharing of infrastructure across administrative regions, the collaboration of green technological innovation, and the symbiosis of cross-domain industrial networks. The Pearl River Delta urban agglomeration presents a multi-polar competitive pattern, with a high intensity of land development and an export-oriented economy as the dominant force. It is necessary to promote the digital governance of spatial planning further, popularize the “vertical factory model”, increase the floor area ratio of industrial buildings, and at the same time, establish a cross-border low-carbon factor flow mechanism to promote regionally coordinated emission reduction.


