Article

Analysis of Local Settlements Due to Operational EPB Tunneling Driving Parameters: A Case Study of the Barcelona Metro Line 9 Tunnel

1
Department of Mining Engineering, Industrial and TIC, Polytechnic University of Catalonia (UPC), 08242 Manresa, Spain
2
Department of Civil and Environmental Engineering, Polytechnic University of Catalonia (UPC), 08034 Barcelona, Spain
*
Author to whom correspondence should be addressed.
Sustainability 2025, 17(9), 3966; https://doi.org/10.3390/su17093966
Submission received: 9 February 2025 / Revised: 30 March 2025 / Accepted: 8 April 2025 / Published: 28 April 2025

Abstract

Line 9 of the Barcelona Metro crosses beneath the Llobregat and Besòs Rivers, requiring tunneling through soft deltaic deposits of Holocene age. The excavation was carried out using Earth Pressure Balance (EPB) Tunnel Boring Machines (TBMs), a method commonly employed in urban environments to control ground movements and minimize settlements. This study analyzes the ground response to EPB tunneling, focusing on key factors such as TBM operational parameters (face pressure, shield pressure, etc.), grouting techniques, and the influence of shaft entry/exit points, hyperbaric stops, tool wear, and the learning curve. Additionally, secondary influences, including variations in cover depth and the presence of lightly compacted made ground, were found to exacerbate ground movements. Field data collected from Section 1 of Line 9 provide a detailed assessment of settlement patterns and ground behavior. Results indicate that, while EPB TBMs generally maintain ground stability with minimal settlement (with average volume losses below 0.5%), certain site-specific challenges, such as inconsistent grouting and shaft transitions, led to localized volume losses and settlement. This paper contributes to refining predictive models of ground–structure interaction in soft ground tunneling, offering insights to optimize future EPB operations in similar geological conditions, ensuring more effective control over ground movements and settlement mitigation.

1. Introduction

Tunnel excavation in urban areas or soft ground below the phreatic level presents significant engineering challenges, particularly concerning ground movement control. Earth Pressure Balance (EPB) Tunnel Boring Machines (TBMs) are widely employed in such conditions due to their ability to minimize ground disturbances through controlled face pressure management and backfilling techniques, reducing settlement risks and ensuring structural stability [1,2,3,4]. However, settlement control remains a complex issue, particularly in geologically sensitive environments such as deltaic deposits, where hydrogeological interactions and soil heterogeneity pose additional risks.
Barcelona Metro Line 9 crosses deltaic ground below the water table, within a stratigraphic setting consisting of two aquifers. The tunnel alignment intersects the upper aquifer, while the deeper aquifer, a critical water supply source for the city, remains beneath the excavation. Ensuring the integrity of this lower aquifer was a key design constraint, significantly influencing construction methodologies and control measures. Additionally, the EPB machines deployed in this project incorporated an innovative feature: bentonite injection around the shield to compensate for overcutting and enhance face stability. This injection technique, previously untested in deltaic environments, represents a novel aspect of this study.
Previous studies on EPB tunneling have extensively analyzed settlement mechanisms in urban environments, particularly in granular soils and soft clays [5,6,7,8,9,10,11]. These studies highlight key factors influencing settlement, such as variations in face pressure, over-excavation, and grouting control. However, detailed investigations on deltaic ground, where groundwater conditions and heterogeneous stratigraphy introduce additional challenges, remain scarce. Research in similar settings [12,13] has primarily focused on short tunnel sections, providing limited insights into long-distance TBM performance. Moreover, the impact of hyperbaric interventions and novel stabilization techniques, such as bentonite injection around the shield, has not been systematically documented for deltaic deposits. This study aims to fill this gap by analyzing extensive TBM operational data over 12.5 km, refining settlement predictive models, and assessing the effectiveness of ground control measures in these complex geological conditions.
A significant contribution of this research lies in the extensive dataset collected over a 12.5 km tunnel stretch, providing a rare opportunity to analyze the correlation between TBM operational parameters and ground response in deltaic deposits. This study builds upon previous research [4,14,15,16] by conducting a detailed assessment of volume loss mechanisms and settlement distributions under variable TBM driving conditions, hyperbaric interventions, and site-specific geological transitions [12,13]. Moreover, it provides a back-analysis of significant settlement events, identifying critical factors contributing to deviations from expected behavior.
The key research objectives include the following:
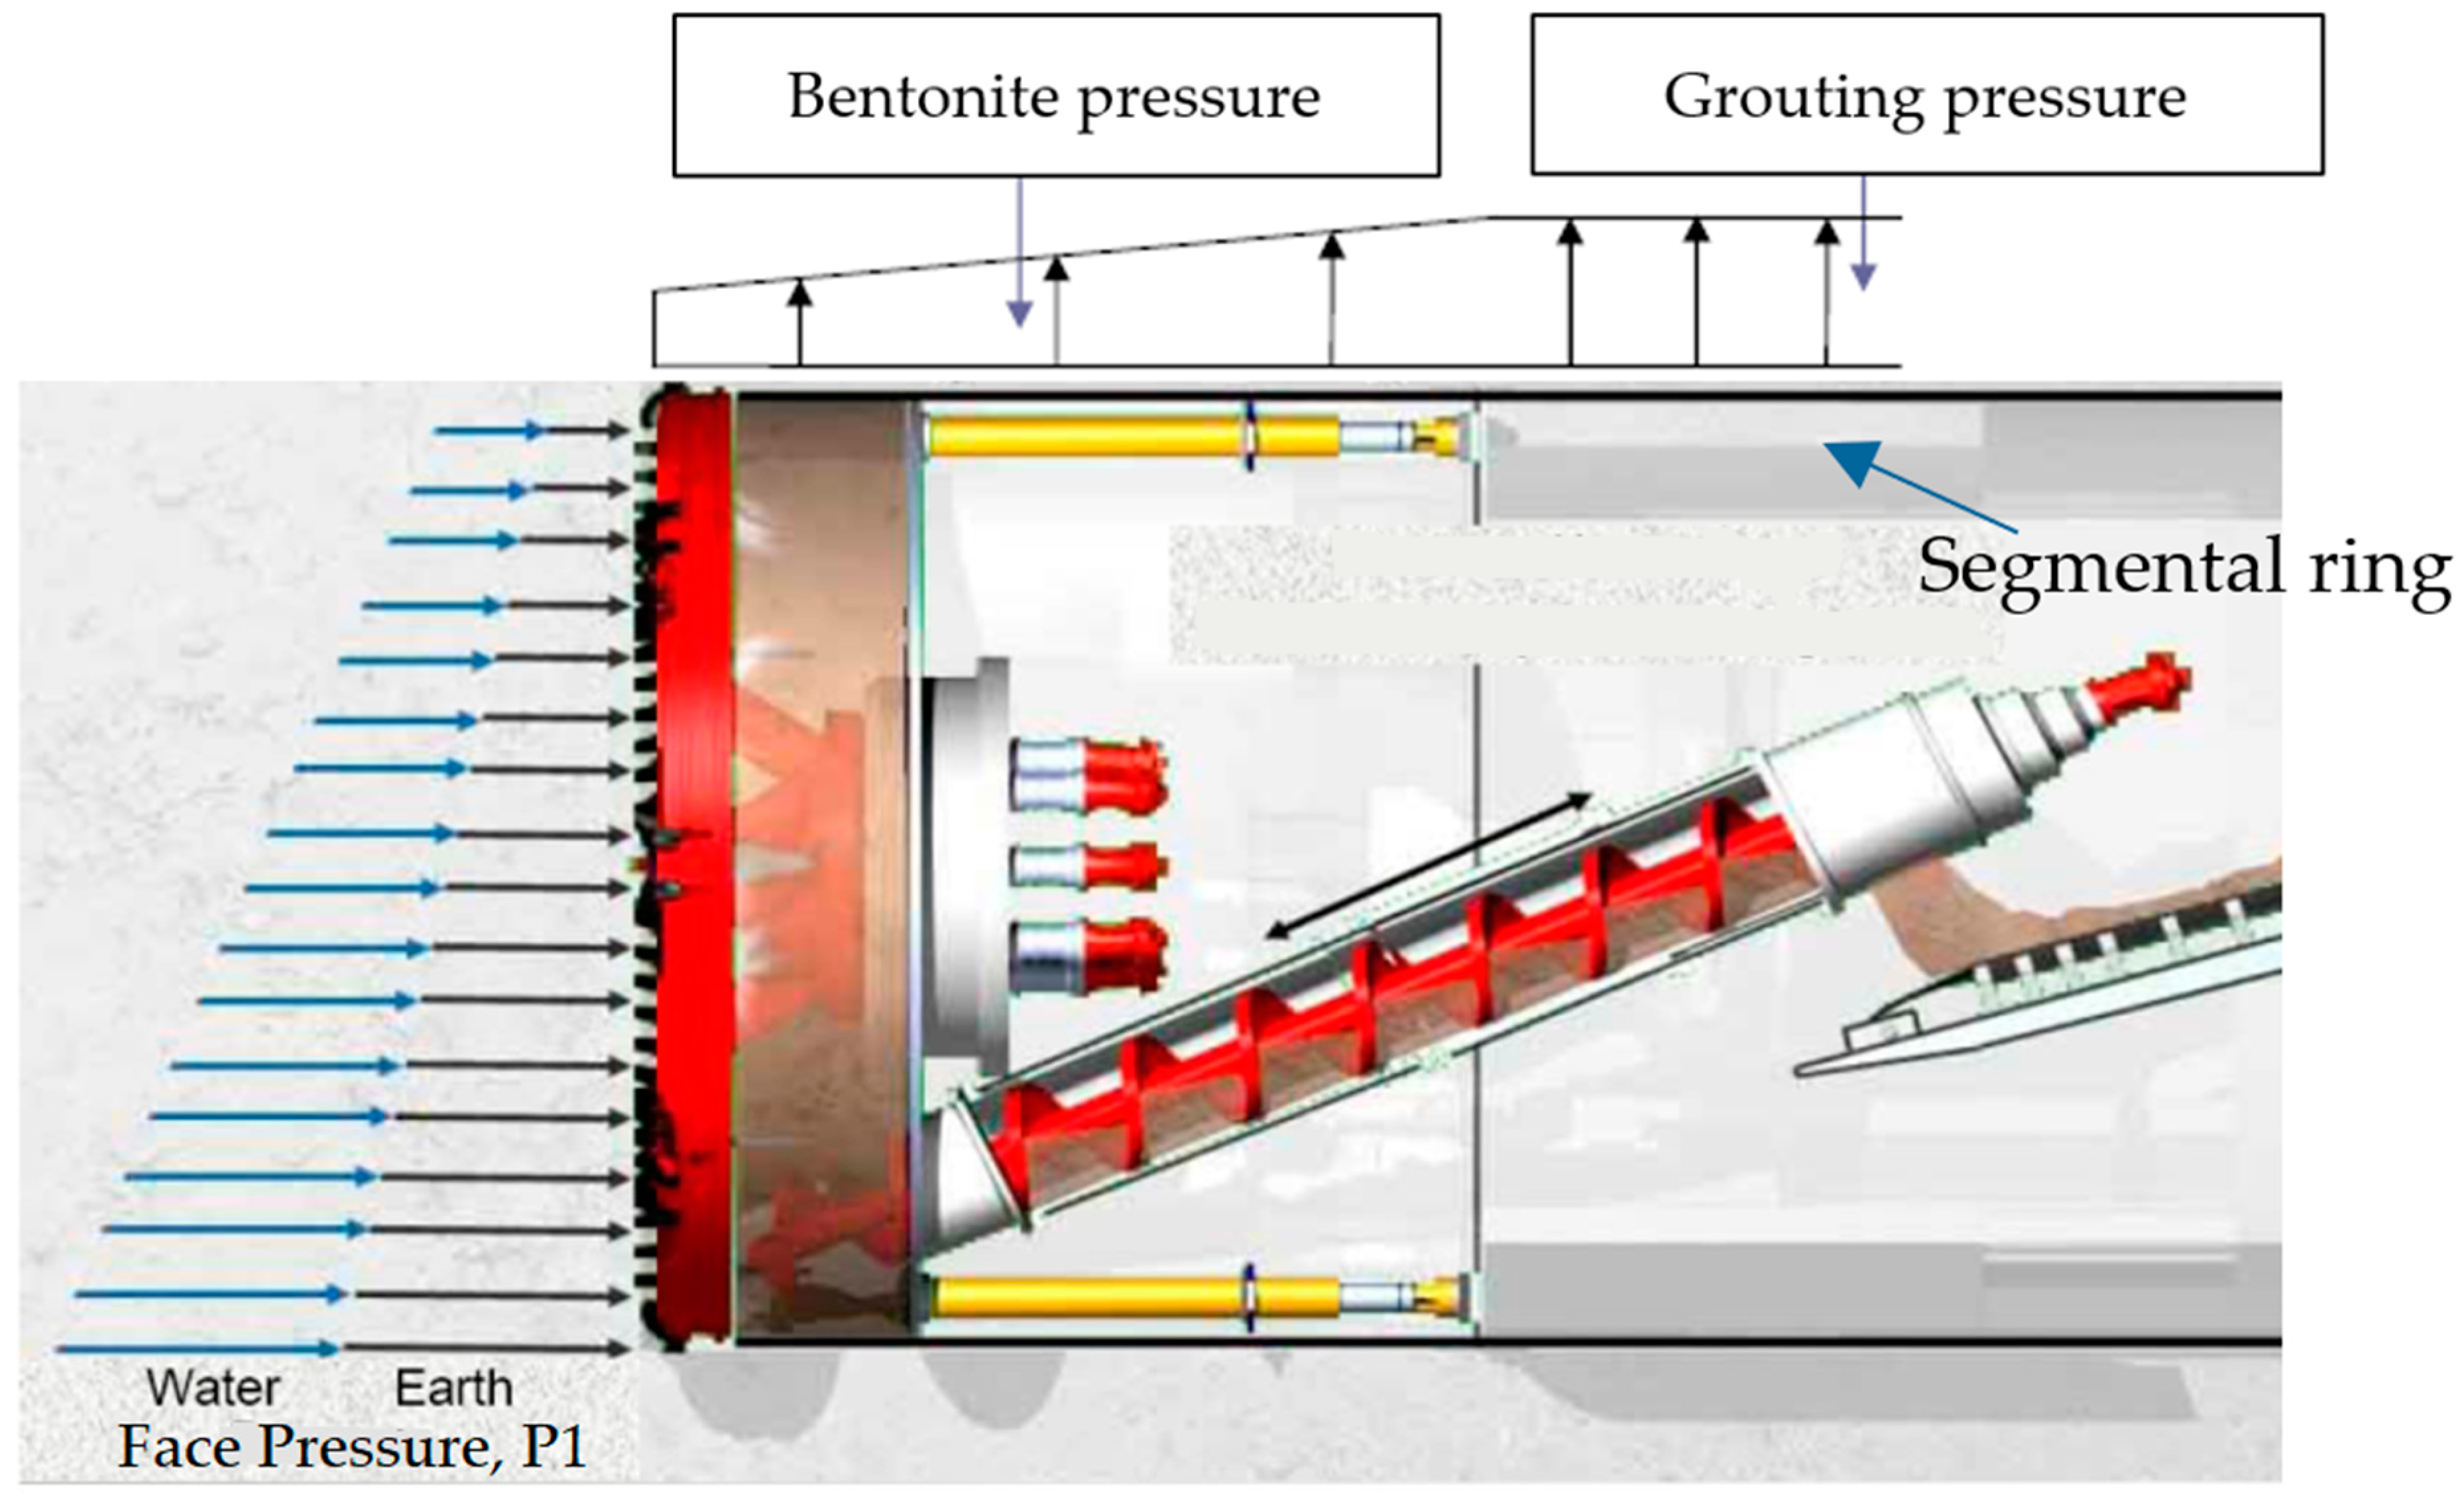
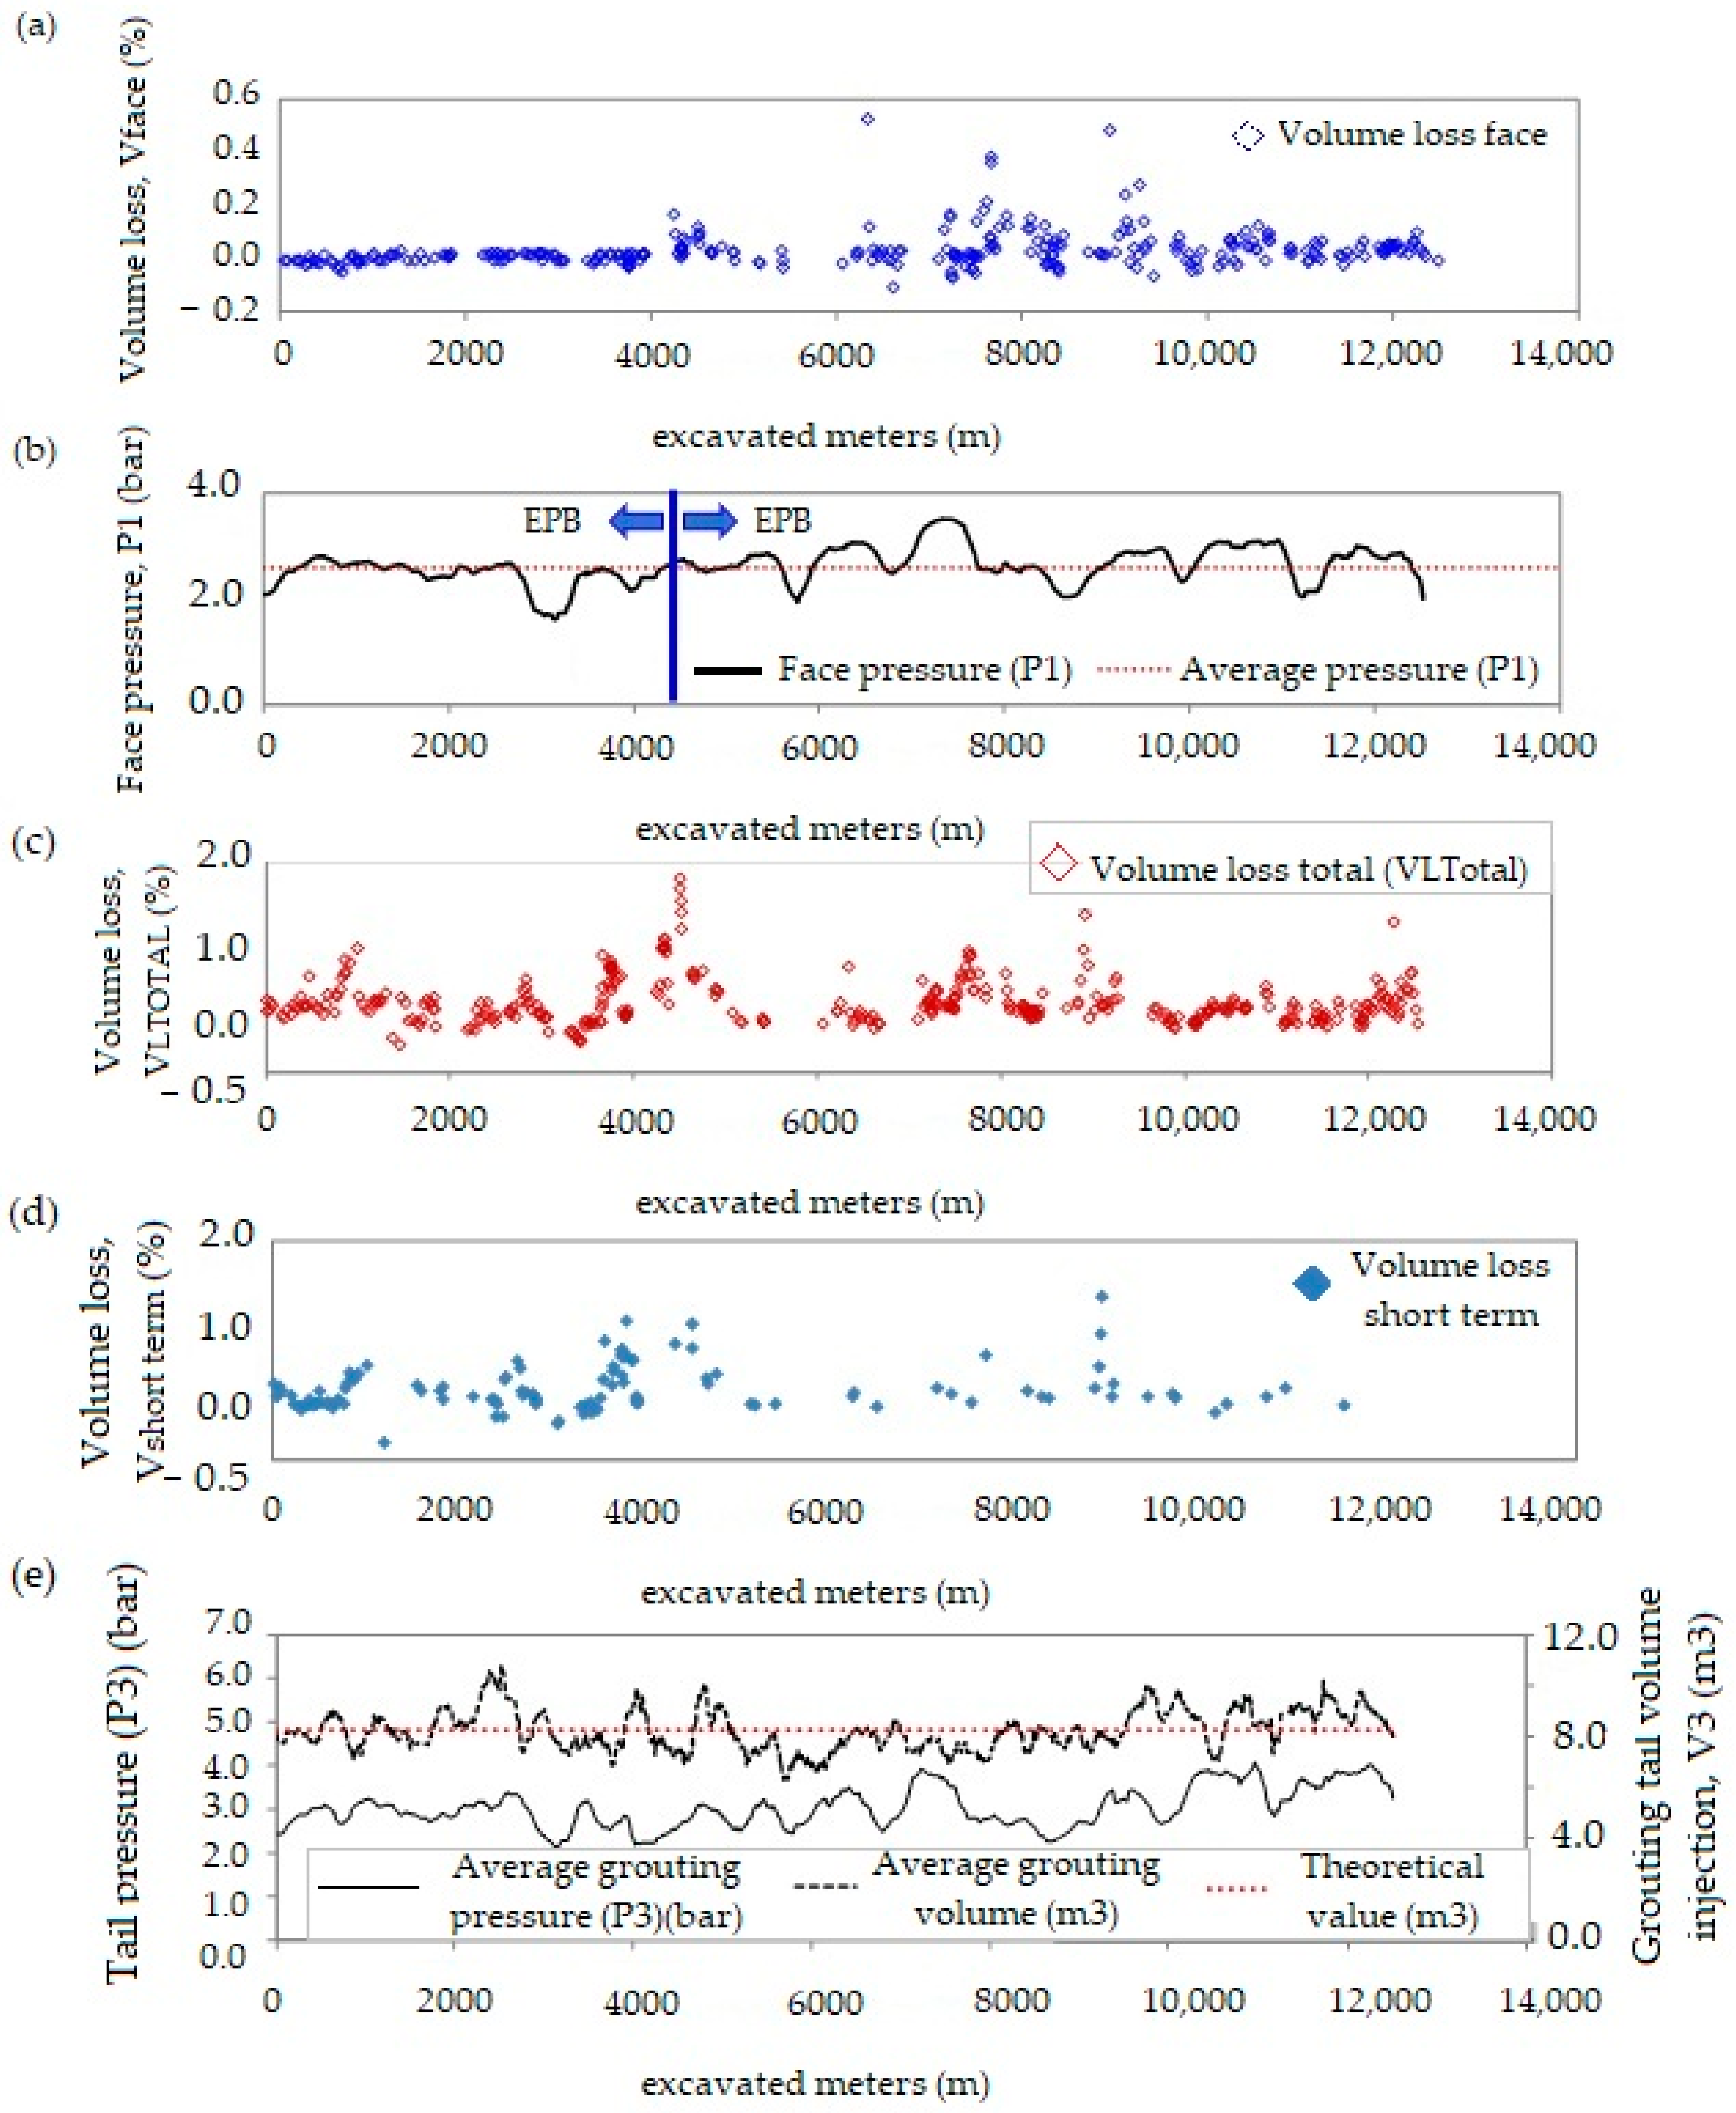
  • Assessing the impact of TBM pressures, including face pressure (P1), shield pressure (P2), and shield tail pressure (P3), on settlement magnitudes.
  • Evaluating the influence of grouting volumes injected into the shield (Vshield) and segment tails (Vtail) on settlement mitigation.
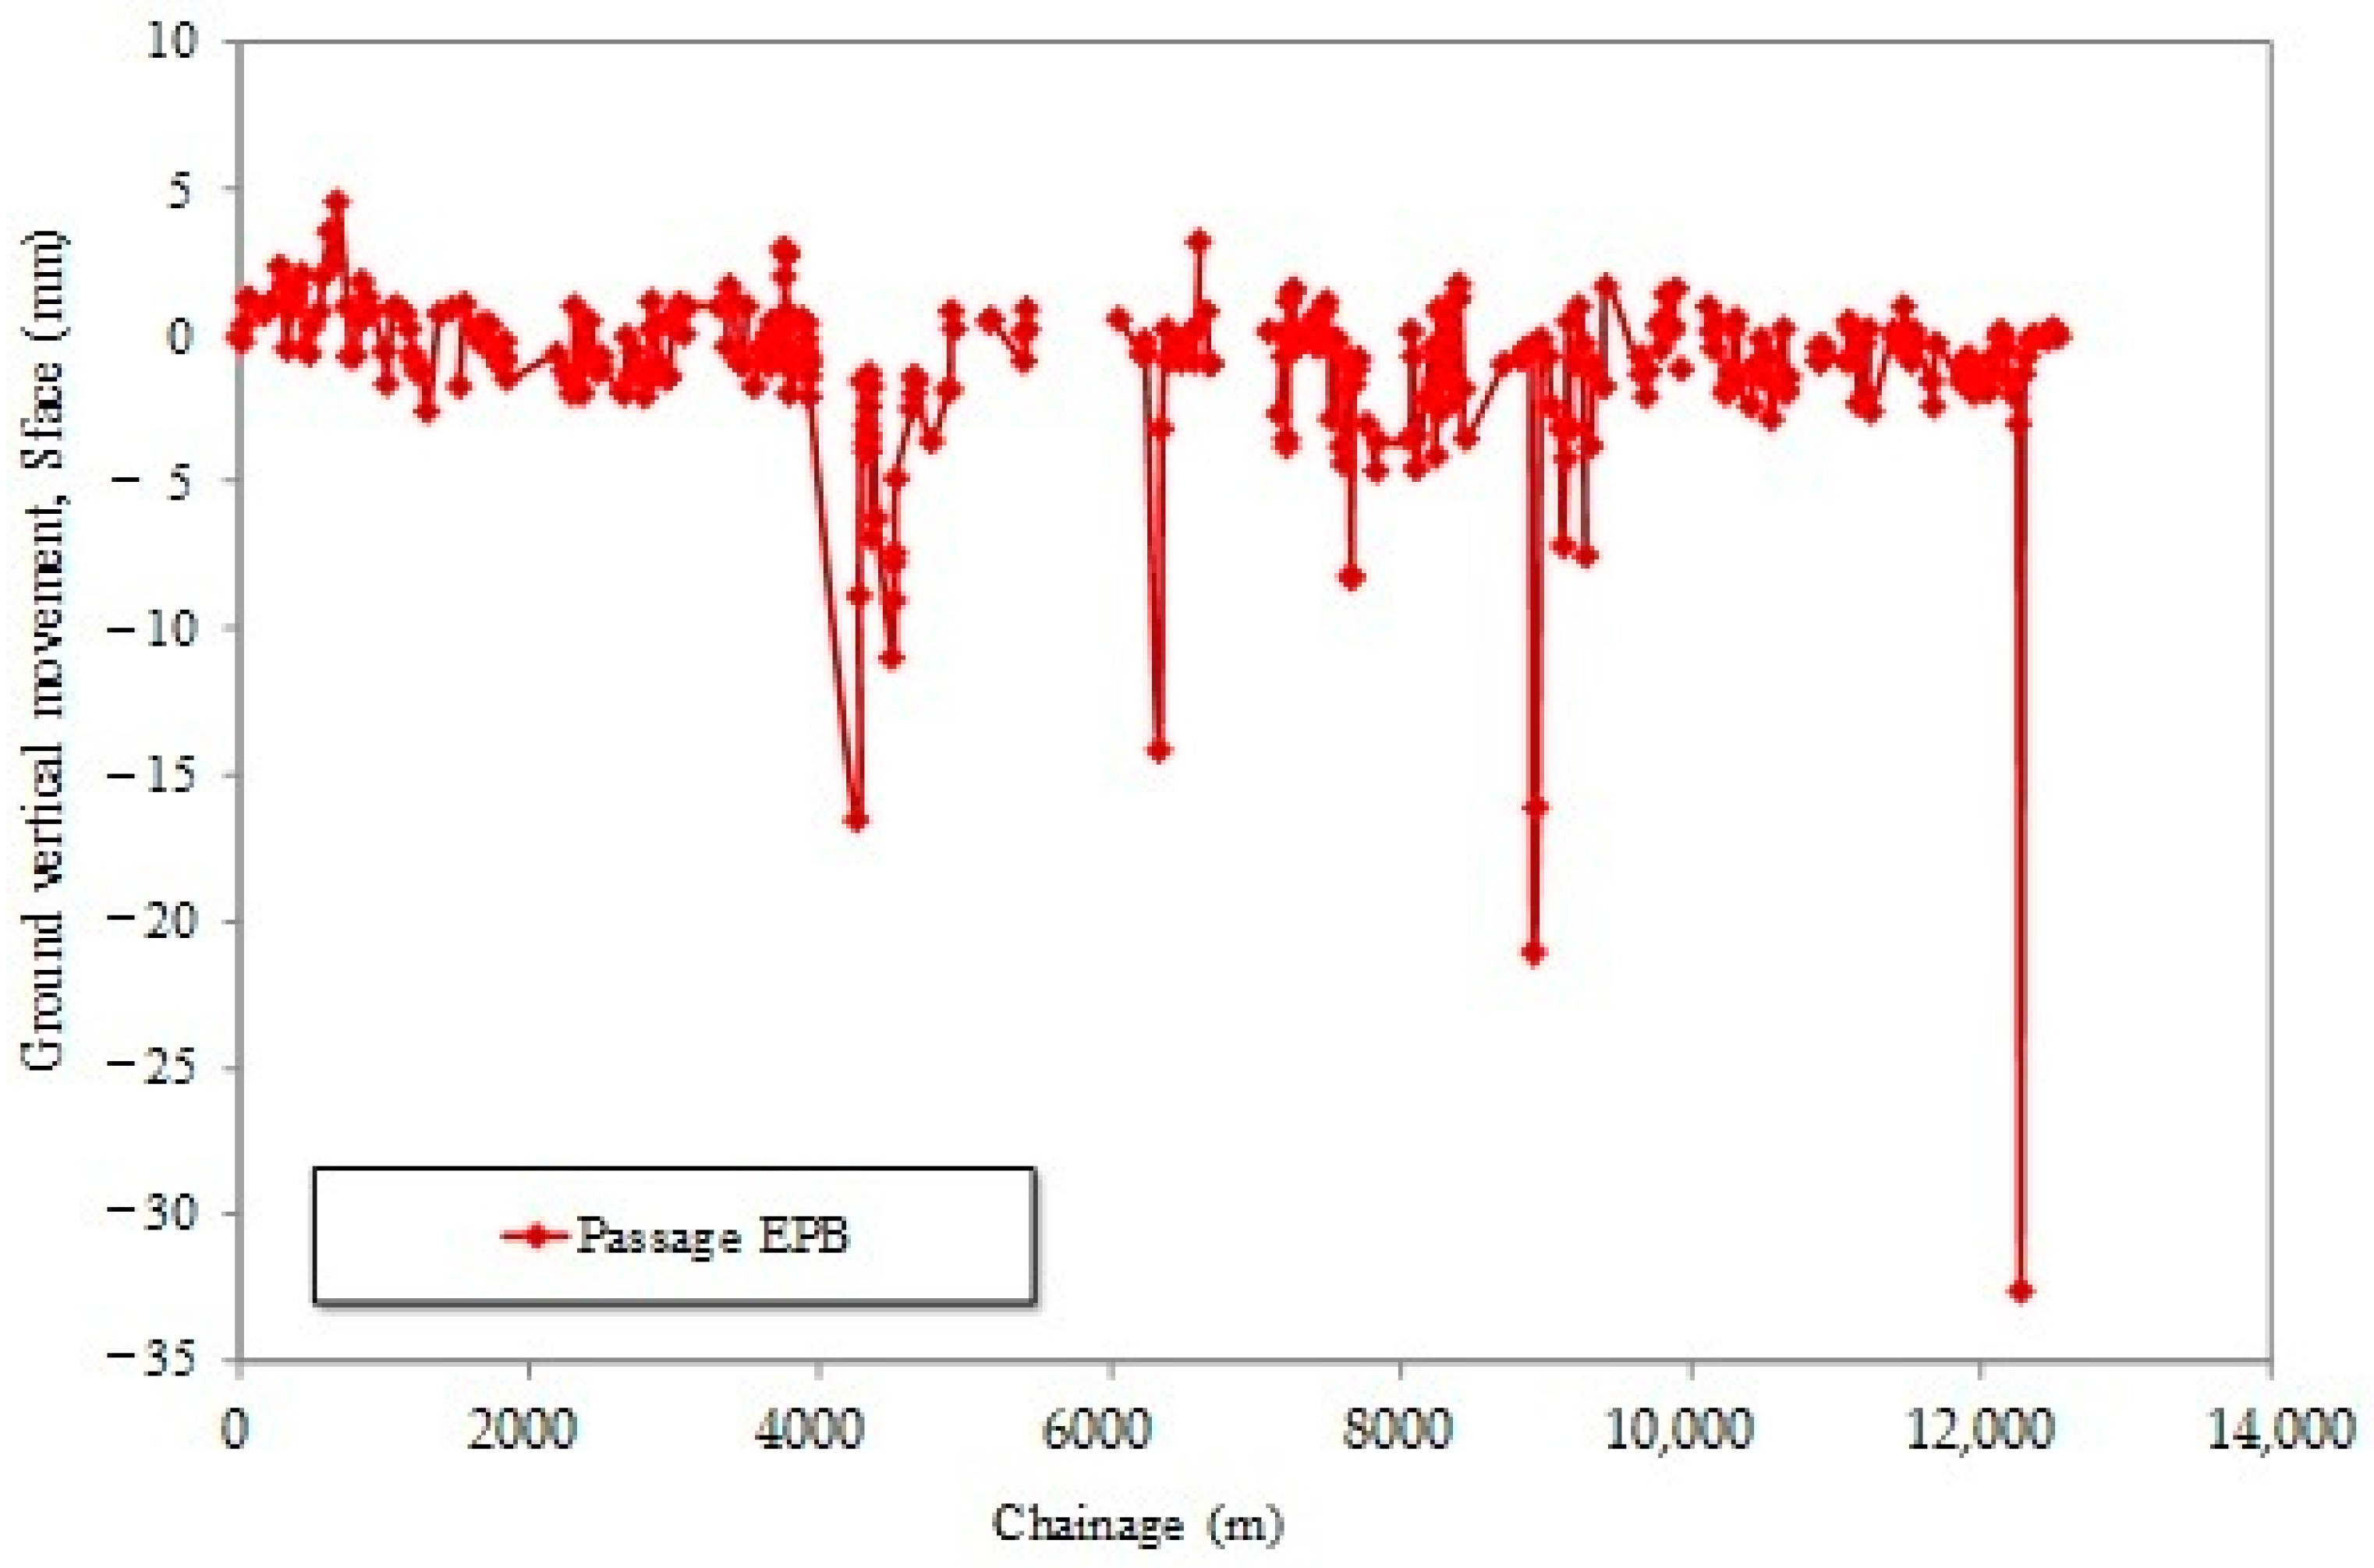
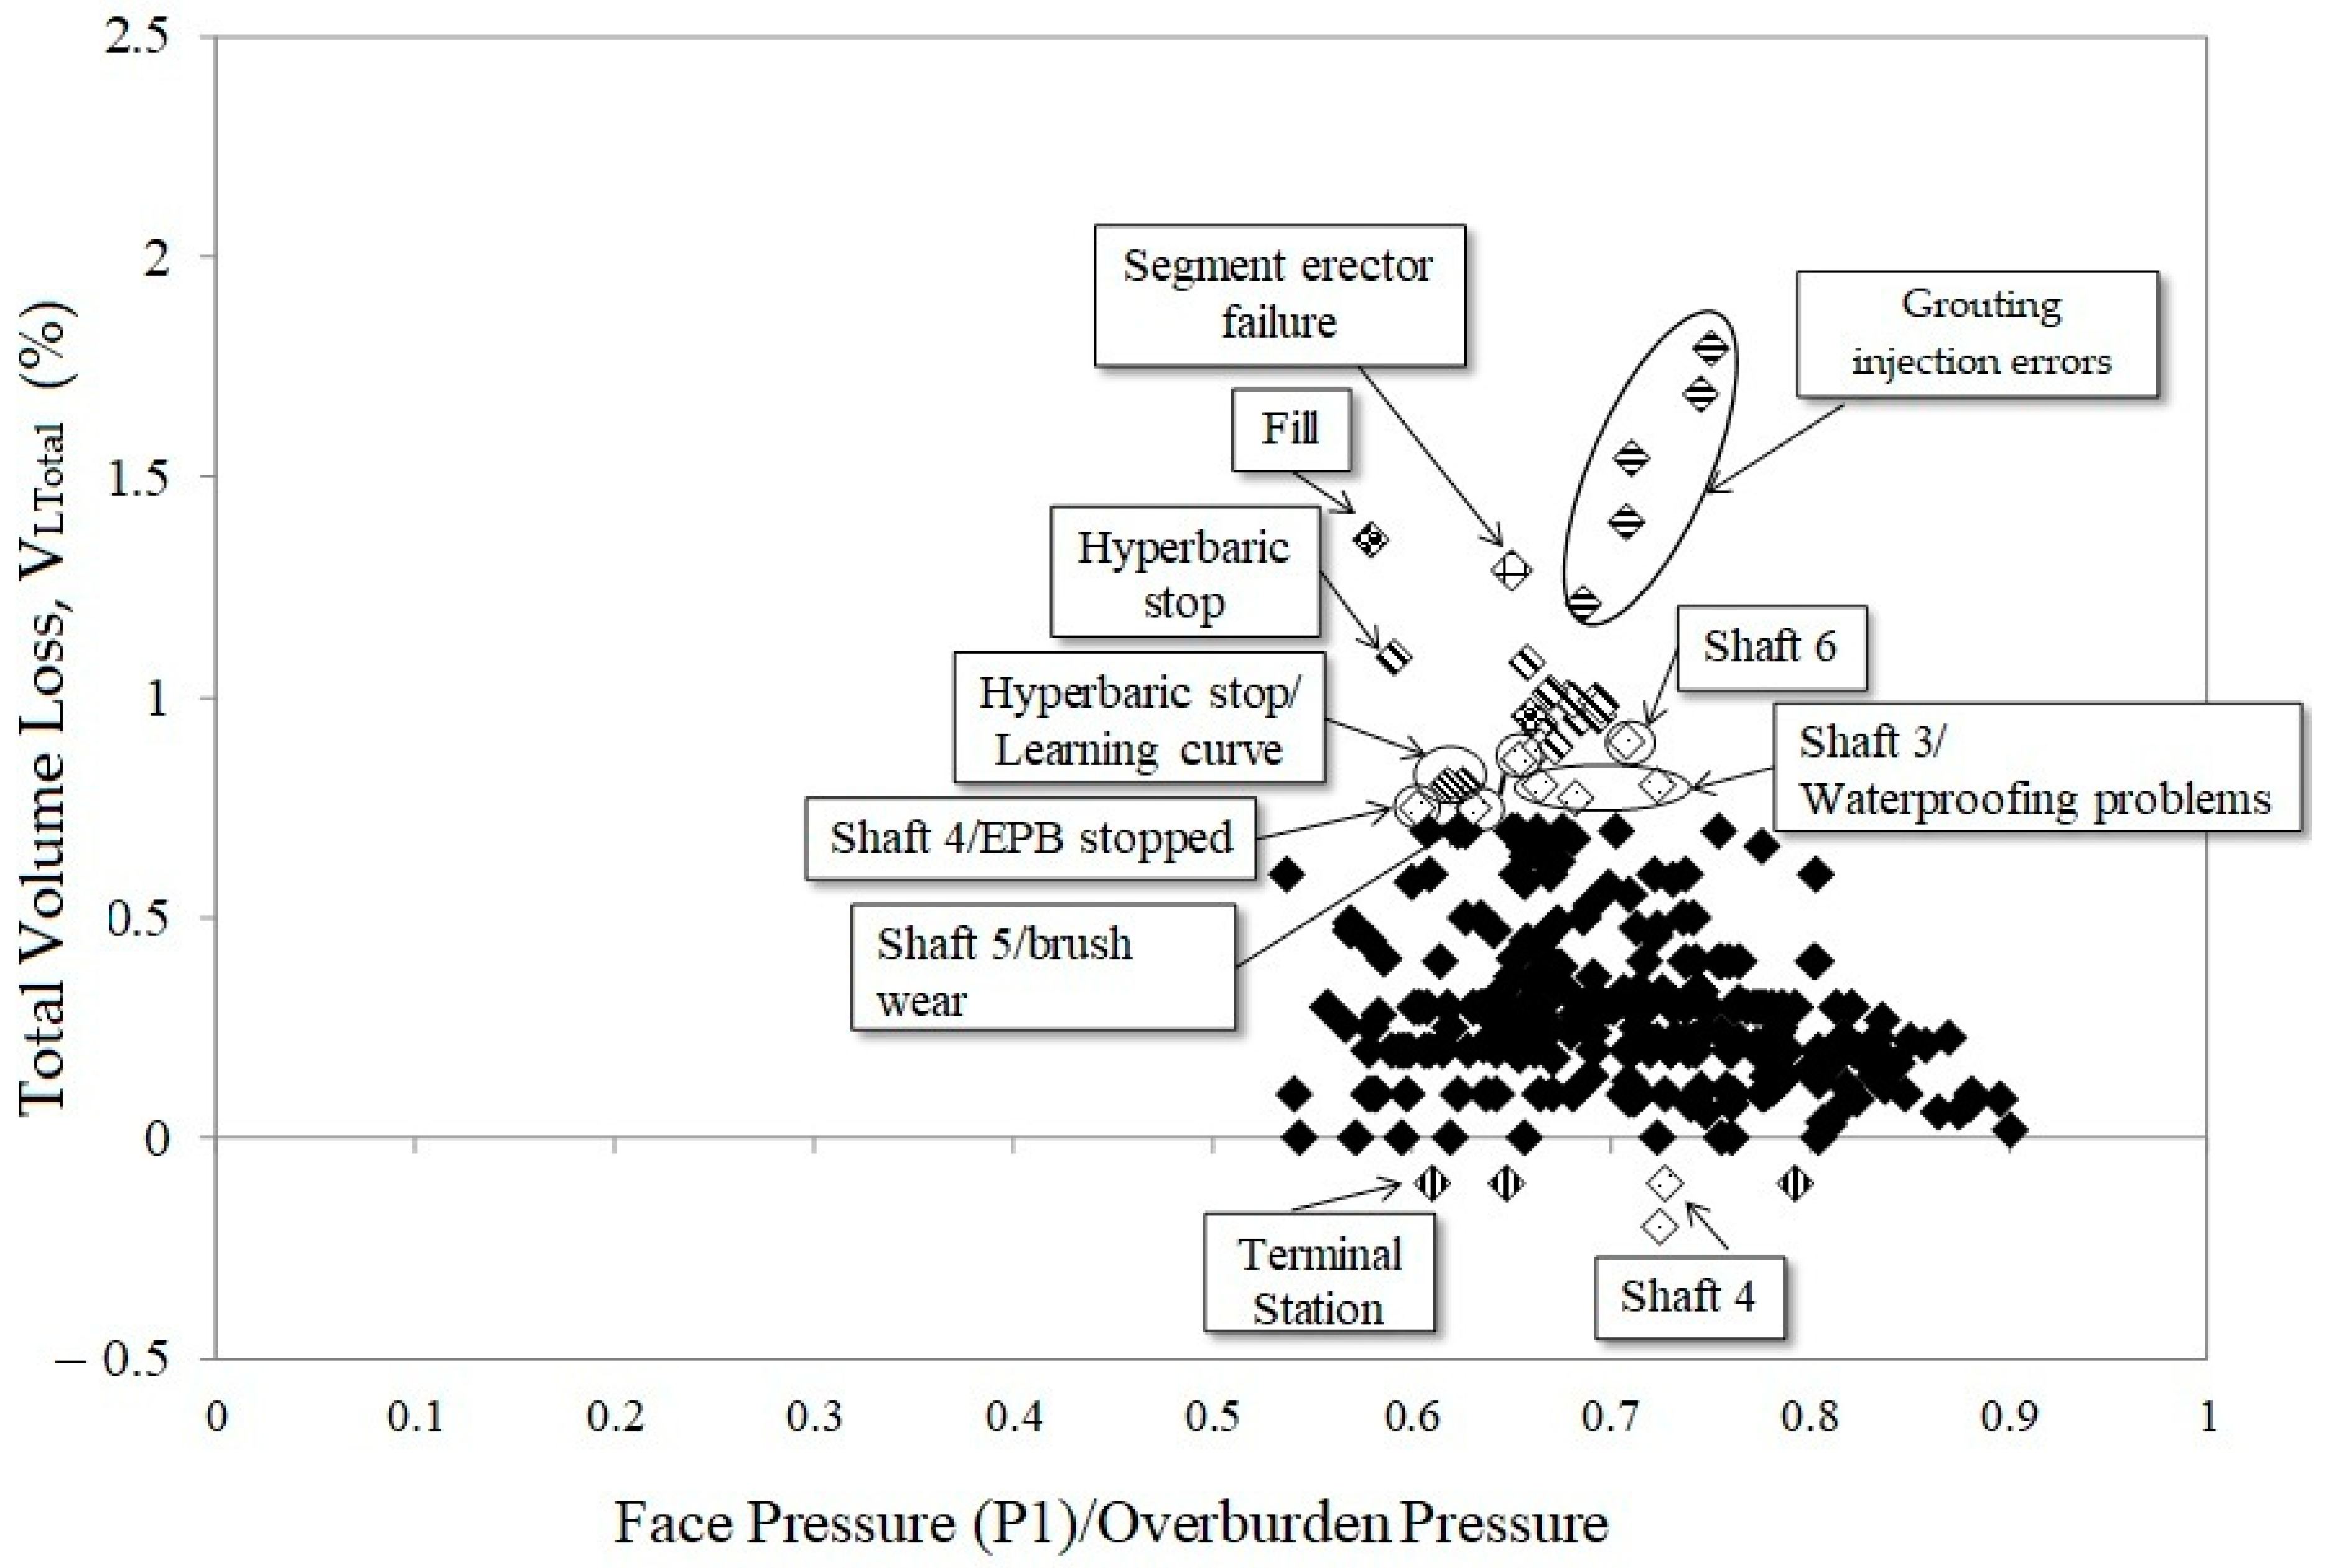
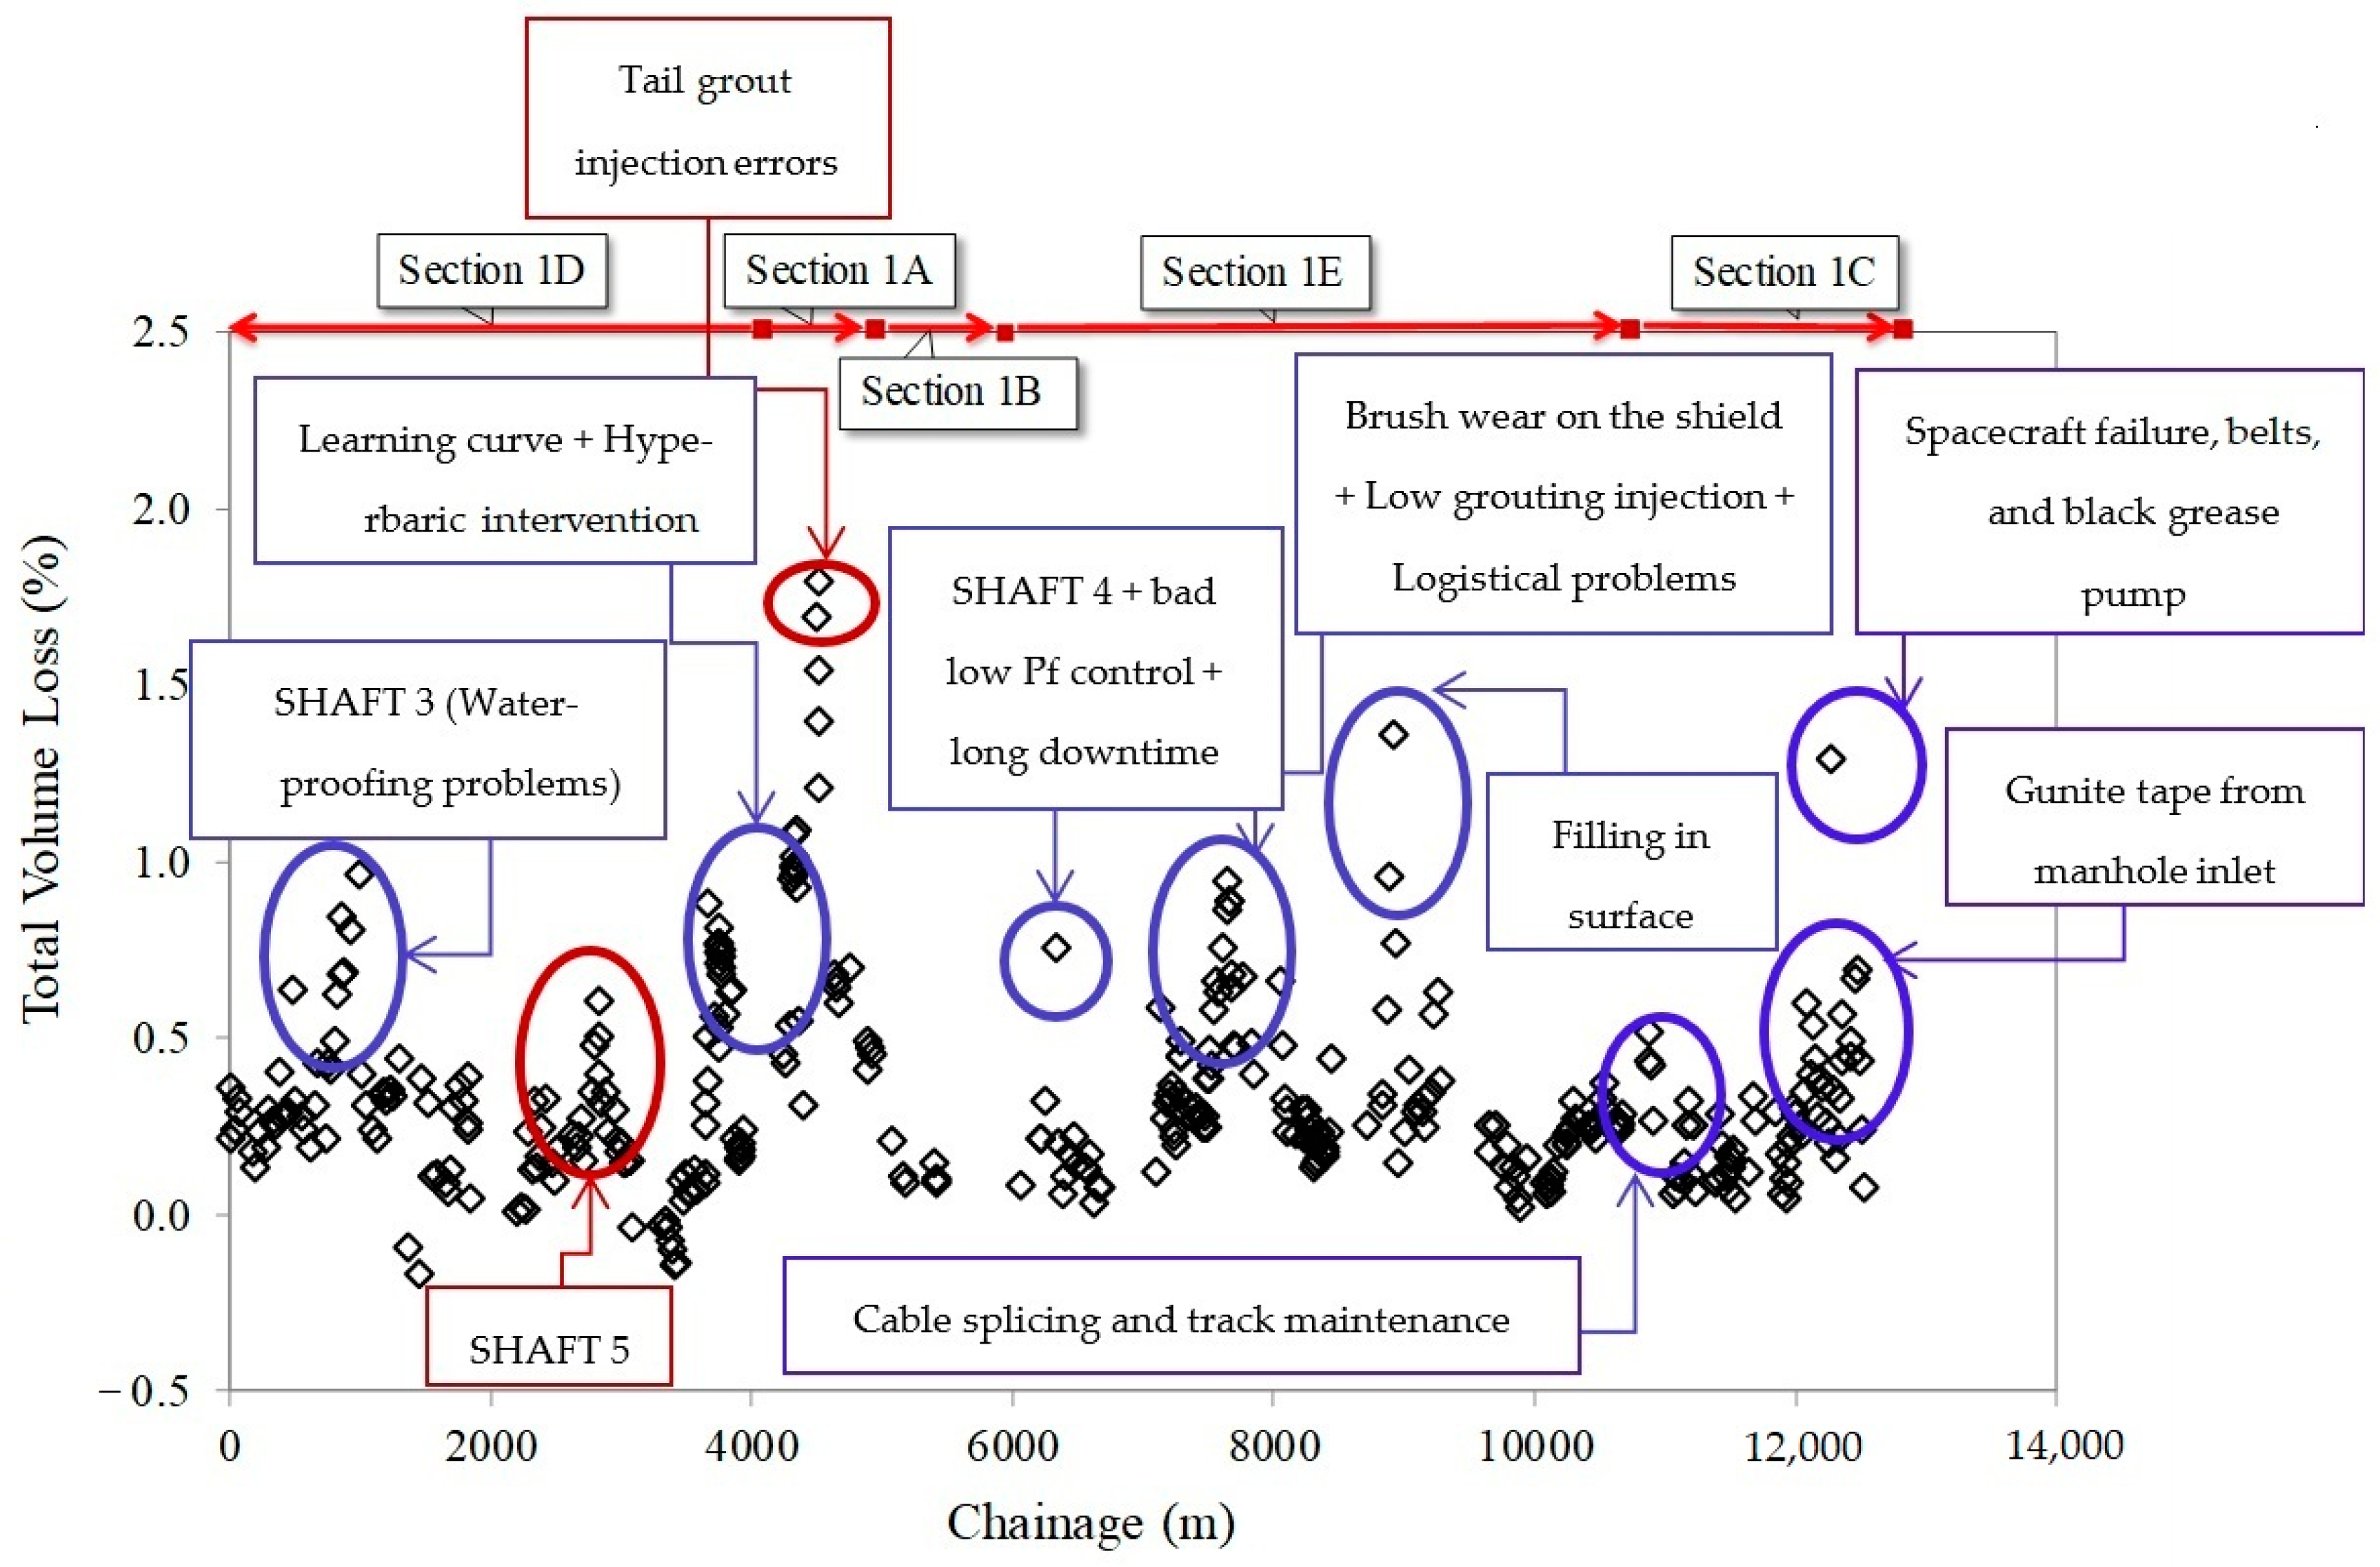
  • Identifying sources of increased ground volume loss, particularly at geological transitions, station entrances/exits, and hyperbaric maintenance stops.
  • Refining predictive models of settlement behavior based on observed field data and comparing them with established empirical frameworks [17,18].
By addressing these factors, this study aims to enhance the understanding of EPB tunneling performance in deltaic deposits and improve construction strategies to minimize ground disturbance in future projects worldwide. The findings contribute to a better understanding of TBM–ground interactions in challenging hydrogeological environments, providing practical insights for optimizing tunneling operations under similar conditions.

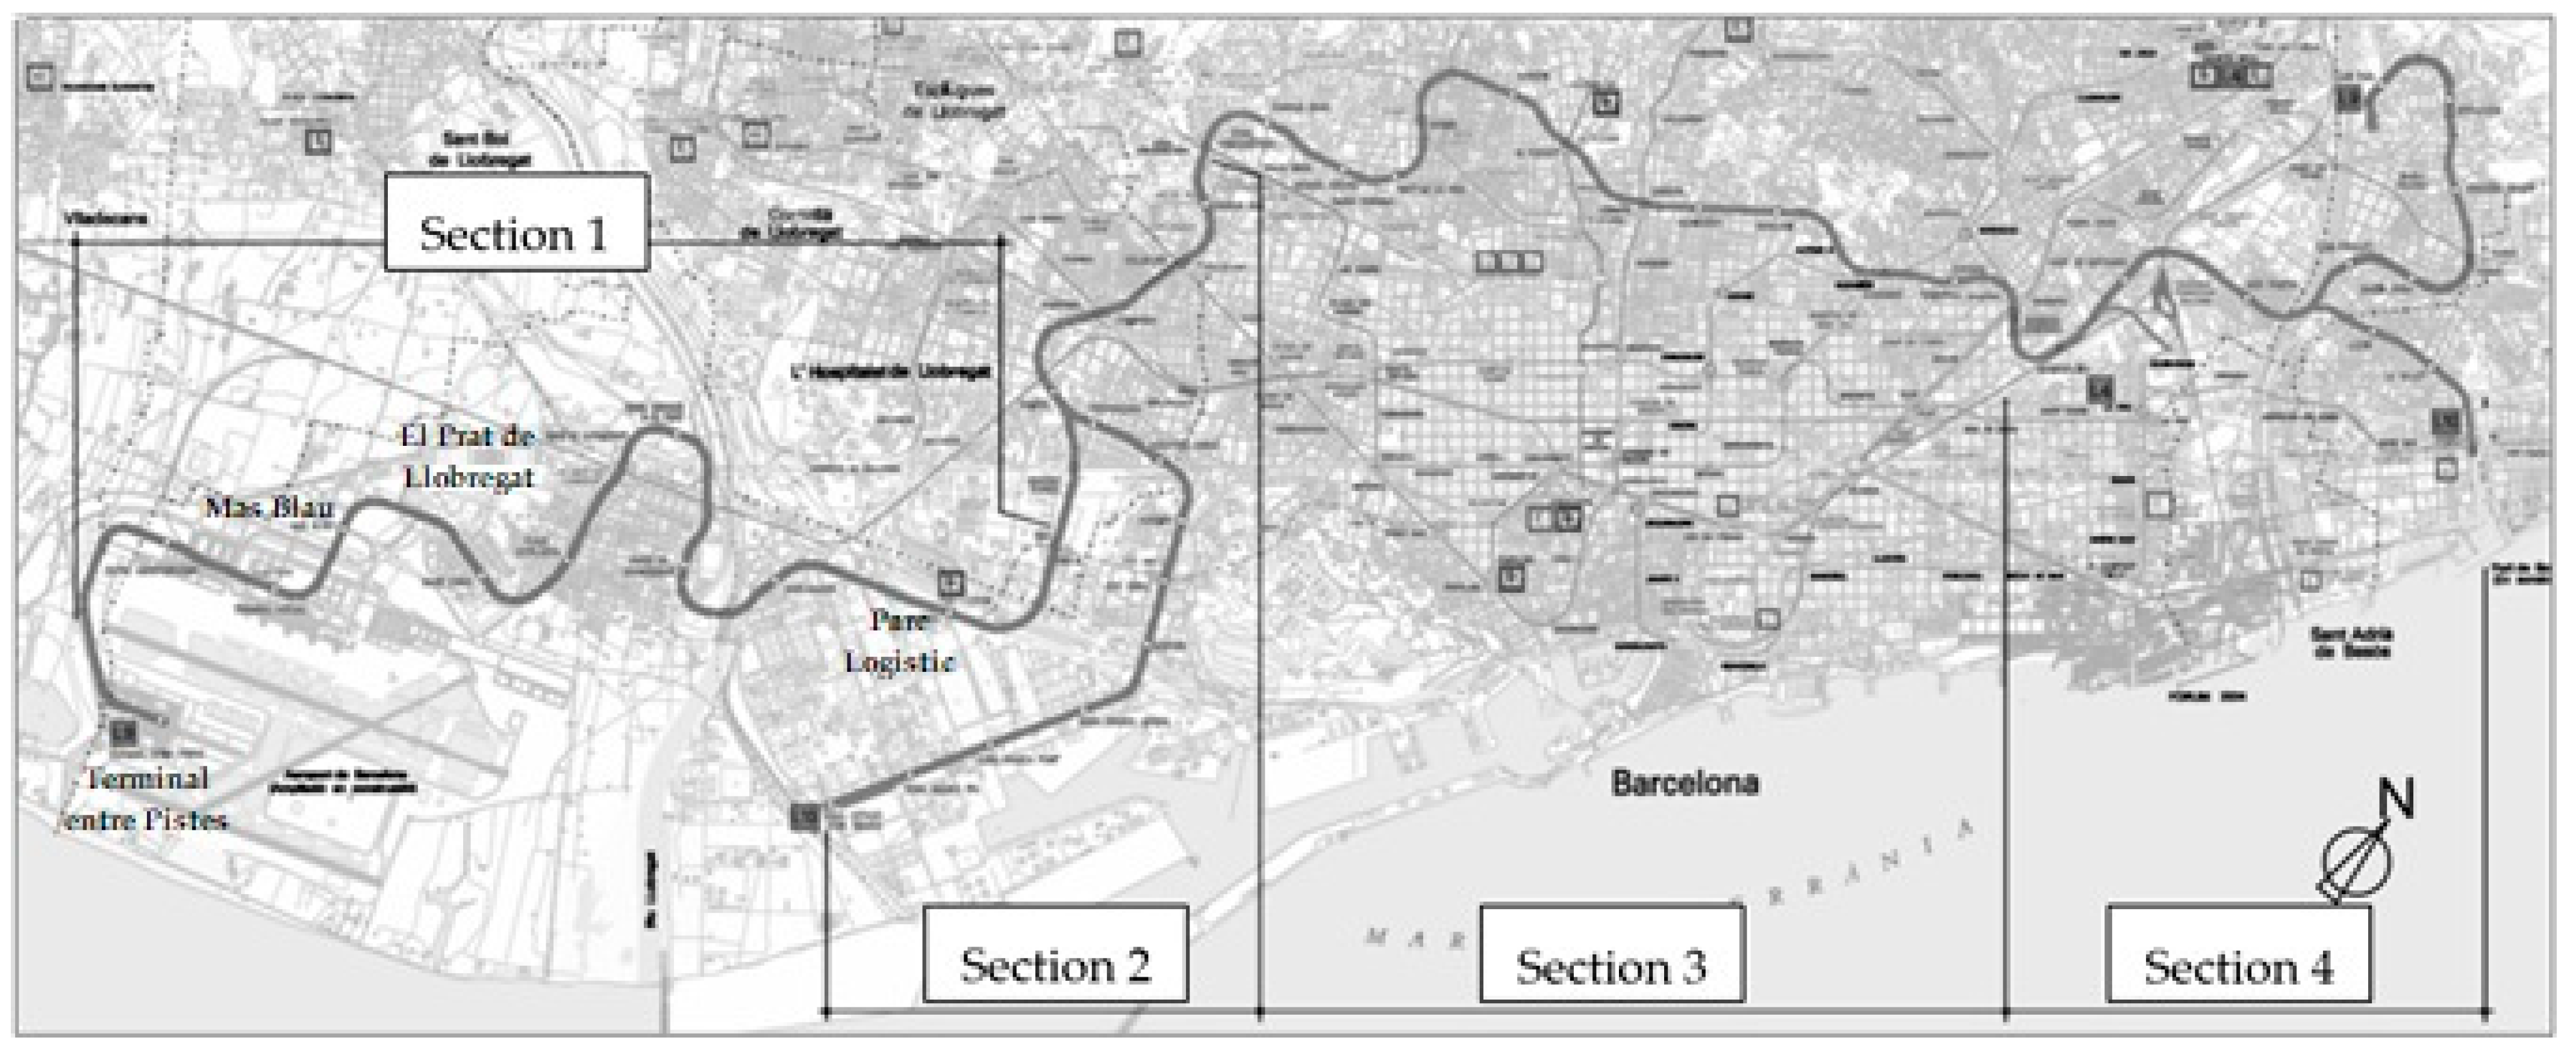
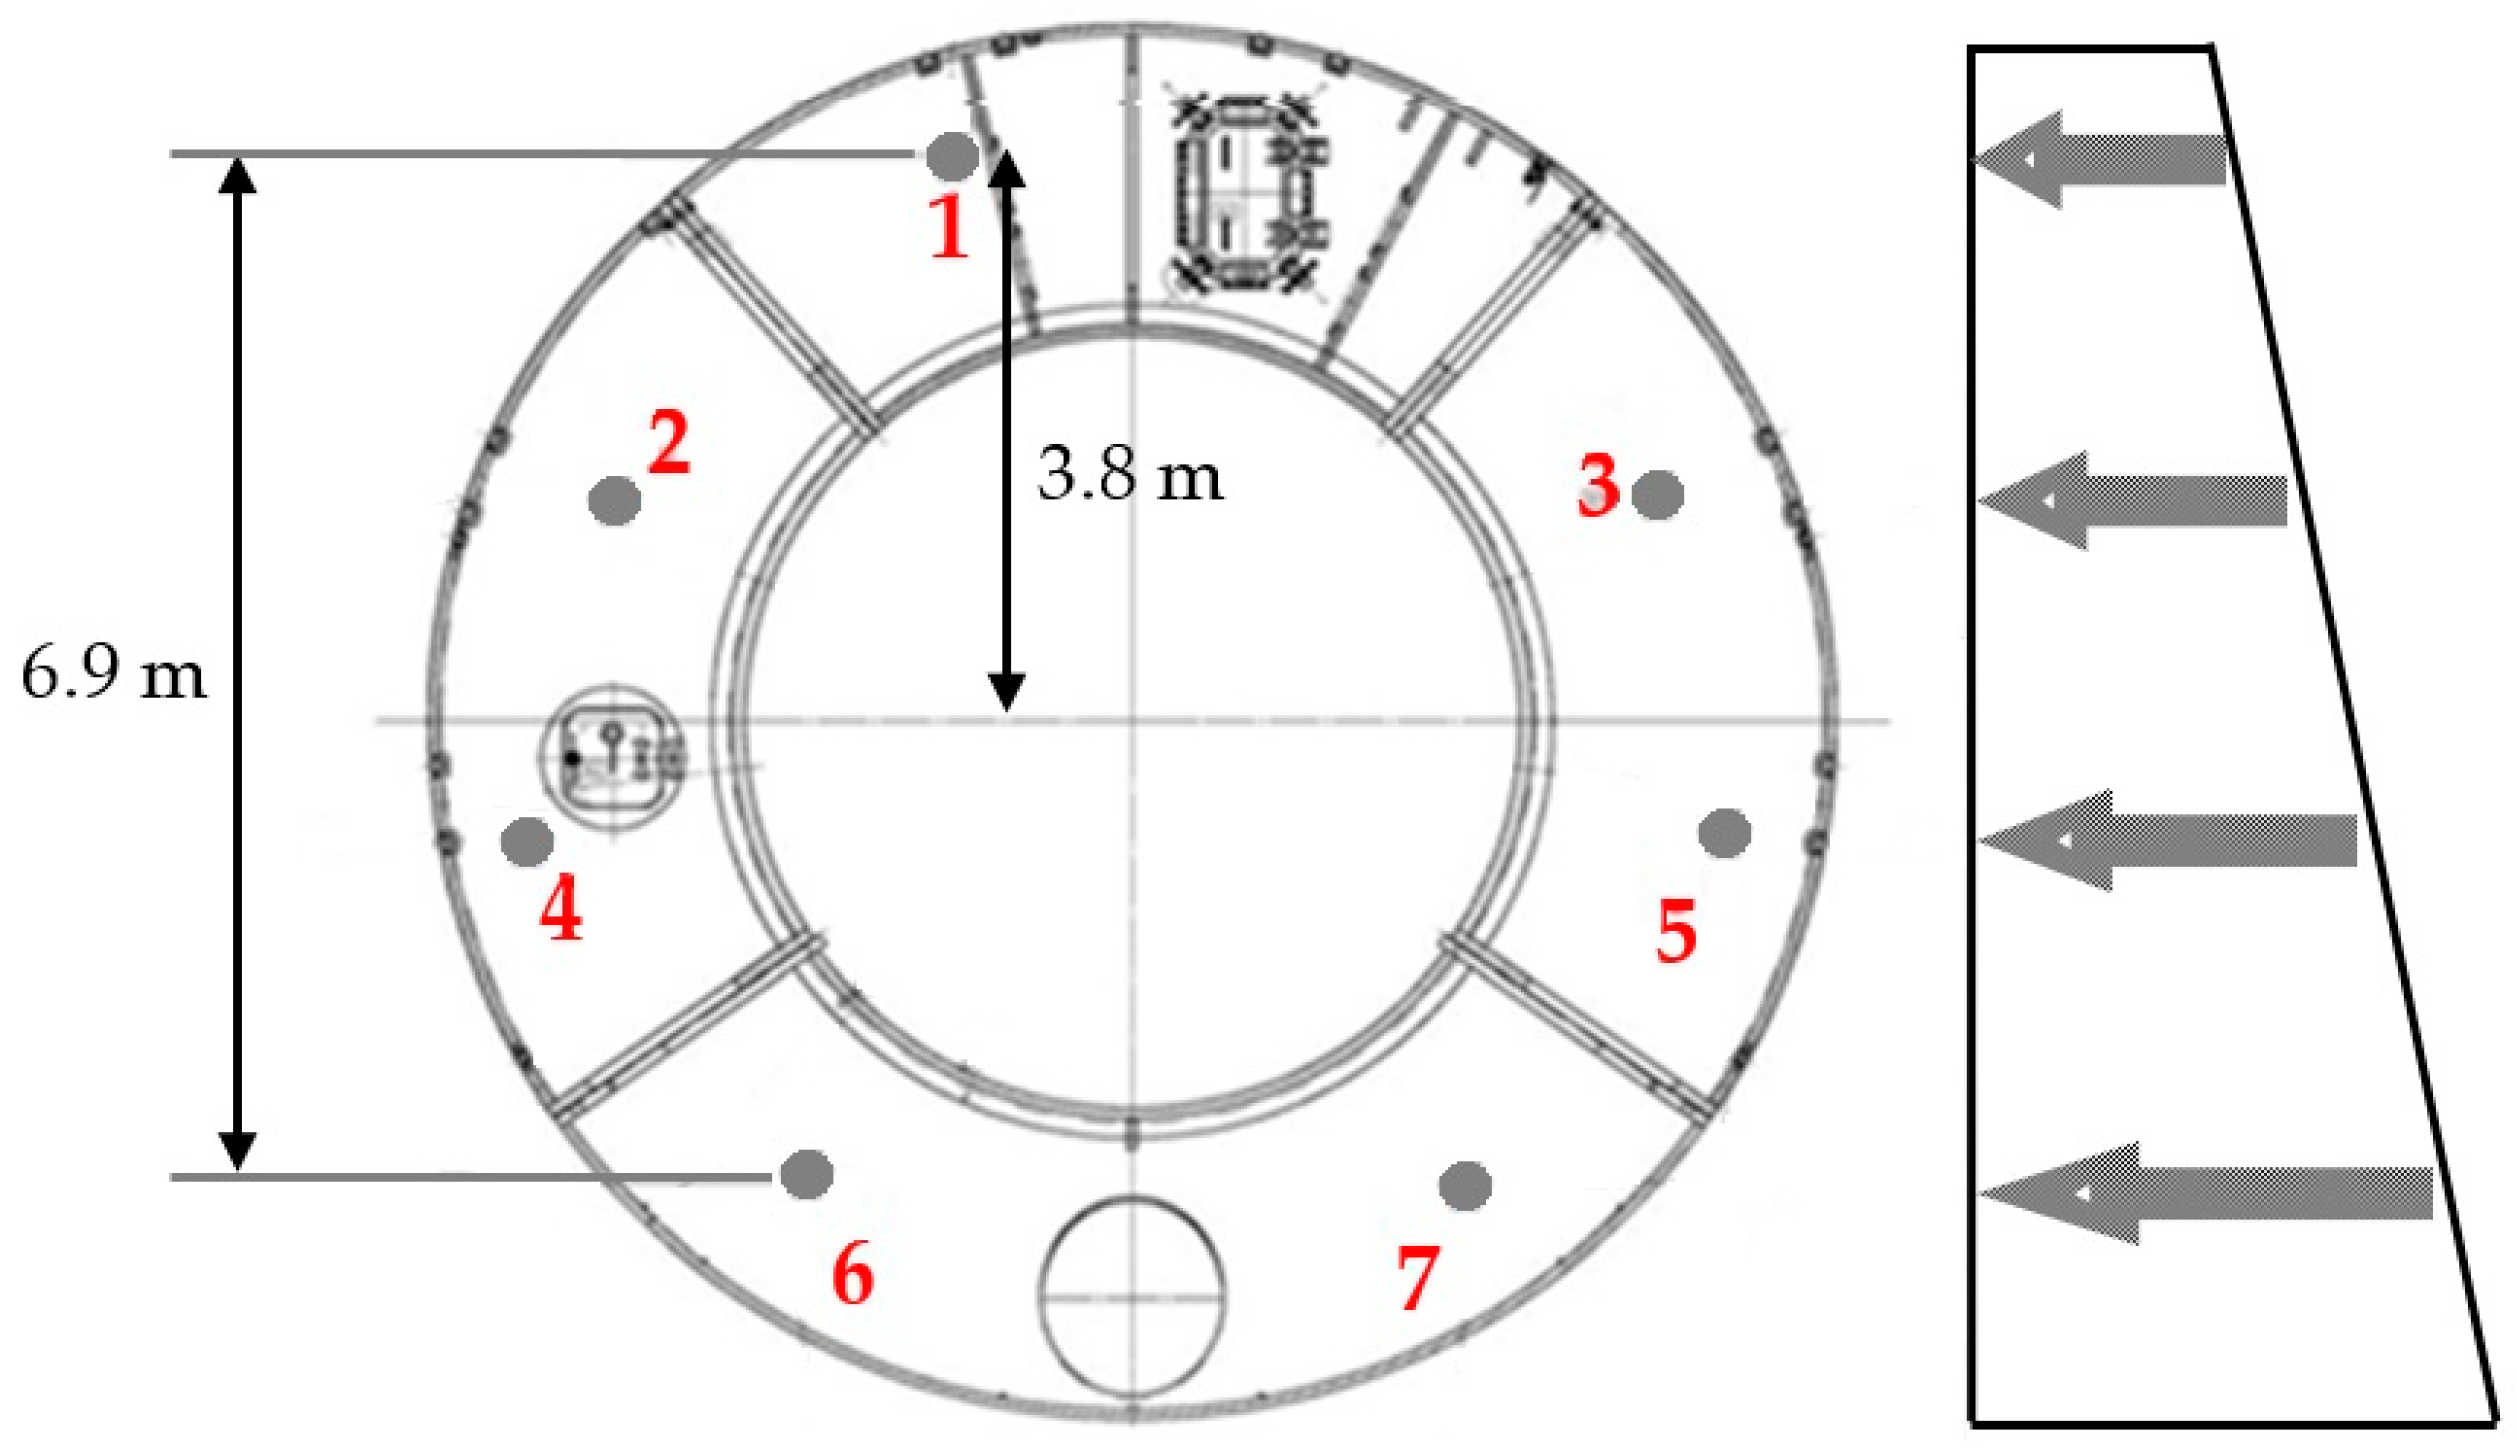
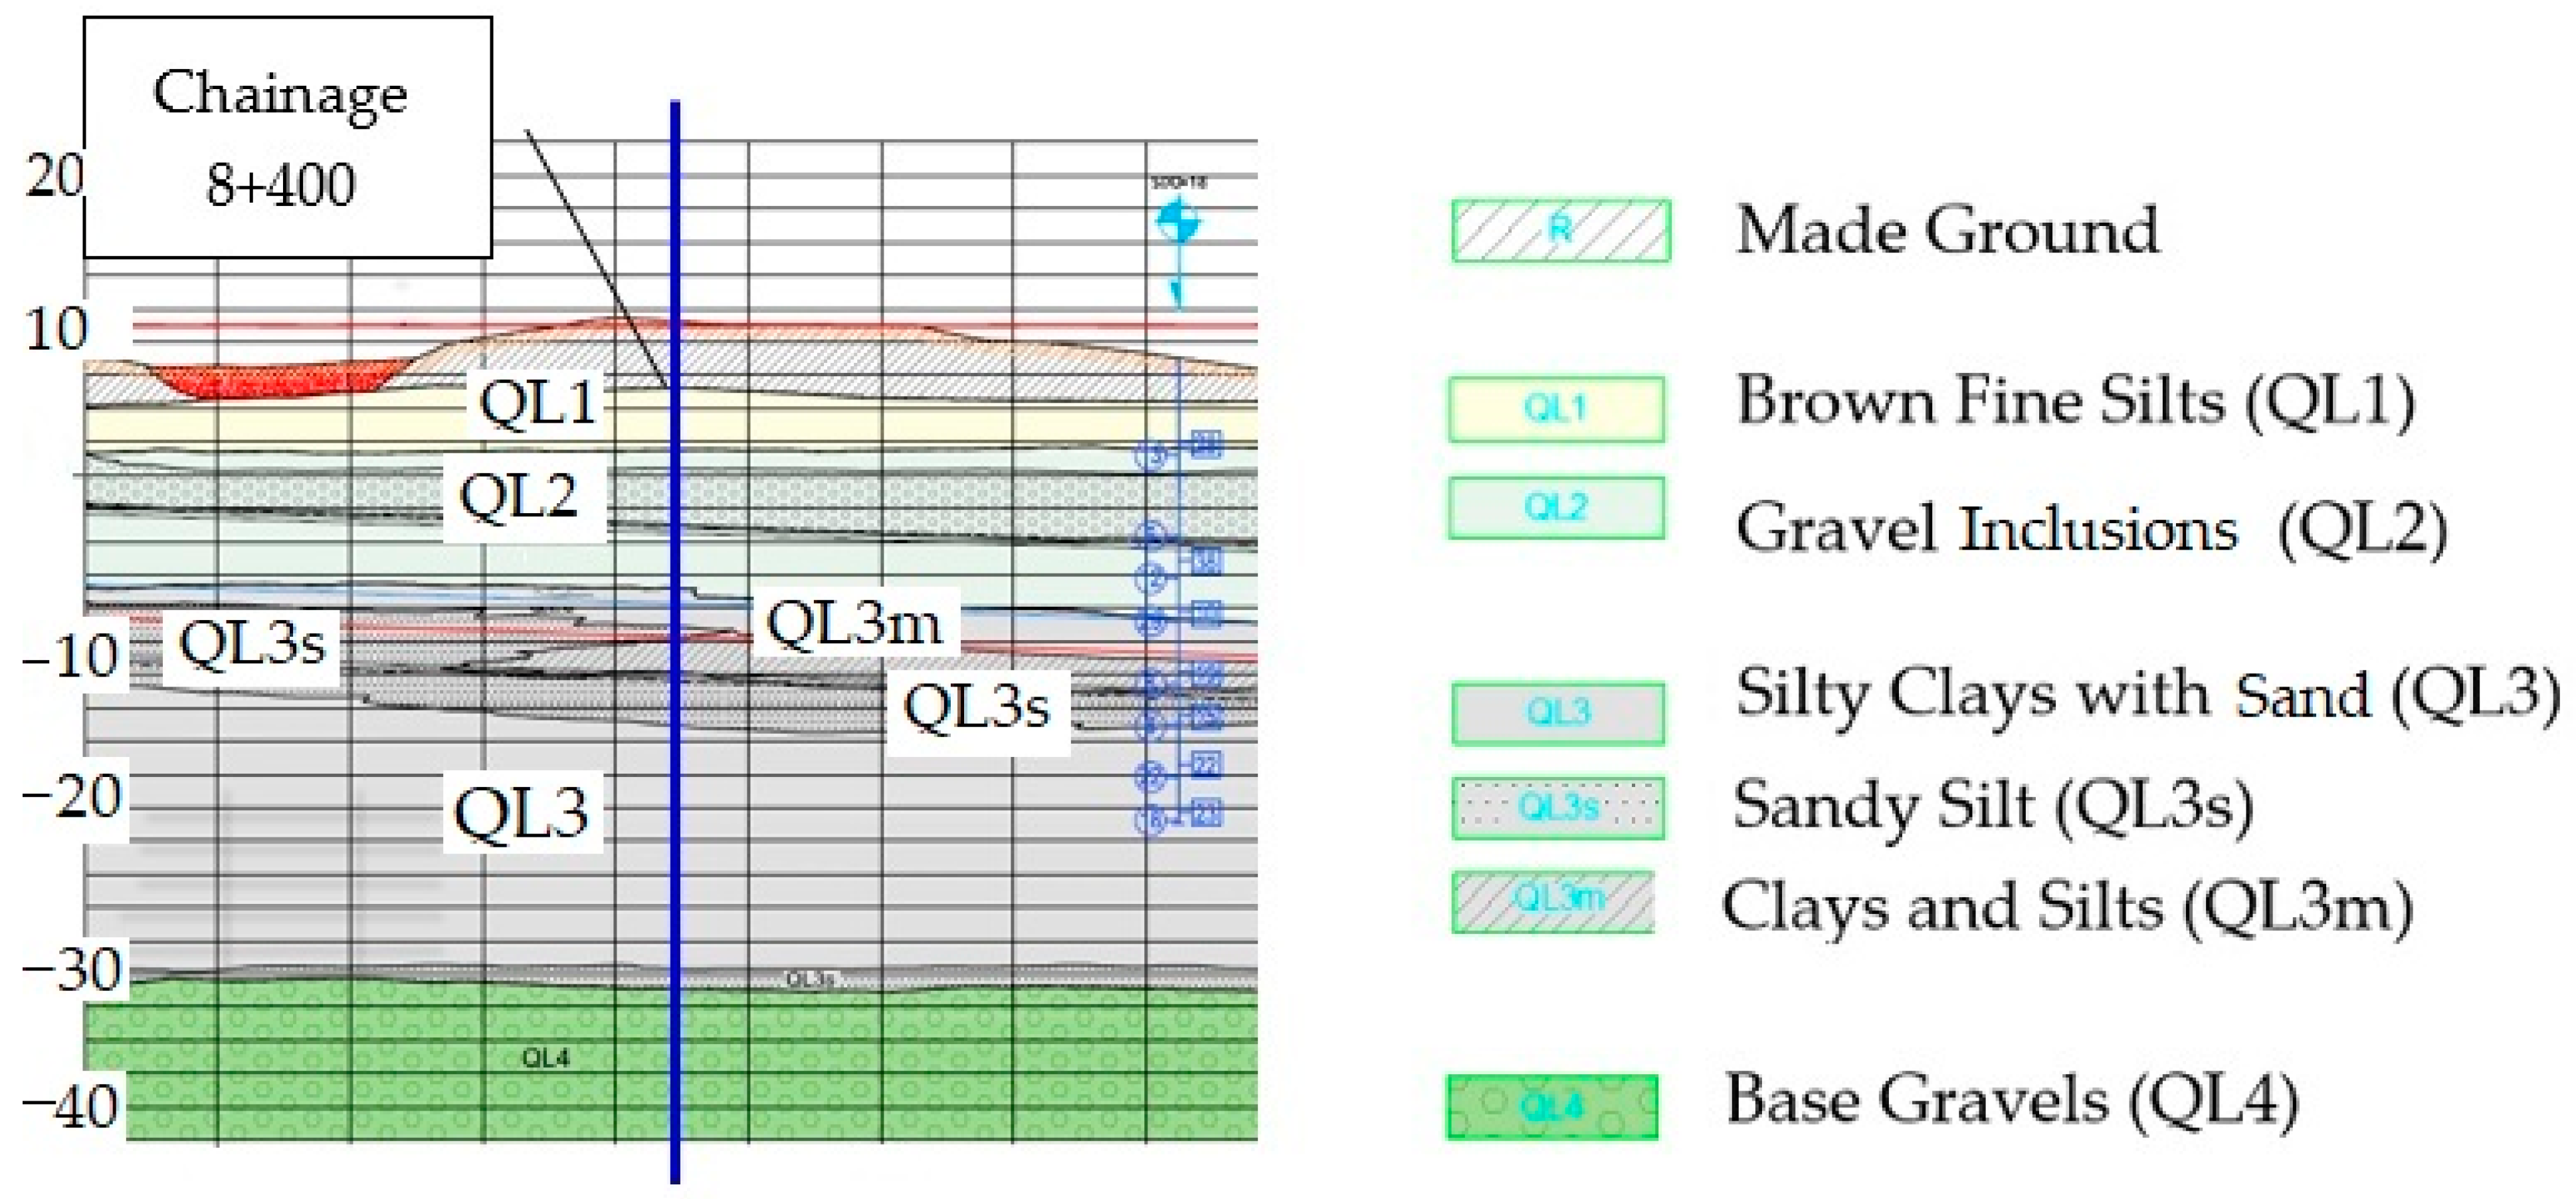
2. Geological Conditions and Instrumentation Layout

The part of the Line 9 (L9) route described in this paper was constructed, under the L9 Contract T1 that starts at Mas Blau Station, with two EPB-type TBMs moving in opposite directions. The first one started at Mas Blau Station and ended at Terminal Entre Pistes Station, inside the Barcelona Airport facilities at El Prat de Llobregat. The second TBM started at Mas Blau Station but continued in the opposite direction to the Parc Logístic Station in Barcelona (Figure 1).
Figure 2 presents a longitudinal section summarizing the geological conditions encountered along the tunnel route of Contract T1.
The top layer comprises made ground (R) of varying thickness overlying a thin stratum of brown fine silts (QL1). Below it, fine gray sands with some gravel inclusions (QL2) are encountered which are, in turn, underlain by a gray layer (QL3) of mixed composition: silty clays with some interlayered sands, sandy silts, clays, and silts. The QL3 layer is the main soft deposit, and it reaches depths of approximately 50 m below ground level. It overlies the base gravels (QL4), where a confined aquifer is located. All of these materials are of Quaternary age, and layers QL2 to QL4 belong to the deltaic deposits of the Llobregat River. The water table is nearly horizontal and is located 0–2 m above sea level.
Except in the proximity of the stations, the ground cover of the tunnel is from about 5 to 16 m, with a cover/diameter (C/D) ratio of approximately 1.7. Around the stations, this ratio decreases, reaching a minimum value of 1.0 in the area of the Terminal Actual Station.
Overall, the basic soil properties are summarized in Table 1.

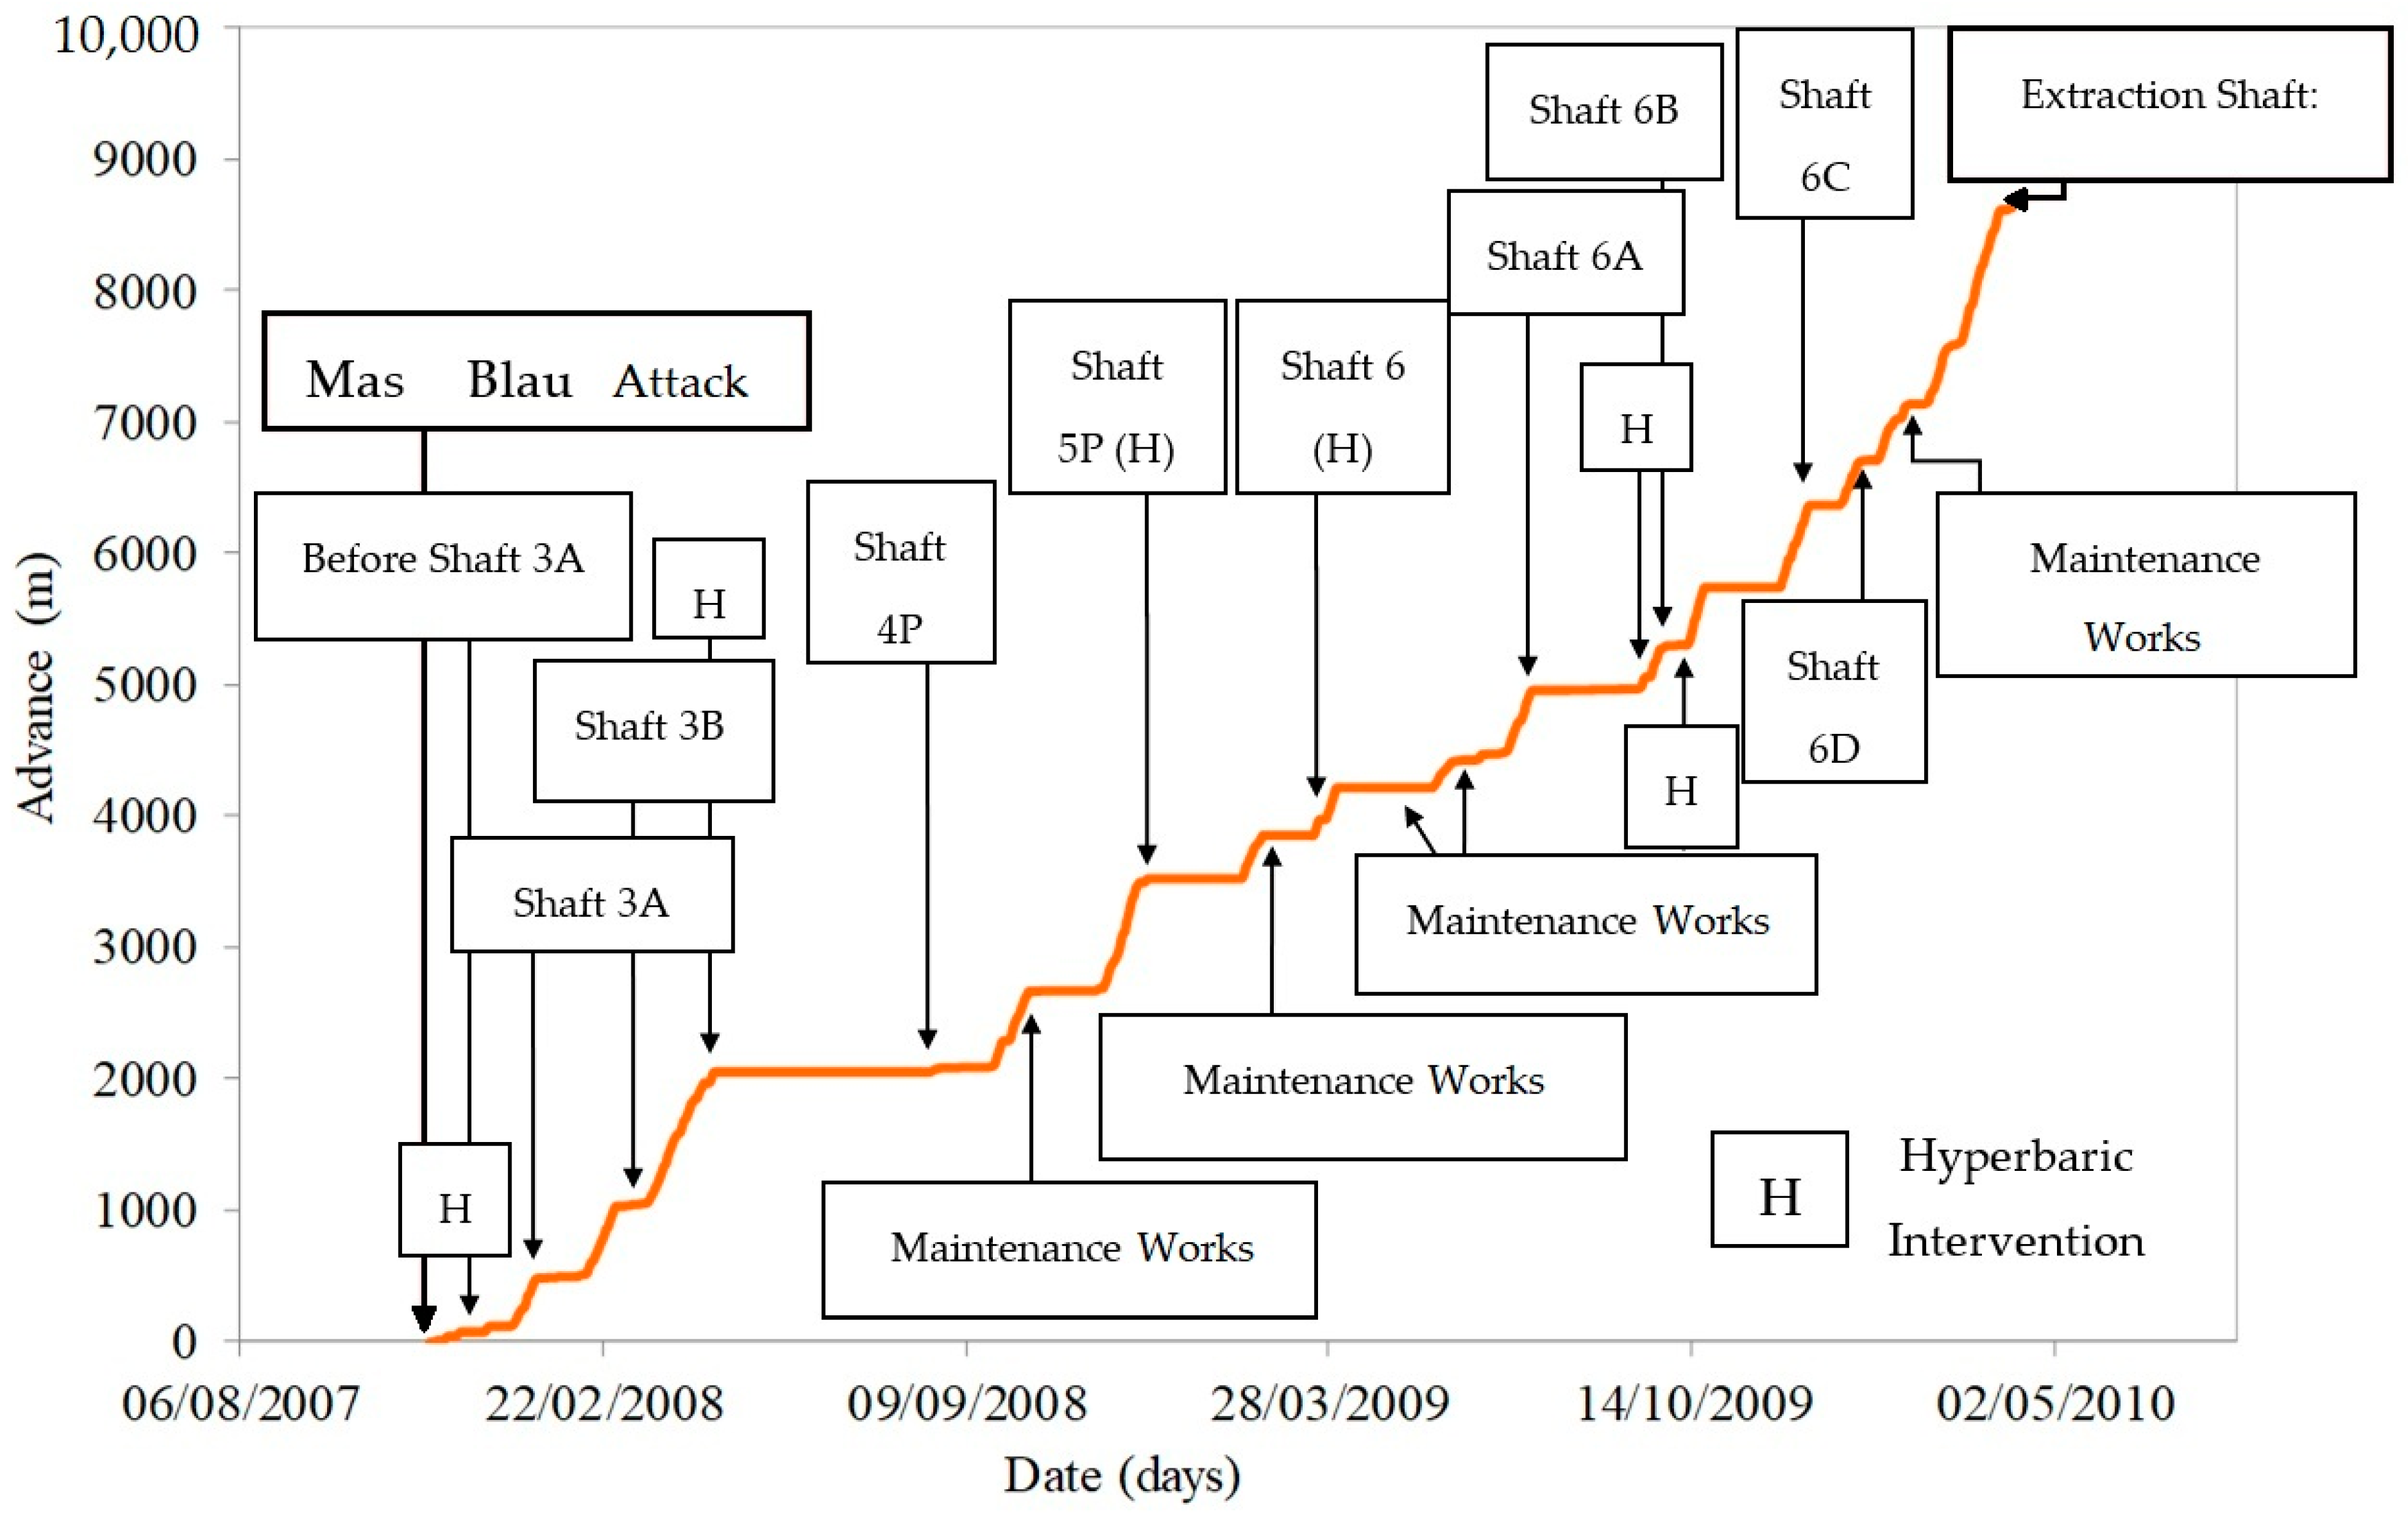
3. Tunneling Details

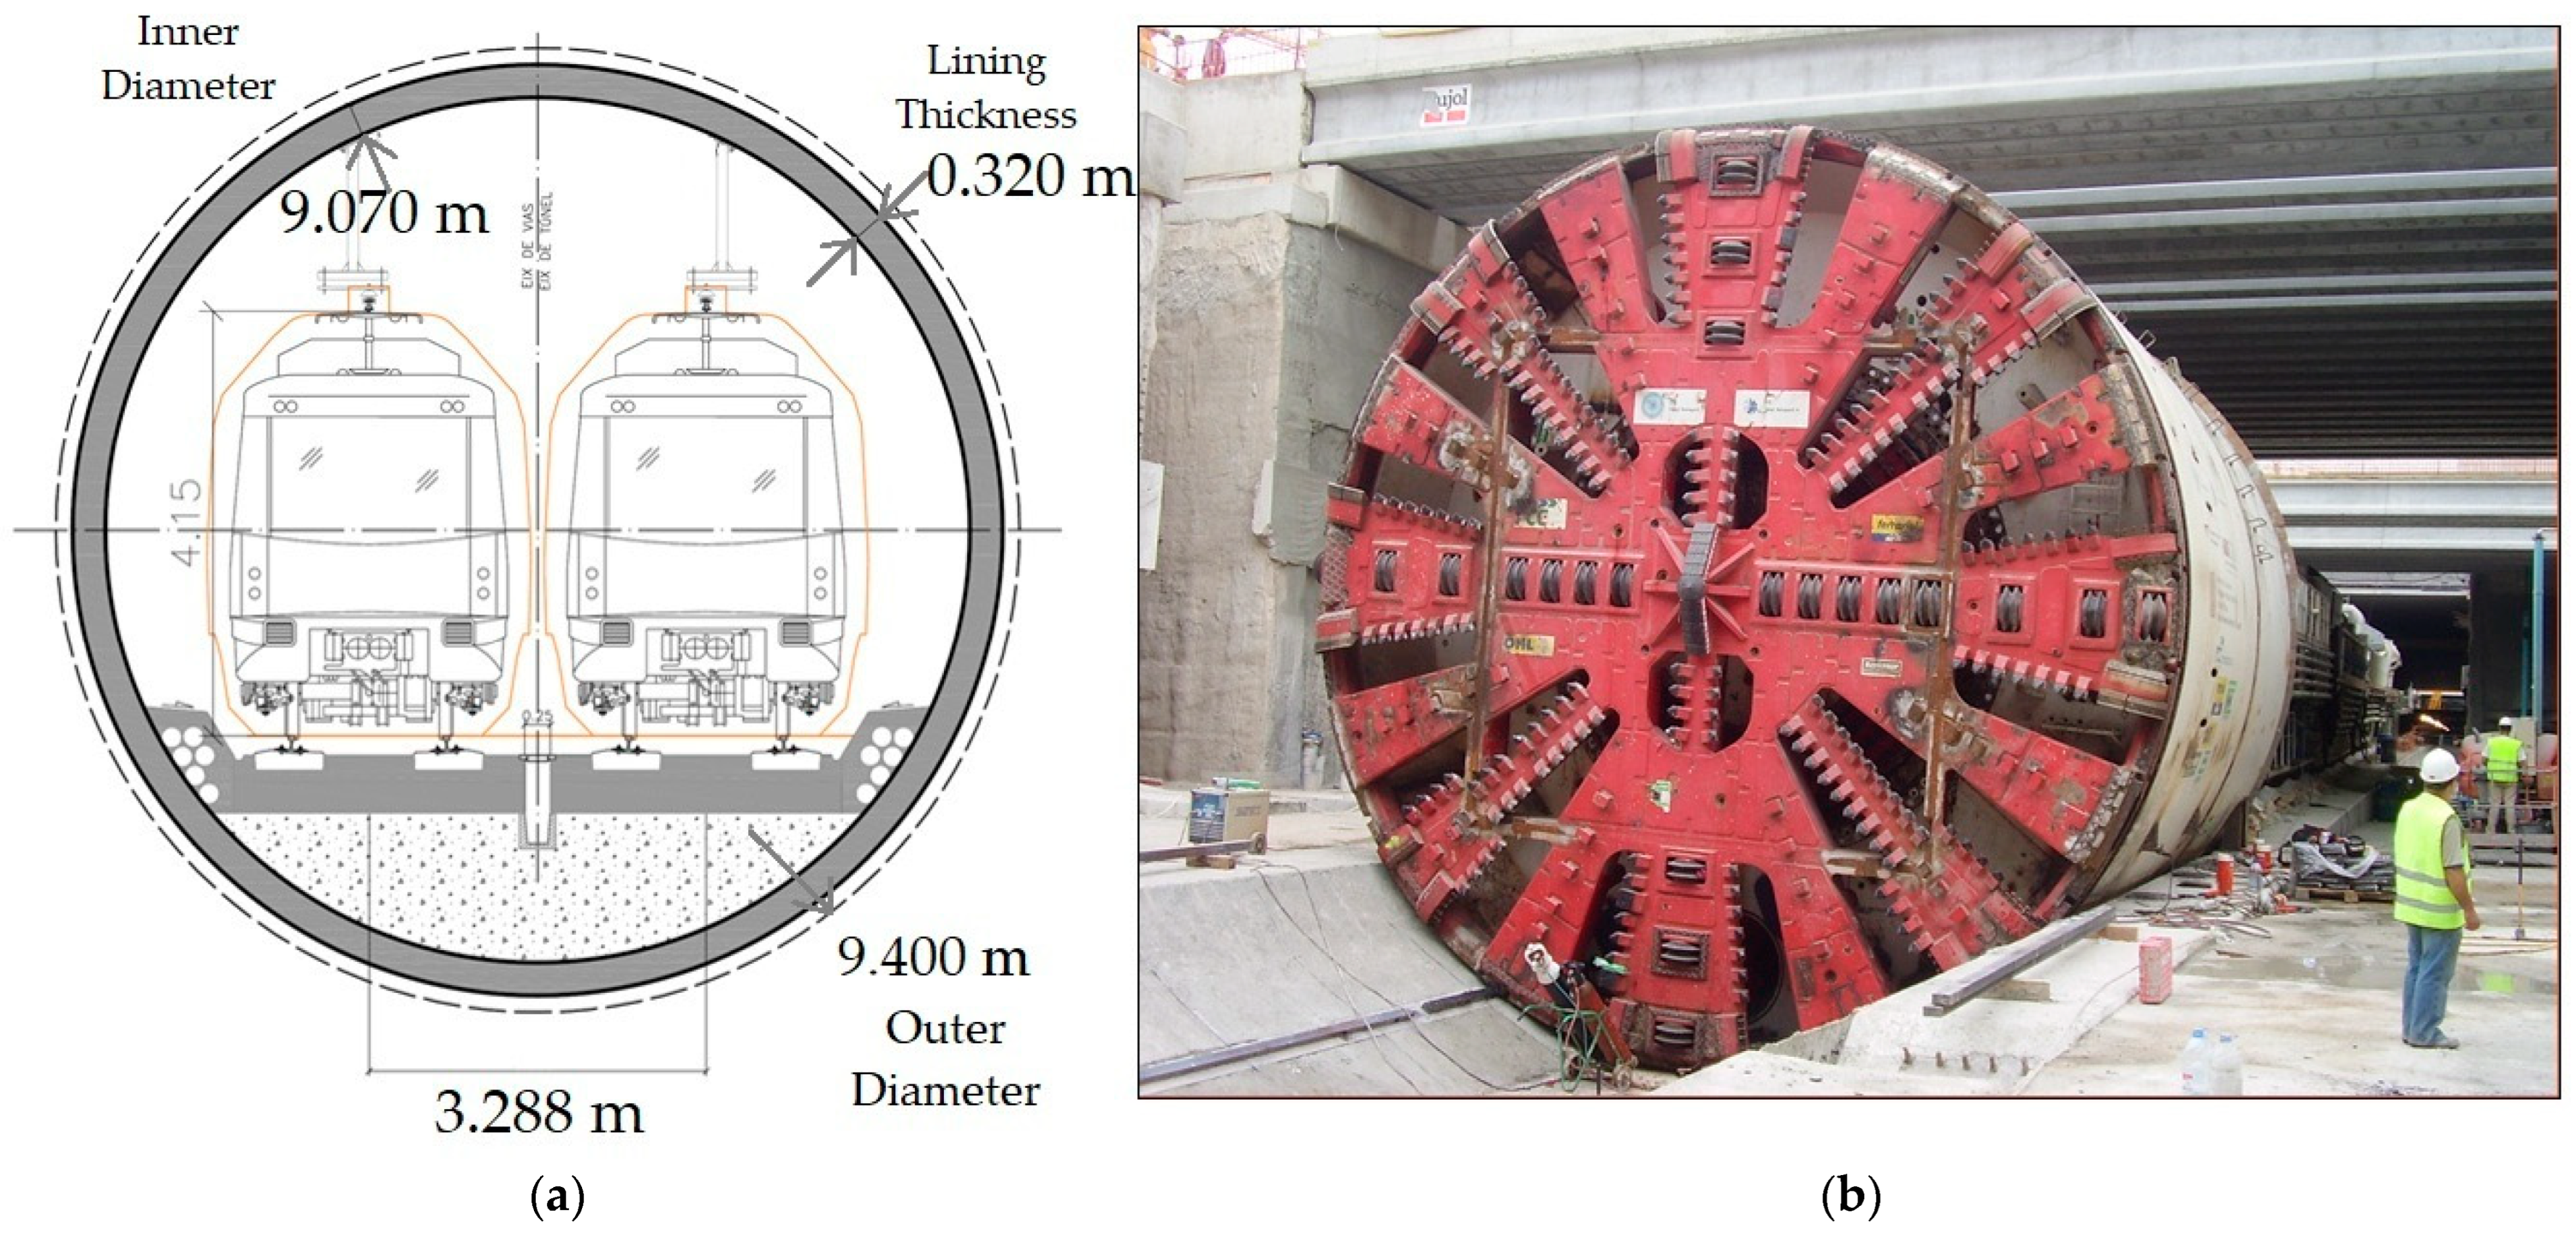
3.1. Earth Pressure Machines (EPBs)

In the construction of Line 9, specifically for Section 1 from “Terminal 1 Station” to “Parc Logístic Station”, the solution adopted was to use two HERRENKNECHT tunnel boring machines, both EPB-type with identical characteristics. It is well known that these machines are designed for the excavation of unstable soils below the phreatic level, as is the case for the deltaic materials traversed.
The nominal diameter of the cutter wheel is 9.40 m, which represents an area of 70.0 m2, and the openings for the entry of the excavated material into the chamber represent 31.4% of the total surface of the wheel. The inner diameter is 8.42 once the final support is in place. The support is formed by segments, specifically 6 + 1; that is, six segments of equal dimensions plus one segment placed in a keystone of variable dimension. The length of each segment is 1.5 m. The cycle corresponding to 1500 mm of excavation followed by the placement of the segmental support will be called “ring “. Thus, this arrangement allows the excavation of a single tunnel with a double lane. Figure 3 shows a section of the Section 1 tunnel excavated with a double lane. Furthermore, the shield of the TBM, in both cases, has a length of 10 m excluding the cutterhead, approximately 11 m if we count the length of the cutterhead. During the excavation cycles, the cutterhead and the screw conveyor stop to allow the placement of the support.
The first of the TBMs to begin excavation, called Hades or S-269, excavated 8174,479 m in a northerly direction from Mas Blau Station towards Parc Logístic Station. The second TBM, called Guster or S-461, excavated 4325,521 m in the opposite direction from Mas Blau Station towards Terminal Entre Pistes Station, now known as Terminal T1 (Figure 1).
The average advance speed of the Hades TBM, along its more than 8 km of route, was 26.37 m/day, equivalent to almost 18 rings per day (not including the periods in which the machine remained stationary). The maximum advance recorded by this same machine was 72 m/day, that is, 48 rings/day. This is high performance if we compare it with records for deltaic grounds also excavated with a TBM of the EPB type and with similar characteristics, as in the case of the construction of the Bangkok subway, where its best advance record was of the order of 20 m/day [19]. Hence, Figure 4 shows the advance of the TBM as a function of the excavation time employed and the average speed reached with this TBM.
Regarding the stops of the tunnel boring machine, throughout the tunnel excavated, 77 stops of more than one day’s duration were made in shafts and stations. These stops were mainly for technical-mechanical maintenance of the machine, logistical problems, dismantling of structures and complementary installations of the machine, and stops to adapt the shaft before the TBM passed through. Of all these stops, only nine were interventions in hyperbaric conditions, in some cases of which it was necessary to change tools. Figure 4 shows all the stops carried out for maintenance and tool change, in those cases where it was needed.
The Guster tunnel boring machine (UTE Tunnel Airport 2, UTE Line 9) began excavation in the Mas Blau attack shaft (KP 4 + 330) and moved towards Prat Airport, Terminal Entre Pistes (KP 0 + 214) (Figure 1).
The average advance speed along the entirety of Section 1D was 28.5 m/day, equivalent to 19 rings per day (not including the periods when the machine was stationary). Additionally, the maximum advance recorded by this machine, which was also a world record, was 90 m or 60 rings. Figure 5 shows the advance of the TBM in relation to the excavation time employed and the average speed reached with this TBM. In this case, five stops were made in shafts and stations for tool changes on the cutter wheel and one hyperbaric intervention, where a head check was performed but no tools were changed.

3.2. Main Factors Associated with Ground Movements Due to EPB Excavation

Many research projects have focused not only on the study of the movements generated by the EPB machine in the tunneling process but also on the control mechanisms that the TBM has at its disposal to minimize such movements. Some of these projects are presented in [1,3,6,12,14,20,21,22,23,24,25].
The process of excavating a tunnel involves an alteration in the original tensional state of the soil. These changes can be continuous or in stages, and are prolonged until a new state of equilibrium is reached. This stress alteration causes movements in the ground both at surface and at depth. Those movements extend into the ground until a considerable distance from the excavation face, and they have a marked three-dimensional character, except in areas far from the excavation face, where the behavior is close to plane deformation [26].
According to [3], there are five main differentiated factors associated with the generation of movements (Figure 6).
Deformation at the excavation face caused by relaxation of in situ stresses during excavation. In Figure 6, the settlements which originated before the passage of the cutting wheel are represented by the letter “A”.
Convergence of the excavated surface. If there is an over-excavation due to the outermost tools of the cutter wheel, then there is a convergence of the ground due to the conicity of the shield since the excavation diameter is greater than that of the back of the shield. Figure 6 shows the settlement induced during the passage of the shield, represented by the letter “B”.
Underfilling of the space between the back of the segments and the outside of the shield, called the gap. After the passage of the shield tail, the space between the excavation profile and the installed liner tends to close, generating movements in the ground. In Figure 6, this settlement is represented by the letter “C”.
Compressibility of the lining (segmental ring). This name includes the deformations of the loading of the lining. These movements are represented by the letter “D” in Figure 6. However, in relation to the magnitudes of components “B” and “C”, this movement can be considered negligible and very difficult to see in practical terms in the case of Section 1 of Line 9 [27].
Deferred deformations mainly attributed to the consolidation process. Fundamentally, the soil consolidation process in the construction of a tunnel with a TBM is due to the interstitial overpressures generated during the excavation process. The overpressure generated by the machine is transmitted through the porosity of the material, and it dissipates over time. These deformations are represented by the letter “E” in Figure 6.
Of the five factors mentioned above, the first and third are the two most important factors to consider in order to minimize the generation of settlements when excavating with TBMs. The final magnitude of the settlement will be given by the sum of all the components, “A, B, C, D, and E”.

3.3. Operational Control Parameters Used in Hades and Guster

The advantage of EPB tunneling is the possibility of providing substantial support to the excavated face at all times, thus allowing good ground movement control [28]. the excavation of the L9 Contract T1D, bentonite was systematically injected in the over-excavated annulus around the shield, and the tail void was always grouted simultaneous to the EPB shield advance, in order to improve ground movement control [22]. Three different pressures were systematically applied to the ground: the face pressure (P1), a bentonite pressure (P2), and the grouting pressure (P3), as shown in Figure 7 [16,29,30].
The relationship between operational parameters and ground deformation is a key aspect of tunneling performance. In this study, parameters such as face pressure, shield pressure, and grout injection volumes were systematically analyzed to evaluate their influence on settlement control. The findings align with previous research, particularly the study by [31], which investigated the effects of twin EPB tunneling on a historical masonry building in Shanghai soft clay. Their research demonstrated how variations in face pressure and advance rate influenced settlement patterns, emphasizing the need for adaptive parameter control. Furthermore, [32] conducted a study on cutter wear evaluation from operational parameters in the EPB tunneling of Chengdu Metro, showing how the optimization of these parameters can improve tunneling efficiency and mitigate ground movements. The study by [33] on ground deformation characteristics induced by mechanized shield twin tunneling along curved alignments provides further insights into how operational adjustments are essential when tunneling along curved routes, highlighting the challenges of maintaining ground stability under such conditions.

3.3.1. Face Pressure (P1)

The fundamental principle of an EPB (Earth Pressure Balance) tunneling machine is to use the excavated material to balance the face pressure, preventing collapses and minimizing surface settlements. The key to the EPB’s operation is maintaining equilibrium between the ground pressure and the internal pressure within the excavation chamber (face pressure). This is achieved through several mechanisms. First, inside the excavation chamber, the extracted soil is retained within a pressurized chamber behind the cutterhead. This pressure represents the pressure at which the excavated material is located in the excavation chamber.
The excavated material behaves like a dense fluid, transmitting the necessary pressure to prevent face collapse. Additionally, this pressure is controlled by an Archimedean screw conveyor (Figure 7), which regulates the extraction rate of the material and the flow of soil into the transportation system. If the pressure is too low, the extraction rate is reduced; if it is too high, the rate is increased to avoid overpressure. This pressure is continuously measured by seven sensors or pressure-measuring cells located at the back side of the EPB machine’s cutter wheel (Figure 8), ensuring that face pressure remains within the optimal range to maintain stability.
This system makes EPB tunnel boring machines ideal for soft, cohesive, or mixed ground conditions, where maintaining face pressure is essential for safe and efficient excavation.
In addition, the values of the face pressure (P1) along Section 1 vary between 1.00–3.50 bar approximately, with an average pressure of 2.60 bar. In areas where the TBM was stopped, bentonite was injected to maintain this face pressure.

3.3.2. Bentonite Slurry Pressure Around the Shield (P2) and (V2)

In some areas of Line 9 of the Barcelona Metro, the difference between the excavation diameter and the outer diameter of the shield tail can reach up to 6 cm of separation [27], causing large movements in the ground. To solve this problem, the first thought was to inject a product with a gel structure that would harden over time. Finally, the initial tests carried out on Line 9 of the Barcelona Metro allowed the successful development of the filling of this “gap” with bentonite slurry at a pressure similar to that existing in the chamber, a pressure controlled by cells attached to the inner face of the metal shield wall [34] and which will be called (P2). The main reason for this volume of injected bentonite slurry (V2) is to provide additional support in the middle zone between the cutter wheel and the shield tail. In addition to decreasing the friction between the shield and the surrounding ground, it also reduces the total thrust that the TBM must exert in the advance.
The bentonite injection pressure system of both the Hades TBM and the Guster TBM is regulated by six pressure-measuring cells attached to the inner face of the metal shield wall. The bentonite injection pressure in the shield varies between 1.5 and 2.5 bar.
The following are the physical and mechanical characteristics of bentonite (Table 2).

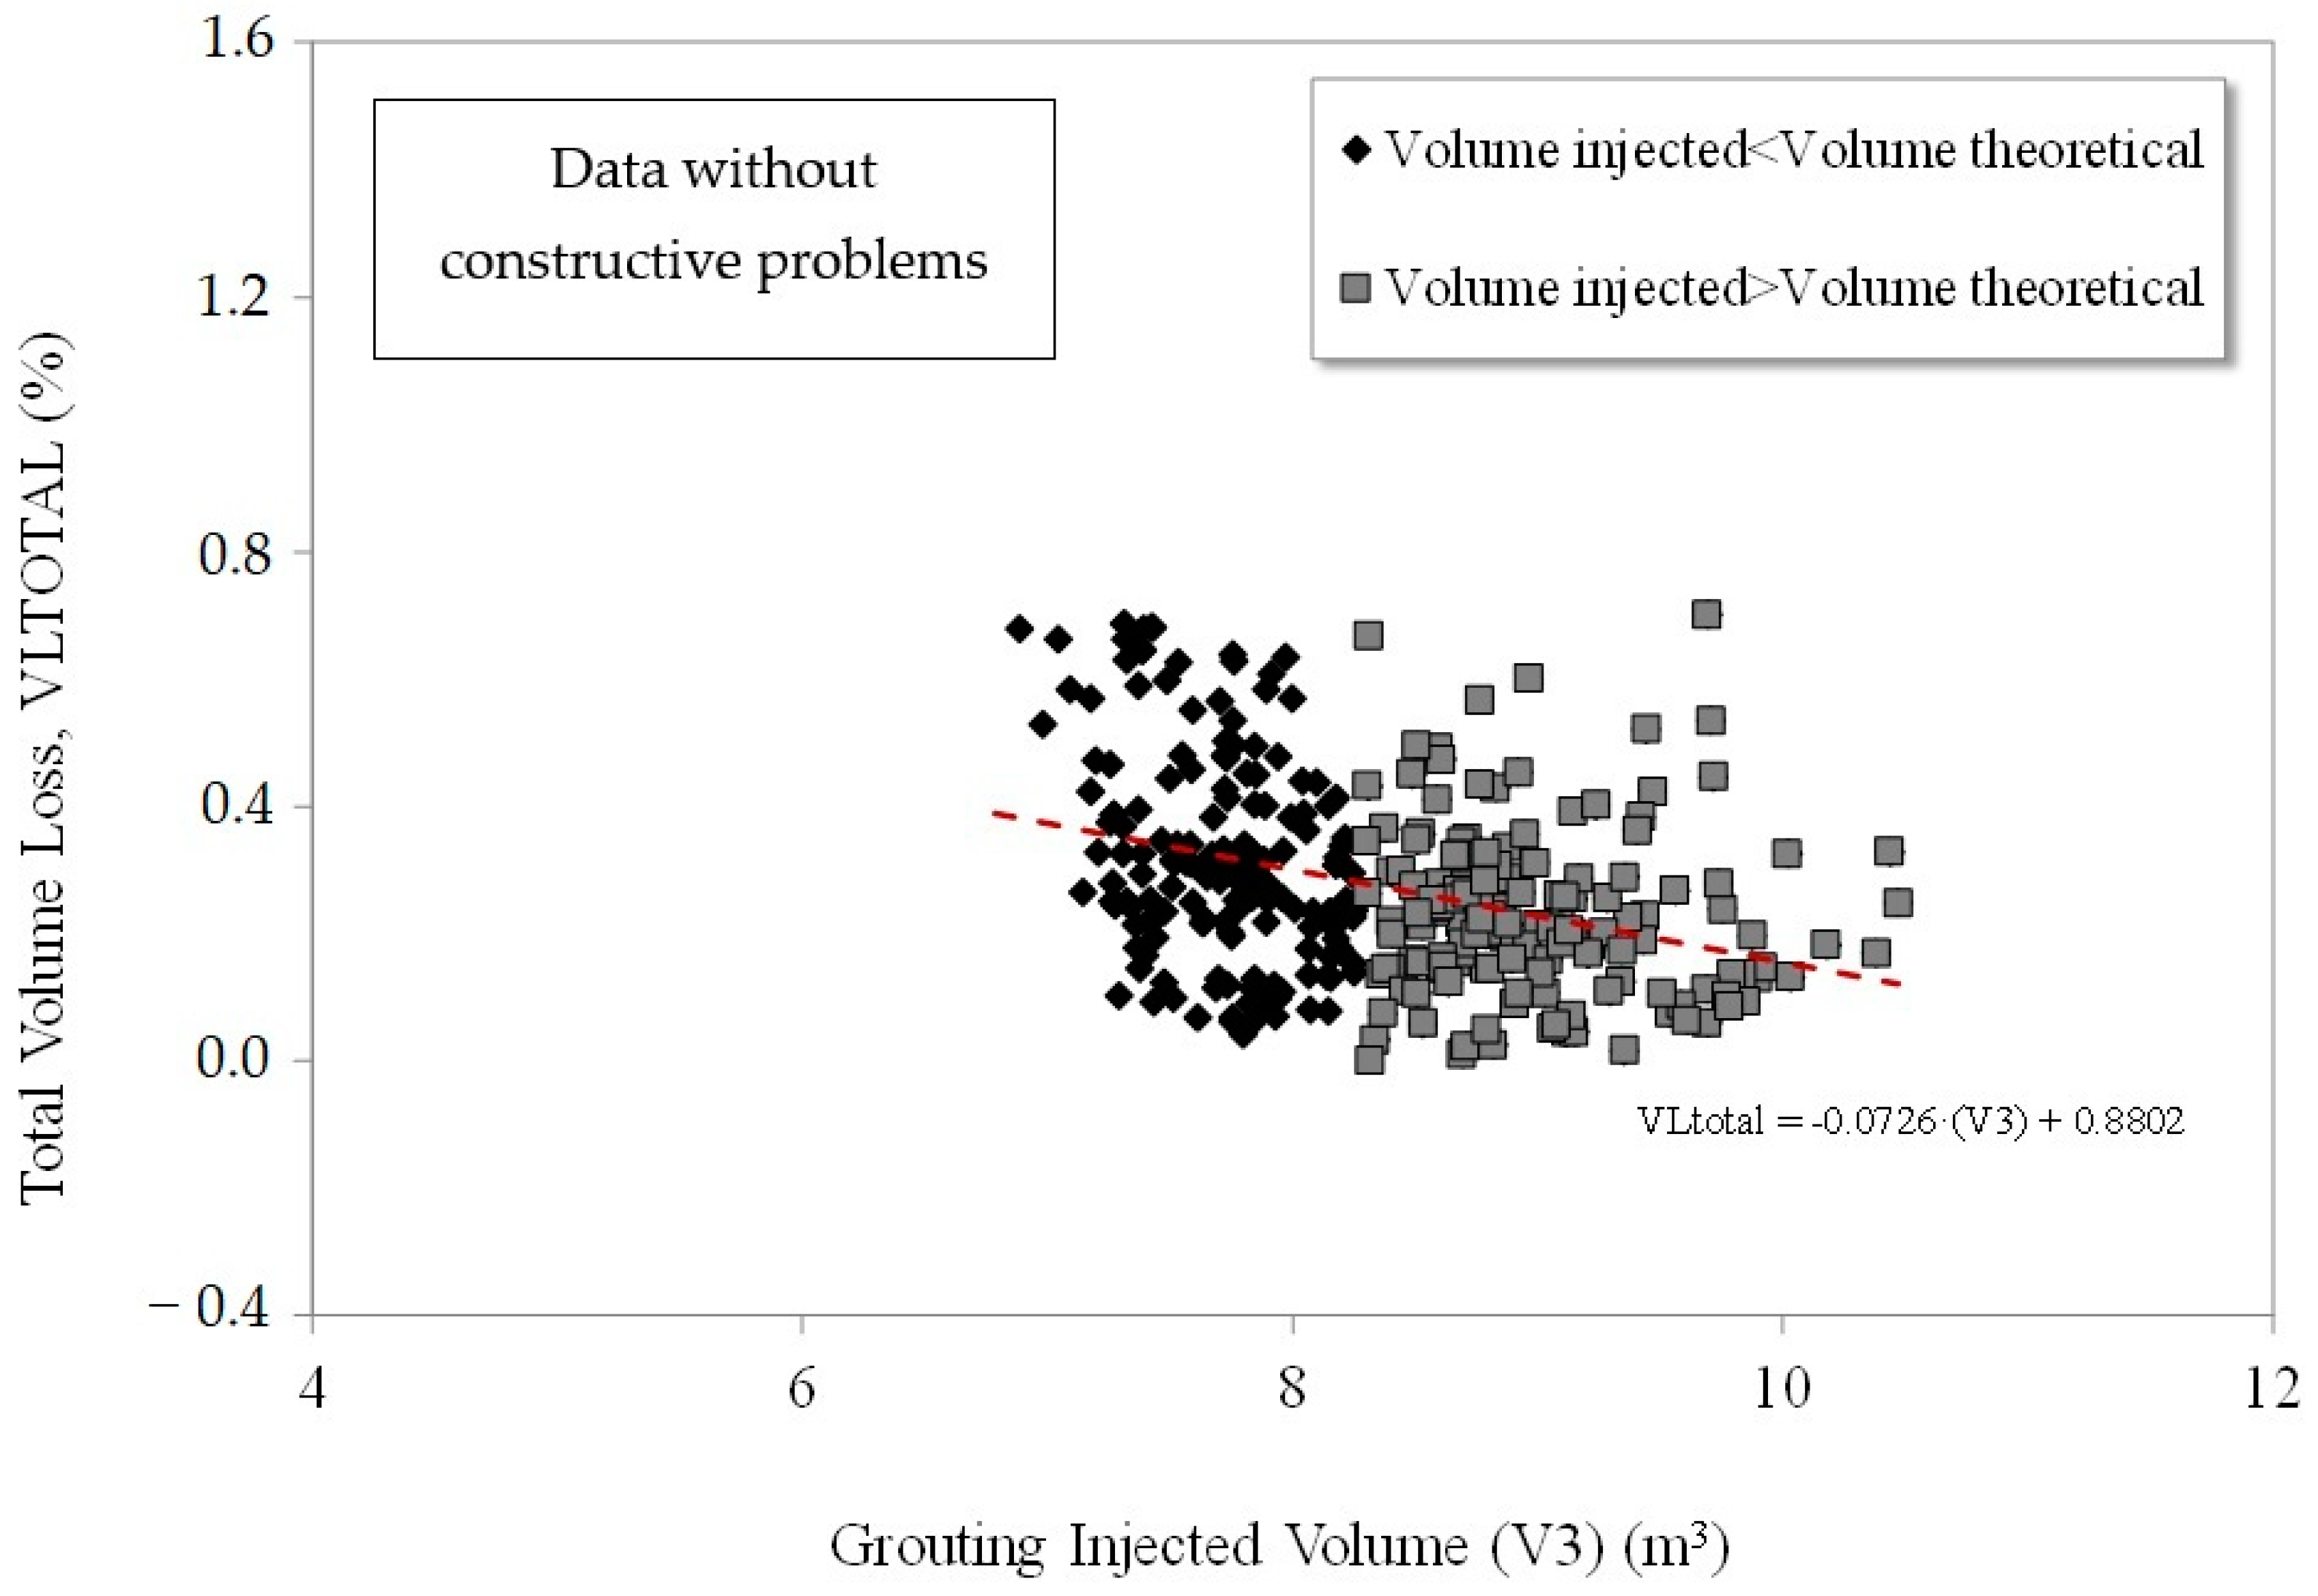
3.3.3. Pressure and Volume of Grouting Injected into the Shield Tail (P3) and (V3)

The excavation section of the Hades TBM as well as the Guster TBM is 69.84 m² (Ø maximum diameter = 9.43 m), while the outer section of the lining ring, once in place, is 64.61 m² (Ø = 9.07 m). Given that the advance per ring is 1.5 m, this results in a maximum theoretical gap of 7.85 m3 per installed ring.
Considering a correction factor of 1.15—accounting for pressure loss in injection lines, groundwater seepage, and additional material injected through the shield—the final injected volume per ring is adjusted to 8.26 m3.
Moreover, the EPB TBMs in charge of excavating Section 1 of Line 9 have six injection points for grouting, distributed around the perimeter of the shield tail. The injection pressure at these points typically ranges between 2.5 and 3.5 bar.
Figure 9 illustrates the process of bentonite injection to fill the excavation gap and the subsequent grouting injection at the shield tail to ensure proper contact between the tunnel lining and the surrounding soil.
The following are the physical and mechanical characteristics of grout (Table 3).
Therefore, the TBMs record other parameters, such as the thrust made by the machine to advance, the torque of the cutting wheel, etc. Table 4 summarizes the average values of the most relevant operational parameters in relation to the generation of possible movements in the ground of the two EPB machines used in the excavation of Section 1 of Line 9.

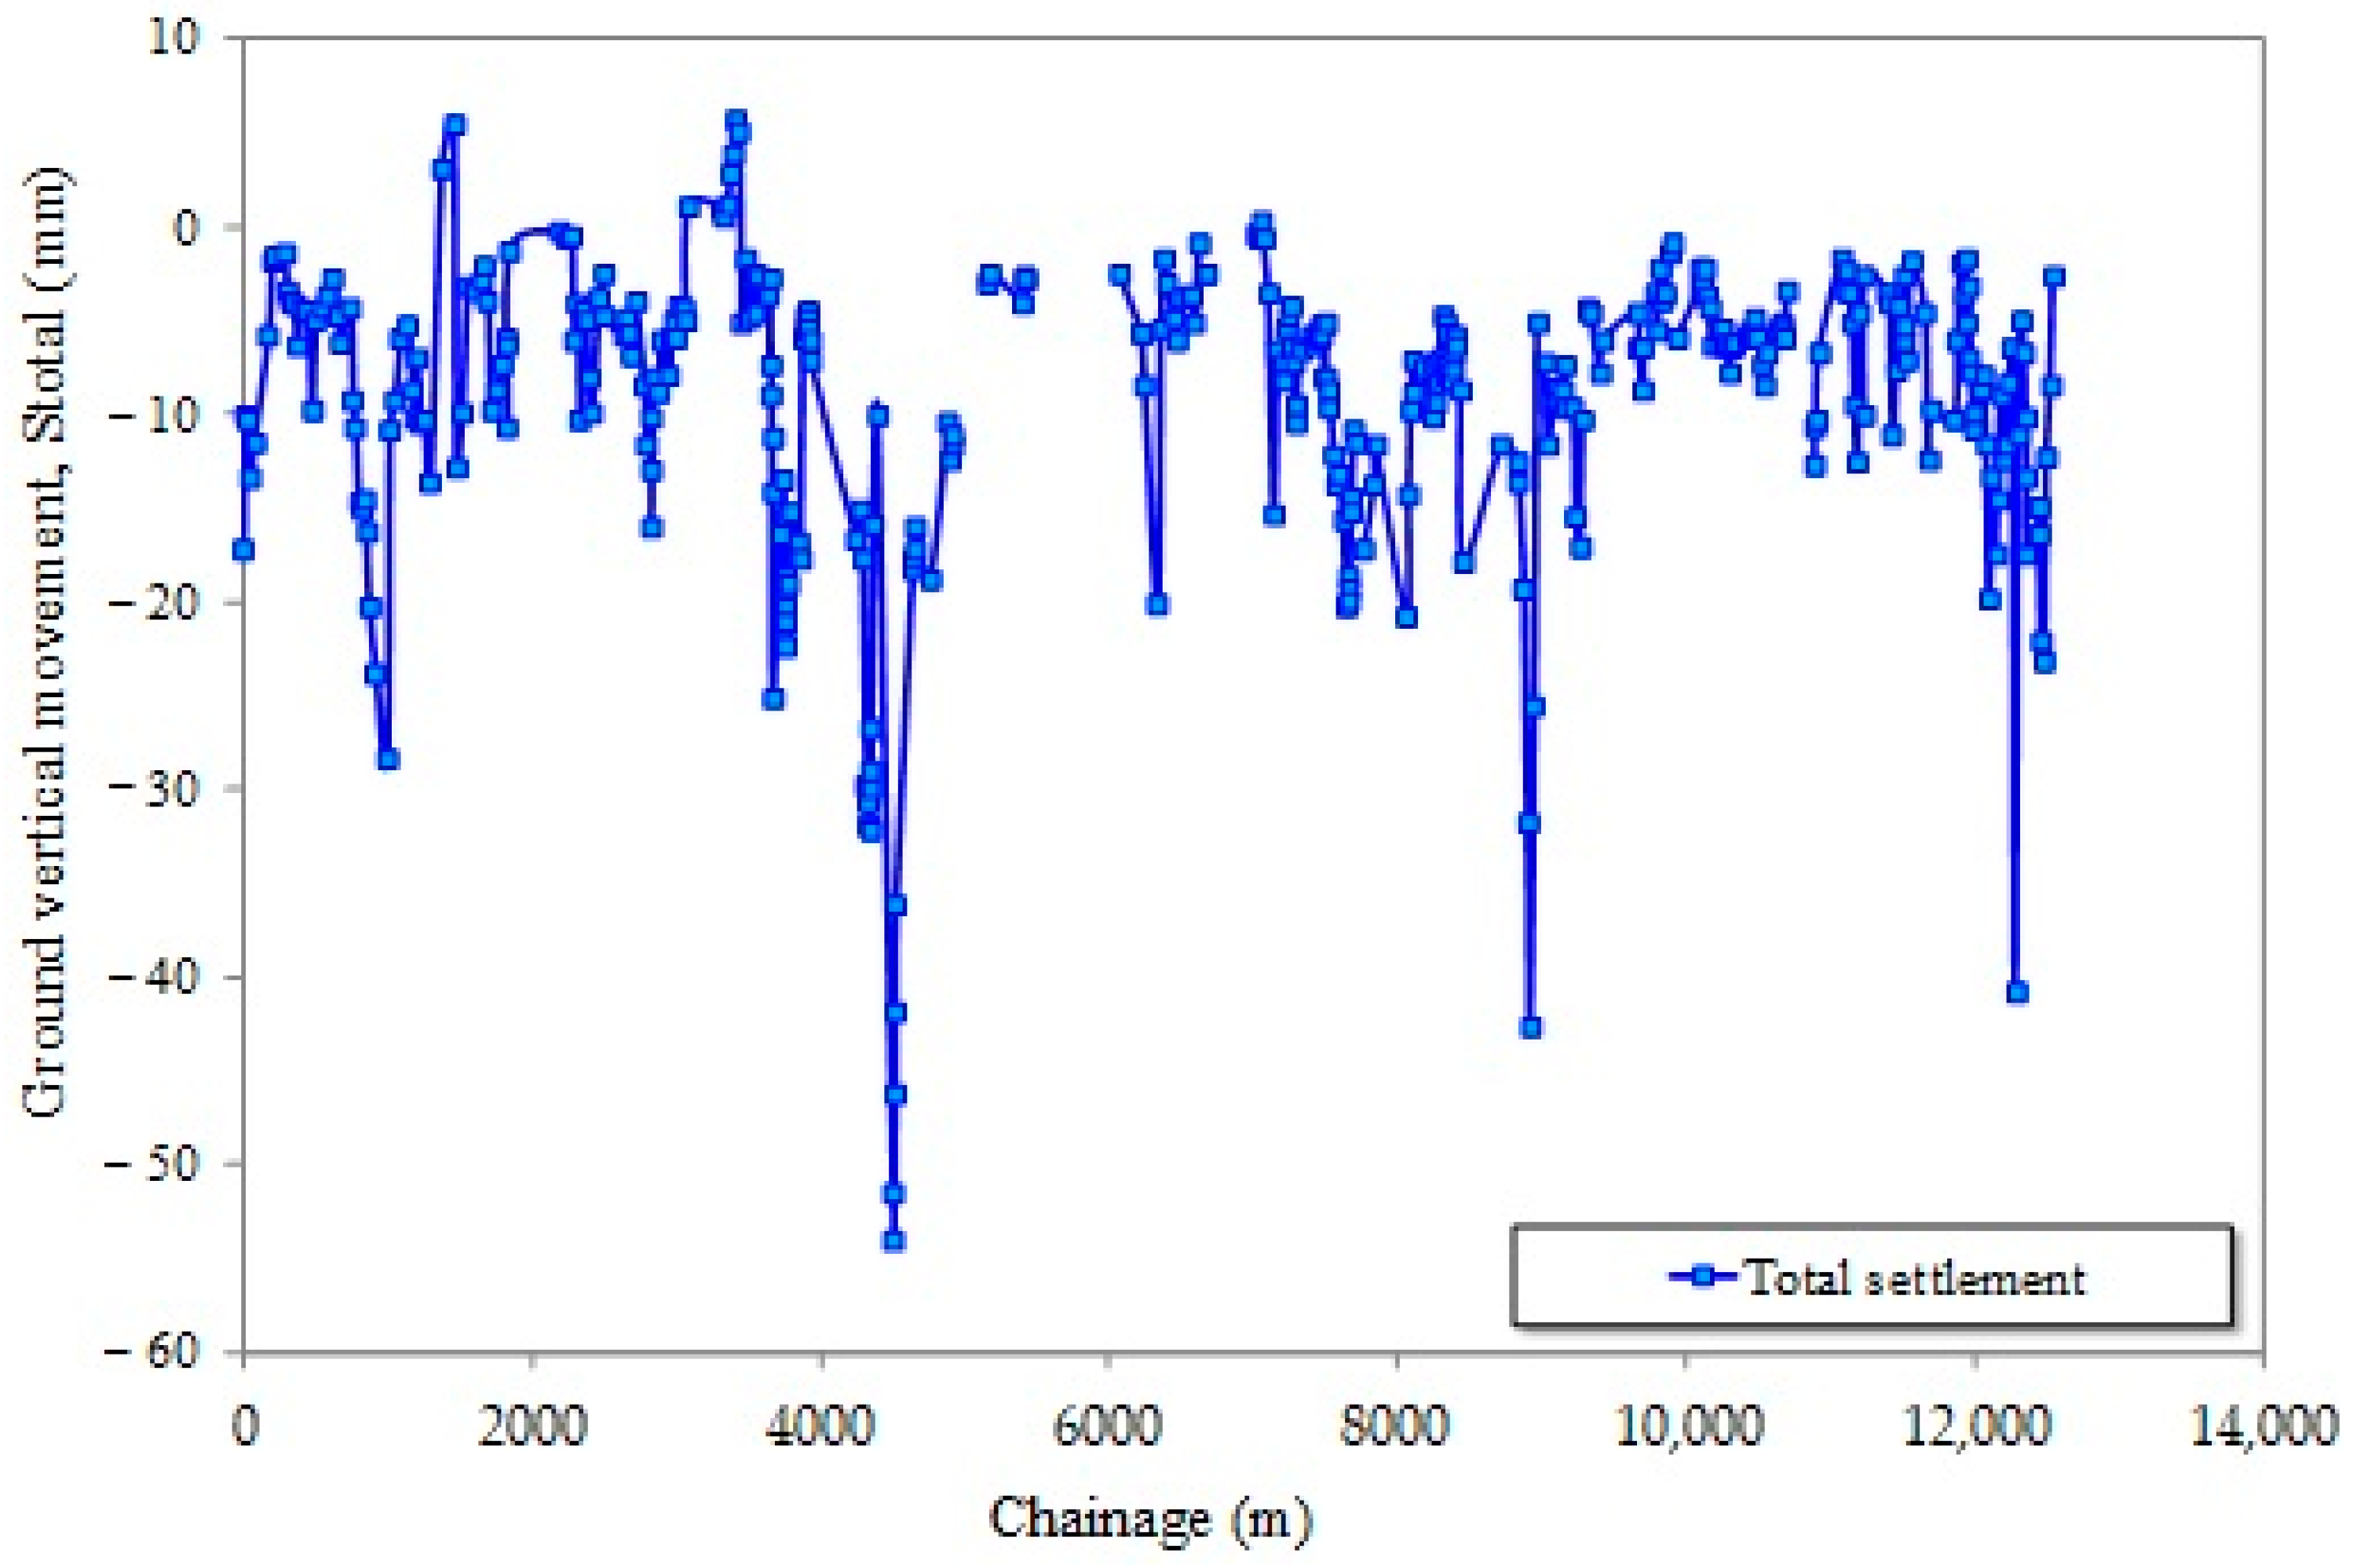
4. Surface Ground Movements

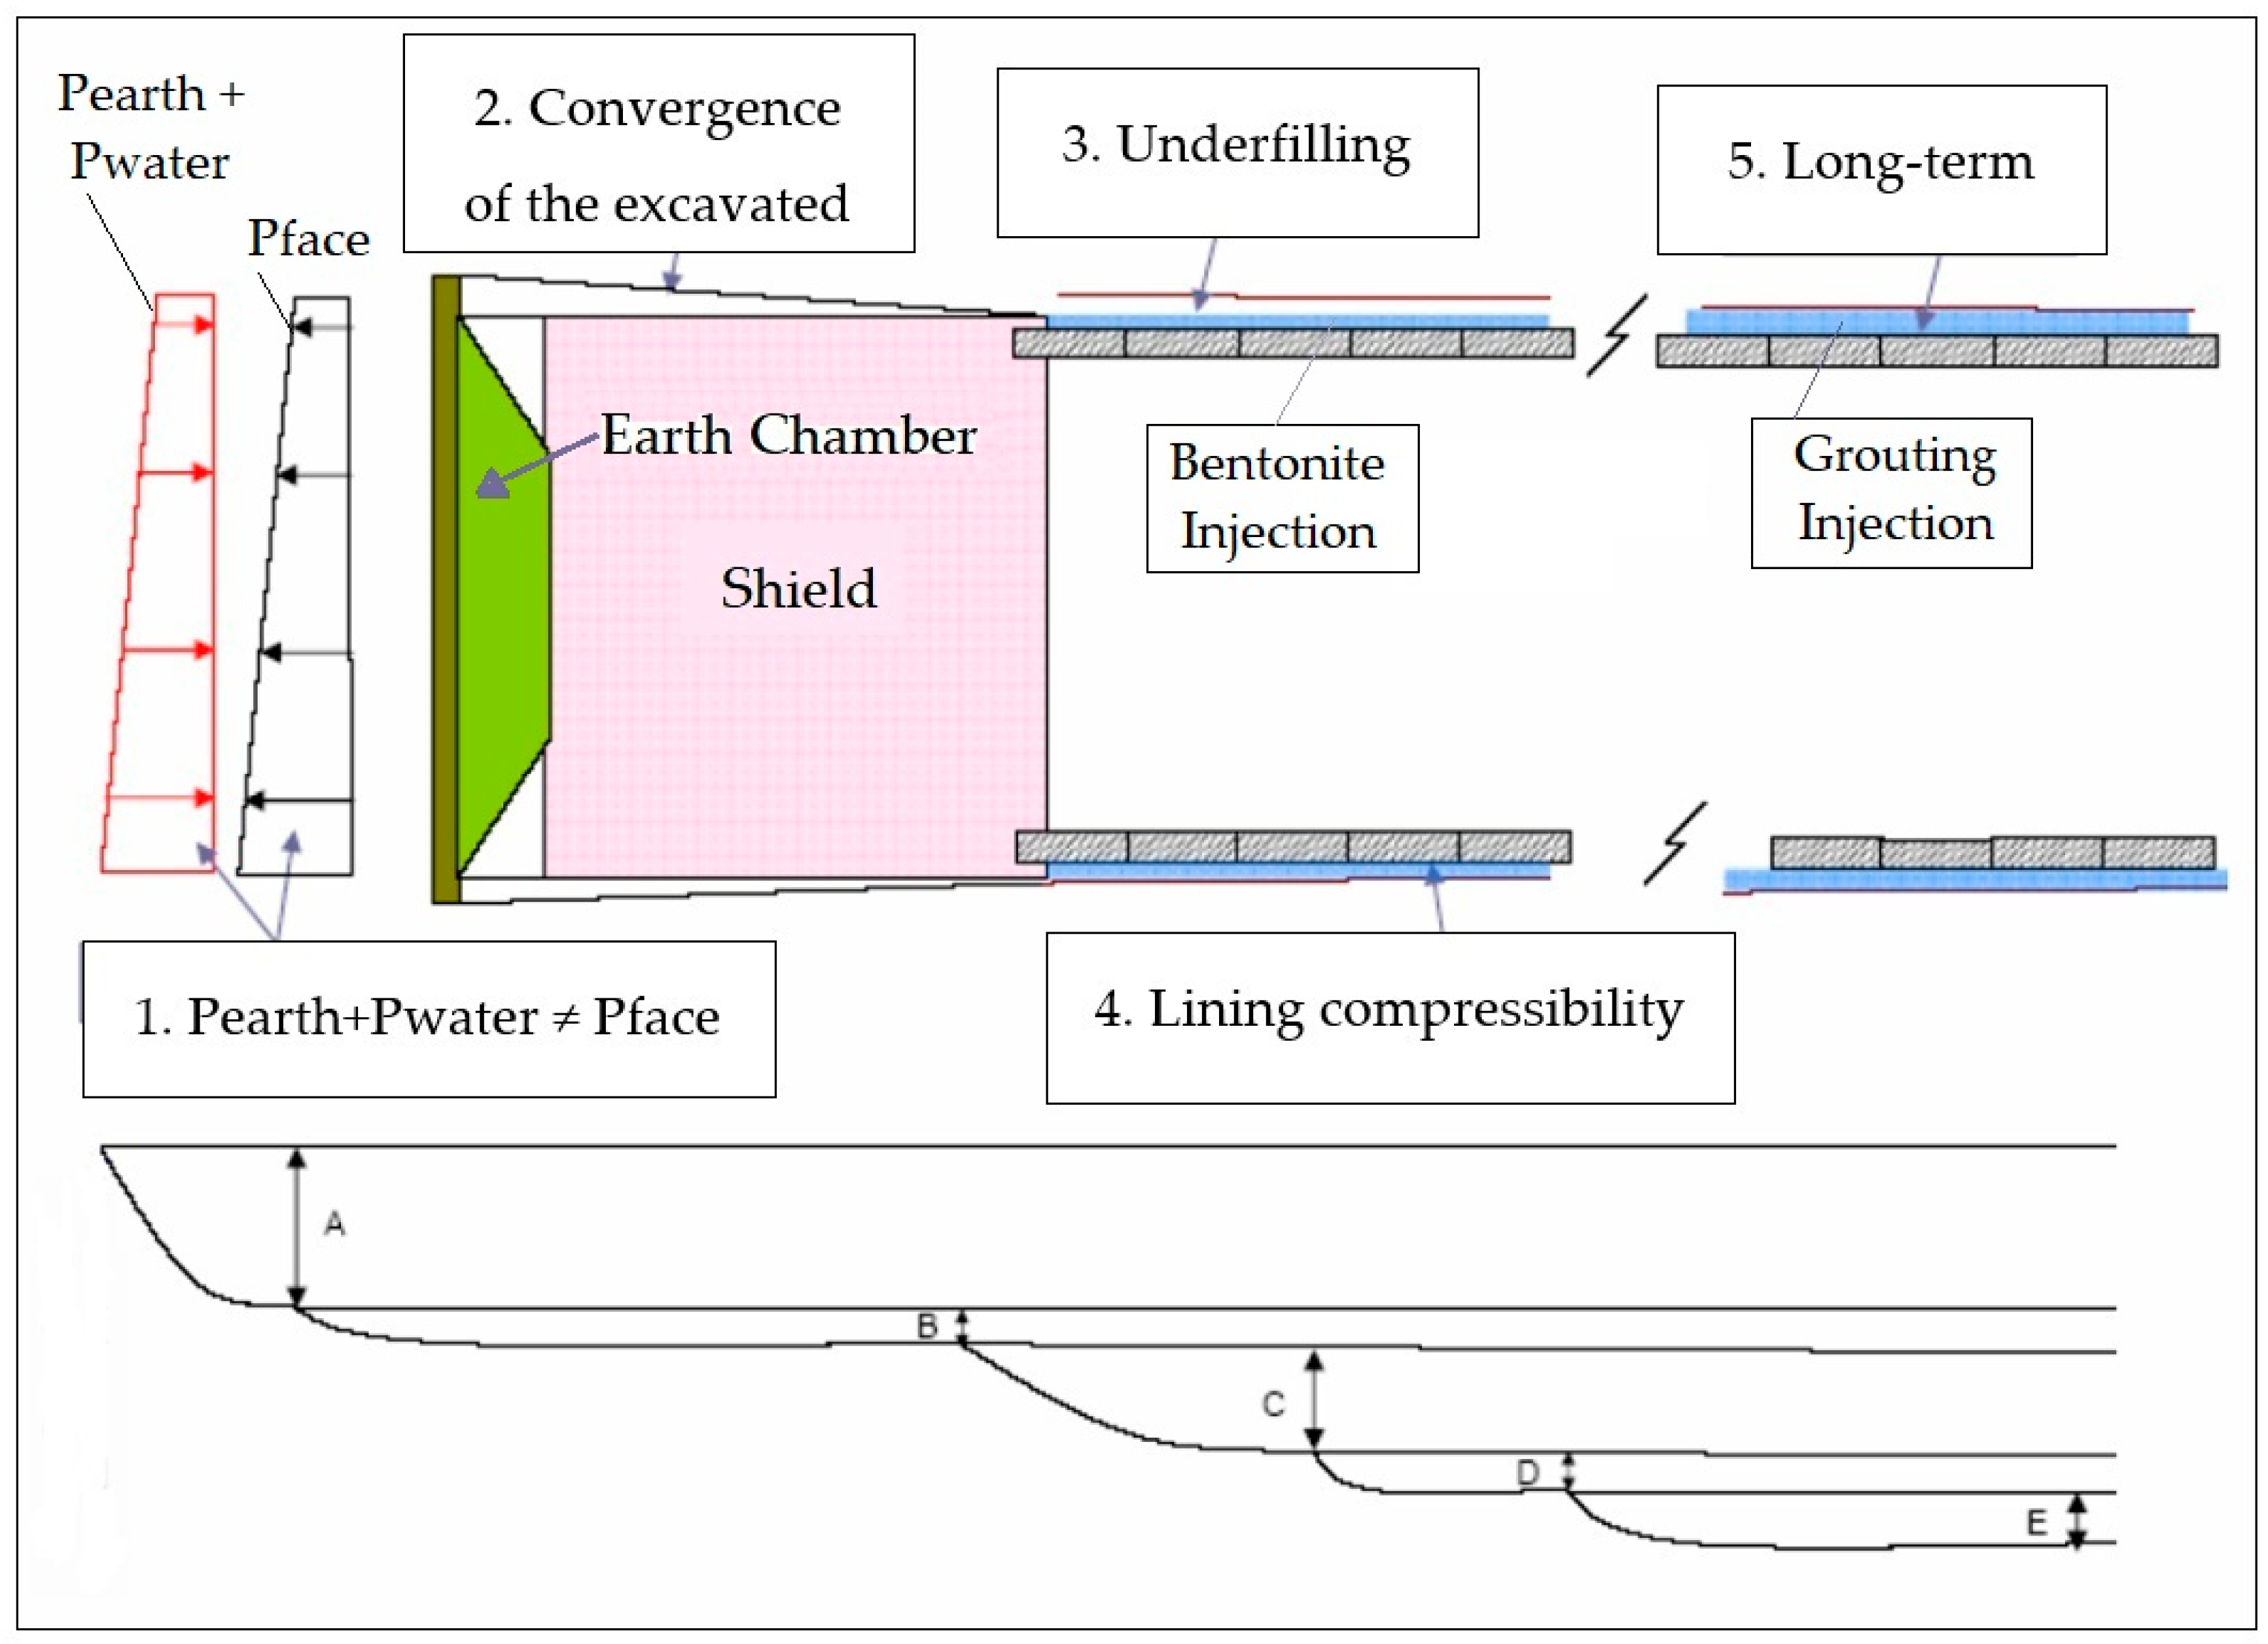
4.1. Components of Ground Settlement Due to EPB Tunneling

In order to define how the excavation process influences the ground settlement, five settlement components have been defined. Firstly, the one measured at the excavation face (∆S1) associated with the relaxation of the state of stresses in the face associated with the excavation process (1). Secondly, the settling due to the shield passage (∆S2), associated with the over-excavation around the shield and the machine operator’s own experience (2). Thirdly, the seating due to the closure of the space at the tail of the shield and the possible deformation of the liner (∆S3), associated with the closure of the space between the external diameter of the shield and the excavation known as the “gap” (3), and with the deformations of the installed support (4). The latter is a fourth component that occurs before the settlement temporarily stabilizes, (∆S4), being (Sshort-term = ∆S1 + ∆S2 + ∆S3 + ∆S4). The fifth and last component is the settlement that occurs in the long term due to consolidation processes. (∆S5), generated after the excavation process (5), is the sum of all of them, the total or long-term settlement (Stotal = ∆S1 + ∆S2 + ∆S3 + ∆S4 + ∆S5).
Figure 10 shows the variation of vertical ground settlement as a function of distance from the tunnel face at a surface point above the tunnel crown. The magnitude of the displacements is small, but the measurement recording frequency of the levelling milestones is sufficient to identify the different individual responses previously mentioned. Moreover, in Figure 10, we can see how the ground movements on the surface begin to occur when the distance between the TBM and the monitored section is less than about 50 m. At several points along the route, it can be noticed that the ground surface shows small elevations in the meters close to the excavation face. The rise shortly before the excavation face decreases to settlement values, in most cases (Zone A). During the passage of the shield through the monitored section, it was observed, in many of the cases studied, that during the 10 m of length of the shield zone the settlement decreased or stabilized with the injection into the shield zone and then continued to increase (Zone B). After the passage of the shield through the monitored section, approximately 10–20 m, the ground surface movement slows down again with the injection at the back of the shield. At 100–150 m after the TBM passes through the monitored section, the surface settlement is partially stabilized (Sa short-term) (Zone C) and, finally, at about 300–500 m after the passage of the machine, the surface settlement can already be considered a final settlement (Sa long-term), as it can be considered to have finished the entry due to the consolidation process (Zone D). The sum of all journal entry components is the total entry (Stotal). The dashed lines in Figure 10 indicate the transition between Zones A, B, C, and D.

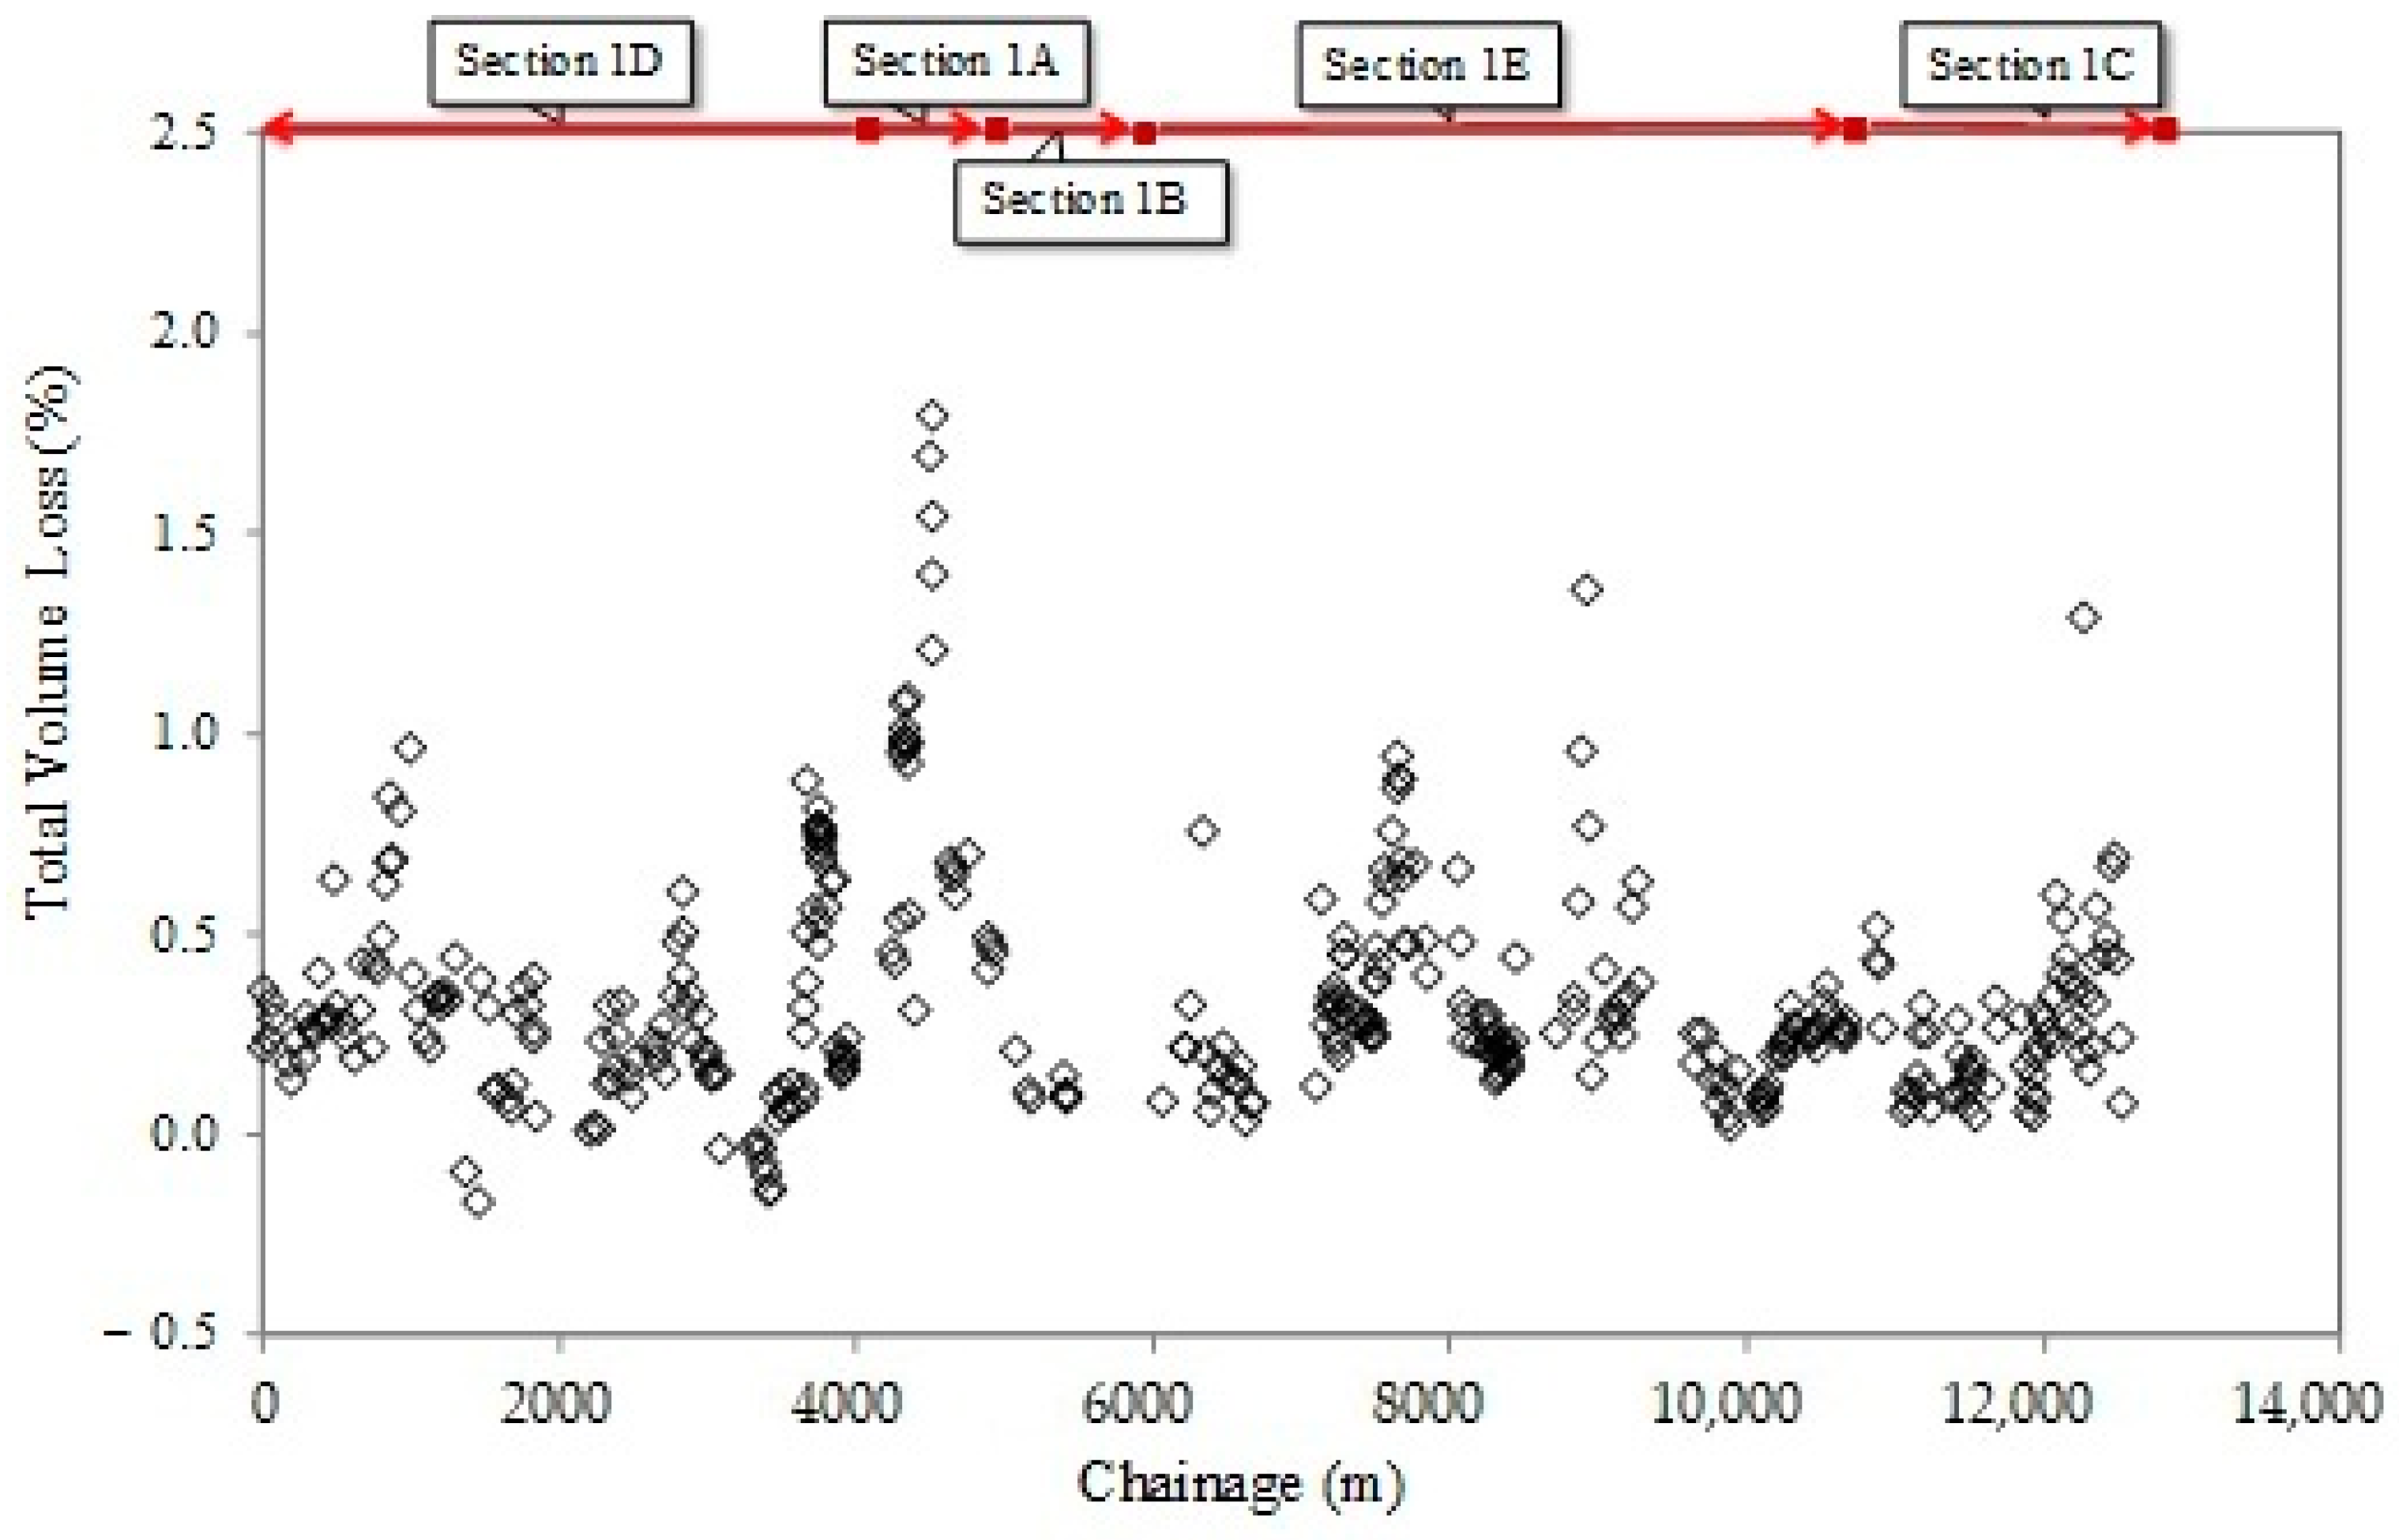
4.2. Ground Movement in Section 1

According to [22], the proportion of seats generated up to the passage of the EPB, at the excavation face (Sface), is estimated to be 0.1–0.4 times the maximum seat.
Figure 11 and Figure 12 show the settlement measured up to the excavation face and the total settlement along the route of the tunnel in Section 1 of Line 9 of the Barcelona Metro. The settlement at the excavation face (Sface) does not exceed −5 mm in most cases and corresponds to 10% of the total settlement (Stotal), a value that falls within the lower range proposed by [22]. There are some specific points where this measure is clearly exceeded, as shown in Figure 10. All points with a higher value of settlement are called singular points of the layout and, except for one, are all due to construction problems.
In the case of the total settlement (Stotal) produced by the excavation process (Figure 12), the same points with higher settlements in the excavation face also give way to higher total settlements sometime after the passage of the TBM. In addition to these already known points, some more are added due to waterproofing problems in some of the maintenance shafts or grouting injection errors in the shield tail (Stail).
According to [22], the settlement produced at the shield tail (Stail) is equivalent to 40–50% of the total settlement (Stotal). In the case of settlements collected on Line 9, in the 86 sections studied, for which seating data are available for the shield area and/or at the shield tail, the highest proportion of settlements also occurs at the shield tail (Stail). This is due to the closing of the gap (the space between the outer diameter of the tail of the TBM shield and the excavated ground) in this area. These settlements in the tail of the shield represent an average value of 37.23% with respect to the total settlement (Stotal), very close to the percentage of 40–50% of the total settlement (Stotal) mentioned by Wongsaroj in 2006. In addition, this settlement continues to increase until approximately 100–300 m past the excavation face (Sa short-term). In this case, the short-term settlement reaches 100% over the total settlement (Stotal), in many cases with an average value of 83.5%.

4.3. Measurement of Volume Loss Above the EPB Crown

In Section 1 of Line 9 of the Barcelona Metro, the geological profile consists of clay and silt with sandy intercalations, as well as sandier materials with gravel intercalations. Given this stratigraphy, the entire profile was initially considered as a uniform unit along the tunnel alignment.
Meanwhile, the settlement caused by tunnelling is usually characterised by volume loss or soil loss (Vloss), which is the volume Vs expressed as a percentage of the theoretical excavated volume of the tunnel and D is the tunnel diameter (1):
Vloss = Vs/π·(D2/4)
Henceforth, ref. [17] showed that the trough-width parameter at surface level (i) can be estimated with the following expression (2):
i = K·z0
Subsequently, this expression where the parameter K depends on the soil type and z0 is the depth of the tunnel axis. The K parameter varies between 0.4 and 0.7 for stiff to soft clays, respectively, and between 0.2 and 0.3 for granular material [17]. Based on their findings, they proposed an average K value of 0.5 for cohesive soils and 0.25 for granular soils.
A preliminary assumption was made that a K value of 0.5 would be representative of the ground conditions. This hypothesis was subsequently validated through an analysis of 43 settlement basins, confirming that K = 0.5 provides a reliable estimation for calculating ground volume loss based on actual field data [15].
Using K = 0.5 and applying the equation proposed by [17] (1), a theoretical value for the parameter “i” (the width of the surface Gaussian settlement trough) was determined. This theoretical “i” value, combined with the maximum settlement recorded by the monitoring data along the tunnel route, allowed for the calculation of ground volume loss according to Equation (2). The results, presented in Figure 13, depict the evolution of volume loss along the tunnel alignment in Section 1, expressed as a percentage, and plotted against tunnel advance in meters. The settlement data used in this analysis correspond to the total recorded settlements (Stotal).

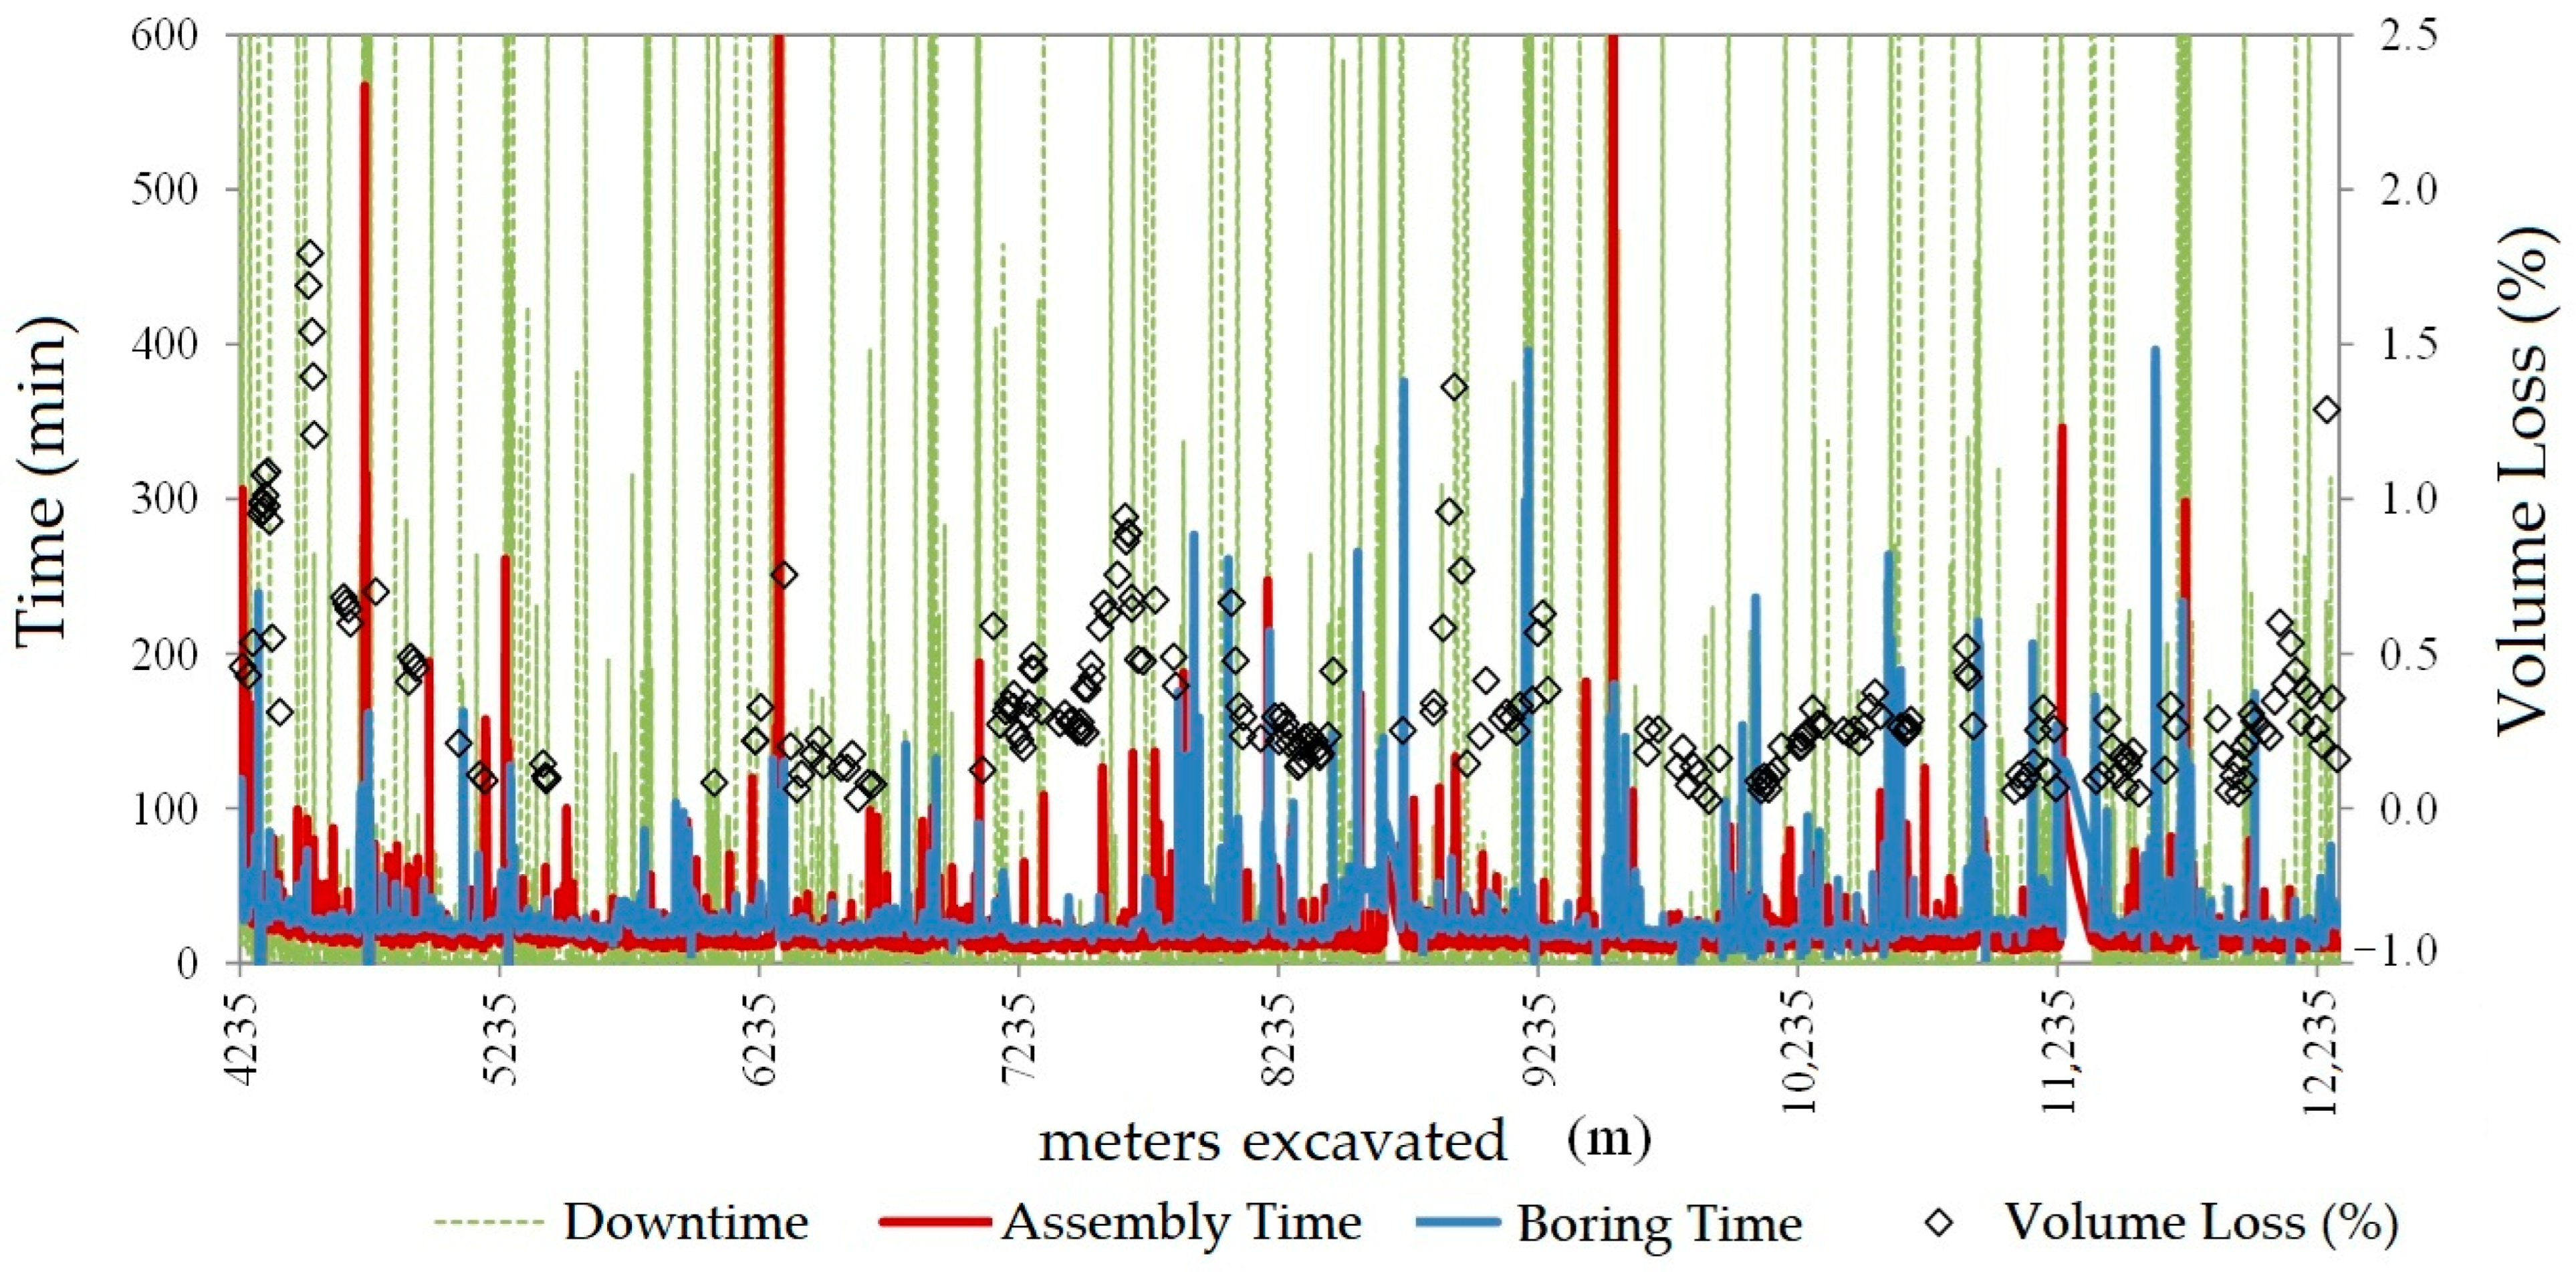
4.4. Correlation Between Ground Volume Loss and EPB Operation Variables

Many tunnel construction projects worldwide have demonstrated that excavation parameters in shield-type TBMs significantly influence ground movements induced by excavation. Precise control of these parameters is essential to minimizing settlements [18,35,36].
In our study, multiple factors affecting ground response were considered, including TBM operational parameters and grouting techniques. To minimize the influence of external variables and ensure an accurate evaluation of each parameter’s impact, a systematic approach to controlling conditions was adopted:
  • Homogeneous Geological Conditions: Study sections with similar geological characteristics within the deltaic terrain were selected to ensure that observed variations in ground response were not due to stratigraphic or groundwater level differences.
  • Control of Operational Parameters: When analyzing the impact of injection techniques, key TBM variables were maintained within restricted operational ranges. Specifically, face pressure (1.0–3.5 bar), advance speed (80 mm/min suggests a relatively controlled advance), and soil extraction rates (50 m3/h, indicating the maximum capacity for evacuating the excavated material) were regulated to prevent cross-effects influencing the results.
  • Distinction Between Injection Techniques: Two primary injection methods were evaluated:
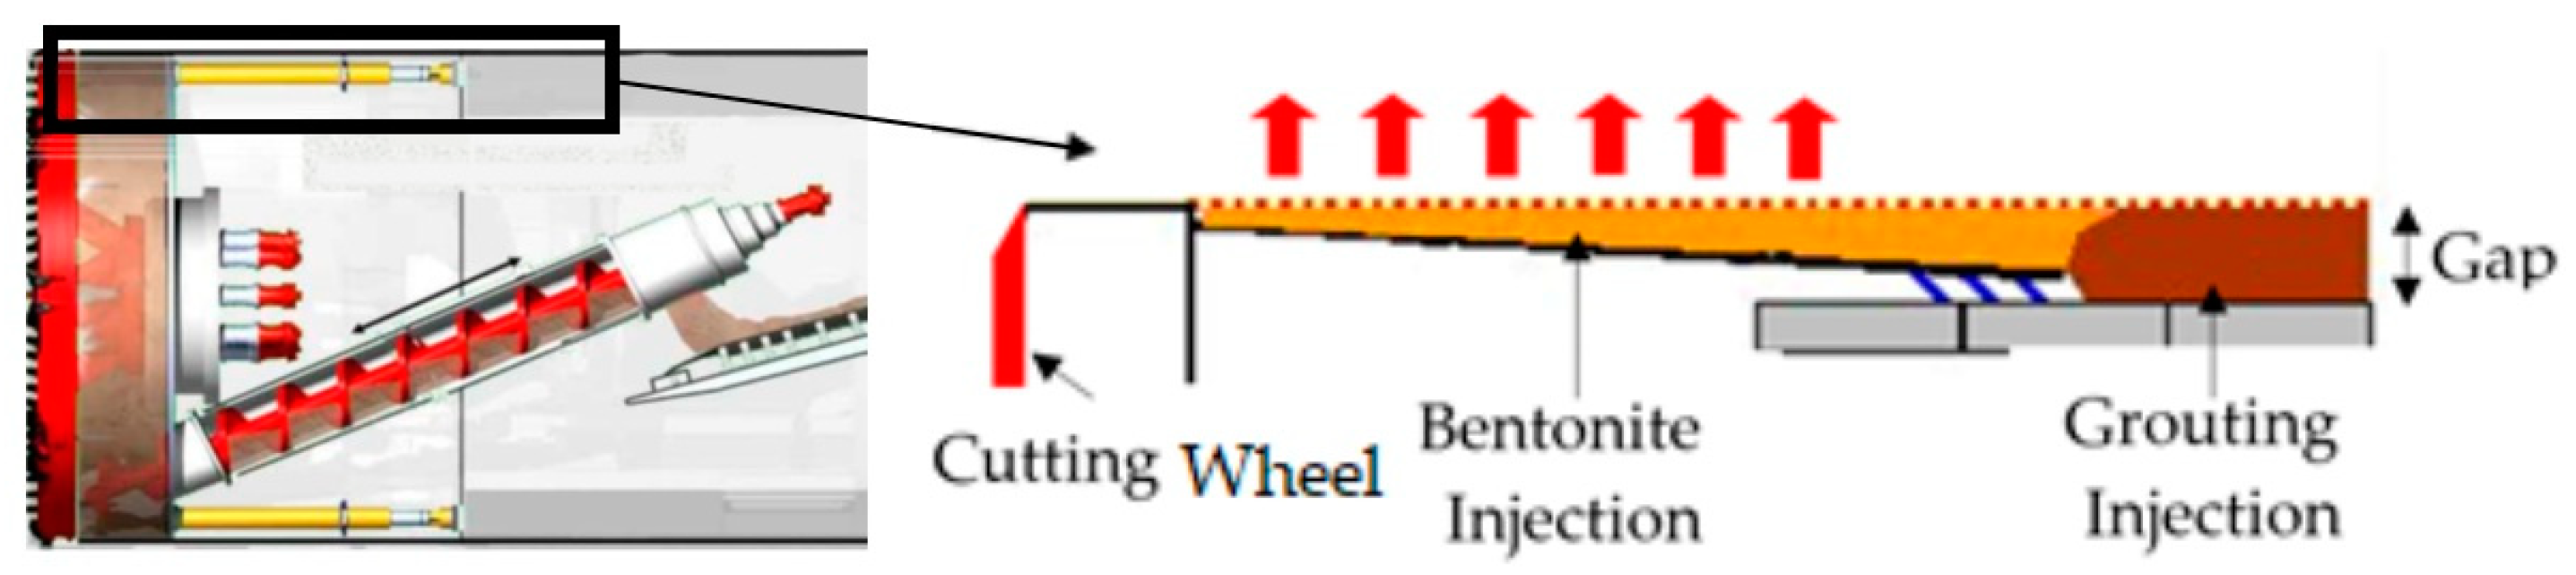
    Bentonite injection around the TBM shield: Implemented to fill over-excavation voids and enhance ground stability during TBM passage. This technique was innovative, and its effectiveness was analyzed by comparing sections with and without its application while keeping other parameters constant.
    Tail void grouting: Used to fill the annular gap between the tunnel lining and the surrounding ground. Various grout formulations and injection pressures were tested to assess their influence on settlement mitigation, ensuring consistency in application time and materials.
  • Back-Analysis of Significant Settlements: In cases where settlements exceeded expected values, a retrospective analysis was conducted, considering TBM parameter records and injection conditions. This allowed for identifying correlations between operational variables and ground response, further validating the applied control methods.
In the case of Section 1 of Line 9 of the Barcelona Metro, these operational parameters were recorded by the TBM at 10 s intervals and subsequently processed using the FORTRAN program. This section of the case study examines the possible influence of these parameters on ground volume loss.
Regarding face pressure (P1), several authors have studied its effect on volume loss [9,10,12,19,37,38].
Additionally, studies by [39,40] further analyze the effects of face pressure and TBM operation on soil displacements. Experimental approaches, such as those by [41], have also investigated the TBM–soil interaction under controlled conditions. However, in our analysis of pressure data, no clear evidence was found that an increase in both face pressure and volume injection leads to a reduction in ground volume loss.
According to [5], an increase in pressure improves face stability but does not necessarily result in reduced settlements. This finding aligns with the data presented in Figure 14, which shows total volume loss as a function of face pressure (P1), normalized with respect to tunnel overburden pressure. As observed, there is no clear trend indicating that higher face pressure values lead to a decrease in total ground loss, a conclusion also supported by [13]. Similar findings have been noted in other tunnel projects, where settlement patterns do not always correlate directly with applied pressures [42,43,44].
In our case study, this lack of correlation may be attributed to the low variability of recorded log data. Fargnoli suggested that it could also be due to the limited amount of monitoring data analyzed. Nevertheless, it has been observed that, when face pressure is within the range of 1.8–3.2 bar—or, in other terms, when the face pressure relative to overburden pressure is between 0.53% and 0.90%—total ground volume loss remains below 0.8%. In some instances, this threshold was exceeded, as shown in Figure 14. However, these anomalies were caused by specific issues, referred to as singular points, which were previously mentioned in Section 4.2 and will be further explained below.

Influence of Injection Volumes

The influence of injection volumes on ground volume loss has been extensively analyzed in previous research [9,13,38]. These studies highlight the direct role of tail-grout pressure in settlement control, a phenomenon also examined through numerical and experimental approaches [21,41,45].
In this study, the theoretical injected volume per installed ring was estimated based on the external and internal diameters per segment length. In cases where the actual injected volume was lower than the theoretical value, slightly higher settlements were observed, affecting both short-term and total ground volume loss (Figure 15). Similar trends have been reported in previous studies on TBM tunneling in urban environments [43,46].
Figure 15 illustrates that, when the injected volume exceeded the theoretical value, total ground volume loss rarely exceeded 0.5%. Furthermore, the regression analysis in Figure 15 confirms that, in most cases, the injected volume was lower than the theoretical requirement. This aligns with existing research, demonstrating that inadequate grouting pressures can lead to increased settlements [39,44].
Additionally, the influence of soil properties on this behavior has been explored in studies by [40,45], which highlight the role of soil density and permeability in controlling volume loss.
Moreover, experimental studies have provided valuable insights into TBM-induced settlements in greenfield conditions, as seen in the physical modeling work by [35]. These findings, along with numerical models [36,46], emphasize the importance of considering multiple factors—beyond face pressure and injection volume—when assessing tunnel-induced settlements.
In addition, Figure 16 presents the variations of certain EPB performance variables during the advance through Section 1. The pressure and injection values shown are the moving average values for every 100 values recorded by the EPB. The volume losses derived from the surface settlement measurements range between 0.0% and 1.8% (Figure 16a). The face pressures (P1) range between 1.00 and 3.50 bar (Figure 16b), and the pressure at the shield tail ranged between 2.5 and 3.5 bar with a volume of injection of 6.5 and 10.0 m3 and a theoretical value of 7.85 m3 (Figure 16c). As we can see, and as we have already mentioned, there is no clear relationship between the loss of ground volume and the face pressure or the tail injection pressure.
Variations in the average weight of excavated material, measured on the conveyor belt, are presented in Figure 16d, with values given in tons per lining ring advancement (1.5 m). Although the excavated soil was mixed with soil conditioning foams, which would have changed its bulk density (Figure 16d), the resulting weights give a useful indication of the amount of excavated soil. The weight of excavated materials was more or less constant, although with some irregularity, ranging (160–240 t/ring). A theoretical weight value (around 210 t/ring) of soil excavated by a 9.43 m cutter wheel head was used, assuming an average unit weight of 20 kN/m3 for the deltaic materials of El Prat de Llobregat (dashed line, Figure 16d). Apart from the added conditioning, the weight is in some cases higher than the theoretical value of “over-excavation” by the cutterhead, as a consequence of the difference in dimensions of the shield at the front and back of the machine, respectively. Furthermore, the points where over-excavation occurs correlate with points where the loss of ground volume was greater (Figure 15 and Figure 16a,d), though this was not the only reason, as we will see below. The volumes of tail-grout injected during the breakthrough are also shown in Figure 16c. This grout was injected to minimize the ground movement in the gap created between the outside diameter of the tunnel lining ring and the outside diameter of the lining ring. The theoretical volume of the gap is 7.85 m3/ring. Consequently, it can also be seen in the figure that the volume of tail-grout applied was in many cases lower than this theoretical value, matching higher ground volume loss values.

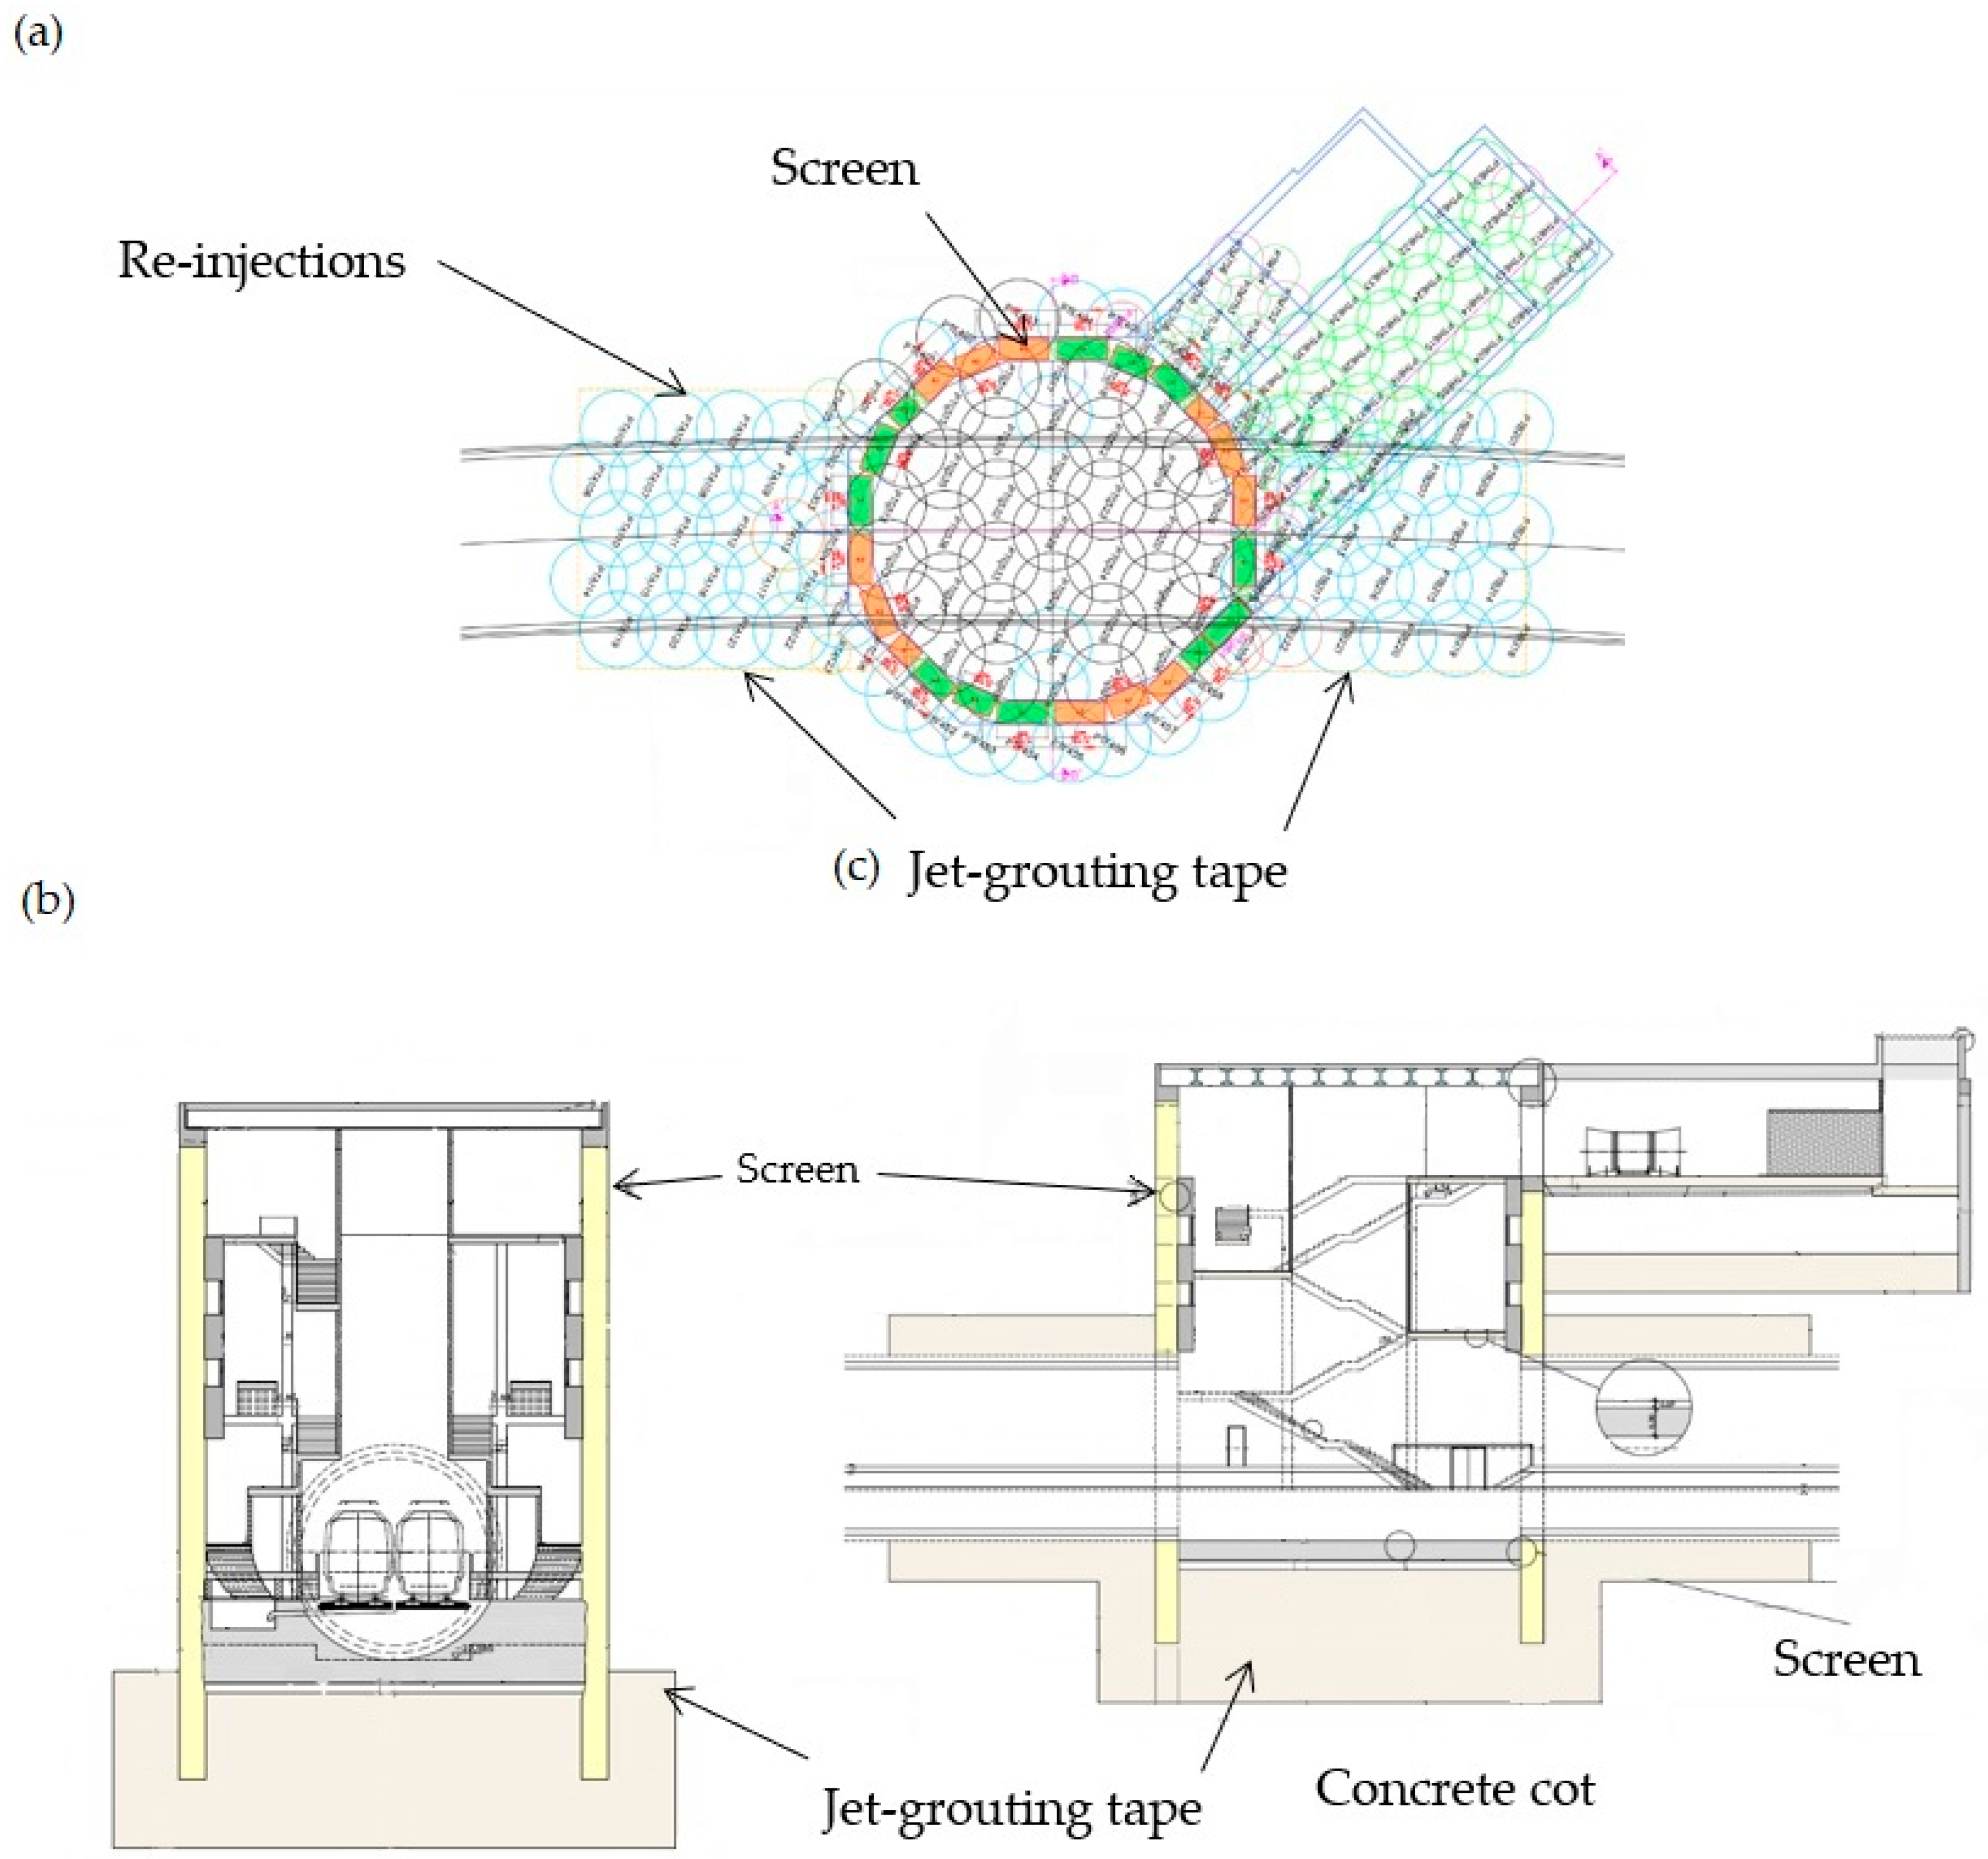
5. Study of the Singular Points

The estimation of ground volume loss is determined using Equation (2). The results, illustrated in Figure 17, show the progression of volume loss along the tunnel alignment in Section 1. This is represented as a percentage and mapped against tunnel advance in meters. The settlement data utilized for this analysis correspond to the total recorded settlements (Stotal).
We have seen that, if the operating parameters of the EPB machine such as the face pressure and the tail grout volume and pressure are well controlled, the construction of tunnels with this type of machine provides very low ground losses. Consequently, in the construction of Section 1 of Line 9 of the Barcelona Metro, we noticed that most of the ground loss values are below 0.8%.
To show that, there are fifteen points on Section 1 of Line 9 with a higher ground volume loss value. These fifteen points, which we have called singular points, are due to construction problems in most cases (Figure 17) and include machine learning curve, entry and exit of maintenance shafts, hyperbaric stops, grout injection errors, little coverage, poorly compacted backfill material, brush and cutting tool wear, and logistical problems.
In the case of the learning curve of the EPB, the running of the machine–equipment set causes anomalies during the first kilometers in which experience is acquired. For the first EPB (Guster), this process meant it took a little over three months to reach average speed and cover a distance of approximately one kilometer. In the case of the second EPB (Hades), this process was much faster and was carried out in just over a month, and the distance covered was less than half a kilometer. Therefore, both TBMs had a volume loss of over 1%.
One of the main disadvantages is that, in the advancement of the TBM, the time when the machine is stationary, and also the time when the machine remains stopped while the segments are being assembled before the advance ring is formed, is excluded. Hence, Figure 18 shows the time relationship for each EPB machine activity: stopping time, segment assembly time, and drilling time as a function of the ground volume loss. It can be seen that the highest ground losses match the times when the EPB machine was stopped.
One of the times when the TBM stopped was at the exit and entrance to the maintenance shafts and stations. These stops in the shafts were made by means of jet-grouting blocks built at the entrance and exit of the shaft, where the wheel is embedded. These tapes are approximately 14 m long, and the shafts are made of mass concrete shields. Thus, they are used for maintenance work on the machine and the cutter wheel at atmospheric pressure. In addition, they serve as emergency exits and ventilation ex post facto. The internal diameter of the shafts is approximately 18 m. The concrete cot, which allows the advance into the shaft through the assembly of the false tunnel rings, is already in place before the EPB arrives.
A few days before the TBM passes through the jet-grouting tapes, the watertightness of these tapes is improved by re-injection and their watertightness is checked. The following Figure 19 shows, as an example, one of the studied shafts of Section 1 and the jet-grouting tapes developed. It shows a plan of the tunnel (Figure 19a) (cross section, Figure 19b; and longitudinal, Figure 19c).
The EPB drills the shield to a thickness of approximately 1.2 m. During this process, a denser than usual grouting (with 120 kg/m3 of cement) is injected through the tail of the shield. Additionally, it is ensured that, at the time of the EPB breakthrough, the grouting injected behind the first ring, placed inside the jet-grouting block, is set.
In the case of Shaft 4 (Figure 17), there were problems with water intrusion into the tunnel, as the jet-grouting tape was not completely watertight. Further re-injections were carried out, which led to small upheavals days before the entrance of the EPB into the shaft. These upheavals were increased with the entry of the shield tail into the watertight block, where an increase in the volume of grouting was realized due to a slight over-excavation of the theoretical profile. As a consequence of the water entry, rigid and brittle jet-grouting blocks were developed (Figure 19).
Figure 20 presents the cutting wheel force, the PAR (torque), and the drilling during excavation from ring 1740 (before contact with the jet-grouting blocks) to ring 1760 (where the TBM breakthrough occurs in one of the maintenance shafts). Before contact with the jet-grouting blocks, the parameters remain constant, with a drilling value between 50 and 60 mm/rev, a perforation force slightly above 6000 kN, and a PAR with values below 4000 kNm. However, there was a significant change in these values during the drilling of the jet-grouting blocks due to contact with the TBM cutter wheel, thus decreasing the value of the wheel force to 2000 KN and the PAR (torque) to 6000 kNm, and increasing the penetration up to 30 mm/rev. Once the jet tape is excavated, the shaft shield is drilled, and all values decrease.
Moreover, the weight of the extracted material, the pressure, and the volume of grout injected into the shield tail are detailed in Figure 20b. What can be noticed is that, before and during the drilling of the jet-grouting blocks, the parameters are quite constant. However, at the entry of the shield tail into the jet-grouting block, an increase in the grout injected volume and a slight over-excavation of the theoretical profile can be noticed. Thus, the weight of material extracted increases to 190 t/m and coincides with an increase in grouting injection volume from 6 m3 to 8 m3.
In other cases, infiltration of clean water and water with fine-grained material occurs at the joint between the jet and the shaft shield during the entrance and exit process of the shafts. It can be noticed that, in several shafts, these contacts between jet-grouting block and diaphragm wall have not been properly sealed. This has led to water infiltration, causing inflow of fine ground fractions, resulting in an increase in ground settlements and higher ground losses. In the case of Section 1, several shafts were found to have waterproofing problems. To palliate this, the use of geofoam injections, from the shaft by means of lances placed directly into the annular gap, was employed. Moreover, the use of cement grout injections through shafts and gunite tapes, was also employed from inside the shaft. Another approach is injection through the shield, using bentonite injection lines, or injecting directly into the rings located inside the jet-grouting block.
Furthermore, Figure 21 shows the surface milestones located in the vicinity of Shaft 5. As an example, the actions that were carried out against the entry of water and water with fines in Shaft 5 of Section 1 are presented in Figure 22, where the surface soil settlements that caused these seepages, along with how they were stabilized after the actions carried out, are also shown. Thus, as seen in Figure 22, practically all the movement detected by these milestones arises between the moment when the inflow of water with entrained fines into the shaft occurs and the moment when the inflow of entrained water into the shaft and tunnel stops, as a result of the actions explained above, causing a loss of volume of approximately 0.6%.
In particular, the exit of the EPB machine from the shafts is also a trouble point, as the shield is drilled to enter the jet-grouting tape, and it is necessary to backfill the excavation cavity with the excavated material. Figure 23 shows the case of the exit from the watertight enclosure of the Actual Terminal during the drilling of the exit shield. This area of the layout is very superficial, with a tunnel depth vs. tunnel diameter (z/D) ratio of 1.04. Moreover, the recorded thrust values are slightly higher than those established as the usual working values (25,000 KN), reaching values of 48,000 KN. In this case, days before, a repair on half of the upper section of the exit shield was carried out, leaving it requiring a greater thrust force; For this reason, the thrust shows higher values, which caused small surface uplifts and were favored by the fact that the tunnel cover was relatively shallow (z/D = 1.04).
There are other cases where the TBM is stopped for maintenance; we call them interventions in hyperbaric conditions. These cases involve emptying part of the earth chamber and injecting bentonite, maintaining the face pressure (P1) constant at all times. As an example, Figure 24a,b shows different points along the route where hyperbaric conditions were carried out; as it can be seen, the loss of ground at these points is higher.
These losses are caused by poor control of the face pressure (P1) during stoppage and restart of the excavation work. Figure 24 shows, as an example, a case where the pressure at the excavation face could not be maintained. In this case, there is a sudden drop in this pressure (P1) from 1.7 bar to 1.0 bar (Figure 24a). The average pressure P1 required, in this zone, is 1.35 bar. Furthermore, it is observed that the extracted material was higher than the theoretical value calculated at that point (Figure 24b), causing an increasement in the ground volume loss in that area.
Another cause that can lead to a greater loss of ground volume is related to excessive wear of the brushes located at the tail of the shield. This generates a decrease in the injection of tail-grout (m3) lower than the theoretical injection calculated for the excavation. It has been observed at several points that, when this injection volume is lower than the theoretical volume, the loss of ground volume is greater (Figure 25). To show that, Figure 25a reveals two points on the Line 9 layout where it is known that there were problems with the grout injection, resulting in insufficient grouting and generating ground volume losses of more than 1% (Figure 25b).
Finally, a little more loss of ground volume, around 0.3–0.4%, can be distinguished in relation to the wear of the cutters of the cutting wheel. From the airport’s Actual Terminal Station to the Terminal Entre Pistes (Figure 1), the material is sandier with a slightly higher quartz content than in the rest of the Section 1 layout studied. Quartz causes greater wear on the cutting tools. To avoid this wear and prevent greater losses of ground volume, foam-type additives were used, which helped to keep these losses to a minimum.
All cases, so far, with higher ground losses are due to construction problems related to the TBM. The last case presented is related to excavation under poorly compacted backfill material on the surface, which has nothing to do with the handling and operating parameters of the machine. In Section 1 of Line 9 of the Barcelona Metro, there were two sections that were excavated underneath previously removed material. In both cases, the ground had been lifted approximately 3 m deep for the maintenance of water and gas pipes. In addition, a previously compacted backfill had been placed to gain cover in these areas during the excavation of the tunnel. The geological profile of one of the zones is shown in Figure 26. The figure shows the layer of compacted anthropic backfill placed prior to the passage of the TBM.
The behavior of a fill material is not the same as that of natural ground. According to [2], surface settlement in loose or compressible soils can lead to a higher amount of settlement in the soil surface, and this has been proved in these areas where higher settlement occurs. Figure 27 shows the total vertical settlement result, Svmax =−43.13 mm. We can see how the vertical settlement is immediate when crossing this less compacted area and increases very little over time.
Finally, mechanical and logistic problems, such as failures in the conveyor belts of the material excavated outside the TBM, blockages with the lubrication grease pumps, and problems with the segment driving crane contributed to a loss of ground volume somewhat higher than the average in all cases. Concerning the failure with the keystone drive, the loss of ground was 1.30% due to a cutting wheel thrust higher than the average values which caused, on the one hand, wear of the wheel cutters and, on the other hand, a stop in Shaft 7A where the cutting tools were replaced.

6. Conclusions

This study confirms that mechanized excavation with EPB shields is an effective tunneling method for minimizing ground movements and volume losses in deltaic soils. The achieved average excavation rate of 26.37 m/day was accompanied by minimal hyperbaric interventions and efficient tool maintenance during station and shaft accesses.

6.1. Ground Response and Settlement Control

Monitoring data indicate that most settlements occur when the TBM cutterhead is between 50 m ahead and 100–300 m behind the monitoring section. The largest portion of settlements is observed at the shield tail due to gap closure, extending up to 300 m. Beyond 100 m, vertical movements become negligible. Ground volume loss consistently remained below 1%, typically under 0.5%, with K = 0.5 proving to be a representative value for deltaic soils. Higher losses were linked to factors such as TBM learning curves, grouting inefficiencies, face pressure drops, transitions at shafts and stations, logistical setbacks, and tool wear.

6.2. Impact of Operational Parameters

Operational parameters, particularly face pressure and grout injection volumes, significantly influenced ground movements. While an increase in face pressure is generally expected to reduce ground volume loss, the limited variability of applied pressures during excavation constrained a comprehensive analysis of this effect. However, when face pressure was maintained between 1.8 and 3.2 bar, ground volume loss at the face rarely exceeded 0.20%, provided that TBM parameters were well controlled. Conversely, reductions in face pressure during hyperbaric interventions led to increased settlements.
The closure of the annular gap was found to be crucial for maintaining pressure stability and controlling grout injection volumes. Cases where injected grout volume was lower than the theoretical requirement resulted in increased settlements and higher ground volume loss. Conversely, when the injected volume exceeded the theoretical value, ground volume loss rarely surpassed 0.5%.

6.3. Challenges in Excavation and Gap Filling

Shaft entry and exit points posed the greatest challenge in controlling ground movements. The jet-grouting sealing system used in Section 1 was insufficient to fully prevent water ingress and fines migration, requiring frequent remedial injections. This led to significant TBM delays and increased settlement risks, potentially compromising adjacent structures. Additionally, localized ground uplifts were observed due to over-excavation, excessive grout injection, and increased cutterhead thrust, particularly in shallow cover sections.
A key limitation of this study was the restricted control of operational parameters, which prevented a fully detailed assessment of their effects on settlements. However, this limitation confirmed that when properly controlled, operational parameters enable excavation in deltaic soils with minimal ground loss. Furthermore, singular points with greater variability in operational parameters were identified, providing valuable insights into the interaction between excavation processes and ground response.

6.4. Future Research and Practical Applications

Further research should focus on analyzing face pressure variability, shield pressure, and mortar injection volumes in different tunnel sections and their correlation with observed ground movements. The application of advanced statistical techniques could provide a more precise assessment of these factors and enhance excavation strategies. Additionally, incorporating data from other projects with similar geotechnical conditions would contribute to a broader understanding of excavation performance in deltaic soils.
From a practical standpoint, the findings of this study have significant implications for EPB tunneling projects, particularly in regions with similar soil conditions. The insights into operational parameter control and settlement prevention can be directly applied to improve excavation efficiency, reduce risks, and minimize environmental impact. Furthermore, the monitoring methods and operational strategies discussed in this study serve as a model for optimizing excavation operations and mitigating settlement risks in large-scale infrastructure projects.
Ultimately, this study demonstrates that excessive ground volume loss typically results from a combination of multiple factors, emphasizing the need for optimized TBM control strategies to minimize localized disturbances and ensure excavation stability. These results are valuable for tunnel designers, construction engineers, and future research efforts aimed at refining tunneling methodologies in complex ground conditions.

Author Contributions

Conceptualization, M.T.Y.; Methodology, E.B.; Validation, E.B. and A.G.; Investigation, M.T.Y.; Resources, A.G.; Writing—original draft, M.T.Y.; Writing—review & editing, A.G.; Supervision, E.B. All authors have read and agreed to the published version of the manuscript.

Funding

This research was partially funded by the Generalitat de Catalunya (Autonomous Government of Catalonia) under the grant Consolidated Research Groups SGR 01041 (RIIS), and by ALECTORS−2024, UPC grant number [R−02394].

Institutional Review Board Statement

Not applicable.

Informed Consent Statement

Not applicable.

Data Availability Statement

The data presented in this study are available upon request from the corresponding author due to privacy concerns. Infrastructure data from the Generalitat de Catalunya (Infraestructures.cat) can be accessed with permission.

Acknowledgments

The authors would like to thank Infraestructures de la Generalitat de Catalunya (Infraesructures.cat) under the collaboration of the International Centre for Numerical Methods in Engineering (CIMNE).

Conflicts of Interest

The authors declare no conflict of interest.

References

  1. Clough, G.W.; Sweeney, B.P.; Finno, R.J. Measured Soil Response to EPB Shield Tunneling. J. Geotech. Eng. 1983, 109, 131–149. [Google Scholar] [CrossRef]
  2. Leca, E.; Leblais, Y.; Kuhnhenn, K. Underground works in soils and soft rock tunneling. Int. J. Geotech. Geol. Eng. 2000, 1, 220–268. [Google Scholar]
  3. Mair, R.J.; Taylor, R.N. Theme Lecture: Bored tunnelling in the urban environment. Plenar Session 4. In Proceedings of the Fourteenth International Conference on Soil Mechanics and Foundation Engineering, Hamburg, Germany, 6–12 September 1997; Volume 4, pp. 2353–2385. [Google Scholar]
  4. Peng, S.; Yubero, M.T.; Tarragó, D. Análisis en 3D de los Movimientos del Terreno Causados por la Excavación Mecanizada de túneles (EPB). Master’s Thesis, Universidad Politécnica de Catalunya, Barcelona, Spain, 2015. [Google Scholar]
  5. Antiga, A.; Chiorboli, M. Tunnel face stability and settlement control using earth pressure balance shield in cohesionless soil. In Geotechnical Aspects Underground Construction in Soft Ground; Ng, C.W.W., Huang, H.W., Liu, G.B., Eds.; Taylor & Francis Group: Shanghai, China, 2009; pp. 365–371. [Google Scholar]
  6. Do, N.A.; Dias, D.; Oreste, P.; Djeran-Maigre, I. Three-dimensional numerical simulation of a mechanized twin tunnels in soft ground. Tunn. Undergr. Space Technol. 2014, 42, 40–51. [Google Scholar] [CrossRef]
  7. Mollon, G.; Dias, D.; Soubra, A.H. Probabilistic analysis of tunneling-induced ground movements. Tunn. Undergr. Space Technol. 2013, 37, 181–199. [Google Scholar]
  8. Pelizza, S.; Peila, D.; Grasso, P. TBM tunneling in difficult ground conditions. Geol. Soc. Lond. Eng. Geol. Spec. Publ. 2010, 25, 213–218. [Google Scholar]
  9. Sirivachiraporn, A.; Phienwej, N. Ground movements in EPB shield tunneling of Bangkok subway project and impacts on adjacent buildings. Tunn. Undergr. Space Technol. 2012, 30, 10–24. [Google Scholar] [CrossRef]
  10. Suwansawat, S. Earth Pressure Balance (EPB) Shield Tunneling in Bangkok: Ground Response and Prediction of Surface Settlements Using Artificial Neural Networks; Massachusetts Institute of Technology: Cambridge, MA, USA, 2002. [Google Scholar]
  11. Zhang, D.; Ng, C.W.W. Effects of stress-induced anisotropy and structure on undrained behavior of reconstituted and intact soft clay. J. Geotech. Geoenviron. Eng. 2015, 141, 04015012. [Google Scholar]
  12. Dimmock, P.S. Tunnelling-Induced Ground and Building Movement on the Jubilee Line Extension. Ph.D. Thesis, University of Cambridge, Cambridge, UK, 2003. [Google Scholar]
  13. Fargnoli, V.; Boldini, D.; Amorosi, A. TBM tunnelling-induced settlements in coarse-grained soils: The case of the new Milan underground line 5. Tunn. Undergr. Space Technol. 2013, 38, 336–347. [Google Scholar] [CrossRef]
  14. Gens, A.; Mariano, A.D.i.; Yubero, M.T. EPB tunneling in deltaic deposits: Observations of ground movements. In Geotechnical Aspects of Underground Construction in Soft Ground; Viggiani, G., Ed.; Taylor & Francis Group: Abingdon, UK, 2011. [Google Scholar]
  15. Yubero, M.T. Ejecución De Túneles En Terreno Deltaico Mediante Tuneladora EPB. El Caso De La Línea 9. Ph.D. Thesis, Universitat Politècnica de Catalunya, Barcelona, Spain, 2021. [Google Scholar]
  16. Yubero, M.T.; Bonet, E. Ground Surface Effect of Earth Pressure Balance Tunnelling in Deltaic Deposits: A Case Study of Line 9 of the Barcelona Metro. Sustainability 2024, 16, 8275. [Google Scholar] [CrossRef]
  17. O’Reilly, M.P.; New, B.M. Settlements above tunnels in the U.K—Their magnitude and prediction. Tunneling 1992, 82, 173–181. [Google Scholar]
  18. Lin, C.G.; Zhang, Z.M.; Wu, S.M.; Yu, F. Key techniques and important issues for slurry shield under-passing embankments: A case study of Hangzhou Qiantang River Tunnel. Tunn. Undergr. Space Technol. 2013, 38, 306–325. [Google Scholar] [CrossRef]
  19. Phienwej, N.; Sirivachiraporn, A.; Timpong, S.; Tavaranum, S. Characteristics of Ground Movements from Shield Tunnelling of the First Bangkok Subway Line. In Proceedings of the International Symposium on Underground Excavation and Tunnelling, Bangkok, Thailand, 2–4 February 2006; pp. 319–330. [Google Scholar]
  20. Cording, E.J. Control of ground movements around tunnels in soil. In Proceedings of the Ninth Pan American Conference, Vina del Mar, Chile, 5–9 August 1991; pp. 2195–2244. [Google Scholar]
  21. Wongsaroj, J. Three-Dimensional Finite Element Analysis of Short and Long-Term Ground Response to open-Face Tunnelling in Stiff Clay. Ph.D. Thesis, University of Cambridge, Cambridge, UK, 2005. [Google Scholar]
  22. Wongsaroj, J.; Borghi, F.X.; Soga, K.; Mair, R.J.; Sugiyama, T.; Hagiwara, T.; Bowers, K.J. Effect of TBM driving parameters on ground surface movements: Channel Tunnel Rail Link Contract 220. In Geotechnical Aspects of Underground Construction in Soft Ground; Taylor & Francis Group: London, UK, 2006; pp. 335–341. [Google Scholar]
  23. Lee, K.M.; Ji, H.W.; Shen, C.K.; Liu, J.H.; Bai, T.H. Ground response to the construction of Shanghai Metro Tunnel-Line 2. Soil Found. 1999, 39, 113–134. [Google Scholar] [CrossRef] [PubMed]
  24. Lee, H.; Choi, H.; Choi, S.-W.; Chang, S.-H.; Kang, T.-H.; Lee, C. Numerical Simulation of EPB Shield Tunnelling with TBM Operational Condition Control Using Coupled DEM–FDM. Appl. Sci. 2021, 11, 2551. [Google Scholar] [CrossRef]
  25. Matsushita, Y.; Iwasaki, Y.; Ashimoto, T.; Imanishi, H. Behaviour of subway tunnel driven by large slurry shield. In Underground Construction in Soft Ground; Taylor & Francis Group: Abingdon, UK, 1995; pp. 253–256. [Google Scholar]
  26. Medina, L. Estudio de los Movimientos Originados por la Excavación de Túneles con Escudos de Presión de Tierras en los Suelos Tosquizos de Madrid. Ph.D. Thesis, University of La Coruña, A Coruña, Spain, 2000. [Google Scholar]
  27. Bono, R.; Ortu, M.; Valdemarin, F. Surface Settlement Minimization in Soft Soil When Excavating with an Earth Pressure Balance Shield; Jornada Técnica Túneles con EPB, UPC: Barcelona, Spain, 2008. [Google Scholar]
  28. Mair, R.J. Tunnelling and geotechnics: New horizons. Géotechnique 2008, 58, 695–736. [Google Scholar] [CrossRef]
  29. Gens, A.; Persio, R.; Di Mariano, A.; Castellanza, R.; Arroyo, M. Relación enre parámetros de una tuneladora EPB y los movimientos del terreno. In Geotecnia, 3as Jornadas Hispano-Portuguesas de; Cedex: Madrid, Spain, 2009; pp. 433–441. [Google Scholar]
  30. Di Mariano, A.; Gesto, J.M.; Gens, A.; Schwarz, H. Ground deformation and mitigating measures associated with the excavation of a new Metro line. In Proceedings of the 14th European Conference on Soil Mechanics and Geotechnical Engineering, Madrid, Spain, 24–27 September 2007; pp. 1901–1906. [Google Scholar]
  31. Gong, C.; Ding, W.; Xie, D. Twin EPB tunneling-induced deformation and assessment of a historical masonry building on Shanghai soft clay. Tunn. Undergr. Space Technol. 2020, 98, 103300. [Google Scholar] [CrossRef]
  32. Rong, X.; Lu, H.; Wang, M.; Wen, Z.; Rong, X. Cutter wear evaluation from operational parameters in EPB tunneling of Chengdu Metro. Tunn. Undergr. Space Technol. 2019, 93, 103043. [Google Scholar] [CrossRef]
  33. Wu, D.; Xu, K.; Guo, P.; Lei, G.; Cheng, K.; Gong, X. Ground deformation characteristics induced by mechanized shield twin tunneling along curved alignments. Adv. Civ. Eng. 2021, 2021, 6640072. [Google Scholar] [CrossRef]
  34. Mendaña, F. La construcción de túneles en terrenos mixtos con tuneladoras de gran diámetro. Experiencias recientes de algunas obras. Rev. Obras Públicas 2009, 15, 65–78. [Google Scholar]
  35. Bel, J.; Branque, D.; Camus, T. Physical modelling of EPB TBM in dry sand and greenfield conditions. Eur. J. Environ. Civ. Eng. 2022, 27, 3236–3259. [Google Scholar] [CrossRef]
  36. Dias, D.; Kastner, R. Movements caused by the excavation of tunnels using face pressurized shields—Analysis of monitoring and numerical modeling results. Eng. Geol. 2013, 152, 17–25. [Google Scholar] [CrossRef]
  37. Shirlaw, J.N.; Ong JC, W.; Rosser, H.B.; Tan, C.G.; Osborne, N.H.; Heslop, P.E. Local settlements and sinkholes due to EPB tunnelling. Proc. Inst. Civ. Eng. Geotech. Eng. 2003, 156, 193–211. [Google Scholar] [CrossRef]
  38. Talmon, A.M.; Bezuijen, A. Backfill grouting research at Groene Hart Tunne. In International Symposium on Geotechnical Aspects of Undergroung Construction in Soft Ground; Ng, G.B., Huang, C.C.W., Lui, H.W., Eds.; Taylor & Francis Group: Shanghai, China; London, UK, 2009; pp. 349–356. [Google Scholar]
  39. Kasper, T.; Meschke, G. On the influence of face pressure, grouting pressure and TBM design in soft ground tunnelling. Tunn. Undergr. Space Technol. 2006, 21, 160–171. [Google Scholar] [CrossRef]
  40. Franza, A.; Marshall, A.M.; Zhou, B. Greenfield tunnelling in sands: The effects of soil density and relative depth. Geotechnique 2019, 69, 297–307. [Google Scholar] [CrossRef]
  41. Berthoz, N.; Branque, D.; Wong, H.; Subrin, D. TBM soft ground interaction: Experimental study on a 1 g reduced-scale EPBS model. Tunn. Undergr. Space Technol. 2018, 72, 189–209. [Google Scholar] [CrossRef]
  42. Melis, M.; Medina, L. Predicted versus measured soil movements induced by shield tunnelling in the Madrid Metro extension. Can. Geotech. J. 2005, 42, 1160–1172. [Google Scholar]
  43. Melis, M.; Medina, L.; Rodriguez, J.M. Prediction and analysis of subsidence induced by shield tunnelling in the Madrid Metro extension. Can. Geotech. J. 2002, 39, 1273–1287. [Google Scholar] [CrossRef]
  44. Marshall, A.M.; Farrell, R.P.; Klar, A.; Mair, R.J. Tunnels in sands: The effect of size, depth, and volume loss on greenfield displacements. Geotechnique 2012, 62, 385–399. [Google Scholar] [CrossRef]
  45. Xu, Q.; Zhu, H.; Ding, W.; Ge, X. Laboratory model tests and field investigations of EPB shield machine tunneling in soft ground in Shanghai. Tunn. Undergr. Space Technol. 2011, 26, 1–14. [Google Scholar] [CrossRef]
  46. Kasper, T.; Meschke, G. A 3D finite element simulation model for TBM tunnelling in soft ground. Int. J. Numer. Anal. Methods Geomech. 2004, 28, 1441–1460. [Google Scholar] [CrossRef]
Figure 1. Section 1 of Line 9 of the Metro between Terminal Entre Pistes and Parc Logistic.
Sustainability 17 03966 g001
Figure 2. Sketched geological profile of the tunnel route along Contract T1.
Sustainability 17 03966 g002
Figure 3. (a) Tunnel section of 9.40 m diameter double lane at level used in Section 1. (b) EPB machine of 9.40 m diameter used in Section 1 between Mas Blau and Terminal Entre Pistes Stations.
Sustainability 17 03966 g003
Figure 4. Stops and interventions carried out for the revision and change of cutting tools during the excavation of the section between Mas Blau and Parc Logístic Stations.
Sustainability 17 03966 g004
Figure 5. Progress of the tunnel boring machine in Section 1 between Mas Blau Station and Terminal Entre Pistes.
Sustainability 17 03966 g005
Figure 6. Settlement control systems.
Sustainability 17 03966 g006
Figure 7. Seating control systems through applied pressures.
Sustainability 17 03966 g007
Figure 8. Location of the pressure-measuring cells at the excavation face of the Hades and Guster tunnel boring machines.
Sustainability 17 03966 g008
Figure 9. Injection of bentonite and grouting into the shield and shield tail.
Sustainability 17 03966 g009
Figure 10. Ground vertical movement versus face distance at pK 4 + 150 (3945 excavated meters) and settlement components of settlement.
Sustainability 17 03966 g010
Figure 11. Vertical settlement on the ground surface during the passage of the EPB along Section 1.
Sustainability 17 03966 g011
Figure 12. Vertical total settlement on the ground surface along the route of the tunnel in Section 1.
Sustainability 17 03966 g012
Figure 13. Long-term evolution of ground volume loss in Section 1.
Sustainability 17 03966 g013
Figure 14. Loss ratio of total ground volume to normalized face pressure as a function of the overburden pressure.
Sustainability 17 03966 g014
Figure 15. Total ground loss as a function of the injected volume of grouting together with construction problems.
Sustainability 17 03966 g015
Figure 16. Volume loss ratio of ground volume and pressure at the excavation face and tail as a function of excavated meters: (a) volume loss at the face vs. excavated meters; (b) face pressure and average face pressure vs. excavated meters for both EPB tunnel boring machines used; (c) total volume loss vs. excavated meters; (d) short-term volume loss vs. excavated meters; and (e) tail pressure, average grouting pressure (continuous line), average grouting volume (dashed line), and theoretical value (red dashed line) vs. excavated meters.
Sustainability 17 03966 g016
Figure 17. Evolution of the loss of ground volume in Line 9 of the Barcelona Metro with causes that led to a greater loss of ground outside the excavation process.
Sustainability 17 03966 g017
Figure 18. Time (in minutes) of the different TBM processes vs. volume loss.
Sustainability 17 03966 g018
Figure 19. (a) Plan of Shaft 3 of Section 1 of the tunnel. (b) Cross-section B–B’. (c) Longitudinal section A–A’. The green and orange colors indicate the status of the screen: green means it’s completed, while orange means it’s still pending.
Sustainability 17 03966 g019
Figure 20. (a) Cutting wheel force, penetration, and cutting wheel PAR. (b) Working pressure, extracted material, and grout injection (average values per ring) in Shaft 4 of Section 1 of Line 9.
Sustainability 17 03966 g020
Figure 21. Location of the surface levelling points on the ground near one of the maintenance shafts of Section 1.
Sustainability 17 03966 g021
Figure 22. Movements recorded by the tunnel surface markers in the vicinity of Shaft 5.
Sustainability 17 03966 g022
Figure 23. Excavation parameters of a ring in the vicinity of the Actual Terminal Station.
Sustainability 17 03966 g023
Figure 24. (a) Pressure applied at the front with respect to time, and (b) weight of excavated and extracted material with respect to time at the exit of the San Cosme Station. The red circle indicates the moment when the pressure drops in value.
Sustainability 17 03966 g024
Figure 25. (a) Grout injection pressure and volume and (b) loss of ground volume at the beginning of the excavation works of the Guster and Hades TBMs. The dashed lines indicate the hyperbaric intervention.
Sustainability 17 03966 g025
Figure 26. Geological profile of the kilometer point PK 8 + 400 from the layout of Section 1 of Line 9.
Sustainability 17 03966 g026
Figure 27. Longitudinal profile of the seat at KP 8 + 400 from the layout of Section 1 of Line 9.
Sustainability 17 03966 g027
Table 1. Summary of soil properties at research site.
Geological Unit RQL1QL2QL3QL3sQL3m
Granulometry% Fines91.3528.5528.6190.8181.591.62
% Sands8.6167.6763.549.1418.398.36
% Gravel0.043.787.850.050.110.03
LimitsLL30.13925.925.833–21.623.7
LP19–2321.418.7216.2–2512.4–21.917.9
Humidity%181821262527
Density (γn)g/cm32.061.952.531.91.61.83
Dry density (γd)g/cm31.751.471.751.541.471.44
NSPTMedio14.448.1613.512.769.811.55
Simple Compressionqu (Kg/cm2)0.841.050.240.650.350.25
Direct Cuttingc (Kg/cm2)0.13–0.370.15–0.200.15–0.400.30–0.070.2
φ (°)2638.134.728.52826.7
Oedometere00.50.650.70.670.730.62
Cc0.090.080.150.120.090.09
Mv0.010.010.0020.0010.0020.01
TriaxialC 0–1.500.470.380.32
φ (°) 31–39.0017.1924.821.01
Sulphates%0.12<0.10.1–0.480.1–0.260.19–0.590.1–0.26
Organic material%0.120.1–0.330.22–0.400.29–1.20.07–0.910.74
Pressure meterMPa 10.314.215.211.915.1
Permeabilitycm/s 5.71 × 10−52.29 × 10−41.29 × 10−84.27 × 10−62.79 × 10⁻⁷
Table 2. Physical and mechanical characteristics of bentonite.
CategoryDetails
Composition
-
High-purity sodium bentonite
-
Water (adjusted water/bentonite ratio for optimal viscosity)
-
Dispersing and stabilizing additives (in some cases)
Properties
-
Suspension density: 1.01–1.15 g/cm3
-
Viscosity (Marsh cone): 30–60 s
-
Solid content: 3–8%
-
Yield stress: adjusted based on soil conditions
-
High water retention capacity to prevent fluid loss in permeable soils
-
pH: 8–10, ensuring chemical stability
Functions in EPB
-
Lubricates the shield to reduce friction with the ground
-
Controls contact pressure between the shield and the soil
-
Improves excavation face stability in combination with excavated material
-
Prevents collapse of the surrounding ground
Table 3. Physical and mechanical properties of grout.
CategoryDetails
Composition
-
Cement (typically CEM II or CEM III)
-
Water
-
Plasticizing and retarding additives
-
Bentonite (in some cases)
-
Filler or fine sand
Properties
-
Density: approximately 1.4–1.6 g/cm3
-
Viscosity: adjusted to allow homogeneous injection without segregation
-
Initial setting time: between 2 and 6 h, depending on additives
-
Compressive strength: ≥1 MPa at 28 days
-
Permeability: low, to prevent water infiltration
Table 4. Average excavation values recorded during tunnel construction.
Excavation ParameterAverage Value
Pressure at the Excavation Face (bar)2.6
Bentonite Injection Pressure (bar)2.0
Bentonite Injection Volume (m3)1.0–2.5
Tail Pressure (bar)3.1
Grouting Injection Volume (m3)8.23
Machine Stops/Ring (min)178
Installation Ring Time (min)19
Drilling Time/Ring (min)28
Cycle Time/Ring (min)225
Wheel Thrust Force (kN)6217.57
Propulsion Force (kN)25,600
PAR (kNm)4475
Ratio Advance (mm/min)63
Penetration (mm/rpm)53
Excavation Chamber Temperature (ºC)29.5
Disclaimer/Publisher’s Note: The statements, opinions and data contained in all publications are solely those of the individual author(s) and contributor(s) and not of MDPI and/or the editor(s). MDPI and/or the editor(s) disclaim responsibility for any injury to people or property resulting from any ideas, methods, instructions or products referred to in the content.

