
Can Climate Risk Disclosure Attract Analyst Coverage? A Study Based on the Dual Perspective of Information Supply and Demand

Abstract
1. Introduction
2. Literature Review and Research Hypotheses
2.1. Literature Review
2.1.1. The Economic Consequences of Climate Risk Disclosure
2.1.2. Factors Influencing Analyst Coverage
2.2. Research Hypothesis
3. Research Design
3.1. Sample Selection and Data Source
3.2. Definition of Variables
3.2.1. Analyst Coverage (Follow)
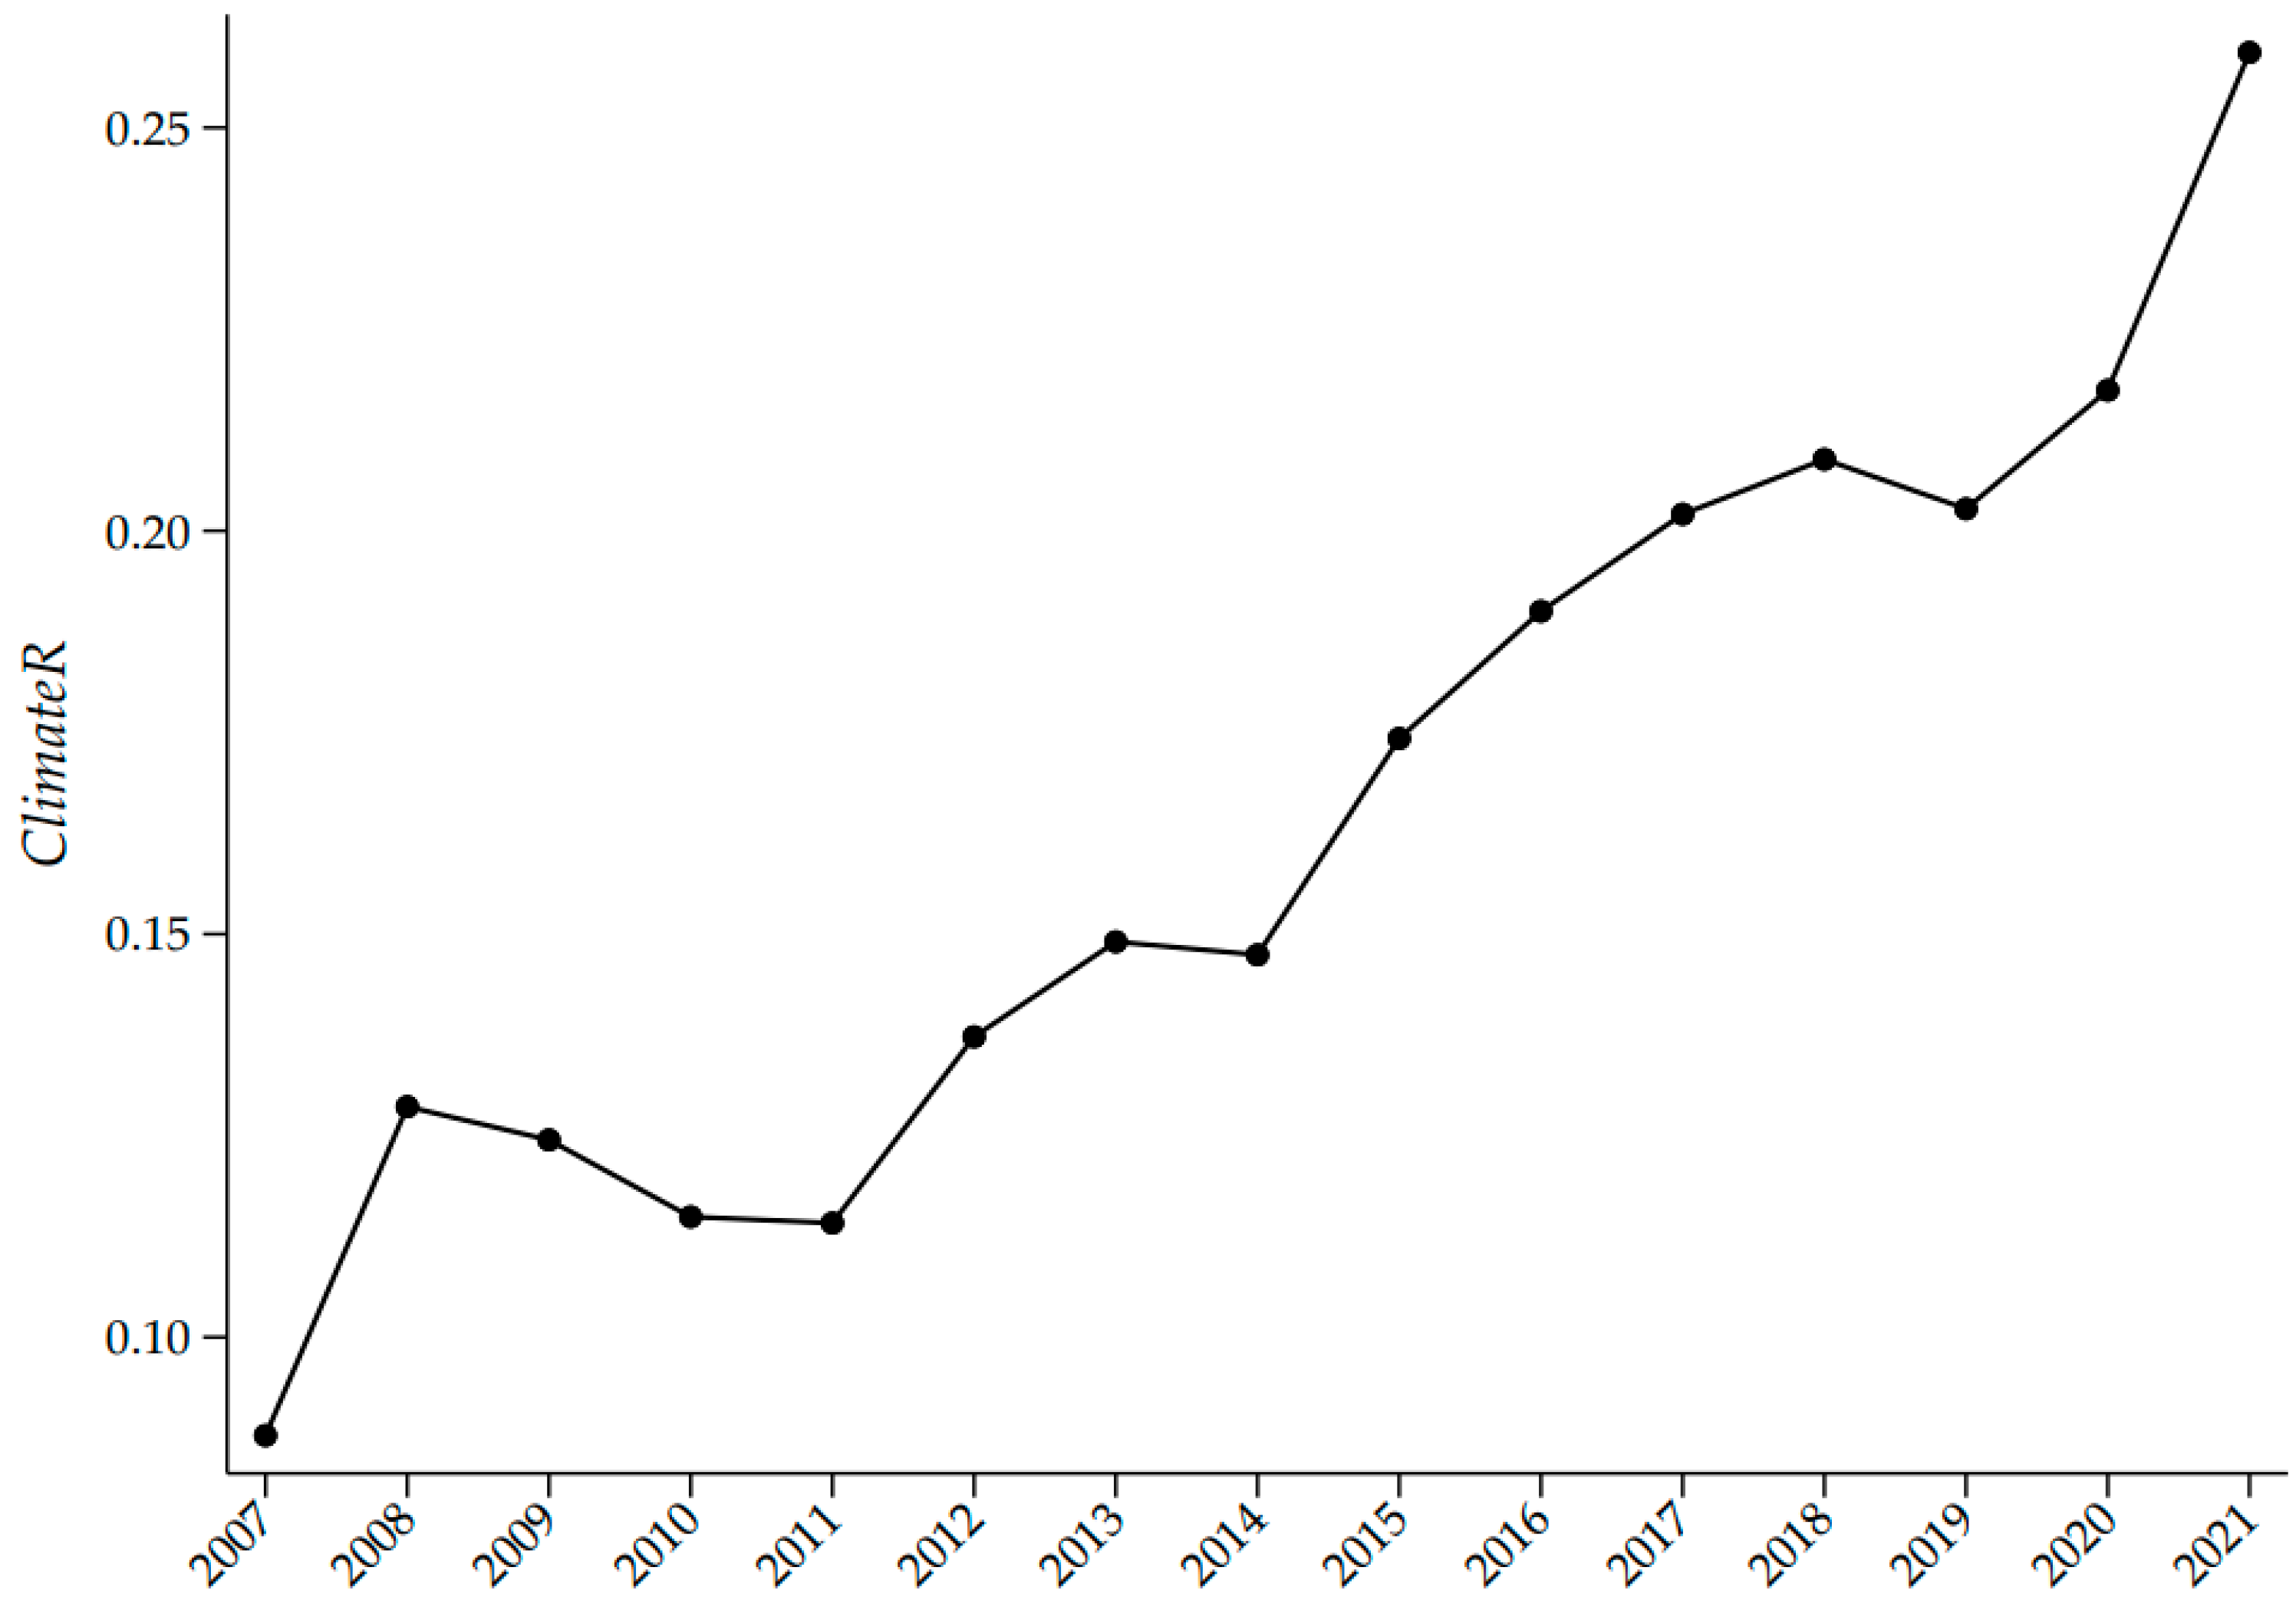
3.2.2. Climate Risk Disclosure (ClimateR)
3.2.3. Control Variables
3.3. Model Setting
4. Empirical Results
4.1. Descriptive Statistical Analysis and Difference Tests
4.2. Benchmark Regression Results
4.3. Robustness Tests
4.3.1. Endogeneity Test
4.3.2. Other Robustness Tests
4.4. Heterogeneity Analysis
4.4.1. Impact of Firm-Level Heterogeneity: Information Demand Perspective
4.4.2. Impact of Analyst-Level Heterogeneity: Information Supply Perspective
4.5. Mechanism Analysis
4.5.1. Investors’ Information Demand
4.5.2. Analysts’ Information Supply
4.6. Further Analysis
4.6.1. Different Types of Climate Risk Disclosure and Analyst Coverage
4.6.2. Climate Risk Disclosure and Analyst Forecast Quality
5. Conclusions
Future Research Prospects
Author Contributions
Funding
Institutional Review Board Statement
Informed Consent Statement
Data Availability Statement
Acknowledgments
Conflicts of Interest
Appendix A

| Source | Du et al. [3], Annual Report |
|---|---|
| Seed word | Energy conservation, electricity, energy, clean, fuel, ecology, water conservation, environment, green, transition, solar energy, upgrading, recycling, utilization rate, nuclear power, wind power, natural gas, efficiency improvement, fuel oil, efficiency, recycling, regeneration, high efficiency, photovoltaic, emissions reduction, consumption reduction, disaster, earthquake, typhoon, tsunami, flooding, drought and flood, wildfire, extreme, torrential rain, severe, urban waterlogging, strong wind, sand and dust, hail, special, drought disaster, hurricane, frost, flood disaster, storm, mudslide, landslide, flood, flood catastrophe, drought, blizzard, freezing, snow disaster, snow and ice, climate, weather, nature, humidity, water temperature, cooling, cold, air temperature, rainfall, temperature, rainwater, rainy season, rainfall conditions, freezing, precipitation, early frost, low temperature, high temperature, rain and snow (76 terms) |
| Augmented word | Energy conservation, energy, clean, ecology, environment, transition, solar energy, upgrading, recycling, utilization rate, nuclear power, wind power, natural gas, efficiency improvement, fuel oil, efficiency, recycling, regeneration, environmental protection, green, low carbon, consumption reduction, fuel, water conservation, photovoltaic, high efficiency, retrofitting, fuel consumption, electricity consumption, energy consumption, wind power, photovoltaic, energy efficiency, intensive, disaster, earthquake, typhoon, tsunami, drought and flood, extreme, severe, urban waterlogging, strong wind, sand and dust, hurricane, frost, flood disaster, storm, mudslide, landslide, freezing, snow disaster, drought disaster, flooding, torrential rain, tornado, hail, flood catastrophe, rain and snow, freezing, blizzard, frost damage, drought, drought conditions, heavy rainfall, flood, severe cold, sandstorm, climate, weather, humid, water temperature, cooling, cold, air temperature, rainfall, temperature, rainwater, rainy season, rainfall conditions, precipitation, overcast rain, rainy, extreme cold, winter, flood season, high humidity, water conditions, water level, sunlight, water shortage, alpine, cold wave, subsidence, groundwater, flood situation, surface water, water storage (98 terms) |
Appendix B
References
- Yang, X.; Wei, L.; Deng, R.; Cao, J.; Huang, C. Can Climate-related Risks Increase Audit Fees? Evidence from China. Financ. Res. Lett. 2023, 57, 104194. [Google Scholar] [CrossRef]
- Krueger, P.; Sautner, Z.; Starks, L.T. The importance of climate risks for institutional investors. Rev. Financ. Stud. 2020, 33, 1067–1111. [Google Scholar] [CrossRef]
- Du, J.; Xu, X.Y.; Yang, Y. Does corporate climate risk affect the cost of equity? Evidence from textual analysis with machine learning. Chin. Rev. Financ. Stud. 2023, 15, 19–46+125. [Google Scholar]
- Li, L.F.; Zhang, J.; Sun, C.L. Core competence information disclosure and analyst following. China Soft Sci. 2023, 3, 108–122. [Google Scholar]
- Bhushan, R. Firm characteristics and analyst following. J. Account. Econ. 1989, 11, 255–274. [Google Scholar] [CrossRef]
- Feng, X.N.; Li, X.Y. Ultimate ownership, institutional holdings and analyst following. Rev. Invest. Stud. 2013, 32, 108–121. [Google Scholar]
- Zhou, K.G.; Ying, Q.W.; Chen, X.X. Media attention, analyst attention and earnings forecast accuracy. J. Financ. Res. 2014, 404, 139–152. [Google Scholar]
- Lang, M.H.; Lundholm, R.J. Corporate disclosure policy and analyst behavior. Account. Rev. 1996, 71, 467–492. [Google Scholar]
- Sundgren, S.; Mäki, J.; Somoza-López, A. Analyst coverage, market liquidity and disclosure quality: A study of fair value disclosures by European real estate companies under IAS 40 and IFRS 13. Int. J. Account. 2018, 53, 54–75. [Google Scholar] [CrossRef]
- Derouiche, I.; Muessig, A.; Weber, V. The effect of risk disclosure on analyst following. Eur. J. Financ. 2020, 26, 1355–1376. [Google Scholar] [CrossRef]
- He, J.; Lu, Z.F. Supply chain risk disclosure and analyst coverage. Account. Res. 2020, 6, 36–48. [Google Scholar]
- Li, B.Y.; Zhang, J.W.; Shen, X.H. Is there a stock premium effect on climate change risk? Financ. Econ. 2024, 6, 31–47. [Google Scholar]
- Ding, D.; Liu, B.; Chang, M.; Yu, J. Analysts’ Use of Information in TCFD Aligned Climate Change Disclosures in Their Forecasts. Working Paper. 2024. Available online: https://www.researchgate.net/publication/367244935_Analysts’_Use_of_Information_in_TCFD_Aligned_Climate_Change_Disclosures_in_Their_Forecasts (accessed on 27 March 2025).
- Ilhan, E.; Krueger, P.; Sautner, Z.; Starks, L.T. Climate risk disclosure and institutional investors. Rev. Financ. Stud. 2023, 36, 2617–2650. [Google Scholar] [CrossRef]
- Ben-Amar, W.; Herrera, D.C.; Martinez, I. Do climate risk disclosures matter to financial analysts? J. Bus. Financ. Account. 2023, 51, 2153–2180. [Google Scholar] [CrossRef]
- Chan, J. Analysts’ Perspectives on Climate Change: An Examination of Analyst Reports. Working Paper. 2024. Available online: https://papers.ssrn.com/sol3/papers.cfm?abstract_id=4890118 (accessed on 27 March 2025).
- Huang, H.H.; Kerstein, J.; Wang, C. The impact of climate risk on firm performance and financing choices: An international comparison. J. Int. Bus. Stud. 2018, 49, 633–656. [Google Scholar] [CrossRef]
- Bansal, R.; Ochoa, M.; Kiku, D. Climate Change and Growth Risks. NBER Working Paper. 2017. Available online: https://www.nber.org/papers/w23009 (accessed on 27 March 2025).
- Painter, M. An inconvenient cost: An inconvenient cost: The effects of climate change on municipal bonds. J. Financ. Econ. 2020, 135, 468–482. [Google Scholar] [CrossRef]
- Jagannathan, R.; Ravikumar, A.; Sammon, M. Environmental, Social and Governance Criteria: Why Investors Are Paying Attention. NBER Working Paper. 2017. Available online: https://www.nber.org/papers/w24063 (accessed on 27 March 2025).
- Bingler, J.; Kraus, M.; Leippold, M.; Webersinke, N. Cheap Talk in Corporate Climate Commitments: The Role of Active Institutional Ownership, Signaling, Materiality, and Sentiment. Swiss Finance Institute Research Paper Series. 2022. Available online: https://papers.ssrn.com/sol3/papers.cfm?abstract_id=4000708 (accessed on 27 March 2025).
- Sautner, Z.; Lent, L.V.; Vilkov, G.; Zhang, R. Firm-level climate change exposure. J. Financ. 2023, 78, 1449–1498. [Google Scholar] [CrossRef]
- Maji, S.G.; Kalita, N. Climate change financial disclosure and firm performance: Empirical evidence from the Indian energy sector based on TCFD recommendations. Soc. Bus. Rev. 2022, 17, 594–612. [Google Scholar] [CrossRef]
- Dong, X.; Liu, L. Climate risk and future stock price crash: Evidence from U.S. firms. J. Clim. Financ. 2023, 3, 100012. [Google Scholar] [CrossRef]
- Matsumura, E.M.; Prakash, R.; Vera-Muñoz, S.C. Climate-risk materiality and firm risk. Rev. Account. Stud. 2024, 29, 33–74. [Google Scholar] [CrossRef]
- Zhong, W.; Jin, L. The Impact of Climate Risk Disclosure on Corporate Green Technology Innovation. Sustainability 2025, 17, 2699. [Google Scholar] [CrossRef]
- Du, J.; Teng, D.N.; Yang, Y. Can Institutional Investors’ Shareholdings Stimulate Corporate Climate Transition Risk Disclosure? An Empirical Analysis Based on the Text of Corporate Annual Reports. Mod. Financ. Econ. 2023, 43, 56–77. [Google Scholar] [CrossRef]
- Guo, W.W.; Huang, Z.C.; He, J. Confucian culture and corporate climate change risk disclosure: Based on text analysis and machine learning. China J. Econ. 2024, 11, 170–204. [Google Scholar] [CrossRef]
- Tao, R. Does Climate risk induce corporate tax avoidance? Financ. Econ. 2024, 1, 91–102. [Google Scholar]
- Liu, Y.; Han, J. Climate Risk Disclosure and Financial Analysts’ Forecasts: Evidence from China. Sustainability 2025, 17, 3178. [Google Scholar] [CrossRef]
- Bai, X.Y. The multiple impacts of corporate information disclosure policies on analyst forecasts. J. Financ. Res. 2009, 346, 92–112. [Google Scholar]
- Lehavy, R.; Li, F.; Merkley, K. The effect of annual report readability on analyst following and the properties of their earnings forecasts. Account. Rev. 2011, 86, 1087–1115. [Google Scholar] [CrossRef]
- Xiao, J.Z.; Wen, Y.; Peng, J.C.; Lu, X.Y. The impact of fossil fuel asset stranding on investor decisions in the perspective of transition risk. Syst. Eng. Theory Pract. 2024. online ahead of print. Available online: https://link.cnki.net/urlid/11.2267.N.20240909.1324.002 (accessed on 27 March 2025).
- Bolton, P.; Kacperczyk, M. Global pricing of carbon-transition risk. J. Financ. 2023, 78, 3677–3754. [Google Scholar] [CrossRef]
- Aboody, D.; Lehavy, R.; Trueman, B. Limited attention and the earnings announcement returns of past stock market winners. Rev. Account. Stud. 2010, 15, 317–344. [Google Scholar] [CrossRef]
- Papoutsi, M.; Piazzesi, M.; Schneider, M. How Unconventional Is Green Monetary Policy? JEEA-FBBVA Lecture, 2022. Preliminary Draft. Available online: https://web.stanford.edu/~piazzesi/How_unconventional_is_green_monetary_policy.pdf (accessed on 27 March 2025).
- Vestrelli, R.; Colladon, A.F.; Pisello, A.L. When attention to climate change matters: The impact of climate risk disclosure on firm market value. Energy Policy 2024, 185, 113938. [Google Scholar] [CrossRef]
- Huang, A.H.; Lehavy, R.; Zang, A.Y.; Zheng, R. Analyst information discovery and interpretation roles: A topic modeling approach. Manag. Sci. 2018, 64, 2473–2972. [Google Scholar] [CrossRef]
- O’Brien, P.C.; Tan, H. Geographic proximity and analyst coverage decisions: Evidence from IPOs. J. Account. Econ. 2015, 34, 41–59. [Google Scholar] [CrossRef]
- Brown, L.D.; Call, A.C.; Clement, M.B.; Sharp, N.Y. Inside the “black box” of sell-side financial analysts. J. Account. Res. 2015, 53, 1–47. [Google Scholar] [CrossRef]
- Wang, Y.C.; Xiao, B.Q.; Li, X.D. Determinants of analyst following: Empirical evidence from China. South China J. Econ. 2012, 10, 88–101. [Google Scholar]
- Fang, J.X. The transparency of corporate information disclosure and securities analyst forecasts in China. J. Financ. Res. 2007, 324, 136–148. [Google Scholar]
- Luo, H.; Wu, D.; Guo, Y.M. Industry-classified information disclosure and analysts’ forecasts: Evidence from the release of industry information disclosure guidelines. Financ. Trade Res. 2024, 2, 97–110. [Google Scholar] [CrossRef]
- Li, Q.; Shan, H.; Tang, Y.; Yao, V. Corporate climate risk: Measurements and responses. Rev. Financ. Stud. 2024, 37, 1778–1830. [Google Scholar] [CrossRef]
- Zeng, Q.S.; Zhou, B.; Zhang, C.; Chen, X.Y. Annual report’s tone and corporate insider trading: Do insiders act as what they said? Manag. World 2018, 9, 143–160. [Google Scholar] [CrossRef]
- Wang, Y.G.; Li, X. Promoting or inhibiting: The impact of government R&D subsidies on the green innovation performance of firms. China Ind. Econ. 2023, 2, 131–149. [Google Scholar] [CrossRef]
- Wang, B.H.; Tang, K.T.; Chen, K.G. Over-allocation of signed auditors and analyst following. China Soft Sci. 2021, 11, 117–125. [Google Scholar]
- Li, A.T.; Zhang, J.Y.; Lu, B. Can institutional investors restrain the risk of goodwill impairment of listed companies? Evidence from China A-share market. J. Financ. Res. 2022, 508, 189–206. [Google Scholar]
- Ma, L.J.; Yi, Z.H.; Zhang, C. Cheap talk or substantial? A study on the information content of analyst report texts. Manag. World 2019, 7, 182–200. [Google Scholar] [CrossRef]
- Yang, N.; Hong, J.Q. An empirical study on earnings forecast performance of analyst team versus analyst individual. Bus. Manag. J. 2019, 41, 157–175. [Google Scholar] [CrossRef]
- Niu, Z.W.; Xu, C.X.; Wu, Y. Business environment optimization, human capital effect and firm labor productivity. Manag. World 2023, 2, 83–100. [Google Scholar] [CrossRef]
- Mola, S.; Guidolin, M. Affiliated mutual funds and analyst optimism. J. Financ. Econ. 2009, 93, 108–137. [Google Scholar] [CrossRef]
- Cao, X.W.; Hong, J.Q.; Jia, W.J. Analysts’ site visits and information efficiency of capital market—A study on stock price synchronicity. Bus. Manag. J. 2015, 37, 141–150. [Google Scholar] [CrossRef]
- Wang, X.Y.; Li, Y.Q.; Xiao, X. Does the disclosure of annual report risk information help improve analyst forecast accuracy? Account. Res. 2017, 5, 527–546. [Google Scholar]
- Shan, Z.M. A review of analysts’ short-term and long-term earnings forecast characteristics. Account. Res. 2005, 11, 72–75. [Google Scholar]
- Jani, M.Y.; Chaudhari, U.; Sarkar, B. How does an industry control a decision support system for a long time? RAIRO-Oper. Res. 2021, 55, 3141–3152. [Google Scholar] [CrossRef]
- Mou, R.; Ma, T. A Study on the Quality and Determinants of Climate Information Disclosure of A-Share-Listed Banks. Sustainability 2023, 15, 8072. [Google Scholar] [CrossRef]
| Symbol | Variable | Definition |
|---|---|---|
| Dependent Variable | ||
| Follow | Analyst coverage | Natural logarithm of one plus the number of analyst teams covering the company from its annual report for year t to its annual report for year t + 1 |
| Independent Variables | ||
| ClimateR | Climate risk disclosure | The frequency of the term “climate risk” as a percentage of the total word frequency in the annual report |
| SeriousR | Serious risk disclosure | The frequency of the term “severe risk” as a percentage of the total word frequency in the annual report |
| ChronicR | Chronic risk disclosure | The frequency of the term “chronic risk” as a percentage of the total word frequency in the annual report |
| TransitionR | Transition risk disclosure | The frequency of the term “transaction risk” as a percentage of the total word frequency in the annual report |
| Control Variables | ||
| Size | Firm size | Natural logarithm of a company’s total assets |
| Lev | Financial leverage | A company’s total liabilities divided by its total assets |
| Growth | Growth | A company’s revenue growth rate |
| Roa | Profitability | A company’s net profit after tax divided by its average total assets |
| Evo | Earning volatility | The standard deviation of a company’s return on equity over the past three years |
| BM | Book-to-market ratio | Shareholders’ equity divided by the company’s market value |
| Soe | Nature of equity | Equals 1 if the equity holder is a state-owned company and 0 otherwise |
| Age | Years of company listing | Natural logarithm of a company’s listing age plus 1 |
| Top1 | Top shareholder’s shareholding concentration | Largest shareholder’s shareholding ratio |
| Big4 | Audit quality | Equals 1 if the company is audited by the “Big Four” and 0 otherwise |
| Panel A: Descriptive Statistics | ||||||||
| Variable | N | Mean | Std. Dev. | Min | P25 | Med | P75 | Max |
| Follow | 20,978 | 1.976 | 0.908 | 0.693 | 1.099 | 1.946 | 2.708 | 3.850 |
| ClimateR | 20,978 | 0.174 | 0.150 | 0.014 | 0.074 | 0.130 | 0.220 | 0.816 |
| SeriousR | 20,978 | 0.002 | 0.005 | 0.000 | 0.000 | 0.000 | 0.000 | 0.030 |
| ChronicR | 20,978 | 0.002 | 0.005 | 0.000 | 0.000 | 0.000 | 0.003 | 0.031 |
| TransitionR | 20,978 | 0.169 | 0.147 | 0.013 | 0.072 | 0.126 | 0.213 | 0.803 |
| Size | 20,978 | 22.467 | 1.304 | 20.081 | 21.528 | 22.291 | 23.233 | 26.366 |
| Lev | 20,978 | 0.447 | 0.197 | 0.064 | 0.294 | 0.447 | 0.597 | 0.865 |
| Growth | 20,978 | 0.228 | 0.462 | −0.488 | 0.015 | 0.142 | 0.313 | 3.146 |
| Roa | 20,978 | 0.053 | 0.055 | −0.129 | 0.022 | 0.046 | 0.079 | 0.234 |
| Evo | 20,978 | 0.053 | 0.074 | 0.002 | 0.014 | 0.029 | 0.058 | 0.477 |
| BM | 20,978 | 0.316 | 0.148 | 0.060 | 0.207 | 0.292 | 0.402 | 0.751 |
| Soe | 20,978 | 0.431 | 0.495 | 0.000 | 0.000 | 0.000 | 1.000 | 1.000 |
| Age | 20,978 | 2.309 | 0.616 | 1.078 | 1.804 | 2.390 | 2.834 | 3.321 |
| Top1 | 20,978 | 35.885 | 15.028 | 9.810 | 23.880 | 34.110 | 46.290 | 74.980 |
| Big4 | 20,978 | 0.076 | 0.265 | 0.000 | 0.000 | 0.000 | 0.000 | 1.000 |
| Panel B: Difference Testing | ||||||||
| Variable | High climate risk disclosure group | Low climate risk disclosure group | Mean difference | |||||
| N | Mean | N | Mean | |||||
| Follow | 10,489 | 1.9987 | 10,489 | 1.9531 | 0.0456 *** | |||
| Variable | (1) | (2) |
|---|---|---|
| Follow | Follow | |
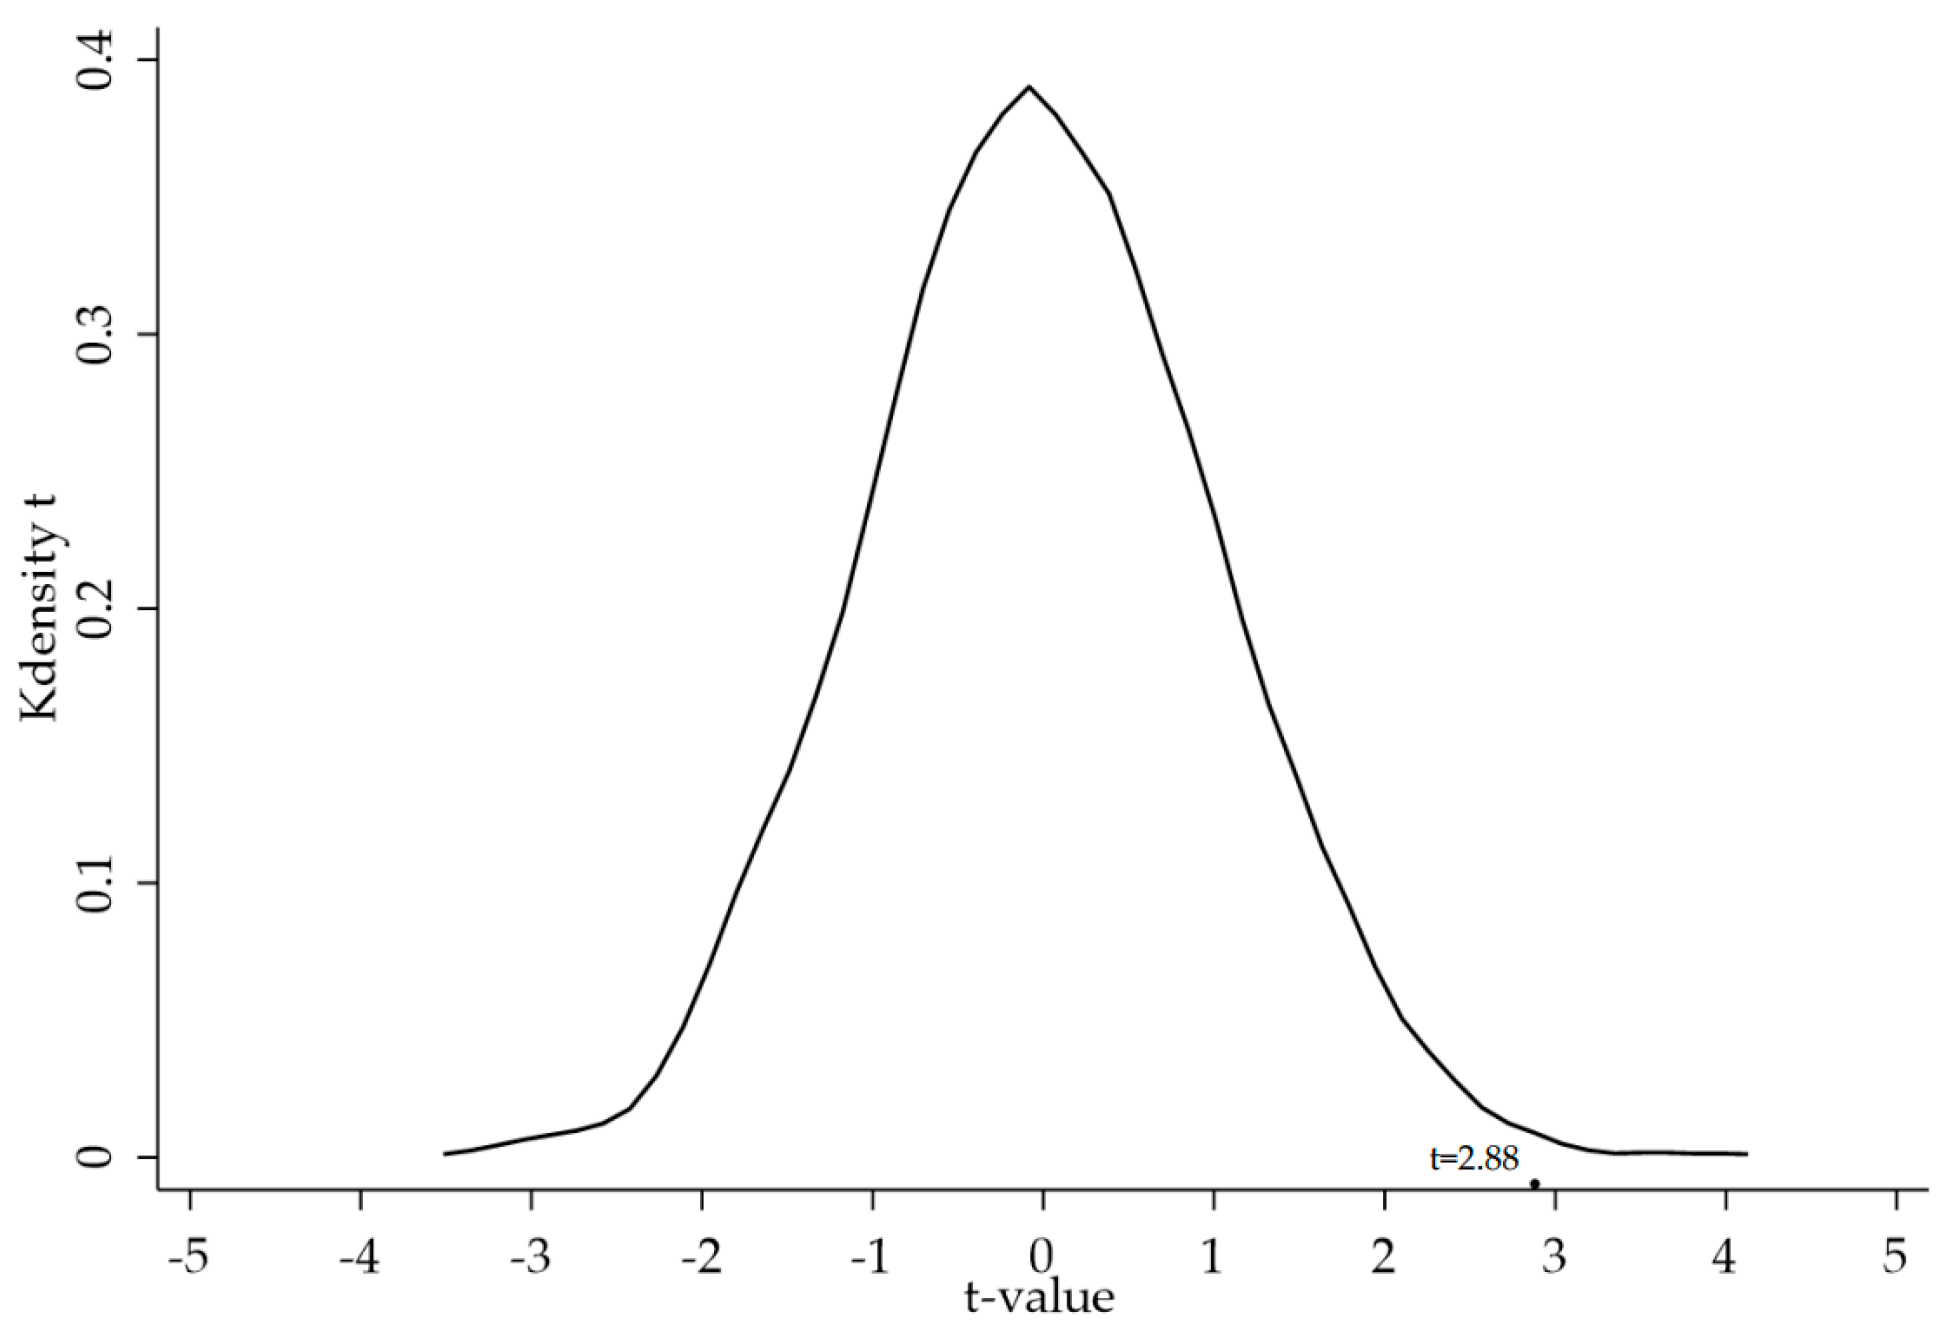
| ClimateR | 0.2810 *** | 0.1142 *** |
| (5.98) | (2.88) | |
| Size | 0.4385 *** | |
| (71.45) | ||
| Lev | −1.1387 *** | |
| (−24.73) | ||
| Growth | 0.0132 | |
| (1.09) | ||
| Roa | 4.7871 *** | |
| (40.34) | ||
| Evo | −0.3180 *** | |
| (−4.18) | ||
| BM | −1.9370 *** | |
| (−41.51) | ||
| Soe | −0.1141 *** | |
| (−8.76) | ||
| Age | −0.2388 *** | |
| (−22.79) | ||
| Top1 | −0.0036 *** | |
| (−10.02) | ||
| Big4 | 0.0522 ** | |
| (2.55) | ||
| Constant | 1.9373 *** | −6.1824 *** |
| (56.14) | (−53.72) | |
| Industry | Yes | Yes |
| Year | Yes | Yes |
| Adj.R2 | 0.0245 | 0.3763 |
| N | 20,978 | 20,978 |
| Variable | Instrumental Variable Approach | PSM | Heckman’s Two-Stage Model | ||
|---|---|---|---|---|---|
| First Stage | Second Stage | First Stage | Second Stage | ||
| (1) | (2) | (3) | (4) | (5) | |
| ClimateR | Follow | Follow | ClimateR_D | Follow | |
| ClimateR_A | 0.5743 *** | ||||
| (11.49) | |||||
| ClimateR(IV) | 1.3539 *** | ||||
| (3.27) | |||||
| OtherClimateR | 0.5576 *** | ||||
| (3.55) | |||||
| ClimateR | 0.1205 ** | 0.1248 *** | |||
| (2.19) | (3.12) | ||||
| IMR | −0.1855 *** | ||||
| (−2.89) | |||||
| Controls | Yes | Yes | Yes | Yes | Yes |
| Year/Industry | Yes | Yes | Yes | Yes | Yes |
| Adj.R2/Pseudo-R2 | 0.3024 | 0.3469 | 0.3680 | 0.1706 | 0.3766 |
| N | 20,970 | 20,970 | 10,462 | 20,952 | 20,952 |
| Variable | Replacement of Analyst Coverage Indicators | Replacement of Climate Risk Disclosure Indicators | Fixed Effects Models | ||
|---|---|---|---|---|---|
| (1) | (2) | (3) | (4) | (5) | |
| Report | Sinstitution | Follow_New | Follow | Follow | |
| ClimateR | 0.1372 *** | 0.1017 *** | 0.1120 *** | 0.3251 *** | |
| (2.74) | (2.83) | (2.86) | (3.89) | ||
| Adj_ClimateR | 0.0919 ** | ||||
| (2.29) | |||||
| Controls | Yes | Yes | Yes | Yes | Yes |
| Industry | Yes | Yes | Yes | Yes | NO |
| Year | Yes | Yes | Yes | Yes | Yes |
| Firm | NO | NO | NO | NO | Yes |
| Adj.R2 | 0.3617 | 0.3809 | 0.3539 | 0.3762 | 0.6239 |
| N | 20,978 | 20,978 | 20,454 | 20,978 | 20,978 |
| Panel A: Impact of Firm-Level Heterogeneity: Information Demand Perspective | ||||
| Variable | (1) | (2) | (3) | (4) |
| Low independent institutional group | High independent institutional group | Low readability of annual reports group | High readability of annual reports group | |
| Follow | Follow | Follow | Follow | |
| ClimateR | 0.1036 ** | 0.2025 *** | 0.1485 *** | 0.0284 |
| (2.00) | (3.62) | (2.88) | (0.45) | |
| Controls | Yes | Yes | Yes | Yes |
| Industry | Yes | Yes | Yes | Yes |
| Year | Yes | Yes | Yes | Yes |
| Adj.R2 | 0.3274 | 0.3713 | 0.3805 | 0.3652 |
| N | 10,454 | 10,454 | 10,475 | 10,475 |
| p-value | 0.009 | 0.001 | ||
| Panel B: Impact of Analyst-Level Heterogeneity: Information Supply Perspective | ||||
| Variable | (1) | (2) | (3) | (4) |
| Individual analysts | Analyst teams | Large platform analysts | Small platform analysts | |
| Follow | Follow | Follow | Follow | |
| ClimateR | 0.0344 | 0.1649 *** | 0.0952 *** | 0.0627 ** |
| (0.90) | (4.14) | (2.62) | (1.97) | |
| Controls | Yes | Yes | Yes | Yes |
| Industry | Yes | Yes | Yes | Yes |
| Year | Yes | Yes | Yes | Yes |
| Adj.R2 | 0.3585 | 0.3554 | 0.3562 | 0.2987 |
| N | 20,978 | 20,978 | 20,661 | 20,661 |
| Variable | (1) | (2) | (3) |
|---|---|---|---|
| Hold | Follow | Follow | |
| ClimateR | 3.8421 *** | 0.0916 ** | |
| (4.00) | (2.33) | ||
| Hold | 0.0059 *** | 0.0059 *** | |
| (21.05) | (20.97) | ||
| Control | Yes | Yes | Yes |
| Industry | Yes | Yes | Yes |
| Year | Yes | Yes | Yes |
| Sobel Z | −3.336 *** | ||
| Bootstrap (1000 times) confidence interval | [−0.0336, −0.0094] | ||
| Adj.R2 | 0.4864 | 0.3894 | 0.3895 |
| N | 20,978 | 20,978 | 20,978 |
| Panel A: Whether There Are Analyst Field Visits | |||
| Variable | (1) | (2) | (3) |
| Visit | Follow | Follow | |
| ClimateR | −0.4392 *** | 0.1711 *** | |
| (−5.89) | (4.38) | ||
| Visit | 0.1289 *** | 0.1296 *** | |
| (36.34) | (36.50) | ||
| Control | Yes | Yes | Yes |
| Industry | Yes | Yes | Yes |
| Year | Yes | Yes | Yes |
| Sobel Z | −4.673 *** | ||
| Bootstrap (1000 times) confidence interval | [−0.0558, −0.0220] | ||
| Adj.R2 | 0.1364 | 0.4113 | 0.4118 |
| N | 20,978 | 20,978 | 20,978 |
| Panel B: Number of Analyst Field Visits | |||
| Variable | (1) | (2) | (3) |
| Vc | Follow | Follow | |
| ClimateR | −0.1934 *** | 0.1564 *** | |
| (−7.63) | (3.96) | ||
| Vc | 0.2164 *** | 0.2186 *** | |
| (20.37) | (20.55) | ||
| Control | Yes | Yes | Yes |
| Industry | Yes | Yes | Yes |
| Year | Yes | Yes | Yes |
| Sobel Z | −6.358 *** | ||
| Bootstrap (1000 times) confidence interval | [−0.0439, −0.0236] | ||
| Adj.R2 | 0.1295 | 0.3883 | 0.3887 |
| N | 20,978 | 20,978 | 20,978 |
| Variable | (1) | (2) | (3) | (4) |
|---|---|---|---|---|
| Follow | Follow | Follow | Follow | |
| SeriousR | 3.9395 *** | 3.2782 *** | ||
| (3.77) | (3.05) | |||
| ChronicR | 3.3992 *** | 2.3772 ** | ||
| (3.60) | (2.43) | |||
| TransitionR | 0.1072 *** | 0.0881 ** | ||
| (2.68) | (2.18) | |||
| Controls | Yes | Yes | Yes | Yes |
| Industry | Yes | Yes | Yes | Yes |
| Year | Yes | Yes | Yes | Yes |
| Adj.R2 | 0.3765 | 0.3764 | 0.3763 | 0.3768 |
| N | 20,978 | 20,978 | 20,978 | 20,978 |
| Panel A: Climate Risk Disclosure and Forecast Bias | |||
| Variable | (1) | (2) | (3) |
| Errort+1 | Errort+2 | Errort+3 | |
| ClimateR | −0.0108 | −0.0444 * | −0.0462 * |
| (−0.76) | (−1.95) | (−1.68) | |
| Control | Yes | Yes | Yes |
| Industry | Yes | Yes | Yes |
| Year | Yes | Yes | Yes |
| Adj.R2 | 0.0770 | 0.0713 | 0.0708 |
| N | 17,477 | 15,902 | 13,970 |
| Panel B: Climate Risk Disclosure and Forecast Dispersion | |||
| Variable | (1) | (2) | (3) |
| Fdispt+1 | Fdispt+2 | Fdispt+3 | |
| ClimateR | −0.0646 *** | −0.0467 ** | −0.0527 ** |
| (−2.86) | (−2.04) | (−2.09) | |
| Control | Yes | Yes | Yes |
| Industry | Yes | Yes | Yes |
| Year | Yes | Yes | Yes |
| Adj.R2 | 0.1087 | 0.1091 | 0.1030 |
| N | 17,477 | 15,902 | 13,970 |
Disclaimer/Publisher’s Note: The statements, opinions and data contained in all publications are solely those of the individual author(s) and contributor(s) and not of MDPI and/or the editor(s). MDPI and/or the editor(s) disclaim responsibility for any injury to people or property resulting from any ideas, methods, instructions or products referred to in the content. |
© 2025 by the authors. Licensee MDPI, Basel, Switzerland. This article is an open access article distributed under the terms and conditions of the Creative Commons Attribution (CC BY) license (https://creativecommons.org/licenses/by/4.0/).
Share and Cite
Li, M.; Yao, S. Can Climate Risk Disclosure Attract Analyst Coverage? A Study Based on the Dual Perspective of Information Supply and Demand. Sustainability 2025, 17, 3960. https://doi.org/10.3390/su17093960
Li M, Yao S. Can Climate Risk Disclosure Attract Analyst Coverage? A Study Based on the Dual Perspective of Information Supply and Demand. Sustainability. 2025; 17(9):3960. https://doi.org/10.3390/su17093960
Chicago/Turabian StyleLi, Mengxue, and Sheng Yao. 2025. "Can Climate Risk Disclosure Attract Analyst Coverage? A Study Based on the Dual Perspective of Information Supply and Demand" Sustainability 17, no. 9: 3960. https://doi.org/10.3390/su17093960
APA StyleLi, M., & Yao, S. (2025). Can Climate Risk Disclosure Attract Analyst Coverage? A Study Based on the Dual Perspective of Information Supply and Demand. Sustainability, 17(9), 3960. https://doi.org/10.3390/su17093960