
Evaluation of Energy Saving and Emission Reduction in Steel Enterprises Using an Improved Dempster–Shafer Evidence Theory: A Case Study from China


Abstract
1. Introduction
2. Literature Review
2.1. Energy Saving and Emission Reduction Evaluation Research
2.2. Energy Saving and Emission Reduction Research in Steel Enterprises
2.3. Dempster–Shafer Evidence Theory and Its Application Research
3. Methodology
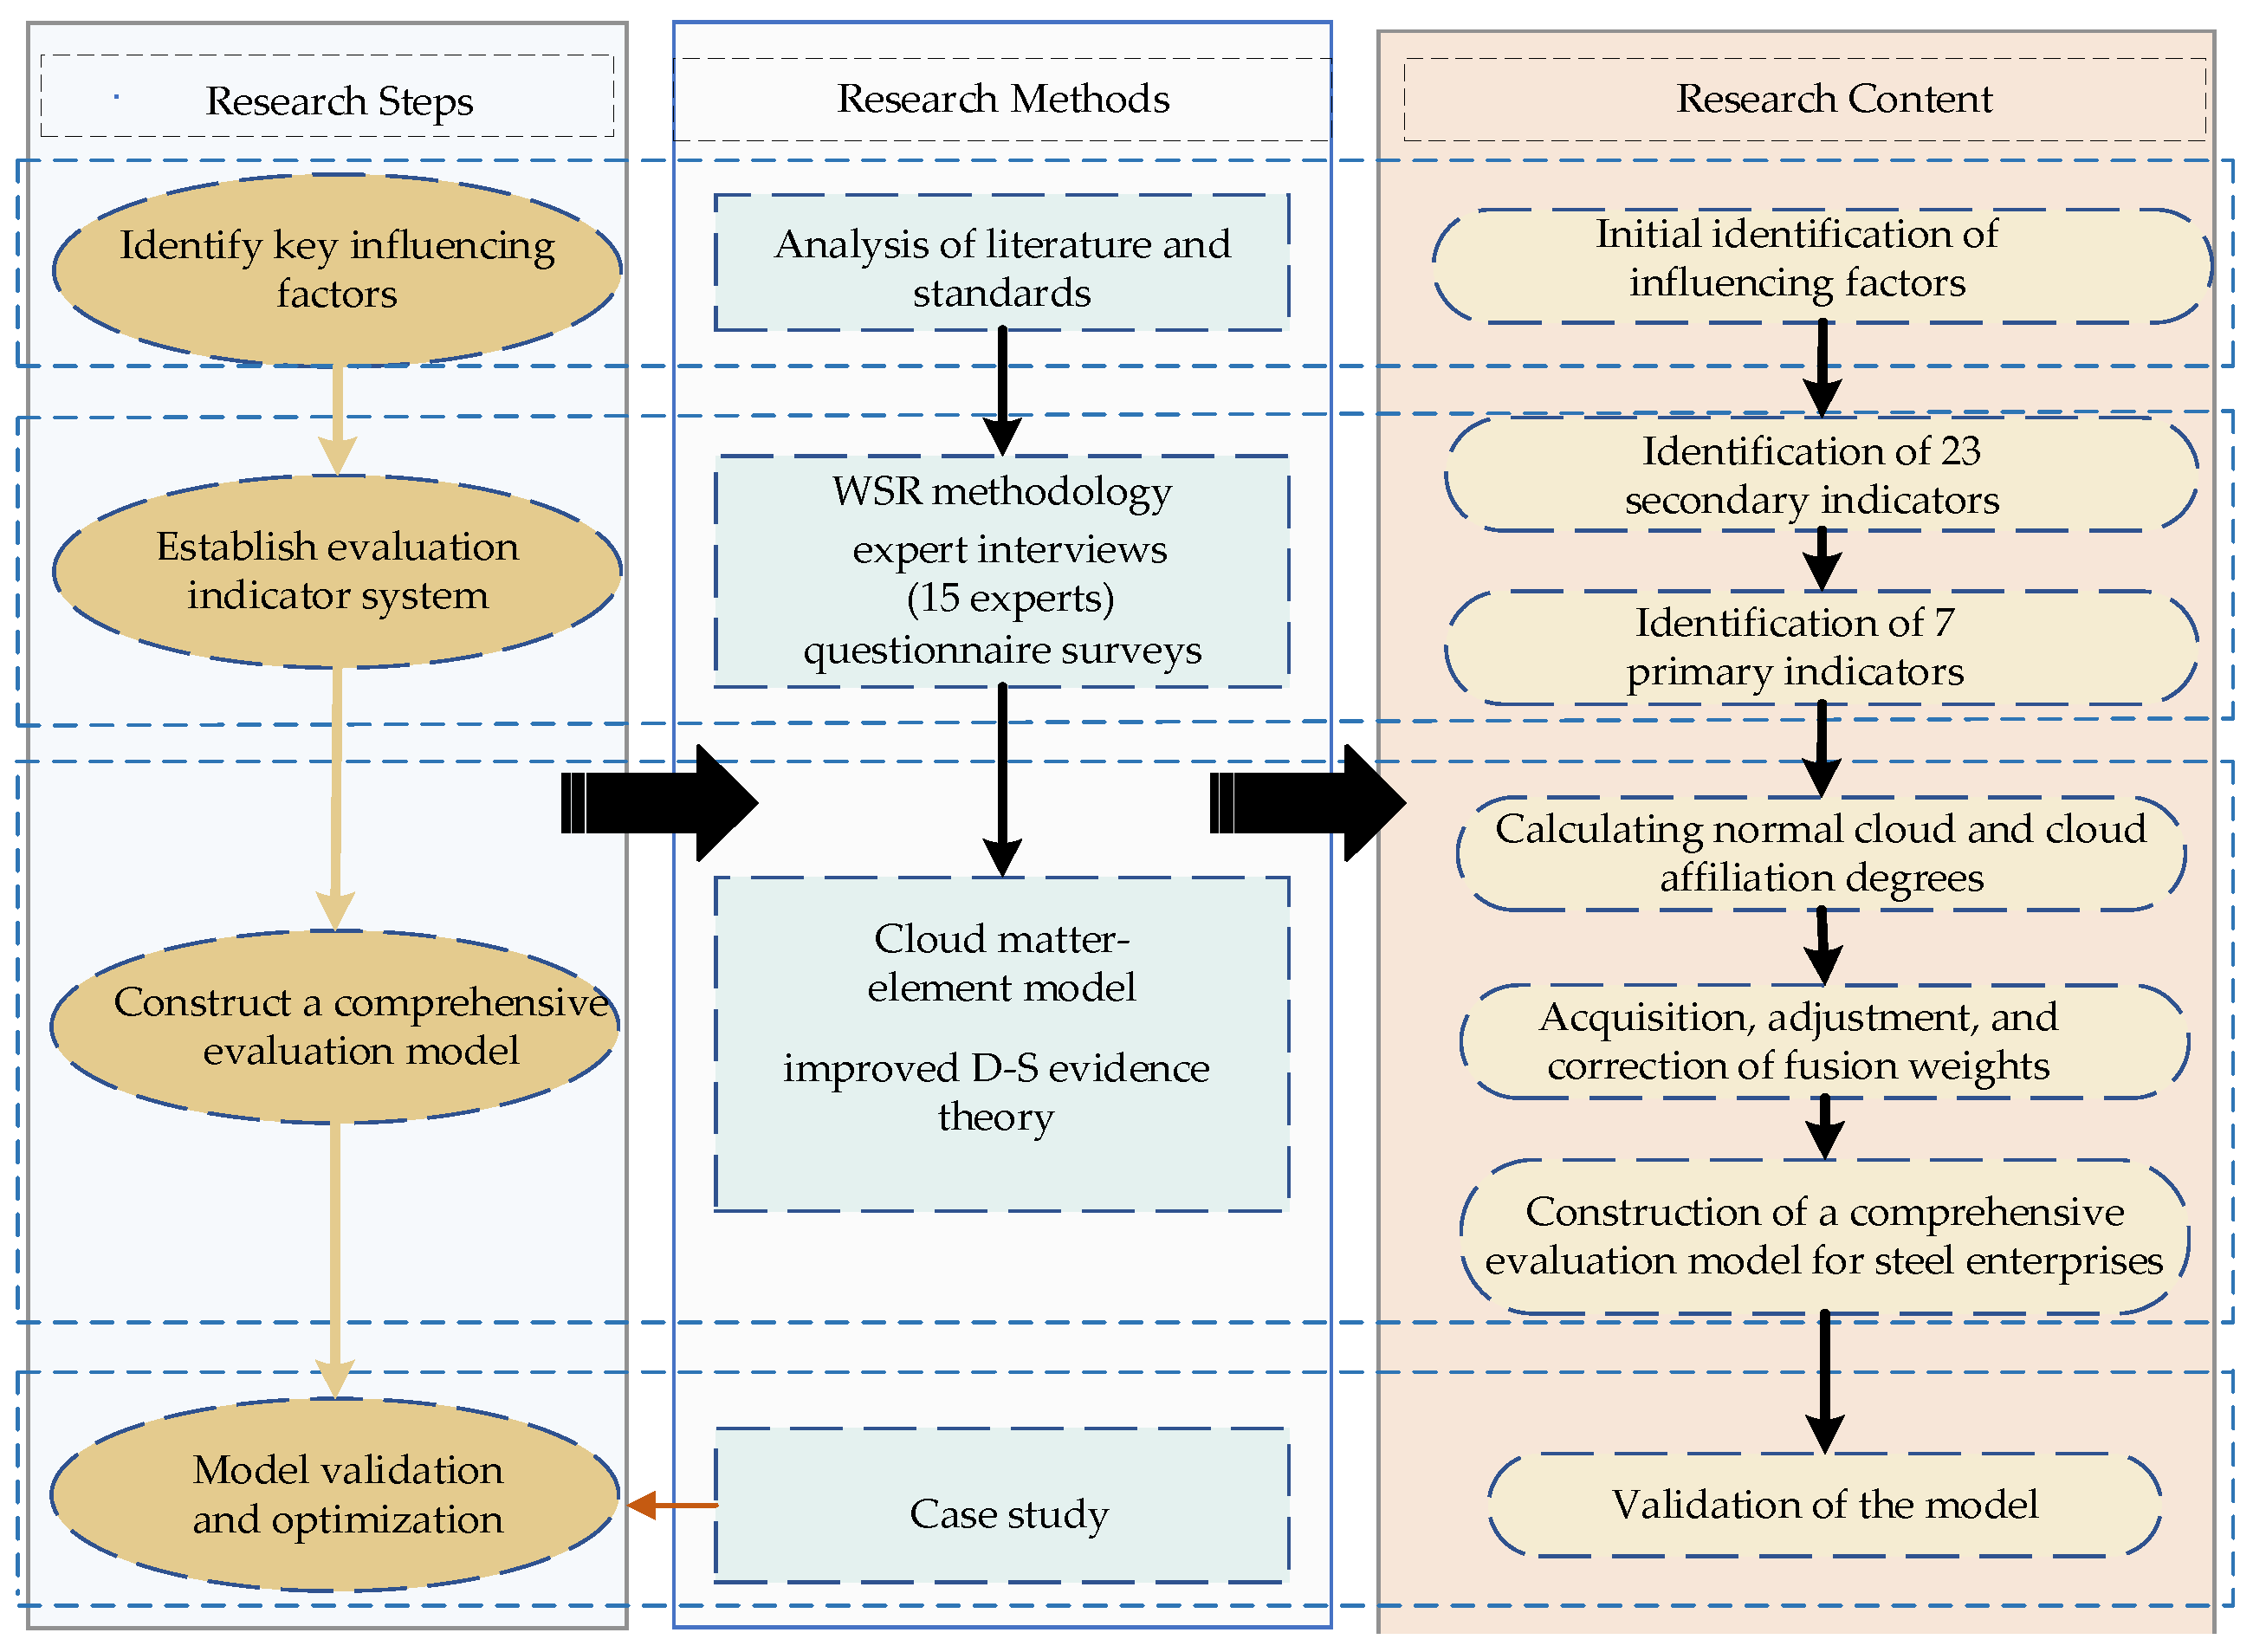
3.1. Research Framework
3.2. Indicator System Construction
3.2.1. Initial Identification of Influencing Factors
3.2.2. Finalization of Influencing Factors
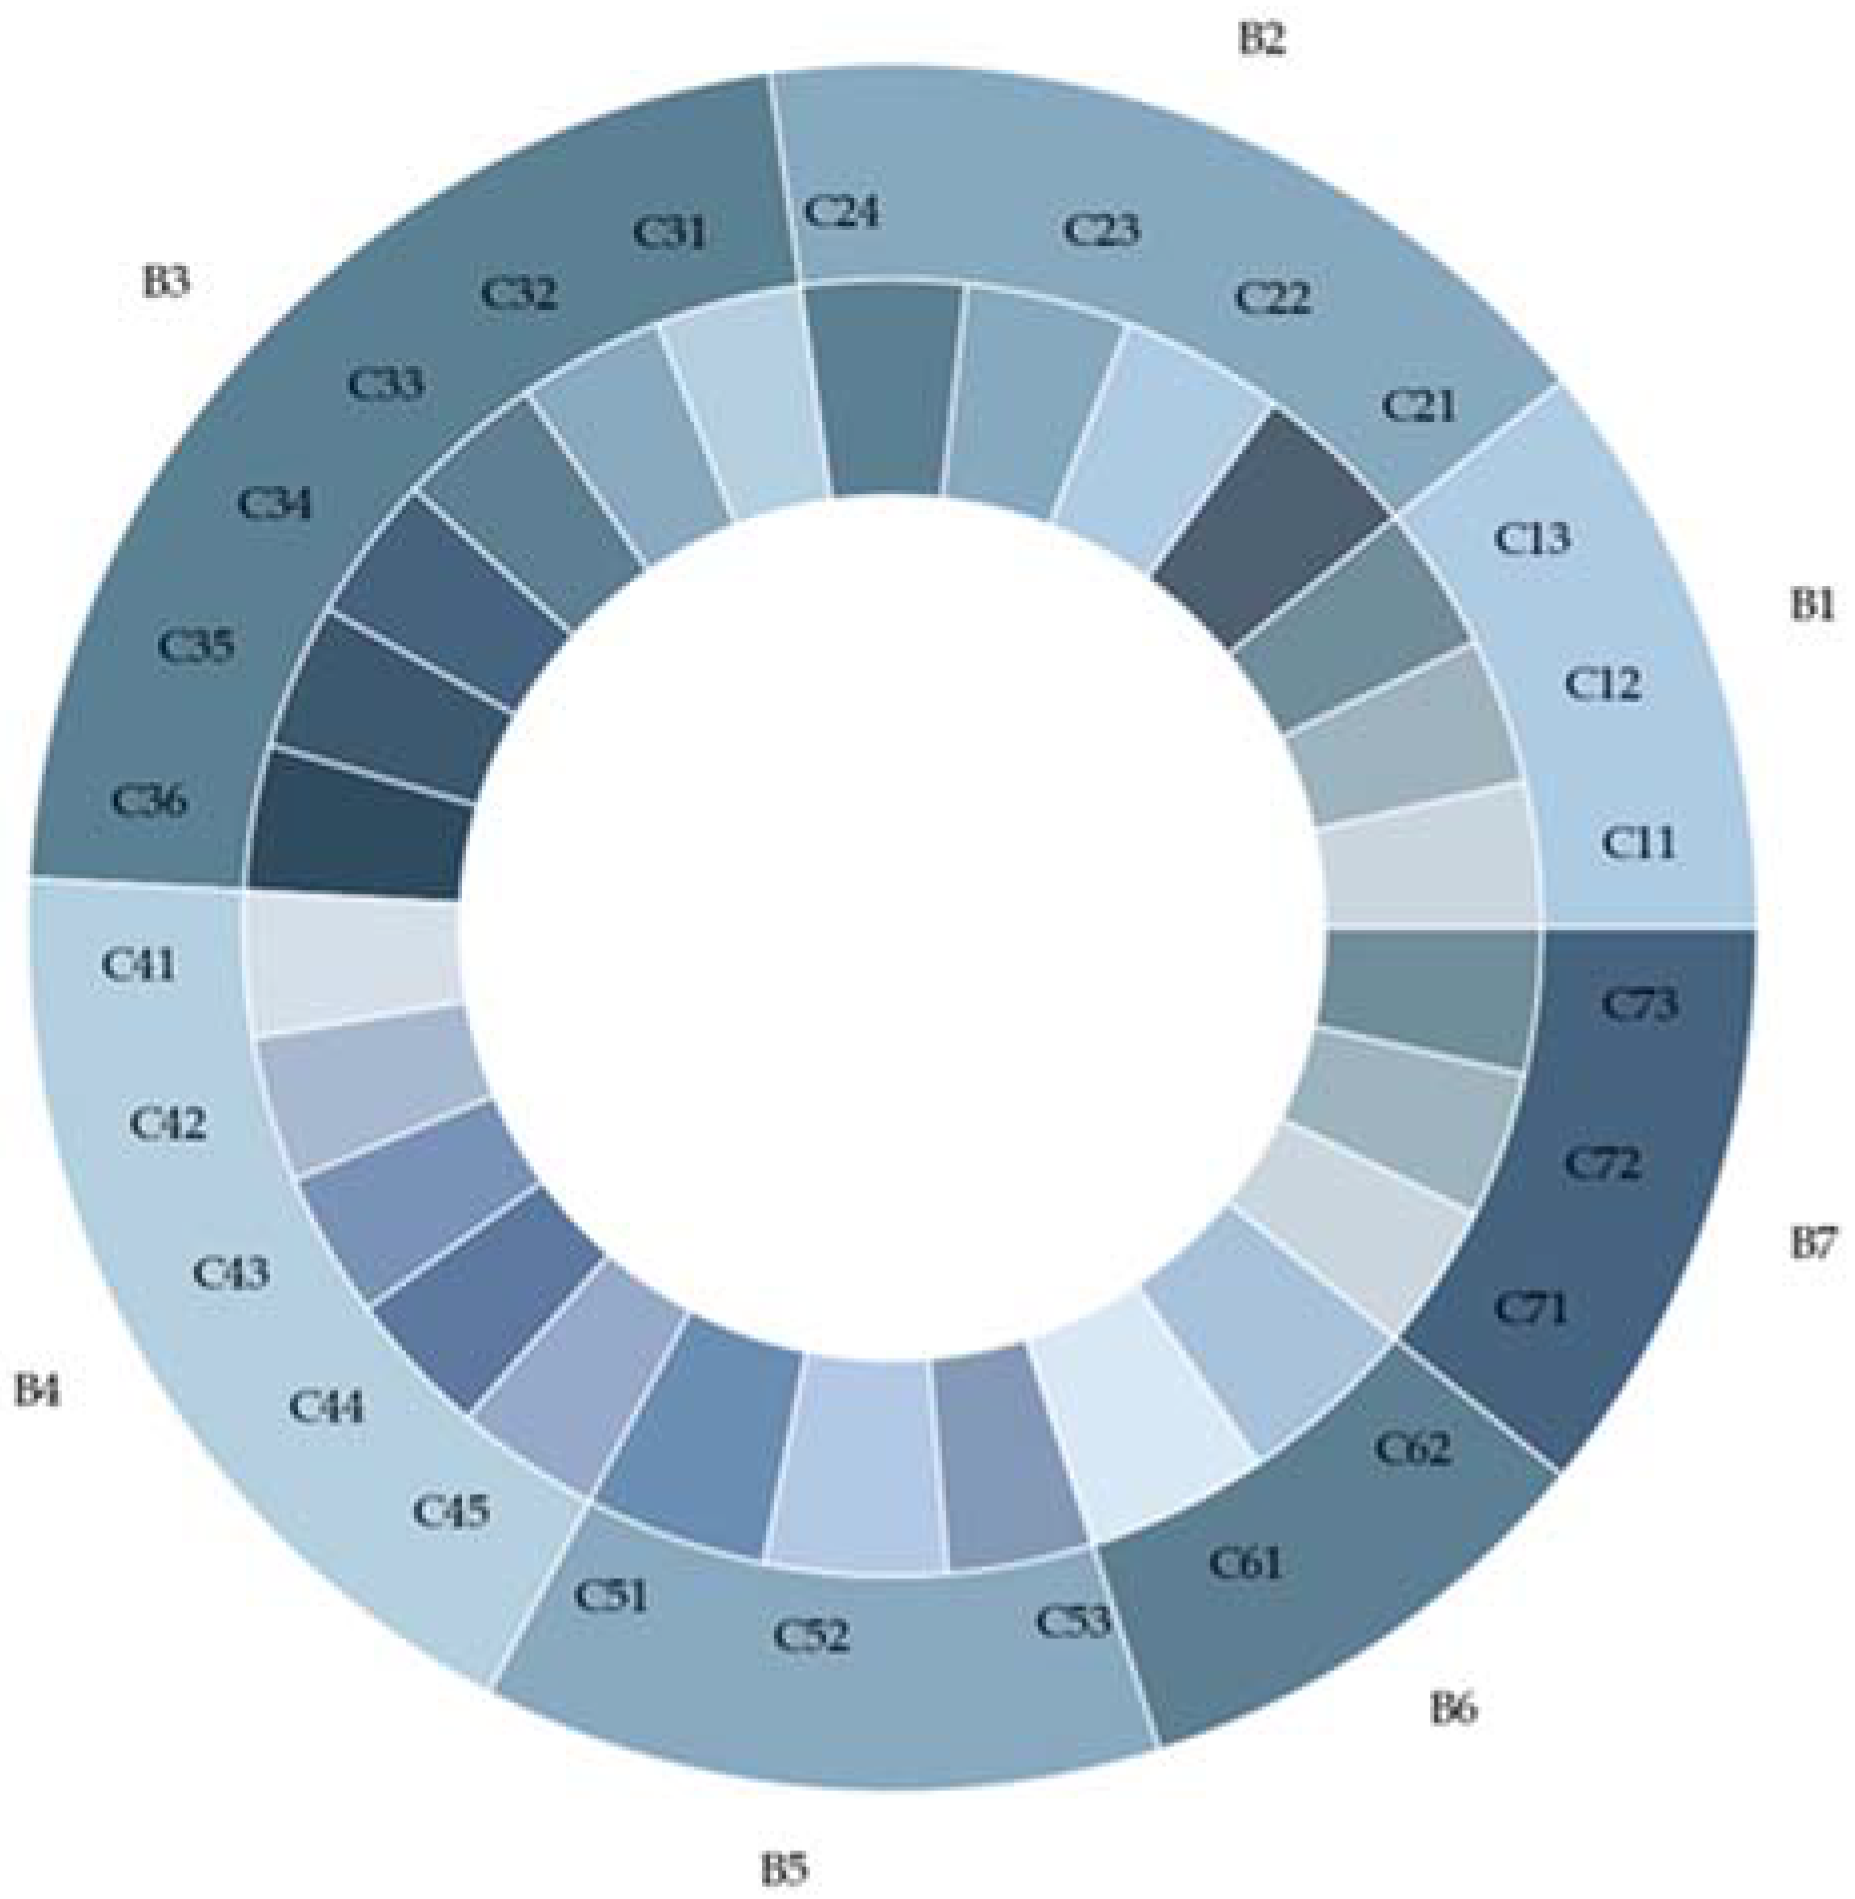
3.2.3. Establishment of the Evaluation Indicator System
3.2.4. Generalizability Analysis of the Indicator System
3.3. Construction of the Evaluation Model
3.3.1. Classification of Energy Saving and Emission Reduction Levels
3.3.2. Establishment of the Grading Matrix Based on the Cloud Model
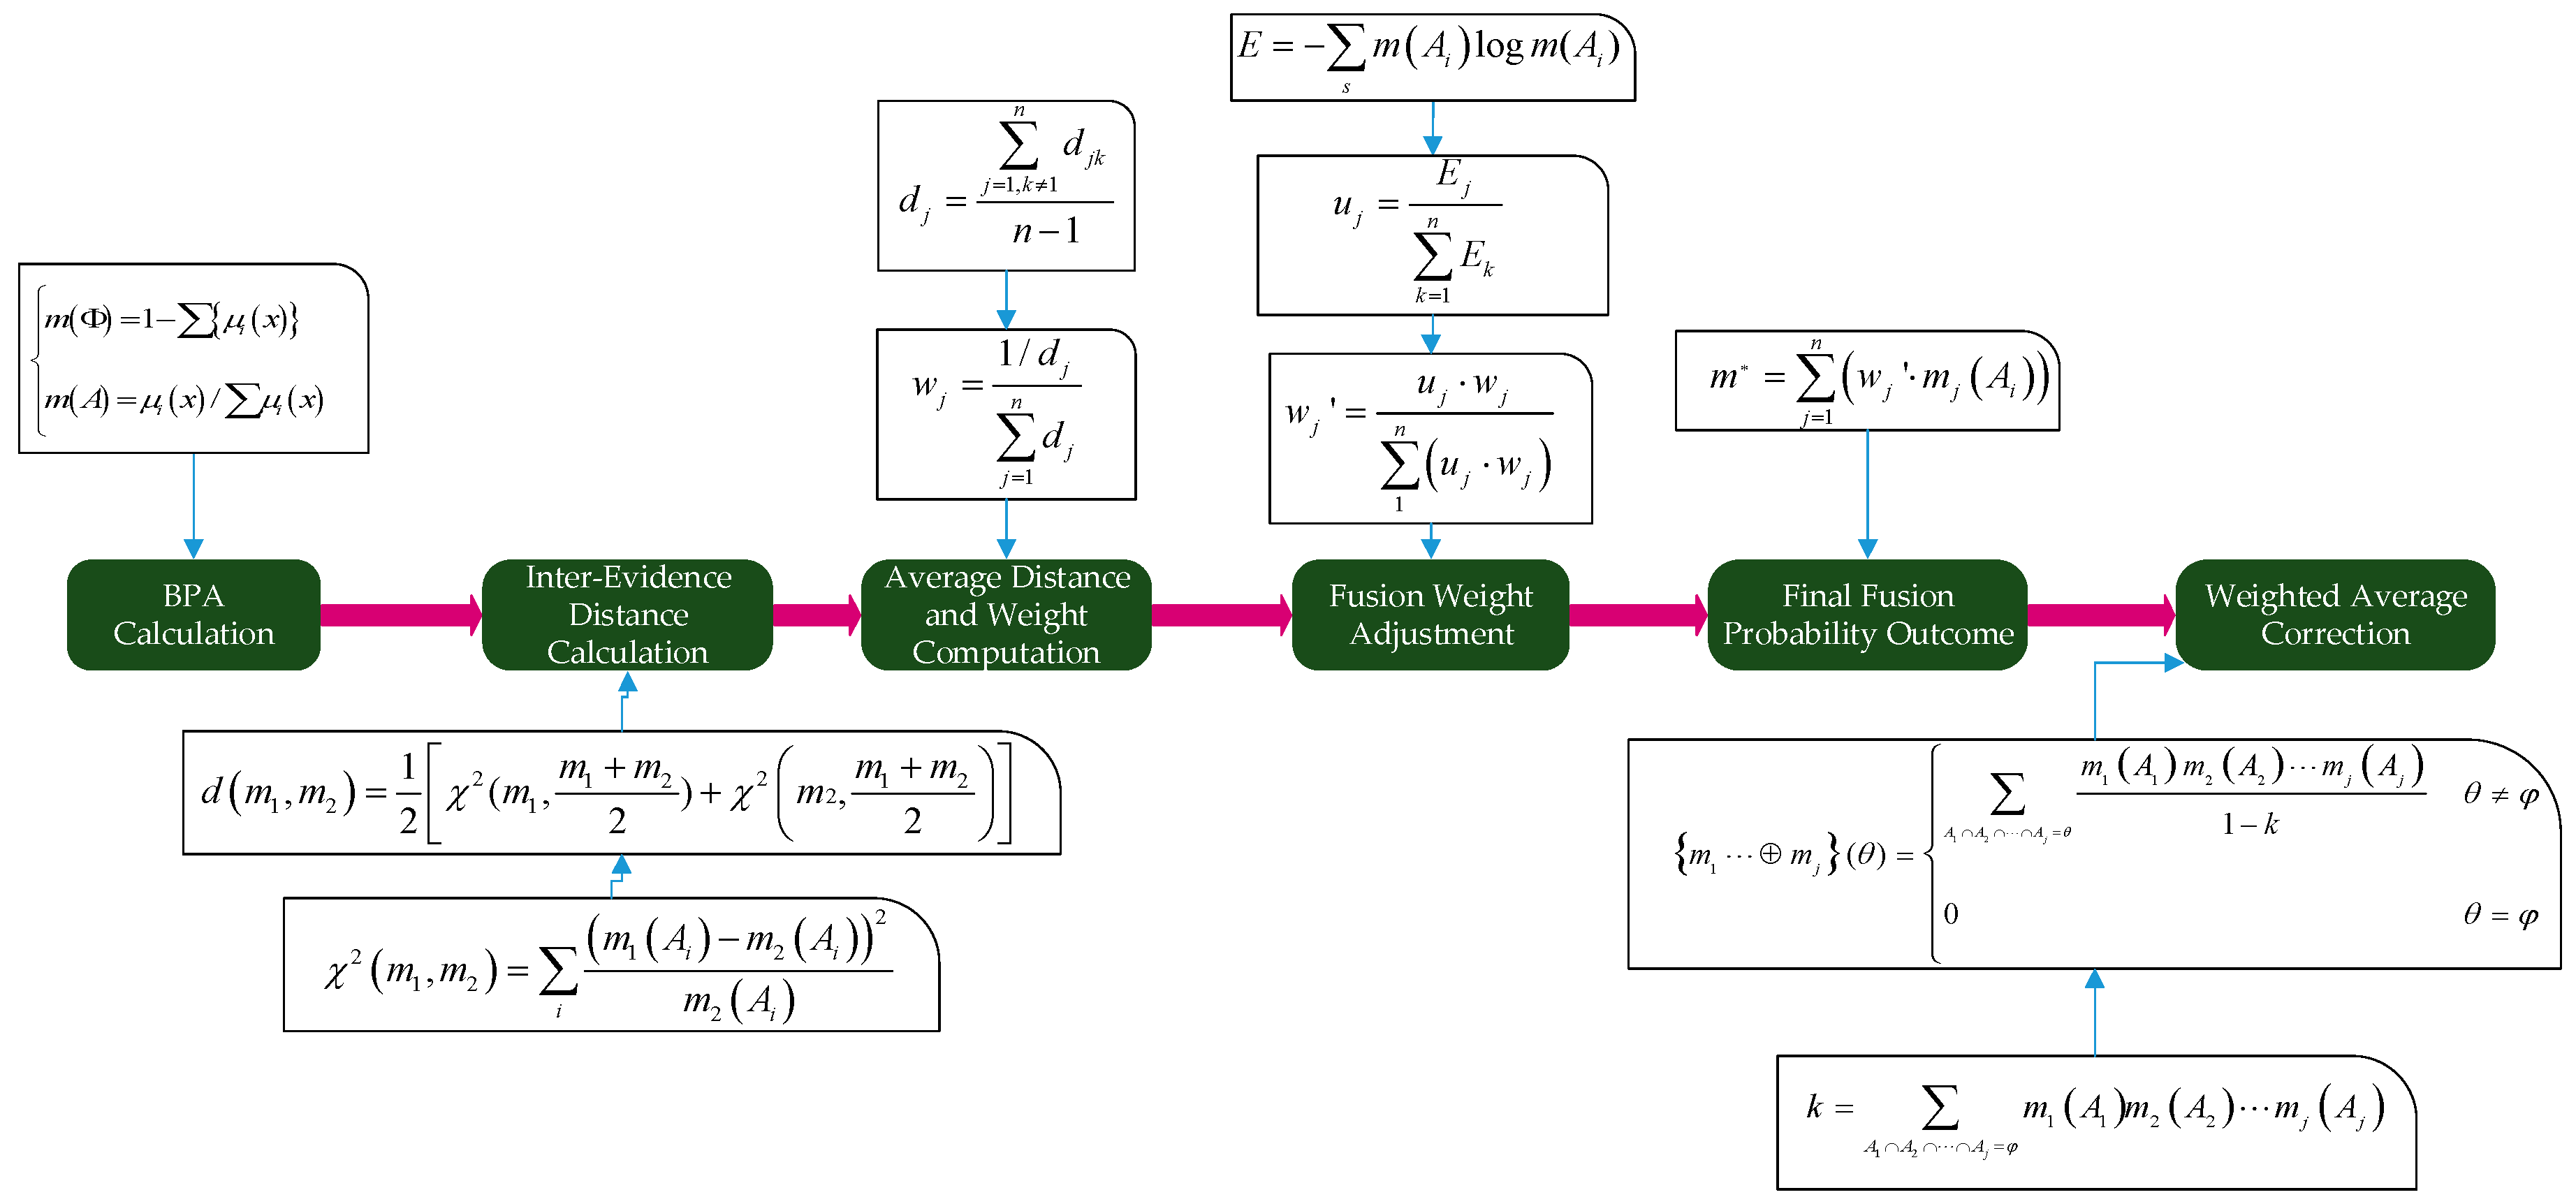
3.3.3. Optimization of ESER Evaluation Based on D-S Evidence Theory
4. Case Study
4.1. Overview of the Case
4.2. Calculation of Energy Saving and Emission Reduction Levels for Indicators
4.3. Establishment of the Indicator Grading Matrix Based on the Cloud Matter Element Model
4.4. Optimization of ESER Evaluation Based on D-S Evidence Theory
4.5. Local Sensitivity Analysis (LSA)
5. Results and Discussion
5.1. Analysis and Discussion of Results
5.2. Discussion on Uniformity
6. Conclusions
- (1)
- The current findings are primarily based on the long-process model within Chinese steel enterprises. Further validation is required to ascertain applicability across different production modes, enterprise scales, and international contexts. Future research should incorporate multi-case comparative studies involving diverse enterprises to enhance model generalizability.
- (2)
- Relying solely on experts from Chinese enterprises for indicator validation might limit the system’s global universality. Future studies could engage international experts and potentially employ data-driven methods (e.g., statistical validation) to refine or corroborate the indicator set, thereby improving robustness.
- (3)
- The analysis adopts an enterprise-centric view within the production phase. Future research could benefit from a broader life cycle assessment (LCA) perspective, encompassing data on steel usage efficiency and recycling across various sectors to evaluate ESER factors throughout the entire product lifecycle, offering valuable insights for policy development.
- (4)
- The current study utilizes data from a specific period, thus capturing a static snapshot of ESER performance. Future work should incorporate time-series data to establish a dynamic analysis framework, enabling the assessment of ESER trends and the longitudinal effectiveness of improvement initiatives within steel enterprises.
Author Contributions
Funding
Institutional Review Board Statement
Informed Consent Statement
Data Availability Statement
Conflicts of Interest
Appendix A

| No. | Expert Name | Organization | Job Category |
|---|---|---|---|
| 1 | Expert A | Sintering Plant, MG Co., Ltd. | production supervisor |
| 2 | Expert B | Sintering Plant, MG Co., Ltd. | deputy chief engineer of production |
| 3 | Expert C | Sintering Plant, MG Co., Ltd. | plant manager |
| 4 | Expert D | Sintering Plant, MG Co., Ltd. | deputy plant manager |
| 5 | Expert E | CJ Steel Co. | director of energy and environmental center |
| 6 | Expert F | CJ Steel Co. | head of manufacturing department |
| 7 | Expert G | CJ Steel Co. | assistant to general manager |
| 8 | Expert H | WH Steel Co. | chief engineer of production |
| 9 | Expert I | WH Steel Co. | director of production department |
| 10 | Expert J | Sintering Plant, BG Co., Ltd. | deputy plant manager |
| 11 | Expert K | Sintering Plant, BG Co., Ltd. | chief engineer of production |
| 12 | Expert L | Sintering Plant, BG Co., Ltd. | technical supervisor |
| 13 | Expert M | Sintering Plant, BG Co., Ltd. | plant manager |
| 14 | Expert N | CG Steel Co. | deputy chief engineer |
| 15 | Expert O | CG Steel Co. | senior technical manager |
| Objective | Primary Indicator | No. | Secondary Indicator | Recognized by Experts (Yes) | Not Recognized by Experts (No) | Recognition Rate (%) |
|---|---|---|---|---|---|---|
| Evaluation indicators for ESER in steel enterprises | Raw material quality (B1) | 1 | Fuel particle size (C11) | 14 | 1 | 93.33% |
| 2 | Furnace iron ore quality (C12) | 15 | 0 | 100% | ||
| 3 | Harmful substances in raw materials (C13) | 14 | 1 | 93.33% | ||
| 4 | Raw material particle size (C14) | 13 | 2 | 86.66% | ||
| 5 | Furnace chemical and physical index (C15) | 14 | 1 | 93.33% | ||
| Equipment performance (B2) | 6 | Sintering machine performance (C21) | 13 | 2 | 86.66% | |
| 7 | Blast furnace equipment performance (C22) | 14 | 1 | 93.33% | ||
| 8 | Heating furnace equipment performance (C23) | 15 | 0 | 100% | ||
| Resource consumption (B3) | 9 | Solvent unit consumption (C31) | 14 | 1 | 93.33% | |
| 10 | Fuel unit consumption (C32) | 15 | 0 | 100% | ||
| 11 | Coke ratio (C33) | 15 | 0 | 100% | ||
| 12 | Coal ratio (C34) | 13 | 2 | 86.66% | ||
| 13 | Iron-to-steel ratio (C35) | 14 | 1 | 93.33% | ||
| 14 | Oxygen consumption for steelmaking (C36) | 15 | 0 | 100% | ||
| 15 | Coal gas unit consumption for rolling (C37) | 15 | 0 | 100% | ||
| Secondary energy utilization (B4) | 16 | Dust ash utilization (C41) | 6 | 9 | 40% | |
| 17 | Flue gas heat recovery rate (C42) | 14 | 1 | 93.33% | ||
| 18 | Blast furnace pressure Recovery utilization rate (C43) | 15 | 0 | 100% | ||
| 19 | Converter gas recovery per ton of steel (C44) | 14 | 1 | 93.33% | ||
| 20 | Converter gas utilization per ton of steel (C45) | 15 | 0 | 100% | ||
| Process integration (B5) | 21 | Hot delivery rate (C51) | 13 | 2 | 86.66% | |
| 22 | Automated control degree (C52) | 13 | 2 | 86.66% | ||
| Professional skills (B6) | 23 | Sintering operation skills (C61) | 14 | 1 | 93.33% | |
| 24 | Blast furnace operation skills (C62) | 14 | 1 | 93.33% | ||
| 25 | Converter operation skills (C63) | 13 | 2 | 86.66% | ||
| 26 | Heating furnace operation skills (C64) | 14 | 1 | 93.33% | ||
| Institutional training (B7) | 27 | Gas recovery equipment maintenance level (C71) | 14 | 1 | 93.33% | |
| 28 | Rolling equipment maintenance level (C72) | 13 | 2 | 86.66% |
| Dimension | Primary Indicator | Secondary Indicator | Indicator Definition |
|---|---|---|---|
| WuLi (Physical) | Raw material quality (B1) | Fuel particle size (C11) | Percentage of fuel particles with sizes ranging between 25 and 80 mm, ensuring optimal combustion efficiency. |
| Furnace iron ore quality (C12) | Average grade of furnace iron ore input, reflecting material quality. | ||
| Harmful substances in raw materials (C13) | Distribution and concentration of harmful impurities in raw materials, affecting production quality. | ||
| Furnace chemical and physical index (C14) | Stability and consistency of the chemical and physical properties of the furnace materials, crucial for ensuring efficient and safe operations. | ||
| Equipment performance (B2) | Sintering machine performance (C21) | Installation quality and operational reliability of sintering equipment. | |
| Blast furnace equipment performance (C22) | Comprehensive performance of blast furnace equipment, including operational stability and maintenance standards. | ||
| Heating furnace equipment performance (C23) | Performance of heating furnace equipment, assessing efficiency and stability during operation. | ||
| ShiLi (Process) | Resource consumption (B3) | Solvent consumption per unit (C31) | Total solvent consumption divided by the weight of the product produced by sintering |
| Fuel unit consumption (C32) | Total fuel consumption divided by total product obtained from sintering production | ||
| Fuel ratio (C33) | Combined amount of coke and coal consumed per ton of iron produced in the blast furnace | ||
| Iron to steel ratio (C34) | Ratio of molten iron in the furnace to steel output in the steelmaking converter production process | ||
| Oxygen consumption in steelmaking (C35) | Oxygen consumption per ton of steel in the steelmaking process | ||
| Gas consumption in rolling (C36) | Amount of gas consumed per ton of steel in the billet setting process | ||
| Secondary energy utilization (B4) | Flue gas heat recovery rate (C41) | Ratio of energy gained through flue gas waste heat recovery to total waste heat in the flue gas. | |
| Blast furnace gas utilization rate (C42) | Proportion of the reducing components C0 and H2 in the gas involved in the reduction reaction and the proportion of heat absorbed by the charge. | ||
| Blast furnace pressure recovery utilization rate (C43) | Energy recovered by residual pressure in the blast furnace divided by the total energy of residual pressure in the blast furnace. | ||
| Converter gas recovery per ton of steel (C44) | The amount of gas produced during the smelting of one ton of iron into qualified steel, i.e., the amount of gas recovered from the gas cabinet at equal pressure. | ||
| Process integration (B5) | Hot delivery rate (C51) | Billet into the heating furnace surface temperature ≥ 400 °C billet share. | |
| Automated control degree (C52) | Degree of automation of production lines. | ||
| Renli (Human) | Professional skills (B6) | Operational skills level | Skill level, proficiency of staff. |
| Equipment maintenance level | High and low levels of equipment maintenance. | ||
| Institutional training (B7) | Employee training level (C71) | Number of training sessions on ESER attended by managers. | |
| Management system improvement level (C72) | Whether the management system of ESER is perfect. |
| No. | Evaluation Indicator | Unit | Excellent | Good | Average | Blow Average | Poor |
|---|---|---|---|---|---|---|---|
| 1 | Fuel particle size (C11) | % | Proportion of 0.5–5 mm particles > 70% | Proportion of 0.5–5 mm particles [70–60%) | Proportion of 0.5–5 mm particles [60–50%) | Proportion of 0.5–5 mm particles [50–40%) | Proportion of 0.5–5 mm particles ≤ 40% |
| 2 | Furnace iron ore quality (C12) | % | >57 | [57–56) | [56–55) | [55–54) | ≤54 |
| 3 | Solvent unit consumption (C31) | kg/t | <130 | [130–140) | [140–150) | [150–160) | ≥160 |
| 4 | Fuel unit consumption (C32) | kg/t | <48 | [48–50) | [50–52) | [52–54) | ≥54 |
| 5 | Fuel ratio (C33) | kg/t | <500 | [500–520) | [520–540) | [540–550) | ≥550 |
| 6 | Iron-to-steel ratio (C34) | % | <80 | [80–85) | [85–90) | [90–95) | ≥95 |
| 7 | Oxygen consumption for steelmaking (C35) | m3/t | <45 | [45–48) | [48–51) | [51–53) | ≥53 |
| 8 | Gas consumption per unit in rolling mill (C36) | m3/t | <260 | [260–280) | [280–290) | [290–300) | ≥300 |
| 9 | Flue gas heat recovery rate (C41) | % | >70 | [70–65) | [65–60) | [60–55) | ≤55 |
| 10 | Blast furnace gas utilization rate (C42) | % | >50 | [50–45) | [45–40) | [40–35) | ≤35 |
| 11 | Recovery utilization rate (C43) | % | >90 | [90–70) | [70–50) | [50–40) | ≤40 |
| 12 | Converter gas recovery per ton of steel (C44) | m3/t | >120 | [120–110) | [110–100) | [100–90) | ≤90 |
| 13 | Hot delivery rate (C51) | % | >90 | [90–80) | [80–70) | [70–60) | ≤60 |
| No. | Evaluation Indicator | Excellent | Good | Average | Below Average | Poor |
|---|---|---|---|---|---|---|
| 1 | Harmful substances in raw materials (C13) | Almost no harmful components in raw materials. | Few harmful impurities in raw materials. | Harmful impurities present but within national standards. | Significant harmful impurities, content near upper limit of national standards. | High quantity of harmful impurities, exceeding national standards. |
| 2 | Furnace stability (C14) | Highly stable physical and chemical indicators. | Indicators show slight fluctuations with high stability. | Indicators generally stable but occasionally show significant fluctuations. | Significant deviations in indicators, low stability. | Large deviations in indicators, poor stability. |
| 3 | Sintering equipment performance (C21) | Ultra-large sintering machines with advanced ESER facilities; within 5 years of operation; world-class design indicators. | Large sintering machines with mature facilities; within 10 years of operation; no air leakage at critical points; domestically advanced. | Equipment within 15 years of operation; minor air leaks manageable through regular maintenance. | Equipment over 15 years old; facilities outdated; low efficiency and high energy consumption. | Equipment over 20 years old; severe air leakage; outdated and in need of replacement. |
| 4 | Blast furnace equipment performance (C22) | Within 10 years of operation; volume > 2000 m3; advanced control and feeding systems; leading energy facilities. | Within 15 years of operation; volume > 1000 m3; advanced feeding and control systems; modern energy facilities. | Equipment over 15 years old; volume < 1000 m3; outdated energy systems requiring continuous upgrades. | Equipment over 20 years old; volume < 800 m3; incomplete energy facilities; outdated. | Equipment over 25 years old; volume < 400 m3; no energy facilities; approaching end of life. |
| 5 | Heating furnace equipment performance (C23) | Advanced regenerative step-hearth furnace with composite insulation; excellent heat retention and control. | Regenerative step-hearth furnace with honeycomb ceramic insulation; good thermal inertia and flexible operation. | Step-hearth furnace with basic regenerative design; inadequate insulation, high energy loss. | Step-hearth furnace with ordinary refractory insulation; poor heat retention and low efficiency. | Pusher-type furnace; high energy consumption and low efficiency; obsolete technology. |
| 6 | Automation level (C52) | Intelligent manufacturing technology with centralized control of major processes. | Full integration of basic and process automation across all production lines. | Key lines automated, but process control lacks full integration. | Few lines with integrated automation, minimal automation in other areas. | Traditional manual equipment with no automation, labor-intensive operations. |
| 7 | Operational skills (C61) | Over 50% of key operators hold senior technician qualifications or have won national-level skill competitions; possess over 5 years of relevant work experience. | 40–50% of key operators hold technician qualifications or have won provincial-level skill competitions; possess 3–5 years of relevant work experience. | 40–60% of key operators hold intermediate worker qualifications or higher; possess 2–3 years of relevant work experience. | 30–40% of key operators hold junior worker qualifications; possess 1–2 years of relevant work experience. | Less than 20% of key operators hold any qualification certificates; lack relevant work experience. |
| 8 | Equipment maintenance level (C62) | High maintenance level, almost no unplanned repairs. | Relatively high level of equipment maintenance; low frequency of unscheduled maintenance. 3–4 instances of unscheduled maintenance annually. | Average level of equipment maintenance; moderate frequency of unscheduled maintenance. 5–6 instances of unscheduled maintenance annually. | Low level of equipment maintenance; high frequency of unscheduled maintenance. 7–9 instances of unscheduled maintenance annually. | Very low level of equipment maintenance; ≥10 instances of unscheduled maintenance annually. |
| 9 | Management training (C71) | Management personnel participate in energy saving and emission reduction (ESER)-related training ≥ 7 times per year, with each session lasting ≥ 4 h. | Management personnel participate in ESER-related training 5–6 times per year, with each session lasting ≥ 3 h. | Management personnel participate in ESER-related training 4–5 times per year, with each session lasting ≥ 2 h. | Management personnel participate in ESER-related training 2–3 times per year, with each session lasting < 2 h. | Management personnel participate in ESER-related training < 2 times per year, or have not participated in any relevant training. |
| 10 | Management system maturity (C72) | Comprehensive and well-established energy-saving and emission-reduction management system. | Fairly complete management system. | Relevant management system in place but requires further improvement. | Management system exists but is not fully developed. | No management system for energy-saving and emission-reduction. |
| Secondary Indicator | Expert 1 | Expert 2 | Expert 3 | Expert 4 | Expert5 | Expert 6 | Expert 7 | Expert 8 | Expert 9 | Expert 10 | Average Score |
|---|---|---|---|---|---|---|---|---|---|---|---|
| C11 | 86 | 88 | 85 | 86 | 87 | 88 | 88 | 85 | 86 | 88 | 86.70 |
| C12 | 77 | 75 | 76 | 76 | 78 | 78 | 79 | 78 | 77 | 77 | 77.10 |
| C13 | 96 | 95 | 88 | 87 | 87 | 86 | 89 | 87 | 88 | 79 | 88.20 |
| C14 | 96 | 76 | 88 | 86 | 78 | 76 | 86 | 88 | 79 | 88 | 84.10 |
| C21 | 88 | 85 | 87 | 86 | 82 | 86 | 95 | 76 | 78 | 78 | 84.10 |
| C22 | 78 | 78 | 76 | 98 | 96 | 85 | 87 | 86 | 88 | 87 | 85.90 |
| C23 | 78 | 76 | 87 | 88 | 85 | 87 | 85 | 88 | 86 | 93 | 85.30 |
| C31 | 78 | 76 | 76 | 78 | 78 | 76 | 77 | 79 | 77 | 78 | 77.30 |
| C32 | 88 | 88 | 86 | 87 | 89 | 87 | 84 | 85 | 86 | 88 | 86.80 |
| C33 | 79 | 78 | 76 | 76 | 76 | 77 | 78 | 77 | 78 | 76 | 77.10 |
| C34 | 87 | 85 | 86 | 88 | 88 | 87 | 89 | 86 | 87 | 88 | 87.10 |
| C35 | 86 | 85 | 89 | 88 | 85 | 86 | 88 | 86 | 87 | 85 | 86.50 |
| C36 | 78 | 78 | 76 | 77 | 77 | 75 | 75 | 79 | 77 | 75 | 76.70 |
| C41 | 68 | 69 | 69 | 70 | 69 | 69 | 69 | 68 | 70 | 68 | 68.90 |
| C42 | 79 | 79 | 78 | 80 | 79 | 79 | 79 | 79 | 78 | 79 | 78.90 |
| C43 | 80 | 78 | 79 | 79 | 79 | 79 | 79 | 78 | 80 | 78 | 78.90 |
| C44 | 89 | 89 | 90 | 88 | 89 | 89 | 88 | 89 | 90 | 89 | 89.00 |
| C51 | 87 | 86 | 89 | 85 | 88 | 86 | 86 | 86 | 84 | 85 | 86.20 |
| C52 | 85 | 86 | 86 | 88 | 87 | 88 | 87 | 95 | 95 | 78 | 87.50 |
| C61 | 76 | 78 | 86 | 78 | 85 | 76 | 55 | 68 | 67 | 68 | 73.70 |
| C62 | 66 | 68 | 78 | 77 | 76 | 77 | 75 | 96 | 94 | 50 | 75.70 |
| C71 | 76 | 77 | 78 | 68 | 86 | 88 | 87 | 89 | 86 | 88 | 82.30 |
| C72 | 88 | 89 | 88 | 89 | 88 | 69 | 68 | 78 | 79 | 78 | 81.40 |
References
- IPCC. The Evidence Is Clear: The Time for Action Is Now. We Can Halve Emissions by 2030. 2022. Available online: https://www.ipcc.ch/2022/04/04/ipcc-ar6-wgiii-pressrelease/ (accessed on 13 October 2024).
- China Government Network. China’s Responsibility in a Changing World—Part 1 of a Series of Interpretations of President Xi Jinping’s Important Speech at the General Debate of the 75th UN General Assembly. 2020. Available online: https://www.gov.cn/xinwen/2020-09/23/content_5546546.htm (accessed on 16 October 2024).
- Ho, D.C.P.; Ahmed, S.M.; Kwan, J.C.; Ming, F.Y.W. Site Safety Management in Hong Kong. J. Manag. Eng. 2000, 16, 34–42. [Google Scholar] [CrossRef]
- International Energy Agency. India’s Hydrogen Mission: A New Step Towards Energy Transition. 2021. Available online: https://www.iea.org/commentaries/india-s-clean-energy-transition-is-rapidly-underway-benefiting-the-entire-world (accessed on 16 October 2024).
- US Environmental Protection Agency. Clean Power Plan: Overview of the Clean Power Plan. 2015. Available online: https://archive.epa.gov/epa/cleanpowerplan/fact-sheet-overview-clean-power-plan.html (accessed on 16 October 2024).
- Energy Technology Perspectives—Analysis. 2020. Available online: https://www.iea.org/reports/energy-technology-perspectives-2020 (accessed on 16 October 2024).
- Li, Y.J.; Xu, W.Q.; Zhu, T.Y.; Qi, F.; Xu, T.B.; Wang, Z. CO2 Emissions from BF-BOF and EAF Steelmaking Based on Material Flow Analysis. AMR 2012, 518, 5012–5015. [Google Scholar] [CrossRef]
- Wang, H.; Zhao, W.; Chu, M.; Feng, C.; Liu, Z.; Tang, J. Current Status and Development Trends of Innovative Blast Furnace Ironmaking Technologies Aimed to Environmental Harmony and Operation Intellectualization. J. Iron Steel Res. Int. 2017, 24, 751–769. [Google Scholar] [CrossRef]
- Zhu, Z. Dealing with a Differentiated Whole: The Philosophy of the WSR Approach. Syst. Pract. Action Res. 2000, 13, 21–57. [Google Scholar] [CrossRef]
- Jian, H.; Hao, H.; Haize, P.; Chuan, L.; Xiaoqin, L.; Yan, W.; Haidan, J.; Changliang, Z. Research on Brownfield Redevelopment Based on Wuli-Shili-Renli System Theory and Catastrophe Progression Method. PLoS ONE 2022, 17, e0277324. [Google Scholar] [CrossRef] [PubMed]
- Li, G.; Zhou, Y.; Liu, F.; Wang, T. Regional Differences of Manufacturing Green Development Efficiency Considering Undesirable Outputs in the Yangtze River Economic Belt Based on Super-SBM and WSR System Methodology. Front. Environ. Sci. 2021, 8, 631911. [Google Scholar] [CrossRef]
- Du, Y.W.; Han, C. Classical Models and Its Applications in D-S Evidence Theory. AMM 2012, 204, 4958–4961. [Google Scholar] [CrossRef]
- Lin, B.; Yang, L. The Potential Estimation and Factor Analysis of China′s Energy Saving on Thermal Power Industry. Energy Policy 2013, 62, 354–362. [Google Scholar] [CrossRef]
- Morrow, W.R.; Hasanbeigi, A.; Sathaye, J.; Xu, T. Assessment of Energy Efficiency Improvement and CO2 Emission Reduction Potentials in India’s Cement and Iron & Steel Industries. J. Clean. Prod. 2014, 65, 131–141. [Google Scholar] [CrossRef]
- Wang, Q.; Han, R.; Huang, Q.; Hao, J.; Lv, N.; Li, T.; Tang, B. Research on Energy Saving and Emissions Reduction Based on AHP-Fuzzy Synthetic Evaluation Model: A Case Study of Tobacco Enterprises. J. Clean. Prod. 2018, 201, 88–97. [Google Scholar] [CrossRef]
- Li, N.; Ma, D.; Chen, W. Quantifying the Impacts of Decarbonisation in China’s Cement Sector: A Perspective from an Integrated Assessment Approach. Appl. Energy 2017, 185, 1840–1848. [Google Scholar] [CrossRef]
- Chen, Y.; Han, Y.; Zhu, Q. Energy and Environmental Efficiency Evaluation Based on a Novel Data Envelopment Analysis: An Application in Petrochemical Industries. Appl. Therm. Eng. 2017, 119, 156–164. [Google Scholar] [CrossRef]
- Xie, Z.M.; Jiang, Z.M. Fuzzy Comprehensive Evaluation of Energy Saving and Emission Reduction Performance of Road Transport Enterprises. Adv. Mat. Res. 2012, 616, 1180–1184. [Google Scholar] [CrossRef]
- Ma, R.; Guo, Y. Evaluation of Energy Saving and Emission Reduction Effect of Distributed Energy System. Environ. Eng. Res. 2023, 29, 230529. [Google Scholar] [CrossRef]
- Zhou, S.; Yan, L.; Huang, C. Energy Saving and Emission Reduction Evaluation of Mountain City Traffic of Road Based on AHP-Entropy. In Proceedings of the 2012 International Conference on Industrial Control and Electronics Engineering, Xi’an, China, 23 August 2012; pp. 811–817. [Google Scholar]
- Zadeh, L.A. Fuzzy Sets. Inform. Control. 1965, 8, 338–353. [Google Scholar] [CrossRef]
- Saaty, R.W. The Analytic Hierarchy Process—What It Is and How It Is Used. Math. Modell. 1987, 9, 161–176. [Google Scholar] [CrossRef]
- Cui, Y.; Feng, P.; Jin, J.; Liu, L. Water Resources Carrying Capacity Evaluation and Diagnosis Based on Set Pair Analysis and Improved the Entropy Weight Method. Entropy 2018, 20, 359. [Google Scholar] [CrossRef]
- Deng, Y.; Chan, F.T.S.; Wu, Y.; Wang, D. A New Linguistic MCDM Method Based on Multiple-Criterion Data Fusion. Expert. Syst. Appl. 2011, 38, 6985–6993. [Google Scholar] [CrossRef]
- International Energy Agency. World Energy Outlook 2022—International Cooperation Center. 2022. Available online: https://www.iea.org/reports/world-energy-outlook-2022 (accessed on 16 October 2024).
- Normile, D. Can China, the World’s Biggest Coal Consumer, Become Carbon Neutral by 2060? Science 2020, 919, 613–8084. [Google Scholar] [CrossRef]
- An, R.; Yu, B.; Li, R.; Wei, Y.-M. Potential of Energy Savings and CO2 Emission Reduction in China’s Iron and Steel Industry. Appl. Energy 2018, 226, 862–880. [Google Scholar] [CrossRef]
- Wen, Z.; Wang, Y.; Li, H.; Tao, Y.; De Clercq, D. Quantitative Analysis of the Precise Energy Conservation and Emission Reduction Path in China’s Iron and Steel Industry. J. Environ. Manag. 2019, 246, 717–729. [Google Scholar] [CrossRef] [PubMed]
- Zhang, S.; Yi, B.-W.; Worrell, E.; Wagner, F.; Crijns-Graus, W.; Purohit, P.; Wada, Y.; Varis, O. Integrated Assessment of Resource-Energy-Environment Nexus in China’s Iron and Steel Industry. J. Clean. Prod. 2019, 232, 235–249. [Google Scholar] [CrossRef]
- Lei, T.; Wang, D.; Yu, X.; Ma, S.; Zhao, W.; Cui, C.; Meng, J.; Tao, S.; Guan, D. Global Iron and Steel Plant CO2 Emissions and Carbon-Neutrality Pathways. Nature 2023, 622, 514–520. [Google Scholar] [CrossRef]
- Hasanbeigi, A.; Arens, M.; Price, L. Alternative Emerging Ironmaking Technologies for Energy-Efficiency and Carbon Dioxide Emissions Reduction: A Technical Review. Renew. Sustain. Energy Rev. 2014, 33, 645–658. [Google Scholar] [CrossRef]
- Na, H.; Sun, J.; Qiu, Z.; He, J.; Yuan, Y.; Yan, T.; Du, T. A Novel Evaluation Method for Energy Efficiency of Process Industry—A Case Study of Typical Iron and Steel Manufacturing Process. Energy 2021, 233, 121081. [Google Scholar] [CrossRef]
- Liang, Q.; Liu, Z.; Chen, Z. A Networked Method for Multi-Evidence-Based Information Fusion. Entropy 2023, 25, 69. [Google Scholar] [CrossRef] [PubMed]
- Liu, Y.; Cheng, Y.; Zhang, Z.; Wu, J. Multi-Information Fusion Fault Diagnosis Based on KNN and Improved Evidence Theory. J. Vib. Eng. Technol. 2022, 10, 841–852. [Google Scholar] [CrossRef]
- Wang, R.C. Analysis and Improvement of Combination Rule in D-S Theory. AMM 2014, 556–562, 3930–3934. [Google Scholar] [CrossRef]
- Qin, A.; Hu, Q.; Zhang, Q.; Sun, G.; Shao, L. Work in Progress: Multi-Dimensionless Parameters Fusion Method Based on Improved D-S Evidence Theory. In Proceedings of the 9th International Conference on Communications and Networking in China, Maoming, China, 14–16 August 2014; pp. 617–620. [Google Scholar]
- Yang, J.; Huang, H.-Z.; Miao, Q.; Sun, R. A Novel Information Fusion Method Based on Dempster-Shafer Evidence Theory for Conflict Resolution. IDA 2011, 15, 399–411. [Google Scholar] [CrossRef]
- Chen, W.-H.; Du, S.-W.; Yang, T.-H. Volatile Release and Particle Formation Characteristics of Injected Pulverized Coal in Blast Furnaces. Energy Convers. Manag. 2007, 48, 2025–2033. [Google Scholar] [CrossRef]
- Du, S.W.; Chen, W.-H.; Lucas, J. Performances of Pulverized Coal Injection in Blowpipe and Tuyere at Various Operational Conditions. Energy Convers. Manag. 2007, 48, 2069–2076. [Google Scholar] [CrossRef]
- Hooey, L.; Riesbeck, J.; Wikström, J.-O.; Björkman, B. Role of Ferrous Raw Materials in the Energy Efficiency of Integrated Steelmaking. ISIJ Int. 2014, 54, 596–604. [Google Scholar] [CrossRef]
- Zhou, M.; Zhao, D.; Zhang, J.; Yang, G.; Hou, E.; Liu, M.; Zhang, H.; Jiang, X.; Fan, K.; Shen, F. Research on the Quality Improvement and Consumption Reduction of Iron Ore Agglomeration Based on Optimization. Metals 2023, 13, 480. [Google Scholar] [CrossRef]
- GB/T 20565—2022; Iron Ores and Direct Reduced Iron—Vocabulary. National Iron Ore and Direct Reduced Iron Standardization Technical Committee: Beijing, China, 2022.
- Gonzalez Hernandez, A.; Paoli, L.; Cullen, J.M. How Resource-Efficient Is the Global Steel Industry? Resour. Conserv. Recycl. 2018, 133, 132–145. [Google Scholar] [CrossRef]
- Cheng, Z.; Tan, Z.; Guo, Z.; Yang, J.; Wang, Q. Recent Progress in Sustainable and Energy-Efficient Technologies for Sinter Production in the Iron and Steel Industry. Renew. Sustain. Energy Rev. 2020, 131, 110034. [Google Scholar] [CrossRef]
- GB/T 50632—2019; Design Standard for Energy Conservation of Iron and Steel Enterprises. National Standardization Committee of China: Beijing, China, 2019.
- Optimization of Energy Efficiency. Energy Consumption and CO2 Emission in Typical Iron and Steel Manufacturing Process. Energy 2022, 257, 124822. [Google Scholar] [CrossRef]
- Worrell, E. Advanced Technologies and Energy Efficiency in the Iron and Steel Industry in China. Energy Sustain. Dev. 1995, 2, 27–40. [Google Scholar] [CrossRef]
- Lu, B.; Chen, G.; Chen, D.; Yu, W. An Energy Intensity Optimization Model for Production System in Iron and Steel Industry. Appl. Therm. Eng. 2016, 100, 285–295. [Google Scholar] [CrossRef]
- He, K.; Wang, L. A Review of Energy Use and Energy-Efficient Technologies for the Iron and Steel Industry. Renew. Sustain. Energy Rev. 2017, 70, 1022–1039. [Google Scholar] [CrossRef]
- Chen, L.; Yang, B.; Shen, X.; Xie, Z.; Sun, F. Thermodynamic Optimization Opportunities for the Recovery and Utilization of Residual Energy and Heat in China’s Iron and Steel Industry: A Case Study. Appl. Therm. Eng. 2015, 86, 151–160. [Google Scholar] [CrossRef]
- GB 21256—2013; Crude Steel Production Main Process Unit Product Energy Consumption Limit. National Standardization Committee: Beijing, China, 2013.
- He, C.; Feng, Y.; Feng, D.; Zhang, X. Exergy Analysis and Optimization of Sintering Process. Steel Res. Int. 2018, 89, 1800065. [Google Scholar] [CrossRef]
- Ahmed, H. New Trends in the Application of Carbon-Bearing Materials in Blast Furnace Iron-Making. Minerals 2018, 8, 561. [Google Scholar] [CrossRef]
- YB/T 6094—2023; Guidelines for Self-Generated Electricity Rate Evaluation of Waste Heat and Waste Energy in Steel Enterprises. National Standardization Committee: Beijing, China, 2023.
- DB12/1120—2022; Emission Standards for Atmospheric Pollutants in the Iron and Steel Industry. Tianjin Municipal Ecology and Environment Bureau: Tianjin, China, 2022.
- Xuan, Y.; Yue, Q. Forecast of Steel Demand and the Availability of Depreciated Steel Scrap in China. Resour. Conserv. Recycl. 2016, 109, 1–12. [Google Scholar] [CrossRef]
- Chen, W.; Yin, X.; Ma, D. A Bottom-up Analysis of China’s Iron and Steel Industrial Energy Consumption and CO2 Emissions. Appl. Energy 2014, 136, 1174–1183. [Google Scholar] [CrossRef]
- Chen, Y.; Zuo, H. Review of Hydrogen-Rich Ironmaking Technology in Blast Furnace. Ironmak. Steelmak. 2021, 48, 749–768. [Google Scholar] [CrossRef]
- Jiang, Z.; Zhang, X.; Jin, P.; Tian, F.; Yang, Y. Energy-Saving Potential and Process Optimization of Iron and Steel Manufacturing System: Energy-Saving Potential and Process Optimization of the System. Int. J. Energy Res. 2013, 37, 2009–2018. [Google Scholar] [CrossRef]
- Bhandari, S.; Hallowell, M.R. Identifying and Controlling Biases in Expert-Opinion Research: Guidelines for Variations of Delphi, Nominal Group Technique, and Focus Groups. J. Manag. Eng. 2021, 37, 4021015. [Google Scholar] [CrossRef]
- World Steel Association. World Steel Statistical Data 2022 [PDF]. Retrieved from World Steel Association Websit. 2022. Available online: https://www.worldsteel.org (accessed on 19 October 2024).
- GB/T 40084-2021; Guidance for Energy Management Performance Assessment in Iron and Steel Industry. National Market Supervision Administration, China National Standardization Administration Committee: Beijing, China, 2021.
- Dempster, A.P. Upper and Lower Probabilities Induced by a Multivalued Mapping. In Classic Works of the Dempster-Shafer Theory of Belief Functions; Yager, R.R., Liu, L., Eds.; Springer: Berlin/Heidelberg, Germany, 2008; pp. 57–72. ISBN 978-3-540-44792-4. [Google Scholar]
- Shafer, G. A Mathematical Theory of Evidence; Princeton University Press: Princeton, NJ, USA, 1976; ISBN 978-0-691-10042-5. [Google Scholar]
- Denœux, T. Logistic Regression, Neural Networks and Dempster–Shafer Theory: A New Perspective. Knowl. Based Syst. 2019, 176, 54–67. [Google Scholar] [CrossRef]
- Tong, Z.; Xu, P.; Denœux, T. An Evidential Classifier Based on Dempster-Shafer Theory and Deep Learning. Neurocomputing 2021, 450, 275–293. [Google Scholar] [CrossRef]
- Sun, R.; Huang, H.-Z.; Miao, Q. Improved Information Fusion Approach Based on D-S Evidence Theory. J. Mech. Sci. Technol. 2008, 22, 2417–2425. [Google Scholar] [CrossRef]
- Qin, C.; Jin, Y.; Tian, M.; Ju, P.; Zhou, S. Comparative Study of Global Sensitivity Analysis and Local Sensitivity Analysis in Power System Parameter Identification. Energies 2023, 16, 5915. [Google Scholar] [CrossRef]

| Serial Number | Influencing Factors | Source References | Initial Processing | Processing Results | Standard Specifications |
|---|---|---|---|---|---|
| 1 | Fuel particle size | [38,39] | Retained | 1 Fuel particle size | |
| 2 | Iron ore quality | [32,40,41] | Modified | 2 Furnace iron ore quality | [42] |
| 3 | Harmful substances in raw material | [43] | Retained | 3 Harmful substances in raw material | |
| 4 | Raw material granularity | [41,44] | Retained | 4 Raw material granularity | |
| 5 | Sintering and pellet ratio | [40] | Merged | 5 Raw material index | [45] |
| 6 | Blast furnace coal 6 injection ratio | [46] | |||
| 7 | Sintering machine performance | [32,47] | Retained | 6 Sintering machine performance | |
| 8 | Blast furnace equipment performance | [48] | Retained | 7 Blast furnace equipment performance | |
| 9 | Heating furnace equipment performance | [48,49,50] | Retained | 8 Heating furnace performance | |
| 10 | Solvent unit consumption | [51] | Retained | 9 Solvent unit consumption | |
| 11 | Fuel unit consumption | [39] | Retained | 10 Fuel unit consumption | |
| 12 | Coke ratio | [52,53] | Retained | 11 Coke ratio | |
| 13 | Coal ratio | [52,53] | Retained | 12 Coal ratio | |
| 14 | Blast furnace burden structure | [46] | Merged | 13 Iron-to-steel ratio | [54,55] |
| 15 | Iron-to-steel ratio | [56] | |||
| 16 | Oxygen demand for steelmaking | Added | 14 Oxygen demand for steelmaking | [45] | |
| 17 | Converter coal gas consumption | Added | 15 Converter coal gas consumption | [45] | |
| 18 | Desulfurized ash usage | [44] | Retained | 16 Desulfurized ash usage | |
| 19 | Flue gas waste heat utilization | [57] | Merged | 17 Flue gas waste heat rate | [45] |
| 20 | Residual heat recovery efficiency | [53] | |||
| 21 | Blast furnace gas utilization rate | [43,47] | Retained | 18 Blast furnace gas utilization rate | |
| 22 | Gas recovery equipment maintenance level | [54,58] | Modified | 19 Gas recovery equipment maintenance level | [45,54] |
| 23 | Blast furnace pressure recovery | [53] | Retained | 20 Blast furnace pressure recovery rate | |
| 24 | Converter coal gas recovery | [59] | Retained | 21 Converter coal gas recovery | |
| 25 | Hot delivery equipment | [32] | Retained | 22 Hot delivery equipment | |
| 26 | Degree of process Integration | [57] | Merged | 23 Automation control level | [45] |
| 27 | Automation control degree | [51] | |||
| 28 | Sintering operation skills | [51] | Retained | 24 Sintering operation skills | |
| 29 | Blast furnace operation skills | [52] | Retained | 25 Blast furnace operation skills | |
| 30 | Converter operation skills | [51] | Retained | 26 Converter operation skills | |
| 31 | Heating operation skills | [57] | Retained | 27 Heating operation skills | |
| 32 | Converter equipment maintenance level | [57] | Retained | 28 Converter equipment maintenance level |
| Serial Number | Influencing Factors | Serial Number | Influencing Factors |
|---|---|---|---|
| 1 | Fuel particle size (C11) | 13 | Gas consumption in rolling (C36) |
| 2 | Furnace iron ore quality (C12) | 14 | Flue gas heat recovery rate (C41) |
| 3 | Harmful substances in raw materials (C13) | 15 | Blast furnace gas utilization rate (C42) |
| 4 | Furnace chemical and physical index (C14) | 16 | Blast furnace pressure recovery utilization rate (C43) |
| 5 | Sintering machine performance (C21) | 17 | Converter gas recovery per ton of steel (C44) |
| 6 | Blast furnace equipment performance (C22) | 18 | Hot delivery rate (C51) |
| 7 | Heating furnace equipment performance (C23) | 19 | Automated control degree (C52) |
| 8 | Solvent consumption per unit (C31) | 20 | Operational skills level (C61) |
| 9 | Fuel unit consumption (C32) | 21 | Equipment maintenance level (C62) |
| 10 | Fuel ratio (C33) | 22 | Employee training level (C71) |
| 11 | Iron to steel ratio (C34) | 23 | Management system improvement level (C72) |
| 12 | Oxygen consumption in steelmaking (C35) |
| Dimension | Primary Indicator | Optimized Meaning |
|---|---|---|
| WuLi (physical) | Raw material quality (B1) | Evaluates the quality and performance of raw materials used in the production process to ensure efficient production flow and minimize pollutant emissions. |
| Equipment performance (B2) | Assesses the technical condition and maintenance level of production equipment. Properly maintained equipment significantly reduces energy consumption and environmental emissions. | |
| Resource consumption (B3) | Analyzes the usage of resources such as water, electricity, and fuel during production. Optimizing resource utilization minimizes system inefficiencies and enhances overall sustainability. | |
| ShiLi (process) | Secondary energy utiliza-tion (B4) | Highlights the importance of recycling and reusing waste heat and waste gas generated during production processes to improve energy efficiency and reduce overall energy losses. |
| Process integration (B5) | Focuses on enhancing coordination and ensuring smooth transitions between production processes. Proper integration reduces resource waste and improves operational efficiency. | |
| Renli (human) | Professional skills (B6) | Evaluates the skill level and expertise of operators. Enhancing professional skills optimizes resource utilization and boosts efficiency throughout the production lifecycle. |
| Institutional training (B7) | Emphasizes the establishment of effective management systems and employee training programs to promote energy saving awareness, strengthen emission reduction capabilities, and support the achievement of sustainable development goals. |
| No. | Evaluation Index | Unit | 2022 Data |
|---|---|---|---|
| 1 | Fuel particle size (C11) | % | 65–70 |
| 2 | Furnace iron ore quality (C12) | % | 55.6–55.8 |
| 3 | Solvent unit consumption (C31) | kg/t | 145 |
| 4 | Fuel unit consumption (C32) | kg/t | 48 |
| 5 | Fuel ratio (C33) | kg/t | 511.59 |
| 6 | Iron-to-steel ratio (C34) | % | 83.80% |
| 7 | Oxygen consumption for steelmaking (C35) | m3/t | 46.83 |
| 8 | Gas consumption per unit in rolling mill (C36) | m3/t | 295.96 |
| 9 | Flue gas heat recovery rate (C41) | % | 58 |
| 10 | Blast furnace gas utilization rate (C42) | % | 44.74 |
| 11 | Recovery utilization rate (C43) | % | 75–80 |
| 12 | Converter gas recovery per ton of steel (C44) | m3/t | 110 |
| 13 | Hot delivery rate (C51) | % | 85–90 |
| Secondary Indicator | Average Score | Coefficient Variation (CV) | Average Score | Secondary Indicator | Coefficient Variation (CV) |
|---|---|---|---|---|---|
| C11 | 86.70 | 1.37% | C36 | 76.70 | 1.75% |
| C12 | 77.10 | 1.47% | C41 | 68.90 | 1.02% |
| C13 | 88.20 | 5.09% | C42 | 78.90 | 0.68% |
| C14 | 84.10 | 7.42% | C43 | 78.90 | 0.89% |
| C21 | 84.10 | 6.46% | C44 | 89.00 | 0.71% |
| C22 | 85.90 | 8.06% | C51 | 86.20 | 1.62% |
| C23 | 85.30 | 5.5% | C52 | 87.50 | 5.29% |
| C31 | 77.30 | 1.3% | C61 | 73.70 | 12.03% |
| C32 | 86.80 | 1.69% | C62 | 75.70 | 16.55% |
| C33 | 77.10 | 1.35% | C71 | 82.30 | 8.15% |
| C34 | 87.10 | 1.3% | C72 | 81.40 | 9.58% |
| C35 | 86.50 | 1.57% |
| Secondary Indicator | Excellent | Good | Average | Blow Average | Poor |
|---|---|---|---|---|---|
| C11 | 0.2950 | 0.9487 | 0.0869 | 0.0002 | 0.2040 |
| C12 | 0.0036 | 0.3231 | 0.9247 | 0.0706 | 0.3410 |
| C13 | 0.4346 | 0.8374 | 0.0452 | 0.0001 | 0.1832 |
| C14 | 0.1267 | 0.9857 | 0.2282 | 0.0016 | 0.2425 |
| C21 | 0.1256 | 0.9856 | 0.2274 | 0.0016 | 0.2349 |
| C22 | 0.2237 | 0.9857 | 0.1158 | 0.0004 | 0.2175 |
| C23 | 0.1887 | 0.9984 | 0.1561 | 0.0007 | 0.2210 |
| C31 | 0.0042 | 0.3498 | 0.9104 | 0.0672 | 0.3315 |
| C32 | 0.3111 | 0.9420 | 0.0833 | 0.0002 | 0.2027 |
| C33 | 0.0035 | 0.3262 | 0.9242 | 0.0718 | 0.3297 |
| C34 | 0.3346 | 0.9235 | 0.0746 | 0.0002 | 0.1992 |
| C35 | 0.2785 | 0.9616 | 0.0940 | 0.0003 | 0.2064 |
| C36 | 0.0025 | 0.2952 | 0.9495 | 0.0882 | 0.3432 |
| C41 | 0.0000 | 0.0106 | 0.5193 | 0.7637 | 0.4712 |
| C42 | 0.0109 | 0.5204 | 0.7585 | 0.0324 | 0.3055 |
| C43 | 0.0103 | 0.5151 | 0.7610 | 0.0320 | 0.3046 |
| C44 | 0.5315 | 0.7519 | 0.0312 | 0.0000 | 0.1796 |
| C51 | 0.2555 | 0.9749 | 0.1039 | 0.0004 | 0.2184 |
| C52 | 0.3608 | 0.8922 | 0.0621 | 0.0001 | 0.1968 |
| C61 | 0.0004 | 0.1061 | 0.9704 | 0.2667 | 0.3999 |
| C62 | 0.0014 | 0.2173 | 0.9915 | 0.1332 | 0.3611 |
| C71 | 0.0576 | 0.8777 | 0.3898 | 0.0047 | 0.2655 |
| C72 | 0.0363 | 0.7967 | 0.4781 | 0.0101 | 0.2690 |
| Secondary Indicator | Excellent | Good | Average | Blow Average | Poor | |
|---|---|---|---|---|---|---|
| C11 | 0.1823 | 0.5864 | 0.0537 | 0.0001 | 0.1261 | 0.0513 |
| C12 | 0.0020 | 0.1797 | 0.5142 | 0.0393 | 0.1896 | 0.0753 |
| C13 | 0.2425 | 0.4673 | 0.0252 | 0.0000 | 0.1023 | 0.1626 |
| C14 | 0.0788 | 0.6131 | 0.1419 | 0.0010 | 0.1508 | 0.0143 |
| C21 | 0.0786 | 0.6167 | 0.1423 | 0.0010 | 0.1470 | 0.0144 |
| C22 | 0.1429 | 0.6296 | 0.0739 | 0.0003 | 0.1390 | 0.0143 |
| C23 | 0.1204 | 0.6371 | 0.0996 | 0.0004 | 0.1410 | 0.0016 |
| C31 | 0.0023 | 0.1915 | 0.4984 | 0.0368 | 0.1815 | 0.0896 |
| C32 | 0.1904 | 0.5765 | 0.0510 | 0.0001 | 0.1240 | 0.0580 |
| C33 | 0.0019 | 0.1821 | 0.5160 | 0.0401 | 0.1841 | 0.0758 |
| C34 | 0.2017 | 0.5567 | 0.0450 | 0.0001 | 0.1201 | 0.0765 |
| C35 | 0.1738 | 0.6001 | 0.0586 | 0.0002 | 0.1288 | 0.0384 |
| C36 | 0.0014 | 0.1670 | 0.5371 | 0.0499 | 0.1941 | 0.0505 |
| C41 | 0.0000 | 0.0046 | 0.2247 | 0.3305 | 0.2039 | 0.2363 |
| C42 | 0.0051 | 0.2425 | 0.3535 | 0.0151 | 0.1424 | 0.2415 |
| C43 | 0.0048 | 0.2415 | 0.3568 | 0.0150 | 0.1428 | 0.2390 |
| C44 | 0.2674 | 0.3783 | 0.0157 | 0.0000 | 0.0904 | 0.2481 |
| C51 | 0.1604 | 0.6120 | 0.0652 | 0.0002 | 0.1371 | 0.0251 |
| C52 | 0.2129 | 0.5265 | 0.0366 | 0.0001 | 0.1161 | 0.1078 |
| C61 | 0.0002 | 0.0590 | 0.5401 | 0.1485 | 0.2226 | 0.0296 |
| C62 | 0.0008 | 0.1264 | 0.5767 | 0.0775 | 0.2101 | 0.0085 |
| C71 | 0.0317 | 0.4829 | 0.2145 | 0.0026 | 0.1461 | 0.1223 |
| C72 | 0.0182 | 0.3991 | 0.2395 | 0.0051 | 0.1348 | 0.2033 |
| Indicator | Entropy E | ||||
|---|---|---|---|---|---|
| C11 | 0.2162 | 0.0472 | 1.1950 | 0.0459 | 0.0496 |
| C12 | 0.2584 | 0.0395 | 1.3001 | 0.0413 | 0.0374 |
| C13 | 0.2504 | 0.0407 | 1.3208 | 0.0405 | 0.0378 |
| C14 | 0.1910 | 0.0534 | 1.1303 | 0.0490 | 0.0599 |
| C21 | 0.1916 | 0.0532 | 1.1252 | 0.0492 | 0.0601 |
| C22 | 0.2199 | 0.0464 | 1.0992 | 0.0505 | 0.0537 |
| C23 | 0.2211 | 0.0461 | 1.0614 | 0.0524 | 0.0555 |
| C31 | 0.2480 | 0.0411 | 1.3248 | 0.0403 | 0.0380 |
| C32 | 0.2173 | 0.0469 | 1.2102 | 0.0452 | 0.0486 |
| C33 | 0.2578 | 0.0396 | 1.2997 | 0.0413 | 0.0375 |
| C34 | 0.2199 | 0.0464 | 1.2405 | 0.0438 | 0.0466 |
| C35 | 0.2168 | 0.0470 | 1.1679 | 0.0472 | 0.0509 |
| C36 | 0.2768 | 0.0368 | 1.2605 | 0.0430 | 0.0363 |
| C41 | 0.4932 | 0.0207 | 1.3912 | 0.0377 | 0.0179 |
| C42 | 0.2253 | 0.0453 | 1.4219 | 0.0366 | 0.0380 |
| C43 | 0.2255 | 0.0452 | 1.4197 | 0.0367 | 0.0380 |
| C44 | 0.2921 | 0.0349 | 1.3490 | 0.0393 | 0.0315 |
| C51 | 0.2174 | 0.0469 | 1.1388 | 0.0485 | 0.0522 |
| C52 | 0.2264 | 0.0450 | 1.2791 | 0.0422 | 0.0436 |
| C61 | 0.3936 | 0.0259 | 1.2232 | 0.0446 | 0.0265 |
| C62 | 0.3404 | 0.0300 | 1.1512 | 0.0479 | 0.0329 |
| C71 | 0.1583 | 0.0644 | 1.3444 | 0.0395 | 0.0584 |
| C72 | 0.1776 | 0.0574 | 1.4025 | 0.0373 | 0.0491 |
| Level | Excellent | Good | Average | Blow Average | Poor | |
|---|---|---|---|---|---|---|
| m* | 0.0990 | 0.4399 | 0.2088 | 0.0203 | 0.1469 | 0.0850 |
| Level | Excellent | Good | Average | Blow Average | Poor | |
|---|---|---|---|---|---|---|
| 0 | 1.0000 | 0 | 0 | 0 | 0 |
Disclaimer/Publisher’s Note: The statements, opinions and data contained in all publications are solely those of the individual author(s) and contributor(s) and not of MDPI and/or the editor(s). MDPI and/or the editor(s) disclaim responsibility for any injury to people or property resulting from any ideas, methods, instructions or products referred to in the content. |
© 2025 by the authors. Licensee MDPI, Basel, Switzerland. This article is an open access article distributed under the terms and conditions of the Creative Commons Attribution (CC BY) license (https://creativecommons.org/licenses/by/4.0/).
Share and Cite
Chen, Y.; Rao, Z.; Yuan, L.; Meng, T. Evaluation of Energy Saving and Emission Reduction in Steel Enterprises Using an Improved Dempster–Shafer Evidence Theory: A Case Study from China. Sustainability 2025, 17, 3954. https://doi.org/10.3390/su17093954
Chen Y, Rao Z, Yuan L, Meng T. Evaluation of Energy Saving and Emission Reduction in Steel Enterprises Using an Improved Dempster–Shafer Evidence Theory: A Case Study from China. Sustainability. 2025; 17(9):3954. https://doi.org/10.3390/su17093954
Chicago/Turabian StyleChen, Yongxia, Zhe Rao, Lin Yuan, and Tianlong Meng. 2025. "Evaluation of Energy Saving and Emission Reduction in Steel Enterprises Using an Improved Dempster–Shafer Evidence Theory: A Case Study from China" Sustainability 17, no. 9: 3954. https://doi.org/10.3390/su17093954
APA StyleChen, Y., Rao, Z., Yuan, L., & Meng, T. (2025). Evaluation of Energy Saving and Emission Reduction in Steel Enterprises Using an Improved Dempster–Shafer Evidence Theory: A Case Study from China. Sustainability, 17(9), 3954. https://doi.org/10.3390/su17093954