Article

The Aerosol Optical Properties over a Desert Industrial City Wuhai, Northwest China, During the 3-Year COVID-19 Pandemic

Laboratory for Supervision and Evaluation of Pollution Reduction and Carbon Reduction in Arid and Semi-Arid Regions, Inner Mongolia Autonomous Region Environmental Monitoring Central Station, Hohhot 010090, China
*
Author to whom correspondence should be addressed.
Sustainability 2025, 17(9), 3937; https://doi.org/10.3390/su17093937
Submission received: 14 February 2025 / Revised: 25 March 2025 / Accepted: 3 April 2025 / Published: 27 April 2025
(This article belongs to the Section Air, Climate Change and Sustainability)

Abstract

Aerosol optical depth (AOD) data from 2020 to 2022 during the COVID-19 pandemic in a typical desert industrial city, Wuhai, was analyzed to investigate aerosol optical properties, origins of different types of aerosols, and the impacts of the COVID-19 lockdown on desert pollution. Results show that annual AOD (500 nm) and Ångström exponent α were 0.36 ± 0.12 and 0.75 ± 0.22 in 2020, 0.30 ± 0.12 and 0.75 ± 0.14 in 2021, and 0.28 ± 0.09 and 0.74 ± 0.19 in 2022, respectively, representing a slightly polluted environment characterized by a mixture of coarse-mode dust aerosols and fine-mode anthropogenic aerosols. Seasonal analysis reveals that the highest AOD primarily occurred in spring due to frequent dust events, while the lowest AOD was observed in winter. Potential Source Contribution Function (PSCF) identified the Alxa Desert as a major potential source during the entire year, and anthropogenic industrial and mining activities in northern Ningxia and southern Inner Mongolia were also important contributors, particularly outside of the winter season. The prevailing wind direction in Wuhai was from the northwest (NW-quadrant), originating from the depopulated desert or Gobi area, accounting for 85.11% in spring, 61.45% in summer, 68.09% in autumn, and 100% in winter. The remaining air masses came from southeastern (SE-quadrant) densely populated areas. Despite the dominance of NW air flows, SE anthropogenic air masses resulted in the highest AOD of 0.47 ± 0.24 in spring, 0.38 ± 0.23 in summer, and 0.32 ± 0.17 in autumn, with corresponding finest particle sizes of 0.83 ± 0.31, 0.91 ± 0.30, and 1.02 ± 0.22 in α. This suggests that anthropogenic influence remains significant even under strict control measures during the COVID-19 lockdown. In winter, the northwest air masses contributed to the highest pollution of 0.49 ± 0.39 (AOD) and finest particle size of 0.90 ± 0.32 (α), likely associated with the coal/straw burning for winter heating. In addition, the particles leading to moderate pollution primarily ranged around 0.2–0.25 µm, and fine particle pollution persists throughout the year.

1. Introduction

Atmospheric aerosols refer to the suspension of liquid or solid particles with aerodynamic diameters ranging from 0.001 μm to 100 μm [1,2]. These aerosols significantly influence both regional and global climate due to their light-scattering and absorption capabilities, a phenomenon known as aerosol direct radiative forcing. Additionally, certain aerosols can also activate into cloud condensation nuclei or ice nuclei, indirectly affecting the solar radiation budget and energy balance through interaction with clouds or ice, which is referred to as aerosol indirect radiative forcing. Therefore, thorough investigations into aerosol optical properties are crucial for comprehending their roles in global climate change [3,4,5,6].
A key challenge in investigating the aerosol optical properties is the requirement for accurate and real-time measurements across diverse environmental conditions [7,8]. Over the past few decades, multiple remote-sensing approaches have been developed to monitor aerosol optical properties, including satellite and ground-based photometers. Satellites equipped with radiometers such as MODIS (Moderate Resolution Imaging Spectro-radiometer) [9], MISR (Multi-Angle Imaging Spectrometer) [10], VIIRS (Visible Infrared Imaging Radiometer Suite) [11], CALIPSO (Cloud-Aerosol Lidar and Infrared Pathfinder Satellite Observation) [12], OMI (Ozone Monitoring Instruments) [13], and H8 (Himawari-8) [14] provide a global perspective on the spatial distributions of aerosols; however, remarkable uncertainties remain due to surface albedo and retrieval algorithm limitations. Ground-based photometers offer more reliable measurements of high temporal resolution aerosol products. Numerous photometer networks have been established by various organizations and countries, such as AERONET (USA) [15], CARSNET (China) [8], CSHNET (China) [7], CARE-China (China) [5], AEROCAN (Canada) [16], and PHOTONS (France) [17]. These networks have collected valuable datasets and provided in-depth knowledge for assessing aerosol climatic effects worldwide.
Deserts constitute a significant portion of the global landscape, covering approximately one-third of Earth’s land surface, or about 48 million square kilometers out of the total 162 million square kilometers. China, with its extensive desert regions, has faced serious desertification challenges, making it imperative to monitor aerosol optical properties. In the past few years, researchers have made great efforts in exploring the aerosol optical properties in different desert areas across China mainland, such as the Taklimakan Desert [18,19,20], Badanjilin Desert [21,22,23], and Tengger Desert [24,25]. These observations provide valuable understandings regarding the aerosol optical properties in arid zones, particularly in northwest China. However, investigations on desert areas in North China, which serve as a critical transport channel for dust to the Beijing-Tianjin-Hebei region, remain scarce.
Wuhai is located at the eastern border of the Alxa Desert, an area characterized by its arid climate and frequent dust storms. Wuhai is also a highly industrialized city with a well-developed mining industry, a coking industry, and other heavy industries, making it a representative example of typical desert industrial areas in North China. Furthermore, the 3-year COVID-19 pandemic significantly reduced anthropogenic activities [26,27]. Consequently, studying the optical properties of aerosols over this anthropogenically-influenced desert region is of particular importance for understanding the mutual impacts of both human and natural sources on regional climate, especially for the influence of COVID-19 lockdown [28,29,30]. In this study, continuous measurements of aerosol optical properties over 2020–2022 were analyzed to provide in-depth insights into the characteristics of aerosols in deserted industrial areas of North China. The findings will provide valuable references for ecological environment protection and desertification control efforts in northern China.

2. Methodology

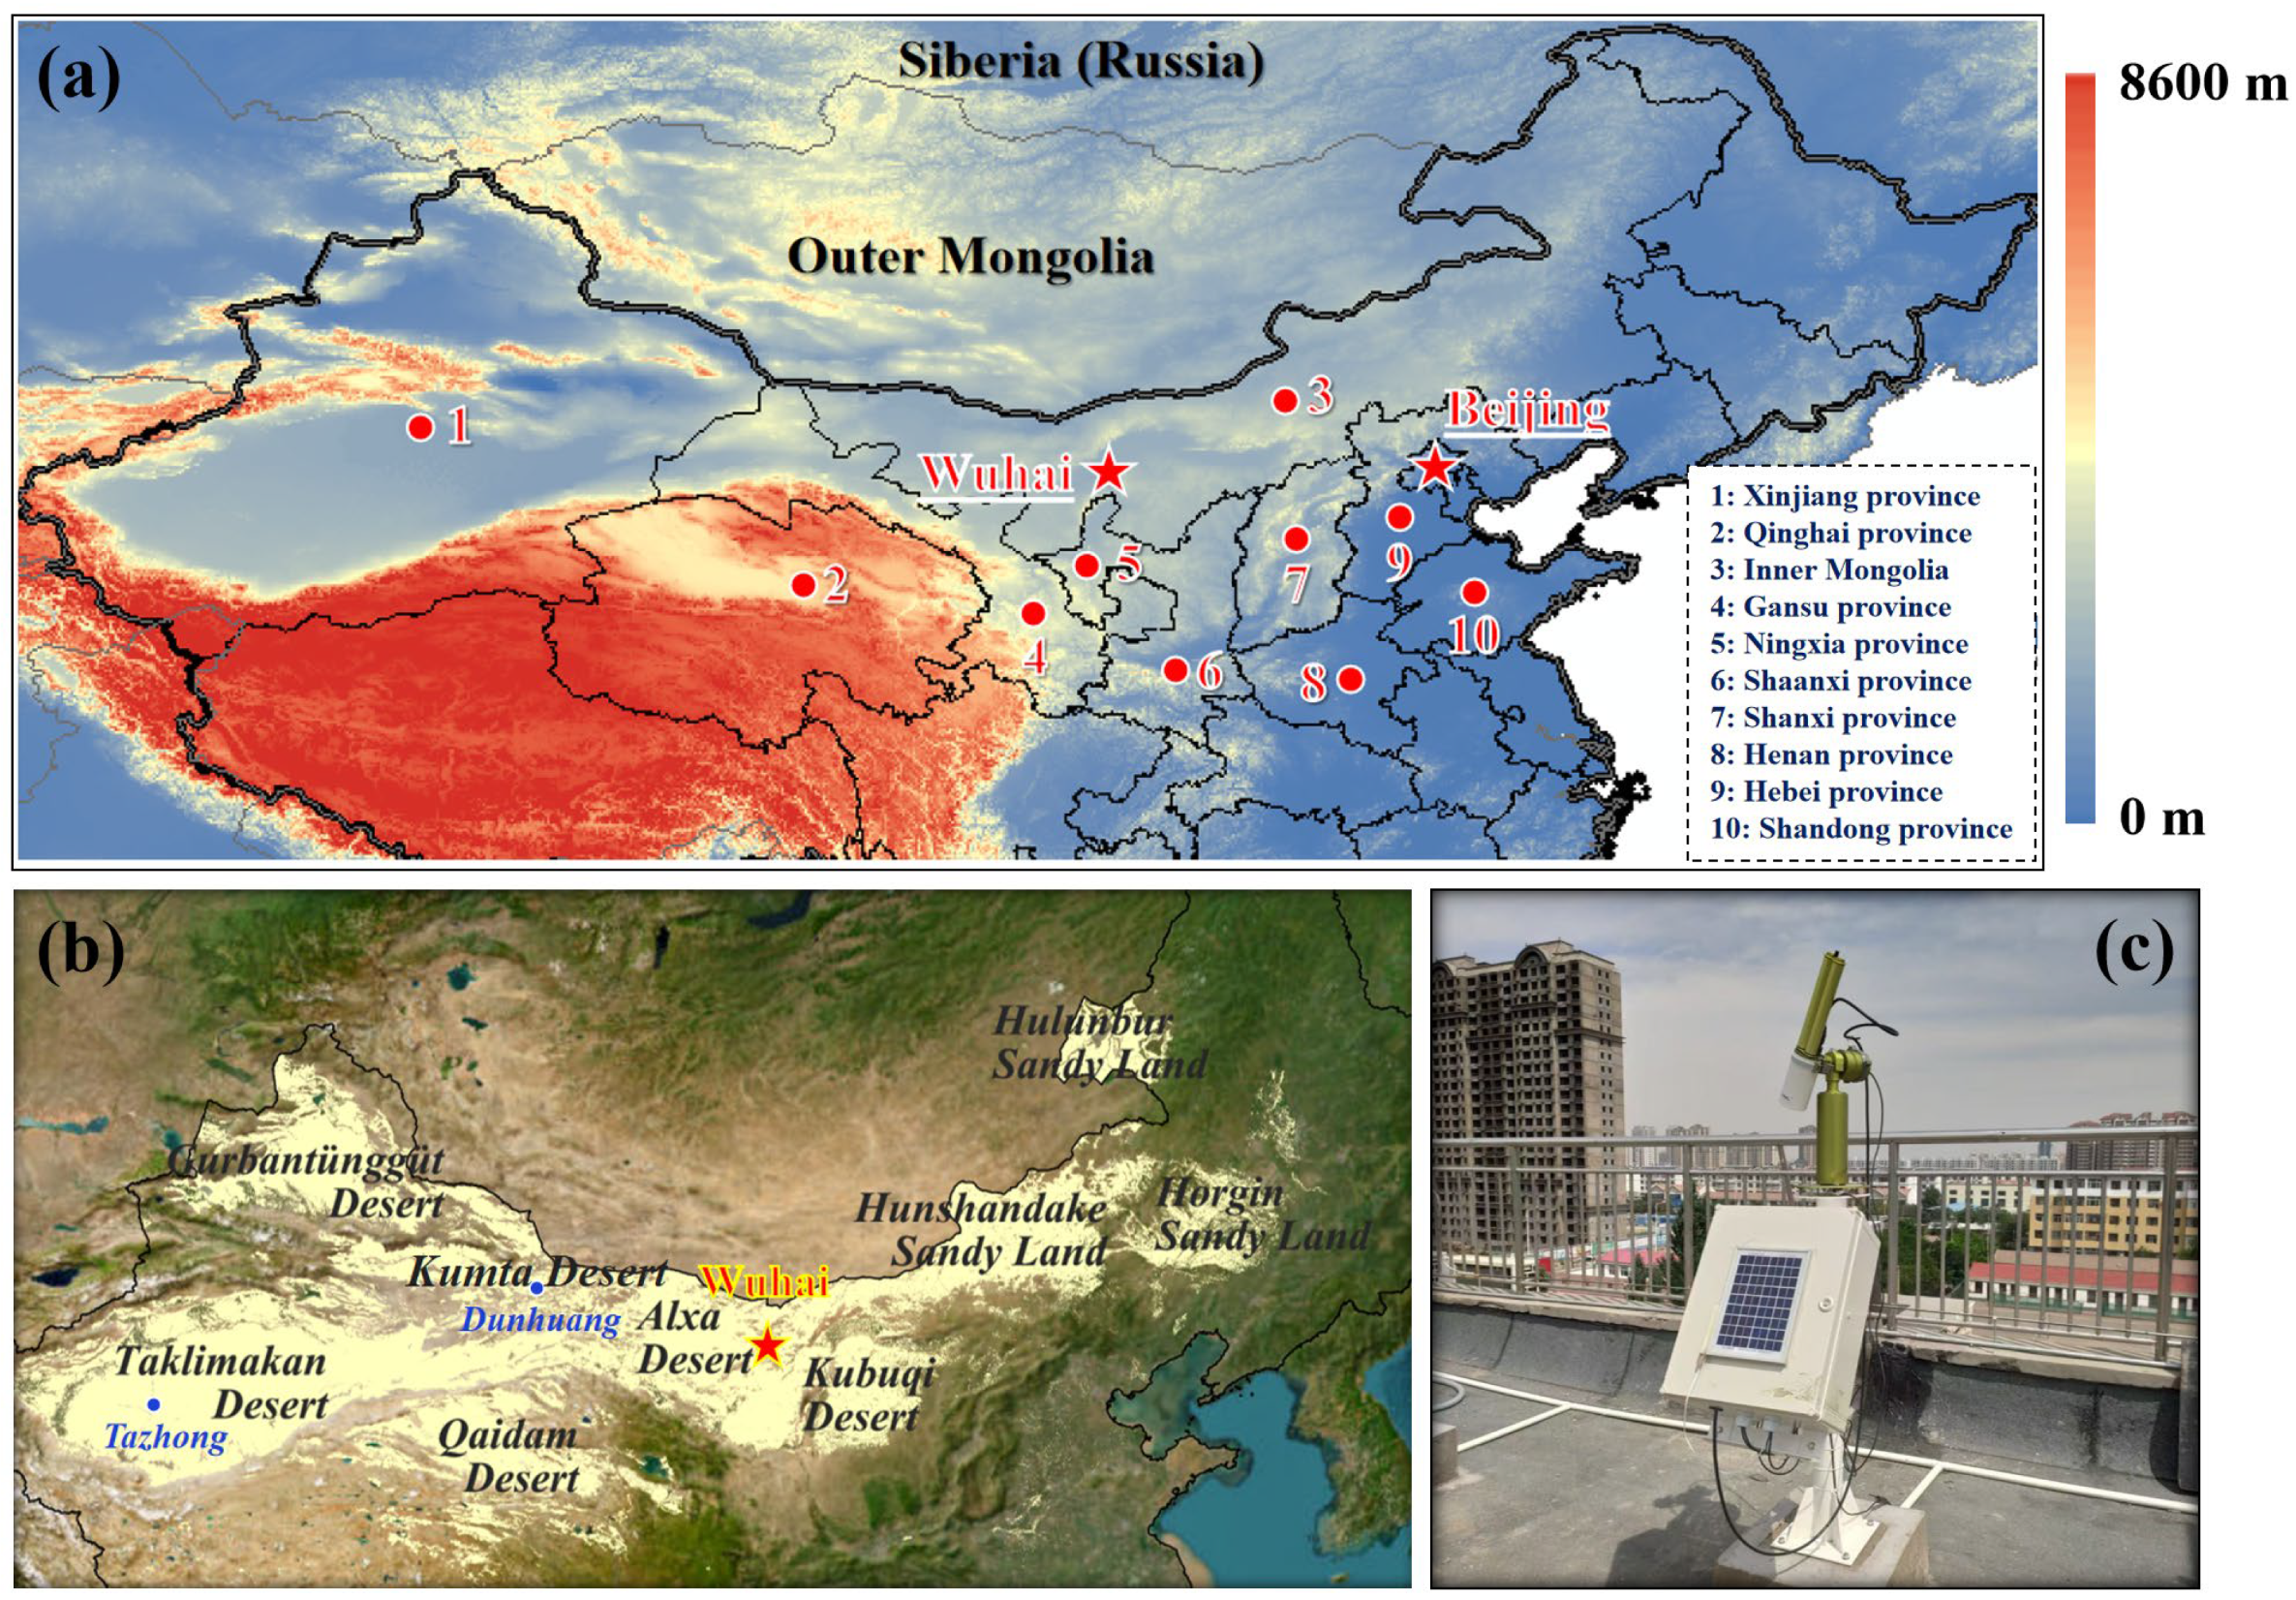
2.1. Wuhai Super Site

The Wuhai super site (39.5° N, 106.8° E, 1100 m a.s.l.) is located in the downtown area of Wuhai, situated in western Inner Mongolia, China. As shown in Figure 1, the site lies within the arid and semi-arid regions of northern China, surrounded by multiple deserts including the Alxa Desert and the Kubuqi Desert. This area is also part of the larger Ordos Plateau, known for its sandy and gravel landscapes. Consequently, the Wuhai super site serves as a representative location for studying the interaction of desert and human activities.

2.2. Sun-Sky-Lunar CIMEL CE318-T Multiband Photometer

The Sun-sky-lunar CIMEL CE318-T multiband photometer is an advanced ground-based instrument developed by Cimel Electronique (Paris, France) [31]. It measures aerosol optical properties and solar irradiance across a broad range of wavelengths (340 nm, 380 nm, 440 nm, 500 nm, 675 nm, 870 nm, 1020 nm, 1640 nm), covering the ultraviolet, visible, and near-infrared electromagnetic spectrum. The instrument operates on the principles of radiative transfer theory and optical measurements of irradiance to retrieve aerosol optical depth (AOD or τ).

2.2.1. Aerosol Optical Depth

Daytime AOD
Based on the Beer-Lambert-Bouguer law:
I ( λ ) = I 0 ( λ ) R 2 exp ( m r ( θ ) p p 0 τ r ( λ ) m O 3 ( θ ) τ O 3 ( λ ) m a ( θ ) τ a ( λ ) )
where I (λ) and I0 (λ) denote the measured irradiance at wavelength λ and the extraterrestrial solar irradiance, respectively. R and θ represent the Earth-Sun distance and solar zenith angle, respectively. mr (θ), mO3 (θ), and ma (θ) are the air mass factors for Rayleigh scattering optical depth τr (λ), ozone absorption optical depth τO3 (λ), and aerosol optical depth τa (λ). Consequently, τa (λ) can be calculated by:
τ a ( λ ) = 1 m a ( θ ) ln I 0 ( λ ) I ( λ ) R 2 m r ( θ ) p p 0 τ r ( λ ) m O 3 ( θ ) τ O 3 ( λ )
Additionally, the calculations of the three air mass factors and optical depths of Rayleigh scattering and ozone absorption can be found in the literature of Kasten et al. (1966; 1989) and Komhyr et al. (1980) [32,33,34].
Nighttime AOD
For the estimation of nighttime aerosol optical depth, it is important to emphasize that the direct-sun and direct-moon signals are measured by the same optical components. The only difference lies in the amplification G and electronic gain. The former can be obtained by means of the ratio of moon and sun measurements using an integrating sphere in the laboratory, where the photometer output signal ratio equals the gain ratio [35]. Following this principle, the nighttime calibration constant κ (λ) can be estimated using the following equation:
κ ( λ ) = V 0 ( λ ) I 0 ( λ ) G
Similar to Equations (1) and (2), I0 (λ) is the extraterrestrial solar irradiance, and V0 (λ) represents the daytime calibration for channel λ. Then, once the nighttime κ (λ) values are known, the instantaneous τa (λ) from each individual measurement can be calculated using Equation (4):
τ a ( λ ) = ln ( κ ( λ ) ) ln ( V 0 ( λ ) I 0 ( λ ) ) m a t m ( θ ) τ a t m ( λ ) m a ( θ )
In this context, the subscript “atm” accounts for the optical depth and air mass of all atmospheric attenuators except aerosols [31].
Then, both daytime and nighttime measurements were utilized to calculate the daily average values, which served as the fundamental data for subsequent calculations of seasonal and annual averages, as well as for analyzing aerosol optical characteristics influenced by different air masses.
In general, as the gradual increase in AOD reflects a corresponding rise in aerosol concentration, strictly defining pollution levels based solely on AOD thresholds is inherently imprecise. However, due to factors such as the vertical uniformity of aerosol column concentration, aerosol composition, morphology, aging degree, and other properties influencing optical characteristics, establishing a highly accurate correlation between AOD and pollution levels remains challenging. In combination with the previous literature [5,7,22], an AOD value below 0.2 indicates very low aerosol concentrations and a clean environment. 0.2 < AOD < 0.4 and 0.4 < AOD < 1.0 are typically classified as light and moderate pollution, and values exceeding 1.0 signify severe pollution.

2.2.2. Ångström Exponent α

The Ångström exponent α is an indicator of particle size. Specifically, a larger value of α indicates smaller particle sizes, and vice versa. According to the aerosol Junge distribution, Ångström (1964) firstly constructed the relationship between any given wavelength (λ) and τa (λ) [36]:
τ a ( λ ) = β λ α
In which β represents the turbidity coefficient. Therefore, the Ångström exponent α can be obtained through a log-linear fitting formula for the measurements at any two given wavelengths:
α = ln ( τ aer , λ 1 ) ln ( τ aer , λ 2 ) / ln ( λ 1 ) ln ( λ 2 )
The integration of AOD and α enables the differentiation of sea salt aerosols, biomass burning/urban industrial (anthropogenic) aerosols, mixed-type aerosols, and desert dust aerosols through the application of specific optical parameter thresholds. These thresholds are detailed in Table 1.

2.3. TrajStat for Backward Trajectory Analysis

TrajStat (version-1.5.3) is a powerful GIS-based software designed for analyzing backward trajectories, aiding in the identification of sources and transport pathways of air masses [37,38]. Utilizing the same core algorithm as the Hybrid Single Particle Lagrangian Integrated Trajectory (HYSPLIT) model and driven by the 1 × 1 Global Data Assimilation System (GDAS) data from the National Centers for Environmental Prediction (NCEP) https://www.ready.noaa.gov/archives.php (accessed on 23 November 2024), TrajStat is capable of calculating the three-dimensional movement of air parcels based on their positions at a given time and tracing their paths backward. This enables researchers to determine the origin of specific air trajectories, assess the influence of regional/distant pollution sources, and understand the transport mechanisms that shape air quality in a target location.
In this study, we utilized GDAS data from 2020 to 2022 to initialize TrajStat and retrieve the 72-h backward trajectories. The coordinates 39.5° N and 106.8° E were inputted to represent the Wuhai super site as the arriving point, with the height specified at 500 m.

2.3.1. Backward Trajectory Cluster

Backward trajectory cluster statistically aggregates calculated backward trajectories into clusters to maximize their homogeneity [39]. TrajStat incorporates a grouping module that evaluates the Total Spatial Variance (TSV) between different clusters relative to the spatial variance (SPVAR) within each cluster. The optimal number of clusters is determined by identifying significant changes in TSV as clusters are iteratively merged, and the inflection point in the automatically generated “percent change in TSV (%) versus cluster numbers” plot serves as an indicator for selecting the optimal cluster number [37,40].

2.3.2. Potential Source Contribution Function

The Potential Source Contribution Function, also known as PSCF, has been extensively used to identify the relative contributions of potential transport pathways of various atmospheric species on the basis of HYSPLIT core. In brief, the PSCF is defined as:
P S C F ( i , j ) = w i , j × m i , j / n i , j
In which ni,j is the total number of endpoints falling into the ijth cell and mi,j is the number of endpoints with measured concentrations at the receptor site passing in the ijth cell. Moreover, given the fact that the cells with fewer endpoints possibly induce high uncertainty in the PSCF method, an empirical weight function wi,j is proposed to be multiplied into the PSCF results.
w i , j = 1.00 n i , j 40 0.70 10 n i , j 40 0.42 5 n i , j 10 0.17 n i , j 5
In general, the higher the PSCF values in a grid cell, the more likely it is to be the potential source of target species at the receptor site. Typically, PSCF > 0.5 can be a representation of high probability, 0.4 < PSCF < 0.5 and PSCF < 0.4 are medium and low probabilities, respectively [41,42].

3. Results

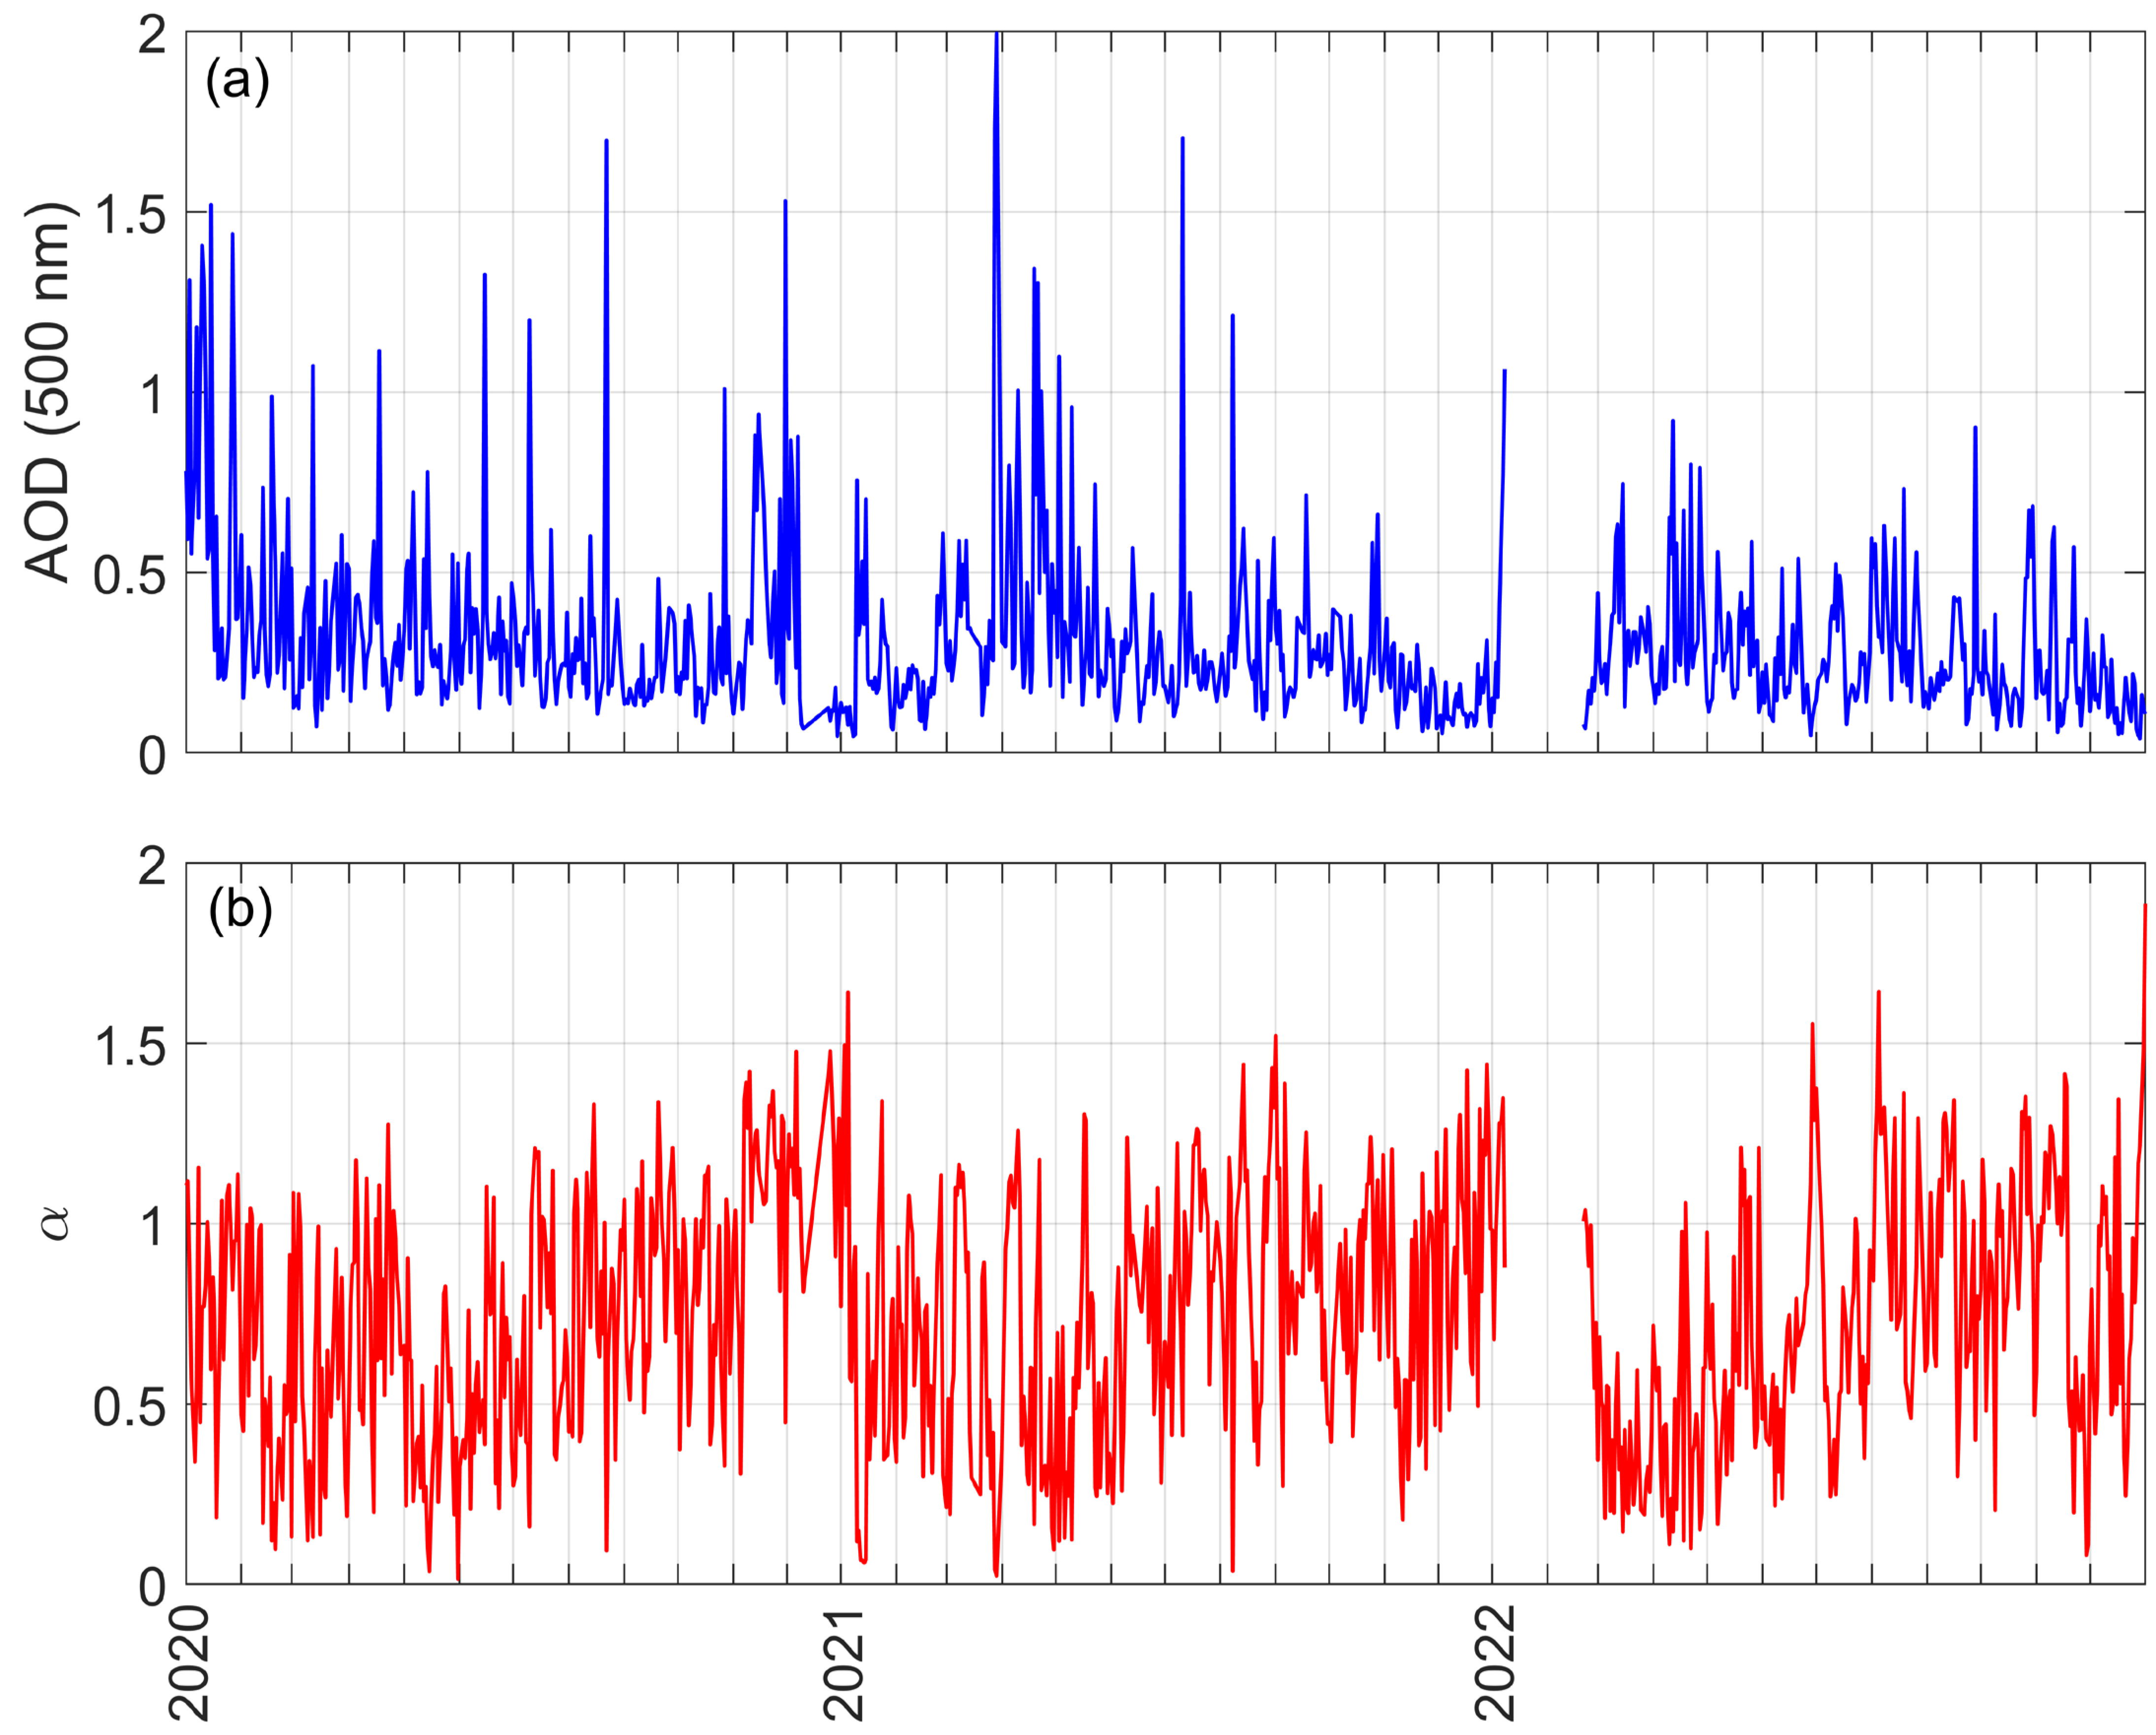
3.1. General Characteristics of the Aerosol Optical Properties in Wuhai

Figure 2 shows the time series of AOD and Ångström exponent α, and Table 2 and Table 3 present the annual and seasonal mean values. The annual values shown in Table 2 indicate slightly polluted conditions in Wuhai. Compared to other desert areas, such as Dunhuang (0.32) [22] and Tazhong (0.54) [8], the AOD levels in Alxa Desert (Wuhai) and Kumtag Desert (Dunhuang) are similar but lower than those in the Taklimakan Desert (Tazhong). In addition, the AOD level in Wuhai is higher than in other background cities in Inner Mongolia, such as 0.26 in Xilinhot and 0.24 in Zhurihe [8], highlighting the inneglectable effects of both natural and anthropogenic factors. The annual mean Ångström exponents α also demonstrate the dominance of mixed coarse-mode dust and fine-mode anthropogenic aerosols.
Considering the variations depicted in Figure 2, it is evident that there were persistently high AOD values in January 2020, which is associated with the continuous severe hazy events [43,44]. During this period, the East Asian trough was positioned further east and north relative to previous years and demonstrated weaker intensity. Consequently, a relatively weak winter monsoon circulation developed in the mid-latitudes, leading to the formation of a locally high-humidity and stable-stratification environment, which ultimately triggered the occurrence of continuous severe hazy pollution [45]. In general, frequent dust events in spring result in a significantly higher AOD compared to the other seasons, with a 3-year mean AOD of 0.36 ± 0.25 and larger particle size indicated by an α value of 0.56 ± 0.31 (Table 3). Summer follows with an AOD of 0.30 ± 0.21 and an α value of 0.75 ± 0.32, while winter has an AOD of 0.30 ± 0.18 and an α value of 0.81 ± 0.05. Autumn exhibits the lowest AOD at 0.25 ± 0.16 and an α value of 0.86 ± 0.30. The intense photochemical reactions in summer, combined with a relatively humid environment, possibly increase the aerosol loading (i.e., aerosol concentration) and promote pronounced hygroscopic growth, resulting in the bigger particle sizes. Notably, wintertime aerosols have the lowest seasonal averages in 2021 (0.19 ± 0.14) and 2022 (0.20 ± 0.19); therefore, the higher 3-year AOD of 0.30 ± 0.18 for winter is primarily attributed to the elevated AOD of 0.51 ± 0.38 observed in 2020.

3.2. PSCF Analysis for Source Apportionment

Aiming at identifying the impacts of transport pathways, the PSCF results for daily-resolved AOD are estimated by TrajStat software to visualize the relative contributions from transboundary transport and local emissions in the study area, as shown in Figure 3.
Figure 3 depicts a banana-shaped distribution of PSCF probability for the entire four seasons, but with different extensions along latitude. In winter, a thin belt extends towards central Xinjiang from the area adjacent to Wuhai, with the prominent potential source being the western Alxa Desert. Additionally, air masses from western Xinjiang, northwestern Gansu, and western Inner Mongolia also significantly contribute to AOD in Wuhai. In contrast, for the other three seasons, the banana-shaped pattern appears slightly thicker, with reduced influence from western areas and more impact from southeastern air masses. The Alxa Desert remains influential in these three seasons, while industrial and mining zones in northern Ningxia and southern Inner Mongolia are also important potential sources. In summer, the influence extends southward and eastward to cover much of Shaanxi, central and southern Shanxi, western Henan, and even the western border of Hebei province, with PSCF probabilities exceeding 0.5, indicating significant anthropogenic impacts. For spring and autumn, the influential regions are concentrated in central Shaanxi province.

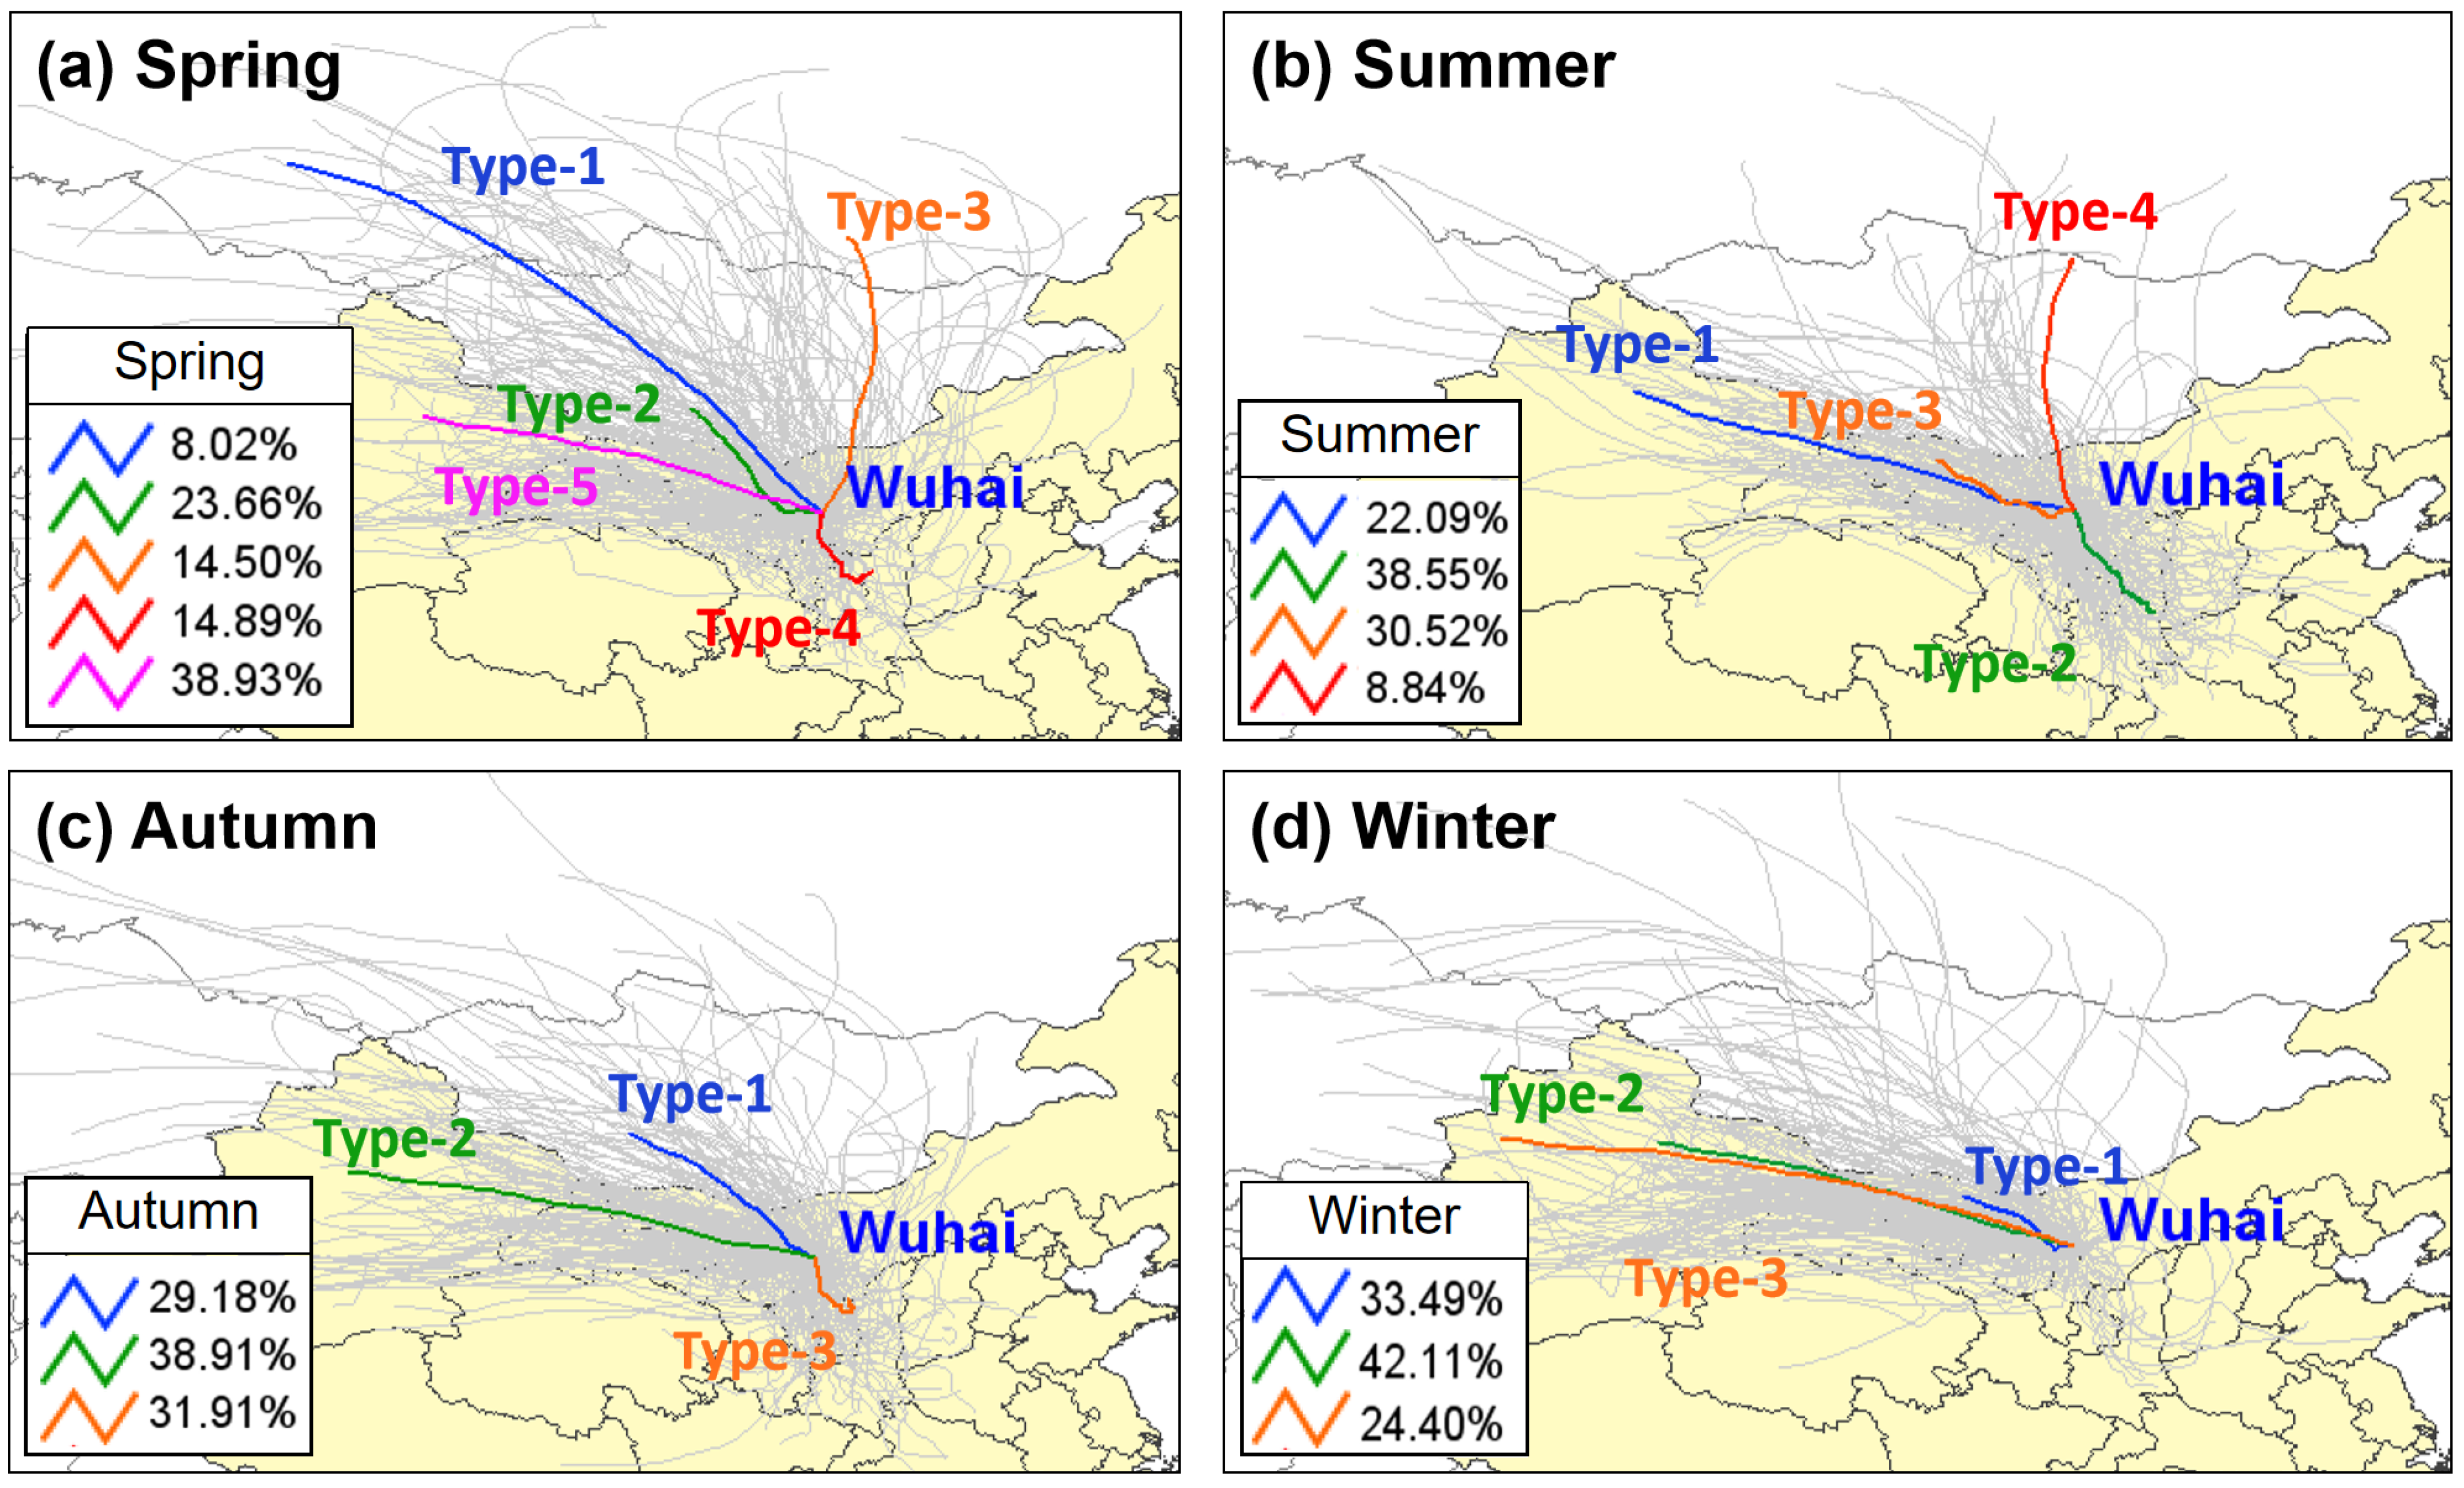
3.3. Aerosol Optical Properties in Different Backward Trajectory Clusters

In this section, we further analyze the seasonal backward-trajectory clustering results obtained using the TrajStat model. As illustrated in Figure 4, air masses can be categorized into five types in spring, four types in summer, three types in autumn, and three types in winter, with NW-quadrant trajectories predominating all the year round. Specifically, NW-quadrant air flows account for 85.11% of the total in spring (Type-1, Type-2, Type-3, and Type-5), 61.45% in summer (Type-1, Type-3, and Type-4), 68.09% in autumn (Type-1 and Type-2), and 100% in winter. This dominance is primarily due to Wuhai’s inland location, which makes it significantly affected by continental air mass activities, such as the Mongolian cyclone. In addition to the NW-quadrant air masses, southeast trajectories are also observed during spring, summer, and autumn, comprising 14.89%, 38.55%, and 31.91% of the total, respectively. Details of the properties of different seasonal clusters are summarized in Table 4.
Spring season: In this season, the Type-1 trajectory originates from southwest Siberia, representing a long-range northwest air mass and accounting for 8.02% of the entire trajectories. This trajectory passes through the Desert/Gobi areas, resulting in a coarse-mode aerosol distribution with an α of 0.41 ± 0.31 and an AOD of 0.39 ± 0.37, indicating a slightly polluted scenario. Similarly, Type-5, which accounts for 38.93% of the total air masses, exhibits an AOD of 0.34 ± 0.20 and α of 0.39 ± 0.19. In contrast, Type-4, originating from central Shaanxi province and characterized by high population density and occurring with a frequency of 14.89%, shows a lightly polluted scenario with an AOD of 0.47 ± 0.24 and α of 0.83 ± 0.31. Therefore, it can be concluded that although there were frequent dust events in the spring season, anthropogenic influences from densely populated southern areas play a more significant role in polluting Wuhai.
Summer season: The four types of trajectories occurred with frequencies of 22.09%, 38.55%, 30.52%, and 8.84%, respectively. The AOD values in the control of Type-1 (northwest air mass from North Xinjiang province), Type-3 (northwest air mass from west Inner Mongolia), and Type-4 (north air mass from north Outer Mongolia) were similar, with respective values of 0.22 ± 0.10, 0.28 ± 0.23, and 0.21 ± 0.12. The corresponding α were 0.54 ± 0.23, 0.70 ± 0.28, and 0.69 ± 0.31. In contrast, Type-2, a southeast short-range air mass from south Shanxi province, exhibited higher AOD and α of 0.38 ± 0.23 and 0.91 ± 0.30, indicating a slightly more polluted condition characterized by fine particles.
Autumn season: The proportions of three air masses were 29.18%, 38.91%, and 31.91%, respectively, indicating a relatively uniform distribution. The AOD values for Type-1 (Northwest moderate trajectory from South Outer Mongolia) and Type-2 (west long-range trajectory from central Xinjiang province) were 0.25 ± 0.18 and 0.20 ± 0.09, with corresponding α of 0.86 ± 0.29 and 0.73 ± 0.29. Likewise, the anthropogenic air mass originating from North Shaanxi province slightly impacted Wuhai, with an AOD of 0.32 ± 0.17 and α of 1.02 ± 0.22, underscoring the significant influence of human activities on local air quality.
Winter season: The three clusters of air masses all originated from the northwest and west regions, accounting for 33.49%, 42.11%, and 24.40%, respectively. The short-range Type-1 air mass from west Inner Mongolia transported small-mode aerosols to Wuhai, resulting in AOD and α values of 0.49 ± 0.39 and 0.90 ± 0.32, respectively. This is likely associated with coal burning and rural straw burning for winter heating. The other two trajectories, by contrast, from central (Type-2) and west (Type-3) Xinjiang province exhibit similar properties despite their long-range transport paths. Their AOD values were 0.22 ± 0.21 and 0.20 ± 0.13, demonstrating relatively clean air conditions, which can be attributed primarily to the strong winter wind [46].

3.4. Influences of Different Typs of Aerosols

3.4.1. Aerosol Classification Diagram

Drawing on the literature of Ma et al. and Kaskaoutis et al. [23,47], an interval-scatter diagram based on the specific thresholds of AOD and α shown in Table 1 is employed to differentiate the discriminated effect of various air masses.
Figure 5 shows the scatter plots of AOD (500 nm) and α overlaid on the classification diagram. In spring, Wuhai is dominated by dust aerosols and less affected by biomass burning/urban aerosols, primarily attributed to the frequent dust events in North China. Dust aerosols are mainly observed under the influences of Type-1, Type-2, and Type-5 air masses, which traverse the desert/Gobi landscape during transport. For these types, AOD values range from 0.07 to 1.73, 0.11 to 1.99, and 0.10 to 1.10, respectively, while α values vary between 0.04–1.08, 0.02–1.30, and 0.10–1.04. For Type-4 air mass, the ranges of AOD and α were 0.21–1.30 and 0.23–1.26. Although their variation sections are similar, distinct patterns emerge between AOD and α. For instance, α exhibits a significant decreasing trend as AOD increases (Type-1, -2, -3, and -5), indicating the dominance of dust aerosols. In contrast, an increasing trend in α with rising AOD (Type-4) suggests the significant influence of fine-particle pollution.
In summer, the characteristics of AOD and α in different types are less pronounced, with a larger proportion of fine anthropogenic aerosols appearing in the southeast Type-2 air mass. This is probably related to the intense human activities and active photochemical production. In the autumn season, α also increases along with the rising of AOD, demonstrating a significant effect of anthropogenic influence, particularly for Type-3 air mass originating from North Shaanxi province. Specifically, 42% of the occurrences fall into SECTION IV (Biomass burning/Urban aerosol), while 54% belong to mixed-type aerosols of both coarse-mode dust and fine-mode anthropogenic particles. The maximum α reaches 1.38.
Conversely, the behavior of AOD-α scatter presents a dust-dominated shape in winter (Figure 5d), especially for the long-range west trajectories of Type-3. In SECTIONS IV and III, high α values are generally associated with low AOD, except for occasional cases, as depicted in the dashed circle. The mean AOD for Type-2 was 0.20 (SECTION III) and 0.17 (SECTION IV), while both were 0.12 for Type-3. Under the control of Type-1, both coarse-mode dust and fine-mode anthropogenic aerosols are prevalent, which is primarily caused by the winter gales and coal/straw burning for heating over the Mongolian region. The averaged AOD in SECTION II, III, and IV were 0.65, 0.52, and 0.37, respectively.

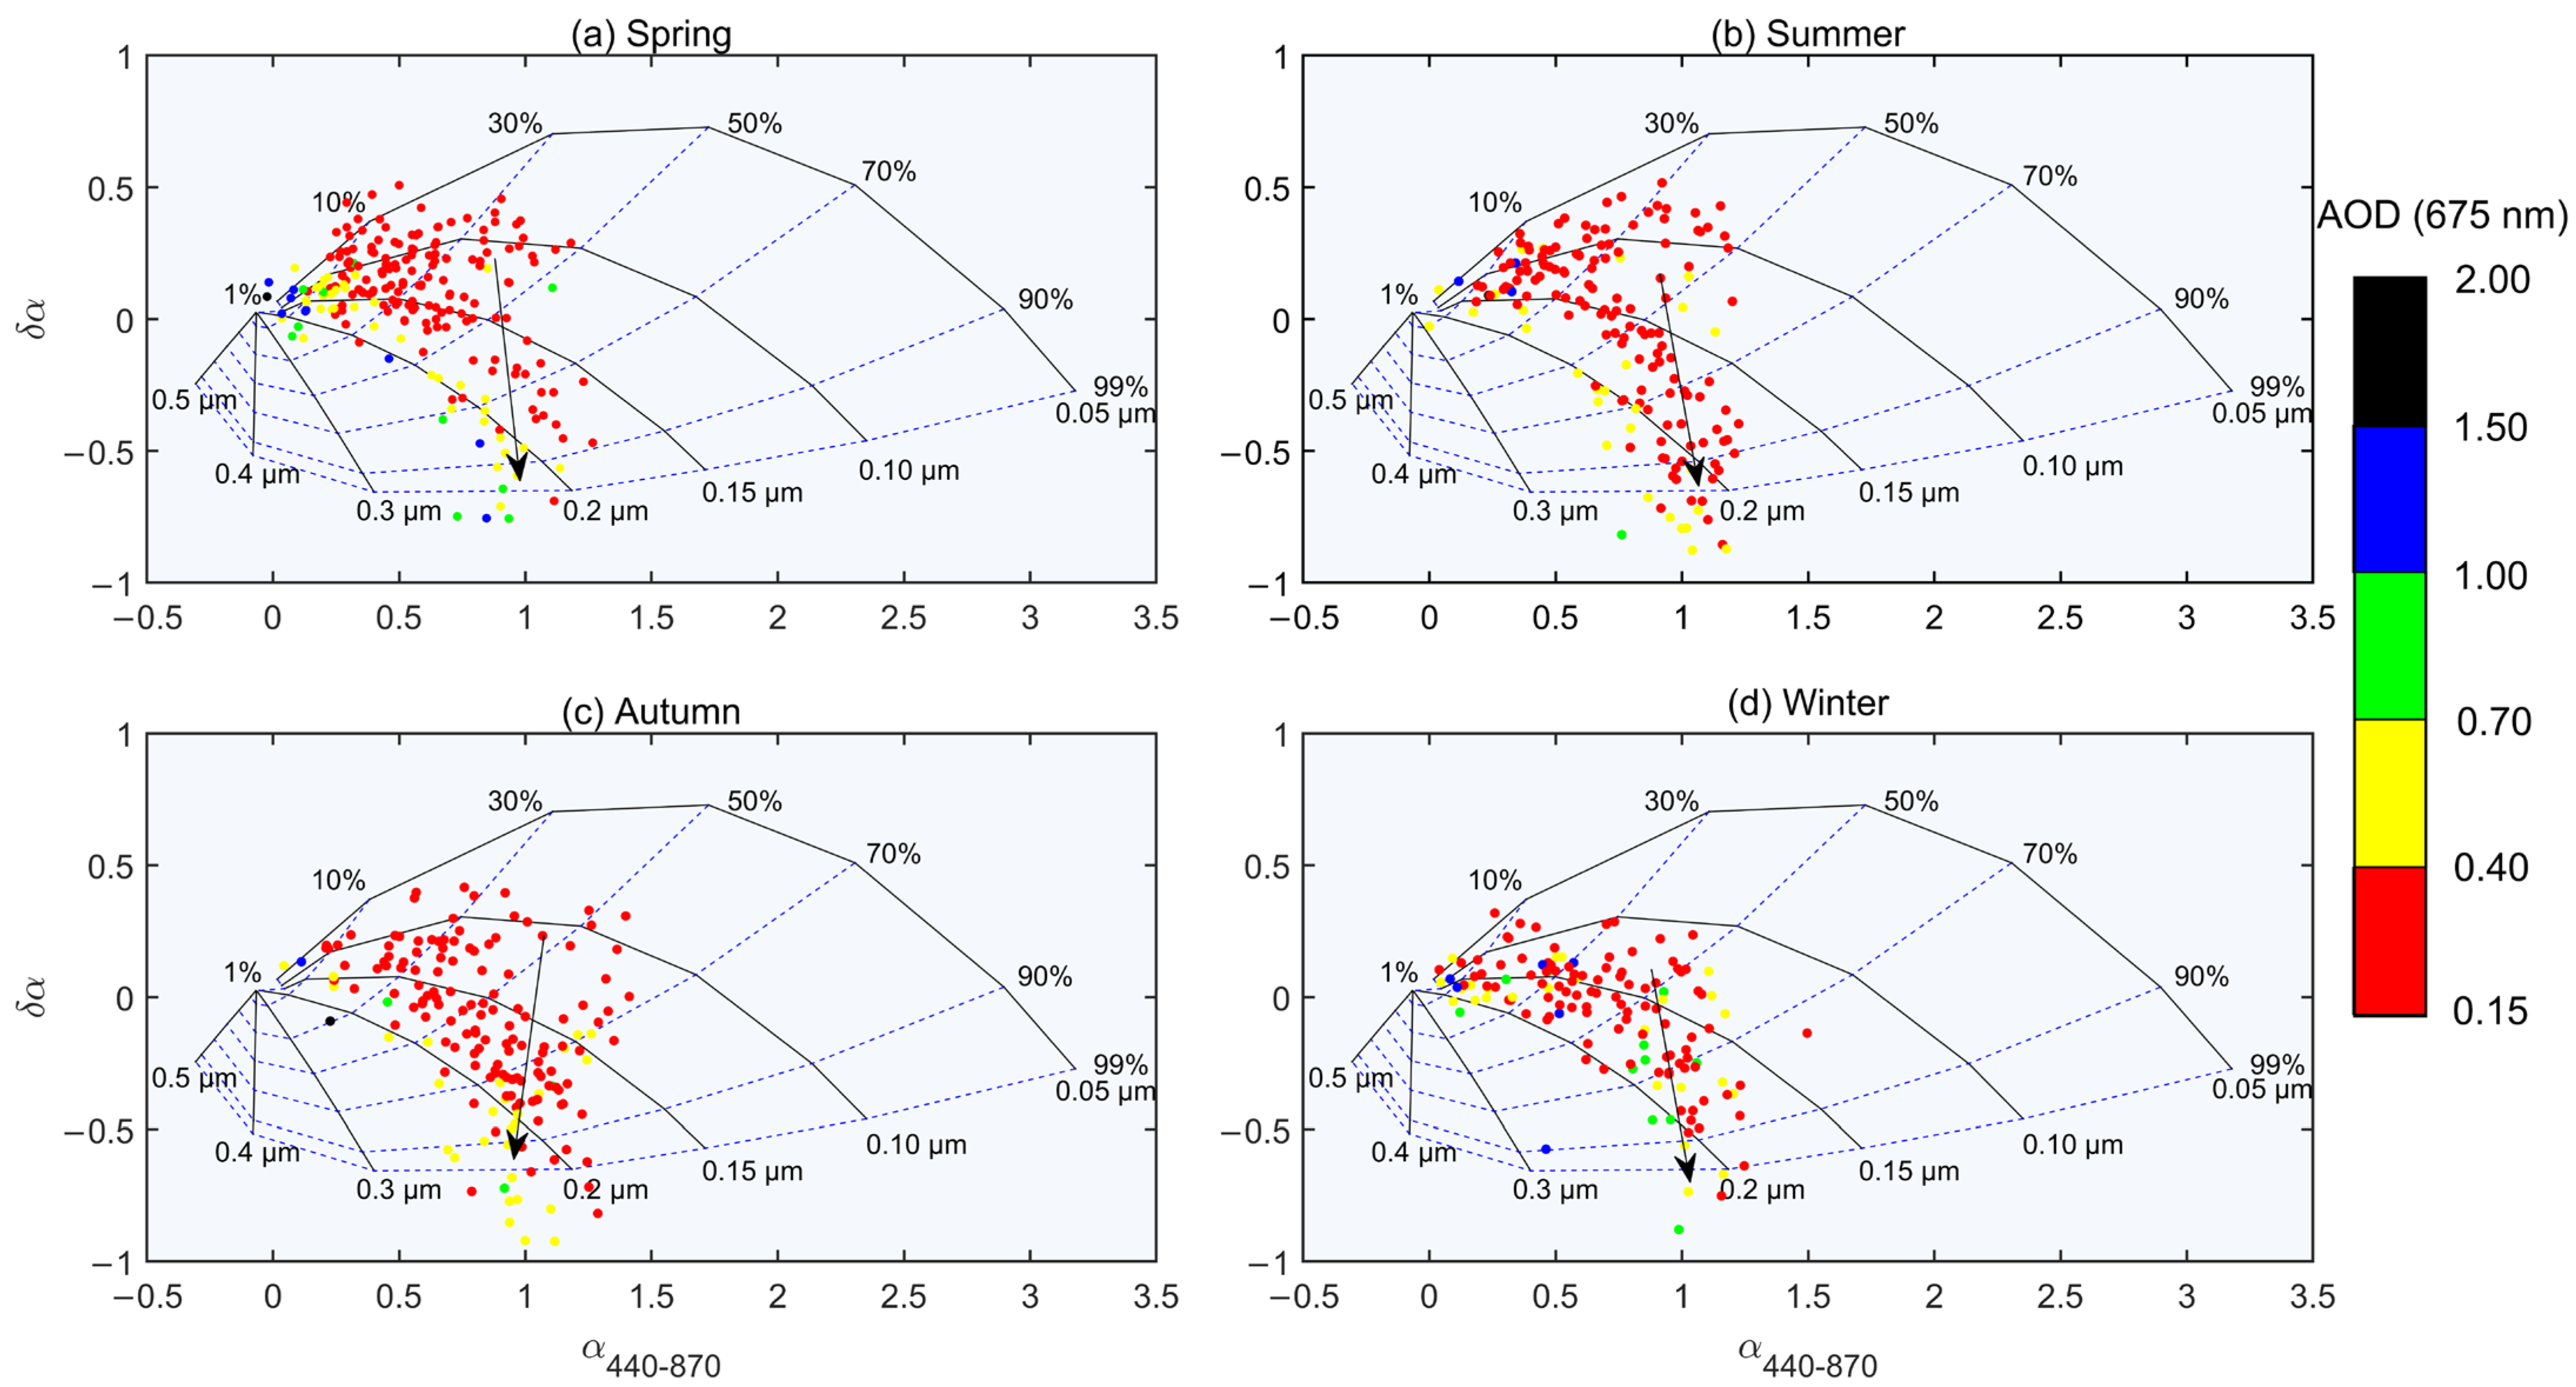
3.4.2. Bird-Wing Diagram

For further discussion on aerosol classification, a bird-wing diagram developed by Gobbi et al. [48] is also presented to clarify the mixtures of polluted aerosols with dust, distinguish aerosol growth from cloud contamination, and quantify aerosol humidification. As shown in Figure 6, the framework utilizes α for the x-axis (i.e., the Ångström exponent calculated by AOD values at the wavelengths of 440 nm and 870 nm) and δα for the y-axis (i.e., the Ångström exponent difference), also known as the AdA coordinate. In this diagram, black solid lines denote the size of fine-mode particles (Rf) with a range of 0.05–0.50 μm. Blue dashed lines represent the fixed extinction fraction of fine-mode aerosols (η) relative to the total AOD at 675 nm, ranging from 1% to 99%. This diagram effectively identifies and differentiates between fine-mode and coarse-mode aerosols. Similar to Gobbi et al., 2007 [48], in order to avoid errors exceeding 30%, measurements with AOD (675 nm) < 0.15 were excluded.
Figure 6 illustrates the seasonal bird-wing frameworks. Notably, higher AOD values (i.e., AOD > 0.70) are predominantly concentrated within the coarse-mode section {η < 30%} [49], especially for the spring season, which can be attributed to the dust events. Dust occurrences were also observed in autumn (Figure 6c) and winter (Figure 6d), but these were less frequent and exhibited lower AOD magnitude. In summer, high-AOD points lying below η < 30% mainly indicate the influences of hygroscopic growth, with fine-mode particle sizes ranging from 0.10 µm to 0.15 µm. For the four seasons, the extension of the Wuhai AOD measurements to higher values extends perpendicularly downward from the black lines (refer to the black arrows), indicating an increase in both Rf and η. This suggests that particles leading to moderate pollution (0.40 < AOD < 1.00) primarily range around 0.2–0.25 µm, and fine particle pollution persists throughout the year. Additionally, in the slightly polluted scenario of AOD < 0.40, the extinction fraction of fine-mode aerosols can vary within a broader range of 1–99%, whereas the maximum Rf is only as high as around 0.21 µm.

4. Conclusions

Through analyzing the aerosol optical dataset observed during the 3-year COVID-19 period (2020–2022) in the typical desert industrial city Wuhai, we gained quantitative characterization of aerosol optical properties and quantified source contributions during the COVID-19 lockdown, as well as its effects on desert pollution for the first time. The key findings are as follows:
(1)
The aerosol optical properties during 2020–2022 indicate a slightly polluted level of a mixture of coarse-mode dust aerosols and fine-mode anthropogenic aerosols. The seasonal highest AOD primarily appears in spring because of the frequent dust events, while the lowest mainly occurs in winter.
(2)
Source apportionments identified the Alxa Desert as a major potential source throughout the year, and anthropogenic industrial and mining activities in northern Ningxia and southern Inner Mongolia were also important contributors during spring, summer, and autumn. Particularly in summer, the zones of influence cover most of the central parts of north China, including much of Shaanxi, central and southern Shanxi, western Henan, and even the western border of Hebei province.
(3)
The northwest (NW-quadrant) wind originating from the depopulated-zone desert or Gobi area dominates Wuhai, and the remaining parts come from the southeastern (SE-quadrant) areas of densely populated areas. Despite the dominance of NW air flows, SE anthropogenic air masses contribute to the highest aerosol loading and finest particle sizes. Therefore, it can be concluded that anthropogenic influence remains significant over this areas even under strict control measures during the COVID-19 lockdown.
(4)
The clarifications show that in the southeast air flows, aerosols are predominantly of anthropogenic origin and consist of a mixture of coarse- and fine-mode aerosols, while for the northwest air flows, coarse-mode dust dominates. Moreover, it is also found that the particles leading to moderate pollution primarily range around 0.2–0.25 µm, and fine particle pollution persists all the year round.

Author Contributions

Conceptualization, F.H. and Y.T.; methodology, F.H., N.L. and C.S.; software, F.H. and N.L.; validation, X.Z., P.W. and Y.G.; formal analysis, F.H. and Y.T.; investigation, F.H.; resources, C.S. and Y.G.; data curation, C.S. and Y.T.; writing—original draft preparation, F.H.; writing—review and editing, F.H., Y.S., Y.L., X.C. and Y.T.; visualization, P.W.; supervision, Y.T.; project administration, Y.T.; funding acquisition, Y.T. All authors have read and agreed to the published version of the manuscript.

Funding

This study was supported by the major science and technology project of Inner Mongolia Autonomous Region (2020ZD0013) and Inner Mongolia key research and development plan (2022YFHH0116).

Institutional Review Board Statement

Not applicable.

Informed Consent Statement

Not applicable.

Data Availability Statement

Research data from this study will be made available on request (tianyongl@163.com).

Conflicts of Interest

The authors declare no conflict of interest.

References

  1. IPCC. Climate Change 2013: The Physical Science Basis; Contribution of Working Group I to the Fifth Assessment Report of the Intergovernmental Panel on Climate Change; Cambridge University Press: Cambridge, UK; New York, NY, USA, 2013. [Google Scholar]
  2. Dubovik, O.; Smirnov, A.; Holben, B.N.; King, M.D.; Kaufman, Y.J.; Eck, T.F. Accuracy assessments of aerosol optical properties retrieved from Aerosol Robotic Network (AERONET) Sun and sky radiance measurements. J. Geophys. Res. 2000, 105, 9791–9806. [Google Scholar] [CrossRef]
  3. Li, J.; Carlson, B.E.; Yung, Y.L.; Lv, D.R.; Hansen, J.; Penner, J.E.; Liao, H.; Ramaswamy, V.; Kahn, R.A.; Zhang, P.; et al. Scattering and absorbing aerosols in the climate system. Nat. Rev. Earth Env. 2022, 3, 363–379. [Google Scholar] [CrossRef]
  4. Ma, Y.J.; Ye, J.H.; Xin, J.Y.; Zhang, W.Y.; Vilà-Guerau de Arellano, J.; Wang, S.G.; Zhao, D.D.; Dai, L.D.; Ma, Y.X.; Wu, X.Y.; et al. The Stove, Dome, and Umbrella Effects of Atmospheric Aerosol on the Development of the Planetary Boundary Layer in Hazy Regions. Geophy. Res. Lett. 2020, 47, e2020GL087373. [Google Scholar] [CrossRef]
  5. Xin, J.Y.; Wang, Y.S.; Pan, Y.P.; Ji, D.S.; Liu, Z.R.; Wen, T.X.; Wang, Y.H.; Li, X.R.; Sun, Y.; Sun, J.; et al. The campaign on atmospheric aerosol research network of china: Care-China. Bull. Am. Meteorol. Soc. 2015, 96, 1137–1155. [Google Scholar] [CrossRef]
  6. Li, Z.Q.; Lau, W.K.-M.; Ramanathan, V.; Wu, G.; Ding, Y.; Manoj, M.G.; Liu, J.; Qian, Y.; Li, J.; Zhou, T.; et al. Aerosol and monsoon climate interactions over Asia. Rev. Geophys. 2016, 54, 866–929. [Google Scholar] [CrossRef]
  7. Xin, J.Y.; Wang, Y.S.; Li, Z.Q.; Wang, P.C.; Hao, W.M.; Nordgren, B.; Wang, S.; Liu, G.; Wang, L.; Wen, T.; et al. Aerosol optical depth (AOD) and Ångström exponent of aerosols observed by the Chinese sun Hazemeter network from August 2004 to September 2005. J. Geophys. Res. 2007, 112, D05203. [Google Scholar] [CrossRef]
  8. Che, H.Z.; Zhang, X.Y.; Xia, X.A.; Goloub, P.; Holben, B.; Zhao, H.J.; Wang, Y.; Zhang, X.C.; Wang, H.; Blarel, L.; et al. Ground-based aerosol climatology of China: Aerosol optical depths from the china aerosol remote sensing network (CARSNET) 2002–2013. Atmos. Chem. Phys. 2015, 15, 7619–7652. [Google Scholar] [CrossRef]
  9. Kong, L.B.; Xin, J.Y.; Zhang, W.Y.; Wang, Y.S. The empirical correlations between PM2.5, PM10 and AOD in the Beijing metropolitan region and the PM2.5, PM10 distributions retrieved by MODIS. Environ. Pollut. 2016, 216, 350–360. [Google Scholar] [CrossRef]
  10. Gui, K.; Che, H.Z.; Wang, Y.Q.; Xia, X.A.; Holben, B.N.; Goloub, P.; Cuevas-Agulló, E.; Yao, W.R.; Zheng, Y.; Zhao, H.J.; et al. A global-scale analysis of the MISR Level-3 aerosol optical depth (AOD) product: Comparison with multi-platform AOD data sources. Atmos. Pollut. Res. 2021, 12, 101238. [Google Scholar] [CrossRef]
  11. Li, H.; He, X.Q.; Shanmugam, P.; Bai, Y.; Wang, D.F.; Li, T.; Gong, F. Assessing and Improving the Accuracy of Visible Infrared Imaging Radiometer Suite Ocean Color Products in Environments with High Solar Zenith Angles. Remote Sens. 2024, 16, 339. [Google Scholar] [CrossRef]
  12. Tian, P.F.; Cao, X.J.; Zhang, L.; Sun, N.X.; Sun, L.; Logan, T.; Shi, J.S.; Wang, Y.; Ji, Y.M.; Lin, Y.; et al. Aerosol vertical distribution and optical properties over China from long-term satellite and ground-based remote sensing. Atmos. Chem. Phys. 2017, 17, 2509–2523. [Google Scholar]
  13. Zhang, W.H.; Gu, X.F.; Xu, H.; Yu, T.; Zheng, F.J. Assessment of OMI near-UV aerosol optical depth over Central and East Asia. J. Geophys. Res. Atmos. 2015, 121, 382–398. [Google Scholar]
  14. Zhao, M.; Dai, T.; Goto, D.; Wang, H.; Shi, G.Y. Assessing the assimilation of Himawari-8 observations on aerosol forecasts and radiative effects during pollution transport from South Asia to the Tibetan Plateau. Atmos. Chem. Phys. 2024, 24, 235–258. [Google Scholar]
  15. Holben, B.N.; Eck, T.F.; Slutsker, I.; Tanre, D.; Buis, J.P.; Setzer, A.; Vermote, I.E.; Reagan, J.A.; Kaufman, Y.J.; Nakajima, T.; et al. AERONET-A federated instrument network and data archive for aerosol characterization. Remote Sens. Environ. 1998, 66, 1–16. [Google Scholar]
  16. Bokoye, A.I.; Royer, A.; O’Neill, N.T.; Fedosejevs, G.; Teillet, P.M.; McArthur, L.J.B. Characterization of atmospheric aerosols across Canada from a ground-based Sunphotometer network: AEROCAN. Atmos. Ocean 2001, 39, 429–456. [Google Scholar]
  17. Goloub, P.; Li, Z.Q.; Dubovik, O.; Blarel, L.; Podvin, T.; Jankowiak, I.; Lecoq, R.; Deroo, C.; Chatenet, B.; Morel, J.P.; et al. PHOTONS/AERONET sun photometer network overview: Description, activities, results. Fourteenth Int. Symp. Atmos. Ocean. Opt. Atmos. Phys. 2008, 6936, 218–232. [Google Scholar]
  18. Yu, J.; Che, H.Z.; Chen, Q.L.; Xia, X.A.; Zhao, H.J.; Wang, H.; Wang, Y.Q.; Zhang, X.Y.; Shi, G.Y. Investigation of Aerosol Optical Depth (AOD) and Angstrom Exponent over the Desert Region of Northwestern China Based on Measurements from the China Aerosol Remote Sensing Network(CARSNET). Aerosol Air Qual. Res. 2015, 15, 2024–2036. [Google Scholar]
  19. Zong, X.M.; Xia, X.A.; Che, H.Z. Validation of aerosol optical depth and climatology of aerosol vertical distribution in the Taklimakan Desert. Atmos. Pollut. Res. 2015, 6, 239–244. [Google Scholar] [CrossRef]
  20. Li, J.L.; Ge, X.Y.; He, Q.; Abbas, A. Aerosol optical depth (AOD): Spatial and temporal variations and association with meteorological covariates in Taklimakan desert, China. Peer J. 2021, 9, e10542. [Google Scholar]
  21. Xia, X.A.; Chen, H.B.; Wang, P.C. Aerosol properties in a Chinese semiarid region. Atmos. Environ. 2004, 38, 4571–4581. [Google Scholar]
  22. Ma, Y.J.; Xin, J.Y.; Ma, Y.N.; Kong, L.B.; Zhang, K.Q.; Zhang, W.Y.; Wang, Y.S.; Wang, X.Q.; Zhu, Y.F. Optical properties and source analysis of aerosols over a desert area in Dunhuang, Northwest China. Adv. Atmos. Sci. 2017, 34, 1017–1026. [Google Scholar]
  23. Gong, C.S.; Xin, J.Y.; Wang, Y.; Zhao, C.L.; Yan, P.C.; Wen, T.X.; Song, T.; Yang, Z. The contribution of aerosols chemical components to aerosol optical depth: The method and the case in Dunhuang. Atmos. Res. 2021, 258, 105652. [Google Scholar] [CrossRef]
  24. Mao, J.D.; Sheng, H.J.; Zhao, H.; Zhou, C.Y. Observation Study on the Size Distribution of Sand Dust Aerosol Particles over Yinchuan, China. Adv. Meteorol. 2014, 1, 157645. [Google Scholar] [CrossRef]
  25. Xin, J.Y.; Wang, S.G.; Wang, Y.S.; Yuan, J.Y.; Zhang, W.Y.; Sun, Y. Optical properties and size distribution of dust aerosols over the Tengger Desert in Northern China. Atmos. Environ. 2005, 39, 5971–5978. [Google Scholar] [CrossRef]
  26. Wong, W.M.; Wang, X.; Wang, Y.F. The intersection of COVID-19 and air pollution: A systematic literature network analysis and roadmap for future research. Environ. Res. 2023, 237, 116839. [Google Scholar] [CrossRef]
  27. Wu, X.; Nethery, R.C.; Sabath, M.B.; Braun, D.; Dominici, D. Air pollution and COVID-19 mortality in the United States: Strengths and limitations of an ecological regression analysis. Sci. Adv. 2020, 6, eabd4049. [Google Scholar]
  28. Le, T.H.; Wang, Y.; Liu, L.; Yang, J.N.; Yung, Y.L.; Li, G.H.; Seinfeld, J.H. Unexpected air pollution with marked emission reductions during the COVID-19 outbreak in China. Science 2020, 369, 702–706. [Google Scholar] [CrossRef]
  29. Zhang, X.H.; Tang, M.L.; Guo, F.J.; Wei, F.; Yu, Z.B.; Gao, K.; Jin, M.J.; Wang, J.B.; Chen, K. Associations between air pollution and COVID-19 epidemic during quarantine period in China. Environ. Pollut. 2021, 268, 115897. [Google Scholar] [CrossRef]
  30. Zeng, W.X.; Chen, X.; Tang, K.F.; Qin, Y.F. Does COVID-19 lockdown matter for air pollution in the short and long run in China? A machine learning approach to policy evaluation. J. Environ. Manage. 2024, 370, 122615. [Google Scholar] [CrossRef]
  31. Barreto, Á.; Cuevas, E.; Granados-Muñoz, M.-J.; Alados-Arboledas, L.; Romero, P.M.; Gröbner, J.; Kouremeti, N.; Almansa, A.F.; Stone, T.; Toledano, C. The new sun-sky-lunar Cimel CE318-T multiband photometer—A comprehensive performance evaluation. Atmos. Meas. Tech. 2016, 9, 631–654. [Google Scholar] [CrossRef]
  32. Kasten, F. A new table and approximate formula for relative optical air mass. Arch. Meteorol. Geophys. Bioclimatol. 1966, 14, 206–233. [Google Scholar] [CrossRef]
  33. Kasten, F.; Young, A.T. Revised optical air mass tables and approximation formula. Appl. Opt. 1989, 28, 4735–4738. [Google Scholar] [CrossRef] [PubMed]
  34. Komhyr, W.D.; Mateer, C.L.; Hudson, R.D. Operations Handbook—Ozone Observations with a Dobson Spectrophotometer; WMO Global Ozone Research and Monitoring Project 1980, Report No.6; WMO: New York, NY, USA, 1980. [Google Scholar]
  35. Li, Z.; Blarel, L.; Podvin, T.; Goloub, P.; Buis, J.P.; Morel, J.P. Transferring the calibration of direct solar irradiance to diffuse sky radiance measurements for Cimel sun-sky radiometers. Appl. Opt. 2008, 47, 1368–1377. [Google Scholar] [PubMed]
  36. Ångström, A. The parameters of atmospheric turbidity. Tellus 1964, 16, 64–75. [Google Scholar]
  37. Wang, Y.Q.; Zhang, X.Y.; Draxler, R.R. TrajStat: GIS-based software that uses various trajectory statistical analysis methods to identify potential sources from long-term air pollution measurement data. Environ. Model. Softw. 2009, 24, 938–939. [Google Scholar]
  38. Xin, J.Y.; Ma, Y.J.; Zhao, D.D.; Gong, C.S.; Ren, X.B.; Tang, G.Q.; Xia, X.A.; Wang, Z.F.; Cao, J.J.; Vilà-Guerau de Arellano, J.; et al. The feedback effects of aerosols from different sources on urban boundary layer in Beijing. Environ. Pollut. 2023, 325, 121440. [Google Scholar]
  39. Targino, A.C.; Krecl, P.; Oukawa, G.Y.; Mollinedo, E.M. A short climatology of black and brown carbon and their sources at a suburban site impacted by smoke in Brazil. J. Environ. Sci. 2024, 136, 498–511. [Google Scholar]
  40. Draxler, R.R.; Stunder, B.; Rolph, G.; Taylor, A. HYSPLIT_4 User’s Guide; NOAA Air Resources Laboratory: College Park, MD, USA, 2009. [Google Scholar]
  41. Ren, B.; Xie, P.H.; Xu, J.; Li, A.; Tian, X.; Hu, Z.K.; Huang, Y.Y.; Li, X.M.; Zhang, Q.; Ren, H.M.; et al. Use of the PSCF method to analyze the variations of potential sources and transports of NO2, SO2, and HCHO observed by MAX-DOAS in Nanjing, China during 2019. Sci. Total Environ. 2021, 782, 146865. [Google Scholar]
  42. Zong, Z.; Wang, X.P.; Tian, C.G.; Chen, Y.J.; Fu, S.F.; Qu, L.; Ji, L.; Li, J.; Zhang, G. PMF and PSCF based source apportionment of PM2.5 at a regional background site in North China. Atmos. Res. 2018, 203, 207–215. [Google Scholar]
  43. Ren, X.B.; Tian, Y.L.; Xin, J.Y.; Ren, Y.Z.; Wang, P.; Hao, F.; Ma, Y.J.; Jia, D.J.; Wu, L.; Pan, X.L.; et al. Meteorological and chemical causes of heavy pollution in winter in Hohhot, Inner Mongolia Plateau. Atmos. Res. 2022, 275, 106243. [Google Scholar]
  44. Ma, Y.J.; Xin, J.Y.; Tian, Y.L.; Yue, C.Y.; Zhou, X.J.; Ren, Y.Z.; Hao, F.; Wang, P.; Xie, F.; Ren, X.B.; et al. The interactions of aerosol and planetary boundary layer over a large city in the Mongolian plateau. Sci. Total Environ. 2024, 907, 167985. [Google Scholar]
  45. Han, X.T.; Tong, T.; Jiang, J.Y.; Wang, J.X.; Zhao, Y.Y. Meteorological cause of haze weather in Hohhot in January 2020. Arid Mete. 2022, 40, 275–283. (In Chinese) [Google Scholar]
  46. Tian, L. Studies on Characteristics and Impact Factors of the Surface Wind Speed Changes in the Northern China. Master’s Thesis, Lanzhou University, Lanzhou, China, 2012. (In Chinese). [Google Scholar]
  47. Kaskaoutis, D.G.; Kambezidis, H.D.; Hatzianastassiou, N.; Kosmopoulos, P.G.; Badarinath, K.V.S. Aerosol climatology: On the discrimination of aerosol types over four AERONET sites. Atmos. Chem. Phys. 2007, 7, 6357–6411. [Google Scholar]
  48. Gobbi, G.P.; Kaufman, Y.J.; Koren, I.; Eck, T.F. Classification of aerosol properties derived from AERONET direct sun data. Atmos. Chem. Phys. 2007, 7, 8713–8726. [Google Scholar]
  49. Wang, P.; Che, H.Z.; Zhang, X.C.; Song, Q.L.; Wang, Y.Q.; Zhang, Z.H.; Dai, X.; Yu, D.J. Aerosol optical properties of regional background atmosphere in Northeast China. Atmos. Environ. 2010, 44, 4404–4412. [Google Scholar]
Figure 1. (a) Location of Wuhai city; (b) Distribution of the desert areas in the China mainland; (c) Photo of the Sun-sky-lunar CIMEL CE318-T multiband photometer in the Wuhai super site.
Sustainability 17 03937 g001
Figure 2. Time series of (a) AOD (500 nm) and (b) Ångström exponent α during the whole period 2020–2022.
Sustainability 17 03937 g002
Figure 3. Potential source areas for AOD in the four seasons during the COVID-19 period. The color bar denotes the PSCF probability. Black pin marks the target area, i.e., Wuhai city.
Sustainability 17 03937 g003
Figure 4. Clustering for the backward trajectories in Wuhai city in (a) spring, (b) summer, (c) autumn, and (d) winter. The gray lines are the trajectories at 14:00 (local time) screened by the AOD-observed day in each season.
Sustainability 17 03937 g004
Figure 5. Scatter plots for AOD (500 nm) and α in different air masses against the interval scatter diagram for (a) spring, (b) summer, (c) autumn, and (d) winter. The interval-scatter diagram is composed of four sections, including SECTION I (AOD: 0–0.07, α: −0.5–1.5), SECTION II (AOD: 0.2–2, α: −0.5–0.5), SECTION IV (AOD: 0.07–2, α: 1.1–1.5), and the remaining areas are designated as SECTION III. Lines and dashed circles are used for guiding the eyes.
Sustainability 17 03937 g005
Figure 6. Seasonal scatter plots of the Ångström exponent (α440–870) and the Ångström exponent difference (δα = α440–675α675–870) against the bird-wing diagram. AOD at 675 nm wavelength is selected for differentiating different polluted levels. Arrows are used to guide the eyes.
Sustainability 17 03937 g006
Table 1. Thresholds of aerosol optical depth (AOD at 500 nm) and Ångström exponent α for different types of aerosols.
AOD (500 nm)α
I: Sea salt0–0.07−0.5–1.5
II: Desert dust 0.2–2−0.5–0.5
III: Mixed type0.07–20.5–1.1
0.07–0.2−0.5–0.5
IV: Biomass burning/urban industry0.07–21.1–2
Table 2. Annual mean ± standard deviation (STD) values of aerosol optical depth (AOD at 500 nm) and Ångström exponent (α). The annual means were calculated by averaging the monthly mean values, while the overall average for the three-year period was obtained by averaging the three annual mean values.
AOD (500 nm)α
20200.36 ± 0.120.75 ± 0.22
20210.30 ± 0.120.75 ± 0.14
20220.28 ± 0.090.74 ± 0.19
All0.31 ± 0.040.76 ± 0.01
Table 3. Same as Table 2, but for seasonal values.
AOD (500 nm)α
2020Spring0.32 ± 0.190.59 ± 0.30
Summer0.33 ± 0.240.66 ± 0.30
Autumn0.28 ± 0.180.91 ± 0.28
Winter0.51 ± 0.380.79 ± 0.35
2021Spring0.44 ± 0.340.60 ± 0.35
Summer0.29 ± 0.230.84 ± 0.31
Autumn0.24 ± 0.120.80 ± 0.28
Winter0.19 ± 0.140.76 ± 0.35
2022Spring0.33 ± 0.170.49 ± 0.27
Summer0.28 ± 0.150.73 ± 0.31
Autumn0.24 ± 0.160.88 ± 0.32
Winter0.20 ± 0.190.86 ± 0.31
AllSpring0.36 ± 0.250.56 ± 0.31
Summer0.30 ± 0.210.75 ± 0.32
Autumn0.25 ± 0.160.86 ± 0.30
Winter0.30 ± 0.180.81 ± 0.05
Table 4. Properties of different trajectories and the corresponding averages of AOD (500 nm) and Ångström exponent α in the four seasons of 2020–2022 in Wuhai.
Type-1Type-2Type-3Type-4Type-5
SpringOriginSouthwest SiberiaSouth Outer MongoliaSouth SiberiaCentral Shanxi provinceCentral Xinjiang province
DirectionNorthwestNorthwestNorthSouthWest
DistanceLongShortModerateShortModerate
Ratio8.02%23.66%14.50%14.89%38.93%
AOD0.39 ± 0.370.27 ± 0.280.33 ± 0.200.47 ± 0.240.34 ± 0.20
α0.41 ± 0.310.91 ± 0.290.68 ± 0.310.83 ± 0.310.39 ± 0.19
SummerOriginNorth Xinjiang provinceSouth Shanxi provinceWest Inner MongoliaNorth Outer Mongolia-
DirectionNorthwestSortheastNorthwestNorth-
DistanceLongShortShortModerate-
Ratio8.02%38.55%30.52%8.84%-
AOD0.22 ± 0.100.28 ± 0.230.28 ± 0.230.21 ± 0.12-
α0.54 ± 0.230.91 ± 0.300.70 ± 0.380.69 ± 0.31-
AutumnOriginSouth Outer MongoliaCentral Xinjiang provinceNorth Shaanxi province--
DirectionNorthwestWestSouth--
DistanceModerateLongShort--
Ratio29.18%38.91%31.91%--
AOD0.25 ± 0.180.20 ± 0.090.32 ± 0.17--
α0.86 ± 0.290.73 ± 0.291.02 ± 0.22--
WinterOriginWest Inner MongoliaCentral Xinjiang provinceWest Xinjiang province--
DirectionNorthwestWestWest--
DistanceShortLongLong--
Ratio33.49%42.11%24.40%--
AOD0.49 ± 0.390.22 ± 0.210.20 ± 0.13--
α0.90 ± 0.320.84 ± 0.300.57 ± 0.34--
Disclaimer/Publisher’s Note: The statements, opinions and data contained in all publications are solely those of the individual author(s) and contributor(s) and not of MDPI and/or the editor(s). MDPI and/or the editor(s) disclaim responsibility for any injury to people or property resulting from any ideas, methods, instructions or products referred to in the content.

