Abstract
Karst topography comprises a fragile ecological environment with a significant potential for carbon sequestration. It is characterized by severe rocky desertification, particularly in China’s karst fault basin. Therefore, there is a crucial need to scientifically evaluate the variations in carbon storage over time and space in this area to ensure effective land space planning and regional ecological security, especially considering the dual carbon target. Using land use data (1985–2020) from the karst fault basin in Southwest China, the study employed the InVEST model to evaluate temporal and spatial variations in carbon storage. A time span of 35 years was examined, and predictions regarding carbon storage in 2050 were formulated under three different conditions: natural evolution, ecological protection, and cultivated land protection. These predictions were based on natural, social, and economic driving factors. The results revealed a fluctuating downward trend in regards to carbon storage in the study area from 1985 to 2020, with a total decrease of 2.1 × 10⁶ t. After 2000, there has been significant improvement in the dynamic degree of land use for forest land, grassland, and construction land compared to the levels before 2000. Additionally, many land use types with high carbon density transitioned into those with lower carbon density. Spatially, the carbon density in the karst fault basin was higher in the north and lower in the central and southern basins. At the county spatial scale, except for the northern and central parts of the study area, there was a decrease in total carbon storage in the remaining counties. By 2050, under the ecological protection scenario, total carbon storage is projected to increase by approximately 6 × 10⁶ t, whereas under the natural evolution and cultivated land protection scenarios, it is expected to decrease by 2 × 10⁶ t and 3 × 10⁶ t, respectively. Specifically, under the natural evolution scenario, only five counties will experience an increase in carbon storage, while the other counties will witness a decrease. The findings of this study offer a scientific basis for enhancing ecosystem carbon services through land management practices and the control of rocky desertification in the karst fault basin. They can inform decision-making processes regarding carbon sequestration, ecosystem restoration, and sustainable land use planning in the region.
1. Introduction
The carbon cycle is a major driver of global climate change and a critical topic in global change research [1]. Terrestrial ecosystems, as a key carbon pool in the carbon cycle, play a vital role in maintaining the global carbon balance [2]. However, current land use changes have altered the Earth’s original land cover pattern, leading to changes in the structure and function of terrestrial ecosystems. This, in turn, affects carbon sources and sinks, making land use change one of the most significant human factors influencing the carbon cycle in terrestrial ecosystems [3,4]. In China, land use change has resulted in a significant loss of carbon storage, with 279Tg of carbon storage lost between 1980 and 2010. Land use change has been the primary driver of this carbon storage change [5]. Terrestrial ecosystem carbon storage encompasses aboveground biomass, underground biomass, litter organic carbon, and soil organic carbon [6]. When terrestrial ecosystems fix more carbon through photosynthesis than they release through respiration, they act as a “carbon sink” for the atmosphere. Conversely, when the respiration carbon emissions exceed carbon fixation, terrestrial ecosystems become a “carbon source” to the atmosphere [7]. Given China’s commitment to achieving carbon peaking and carbon neutrality, it is of great practical significance to study the impact of land use change on ecosystem carbon storage. Understanding this impact can help protect ecosystems and promote sustainable development in regional economies and societies.
Assessing ecosystem carbon storage in a scientific and reasonable manner is a crucial aspect of ecosystem service assessment [8,9,10]. However, with the rapid urbanization occurring in China in recent years, the transformation of forest and agricultural land into urban development areas has become an increasing concern, leading to a loss of carbon storage in terrestrial ecosystems [11,12]. Many studies have focused on carbon storage in terrestrial ecosystems at different scales. The InVEST (Integrated Valuation of Ecosystem Services and Tradeoffs) model, particularly its carbon storage module, has been has been extensively utilized to assess the effects of land use changes on carbon storage [13]. For instance, at the basin scale, Li et al. [14] utilized the InVEST model to assess land use and land cover change in the Loess Plateau from 2000 to 2016 and evaluated its influence on carbon storage. Babbar et al. [15] employed the Markov chain and the InVEST model to evaluate and predict carbon sinks in the Sariska Tiger Reserve, considering total carbon change under different scenarios for 2000, 2018, and 2035. Additionally, studies at provincial and municipal scales have also been conducted. Lin et al. [16] utilized the InVEST and PLUS models to estimate ecosystem carbon storage in Guizhou Province, a typical karst area in China, to assess its sustainability. Hoque et al. [17] assessed and predicted dynamics of plantation forest development and changes in ecosystem carbon storage in coastal Bangladesh from 1988 to 2041, applying three different land management scenarios using the CA-Markov and InVEST models [15]. The InVEST model has been demonstrated to effectively assess the consequences of land use changes on ecosystem carbon storage at different scales. By analyzing these carbon storage variations, decision makers and land managers are able to make informed choices that support ecosystem sustainability while advancing carbon neutrality objectives.
In addition to studying the distribution and evolution of carbon storage, there is growing interest in predicting future carbon storage in different spatial and temporal contexts [18,19]. Researchers have coupled the InVEST model with other models such as the FLUS (future land use simulation), PLUS (patch-generating land use simulation), CA-Markov, and CLUE-S models to explore future carbon storage prediction and provide optimized strategies to enhance ecosystem carbon sink capacity [20,21,22,23]. For instance, Zhao et al. [24] comprehensively evaluated the impact of ecological engineering on carbon storage in the upper reaches of the Heihe River Basin in the semi-arid region of northwest China using the CA-Markov and InVEST models. Anputhas, Janmaat, Nichol, and Wei [18] utilized the CLUE-S system to forecast land use change in the Deep Creek watershed in the northern Okanagan Valley of British Columbia, Canada. The FLUS model, a spatiotemporal land simulation model based on various mixed cellular automata models, has also been employed in carbon storage prediction studies. It demonstrates strong applicability for high-density, multi-scenario, and multi-scale complex land use simulations, providing a better evaluation of the dynamic impact of land use change on carbon storage [25,26]. These models have been particularly useful in predicting the impact of land use changes on carbon storage in karst regions, which are critical areas for ecological restoration and carbon sink enhancement. These modeling approaches, coupled with the InVEST model, allow researchers to forecast future carbon storage under different scenarios and provide valuable insights for improving ecosystem carbon sink capacity. By considering future land use changes and their effects on carbon storage, policymakers and land managers can make informed decisions to achieve carbon neutrality alterations and promote sustainable development.
In addition, there have been numerous studies focusing on the spatial and temporal characteristics, evolutionary patterns, and vegetation restoration of rocky desertification [27,28]. The National Major Scientific Research Project on Global Change, titled “Carbon Cycle Model and Regulation Mechanism in Karst Area Based on Water–Rock–Soil–Gas–Biomass Interaction”, was approved in 2012 and has made significant progress. Research on the carbon cycle pathways, processes, and the carbon sink effect of karst action, as well as the carbon cycle mechanisms of vegetation and soil in karst areas, has provided valuable insights [29,30,31,32]. The use of the FLUS and InVEST models to assess and forecast carbon storage in relation to land use changes has become a common quantitative research method, yielding rich findings at different scales. Given the inherent complexity of karst ecosystems, driven by their unique hydrological and geomorphological features, land use changes in such regions may have cascading, and sometimes unpredictable, effects on carbon fluxes and storage. This calls for more sophisticated, region-specific models that can capture these complex feedback loops. Moreover, the resilience of karst ecosystems to land use change should be a key focus of future studies, considering the region’s vulnerability to environmental degradation and its critical role in carbon sequestration under changing climatic conditions. However, there is a relative lack of research on the karst fault basin, which is an important area for comprehensive management of rocky desertification. Existing studies primarily focus on the impact of karst processes, such as carbonate weathering [33] and the interactions between soil, vegetation, and hydrology, on carbon sequestration [34]. Quantitative research on this mechanism remains limited. The karst fault basin is characterized by a combination of basins and mountains, seasonal droughts, water shortages, and deep underground rivers, leading to a mismatch of water and soil resources and limited productivity. As a result, it has emerged as a critical priority in the nation’s initiatives for ecological preservation and revitalization.
In this study, we aim to integrate the InVEST and FLUS models to estimate and analyze land use changes and their impact on carbon storage in the karst fault basin from 1985 to 2020. Furthermore, it seeks to predict the changing characteristics of carbon storage in the karst fault basin by the year 2050. This research will enhance our understanding of carbon dynamics and aid in guiding sustainable land use practices in the karst fault basin.
2. Materials and Methods
2.1. Study Area and Data
2.1.1. Study Area
The karst fault basin is located in Southwest China, spanning from eastern Yunnan to Panxi in Sichuan and western Guizhou [35], with coordinates ranging from 100°3′ to 105°10′ E and 22°39′ to 29°10′ N (Figure 1). It covers a total area of 11.03 million km2, encompassing 43 counties in the Yanyuan area. The basin consists of pure karst areas (pure carbonate rock), accounting for 21.31%, and sub-karst areas (impure carbonate rock), accounting for 25.98%, while the non-karst area accounts for 52.71%. The main vegetation types in this region are cold and warm evergreen broad-leaved forests and evergreen coniferous forests. The predominant soil types include red, brown, lime, and purple soils. The northwest experiences a humid and semi-humid climate, while the central and southern parts have a humid climate. The karst fault basin is characterized by drastic changes in basin–mountain terrain, significant climate variations, low precipitation, high evaporation, deep groundwater levels, and separation of water and soil resources. The late initiation and limited investment in rocky desertification control have led to a series of resource and environmental issues [36]. The eastern Yunnan–Panxi region is part of the national “two screens and three belts”, including 14 contiguous impoverished areas in the country, i.e., the Wumeng Mountain area and the Yunnan–Guizhou–Guangxi rocky desertification area. These areas serve as ecological barriers for the Loess Plateau–Sichuan–Yunnan area and have an impact on the ecological security of important domestic and international rivers, such as the Yangtze River, Pearl River, and Lancang River. Consequently, it is an essential ecological protection area in China [37]. In the early 21st century, the Chinese government implemented various policies and projects, converting farmland into forests, and the collaborative project for preventing and controlling land degradation, the first-stage project for the comprehensive management of rocky desertification and ecological migration. These efforts aimed to address rocky desertification issues and restore vegetation in the karst fault basin. In recent years, with the ongoing progress of vegetation restoration in the area, the carbon sink potential has experienced notable changes [38].
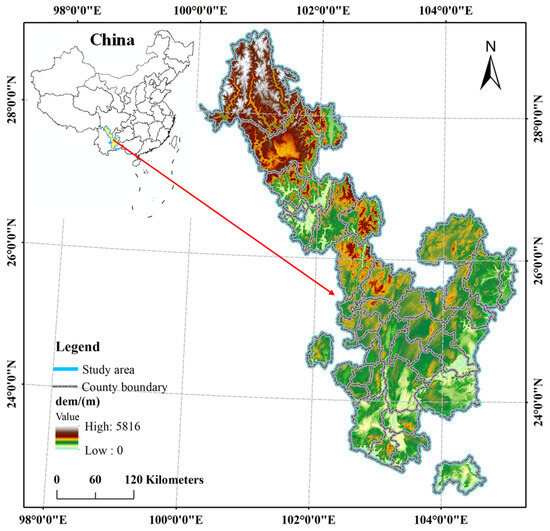
Figure 1.
Research area bitmap.
2.1.2. Data Collection
The 30 m resolution land cover datasets employed in this investigation were acquired from the China Land Cover Dataset, published by Yang and Huang [39] of Wuhan University. The dataset is derived from Landsat and processed by the Google Earth Engine (GEE) cloud computing platform, and the overall accuracy is good. After merging and reclassification by ArcGIS 10.8 software, six first-level land use types were obtained, including cropland, forest, grassland, water, impervious, and barren, with a resolution of 30 m × 30 m. According to the InVEST technical documentation, the carbon module adopts invariant carbon density values during storage estimation, with parameter inputs primarily referenced from established literature. Combined with previous experience, the carbon density data of a typical karst fault basin were selected, and the carbon density tables of different land use types were obtained, as shown in Table 1 [40,41,42].

Table 1.
Carbon density of various types of land use in the karst fault basin (t/hm2).
Changes in land use types result from the combined effects of the physical and chemical properties of each land type, as well as from internal and external factors such as economic, social, and environmental influences. Based on the related types of research, seven driving factors were finally selected. The data sources for population, transportation, nature, and climate driving factors are detailed in the Table 2. Additionally, the natural factor data were accessed on 20 March 2024, while the social factor data were accessed on 2 April 2024. Referring to other related types of research, this study unified the coordinates, the number of rows and columns, and the normalization of land use data and driving factor data to meet the operating requirements of the FLUS model. The data coordinate system is unified as the Krasovsky_1940_Albers projection coordinate system, and the resolution is unified to 270 m.
Table 2.
Other data sources.
2.2. Methodology
2.2.1. InVEST Model
As the most mature ecosystem service evaluation model, the InVEST model can be used to evaluate various ecosystem services such as habitat quality, carbon storage, and water supply [43]. The model used in this work for the study and calculation of carbon storage is the carbon storage sequestration module in the InVEST model. The InVEST carbon storage and sequestration model uses land use maps and stocks of four carbon pools (belowground biomass, aboveground biomass, soil, and dead organic matter) to estimate current carbon stocks in the landscape. The input data comprise land use data and carbon density data corresponding to different land use types. The InVEST model calculates carbon storage by assigning carbon density values to each land use type based on the input data. It then computes the total carbon storage by considering the spatial distribution of each land use type within the study area. The model also accounts for changes in land use over time to estimate the temporal variation in carbon storage [44]. The calculation formula is as follows:
where is the total carbon storage of all land use types (t/hm2); , , , and refer to aboveground carbon storage, underground carbon storage, soil organic carbon storage, and dead organic carbon storage, respectively. refers to aboveground biomass carbon storage, which includes carbon stored in vegetation, such as trees, shrubs, and grasses. represents belowground biomass carbon storage, primarily referring to carbon stored in roots. denotes soil organic carbon storage, which includes carbon stored in the soil matrix and the microbial biomass. accounts for dead organic matter carbon storage, covering litterfall, deadwood, and other decomposing organic material.
2.2.2. FLUS Model
The FLUS model is based on the principle of cellular automata and couples the Markov chain and neural network model to predict future land use [45]. In the prediction, the multiple effects of natural and human factors are taken into account, and the evolution process of multiple types of land can be simulated more accurately. The model consists of two modules: the suitability probability calculation module, based on ANN, and the cellular automata module, based on the adaptive inertia mechanism. Employing Monte Carlo sampling techniques on historical land use configurations and their determinants, the ANN-based module quantifies land type suitability probabilities during the initial modeling phase [45]. Then, it is combined with neighborhood effect, conversion cost, and the inertia coefficient to calculate the total probability of each land use type conversion in each pixel. Finally, the adaptive inertia competition mechanism, based on roulette wheel selection, is used to determine the conversion of land use types and the allocation of land use types in each pixel. The aim is to adaptively adjust the inertia coefficient in the iteration to achieve high-precision land use change simulation.
where represents the inertia coefficient of p-type land use type in period, and represents the difference between the land demand of the -type land use type and the current actual land use quantity.
Regarding the use of the ANN network to obtain land suitability to add driving factors to the module, the driving factors used in this study are detailed in the data source. In the adaptive and competitive mechanism module, the neighborhood factor parameters of each category should be determined. Concerning the law of land transfer in karst fault basins under natural conditions, the following neighborhood factor parameter table is obtained after continuous debugging and verification (Table 3).
Table 3.
Neighborhood factor parameters.
2.2.3. Land Use Transfer Matrix
The land use transfer matrix is commonly applied in land use change studies to identify the directional shifts between different land use types. The formula is as follows:
where represents the area of land use type i transformed into land use type j; n denotes the number of land use types; i and j represent the land use types at the beginning and end of the study, respectively. In this context, indicates the area of land use type i transformed into land use type ; n refers to the total number of land use categories; i and j represent the land use types at the beginning and end of the study period, respectively.
2.2.4. Land Use Scenario Simulation and Its Accuracy Verification
Scenario analysis assumes that a phenomenon can be extended to the future and uses this information to predict future situations and consequences [46]. At present, the difficulty of land use type transformation is usually expressed by a cost matrix, where 0 means that it cannot be transformed, and 1 means that it can be transformed. Corresponding to the land use in three different situations, this study sets up three different conversion cost matrices. Under the natural evolution situation (Q1), the impervious type is not converted to other land types, and other land types can be converted into cropland; in the context of cultivated land protection (Q2), except for impervious, other land types can be converted into cropland. Under the ecological protection situation (Q3), forest, grassland, and water areas are not transformed into other land types, except for impervious surface, other land types can be transformed into forest, cropland, and grassland (Table 4).
Table 4.
Land use cost transfer matrix under each scenario.
The land use data from 2010 were used as the training set to predict the distribution of land use types in 2020 in order to assess the model’s accuracy. Specifically, the accuracy verification module sampled both the predicted land use data for 2020 and the actual land use data to evaluate the model’s performance. The results indicated a Kappa coefficient of 0.80., and the overall accuracy was 86%, indicating that the FLUS model simulation in this study exhibits high accuracy and good credibility, and it can be used.
2.3. Land Use Change from 1985 to 2020
From 1985 to 2020, the predominant land use type in the karst fault basin was forest land, accounting for over 55% of the total area in the region. Cultivated land and grassland ranked second, together constituting the primary land use types in the basin. Throughout the study period, these three land use types collectively occupied more than 95% of the total land area. Land transformation primarily occurred in cultivated land, forest land, and grassland, with construction land exhibiting the highest dynamic degree and undergoing significant changes, notably displaying a continuous expansion trend (Table 5).
Table 5.
Land use change and dynamics in the study area by year.
Over the 35-year period, the total land area increased by 600 km2. Forest land expanded by 1760 km2, followed by a growth of approximately 1400 km2 in cultivated land. Conversely, the grassland area witnessed substantial reduction, decreasing by approximately 4000 km2 during the study period. As shown in Table 6, significant land use transitions occurred between forest, cropland, and grassland during 1985–2000, driven by agricultural expansion, afforestation programs, and land management policies. A net loss of 942.39 km2 of forest resulted from 4553.53 km2 being converted to cropland and 967.99 km2 to grassland, despite 3611.14 km2 of cropland and 2271.45 km2 of grassland transitioning into forest. Meanwhile, grassland experienced a net gain, as 2693.59 km2 of cropland converted to grassland, exceeding the 1501.59 km2 transition from grassland to cropland. These shifts were influenced by population growth, agricultural development, and ecological restoration efforts, which shaped land use dynamics in the region. Analyzing different time periods, it can be seen that land use transitions were more pronounced from 2000 to 2020 compared to during the period from 1985 to 2000 (Figure 2). Notably, a considerable amount of grassland was converted into cultivated land and forest land from 2000 to 2020. In the earlier period (1985–2000), a significant portion of forest land was transformed into cultivated land and grassland, resulting in a reduction in forest land area (Table 7). However, from 2000 to 2020, some grassland and cultivated land were converted into forest land, contributing to an overall upward trend in forest land area during the study period.
Table 6.
Land use transfer matrix of karst fault basins from 1985 to 2000 (km2).
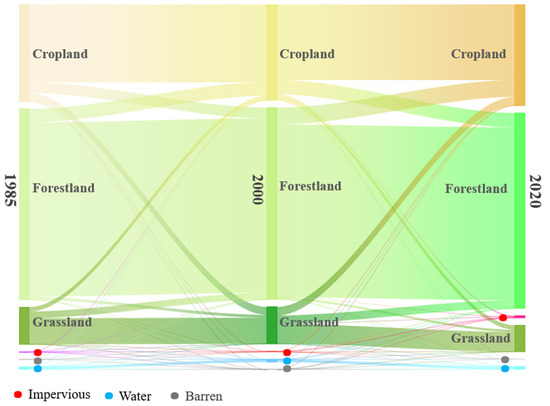
Figure 2.
Land use transfer patterns between different land types in karst fault basins from 1985 to 2020.
Table 7.
Land use transfer matrix of karst fault basins from 2000 to 2020 (km2).
3. Results and Analysis
3.1. Spatiotemporal Variation in Carbon Storage and Its Response to Land Use Change
Using the InVEST model, coupled with carbon density tables and land use data, we calculated the total carbon storage in the karst rift basin from 1985 to 2020. The results indicate values of 1.477 × 10⁹ t, 1.474 × 10⁹ t, 1.472 × 10⁹ t, 1.472 × 10⁹ t, and 1.474 × 10⁹ t in 1985, 1995, 2005, 2015, and 2020, respectively, reflecting a fluctuating downward trend (Figure 3). Over the 35-year study period, the total carbon storage witnessed a decrease of 2.1 × 10⁶ t. Between 1985 and 2005, carbon storage declined by approximately 4.3 × 10⁶ t, with an average annual decrease of 2.1 × 10⁵ t. Contrastingly, from 2005 to 2020, carbon storage increased by 2.2 × 10⁶ t, but with an average annual decrease of 4.3 × 10⁵ t.
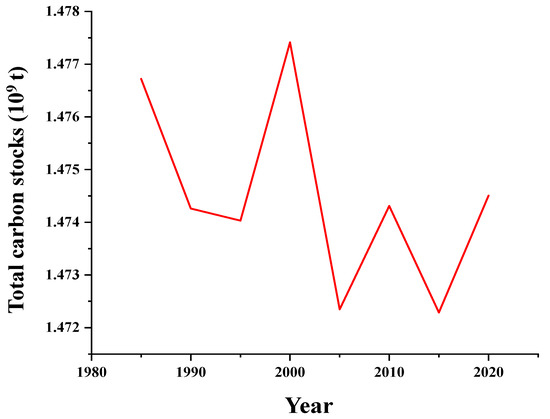
Figure 3.
Changes in total carbon storage in karst fault basins from 1985 to 2020.
The interventions to control rocky desertification in the fault basin were implemented belatedly and received limited investment. National initiatives targeting key rocky desertification control projects were predominantly focused on karst plateaus and wind-clustered depressions, with minimal attention directed towards fault basins. Recent remote sensing data indicates a progressive expansion of severe rocky desertification in the eastern Yunnan–Panxi fault basin, coinciding with a reduction in the ecosystem’s carbon sink capacity. Consequently, the progression of rocky desertification is intricately linked with the evolving pattern of carbon storage.
The carbon storage of various land use types experienced varying degrees of change from 1985 to 2020, with some significant adjustments (Figure 4). The most prominent transformation was observed in grassland, which declined by 4.8 × 10⁷ t over the 35-year study period. This was followed by an increase in forest land carbon storage of approximately 2.6 × 10⁷ t during the same period. Cultivated land exhibited a rise of about 1.5 × 10⁷ t in carbon storage, while carbon storage in construction land increased by approximately 2.6 × 10⁶ t, demonstrating a dramatic shift.
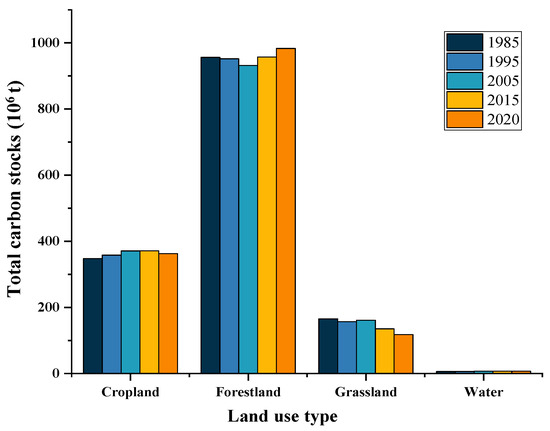
Figure 4.
Main changes in carbon storage by land use type in karst fault basins from 1985 to 2020.
When examining the carbon density of different land use types, it becomes evident that forest land and grassland contribute the most to carbon storage. Over the course of the study period, the conversion of grassland to other land use types resulted in substantial carbon storage losses, acting as the primary driver behind the reduction in carbon storage within the karst fault basin (Figure 5). Vegetation restoration initiatives in the karst region have achieved initial success since the Chinese government began formulating and implementing a comprehensive series of control measures for rocky desertification during the “Tenth Five-Year Plan” period. Nonetheless, the expansion of construction land and cultivated land has exacerbated the loss of carbon storage within the karst fault basin.
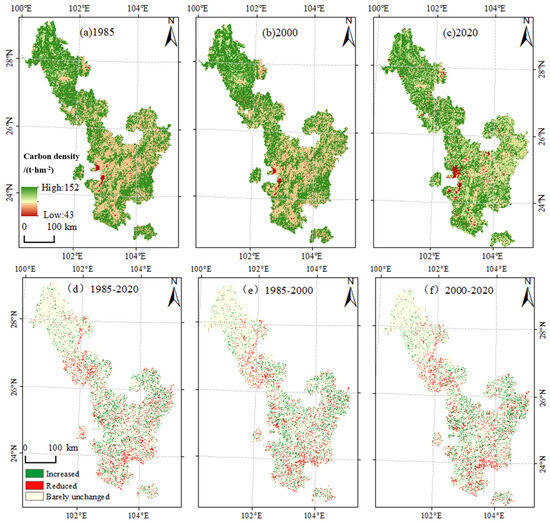
Figure 5.
Carbon density and its change map in the karst fault basin from 1985 to 2020.
To vividly illustrate the spatial distribution patterns of carbon storage throughout the study period, this research employed the reclassification module in ArcGIS to categorize the spatial distribution outcomes of carbon storage output, as estimated by the InVEST model, into three tiers: increased area, barely changed area, and deduced area (Figure 5). The analysis revealed an increase in low-value and middle-to-low-value areas, concurrent with a decline in high-value and middle-to-high-value regions. The carbon storage level in the northern portion of the karst fault basin is comparatively high, with scattered low-carbon storage areas surrounding urban construction land. The high-value and medium-to-high-value regions in the central part of the basin are unevenly distributed. The majority of areas exhibit stable carbon storage levels, while a considerable number of regions display an upward trend for carbon storage. However, a small fraction of areas underwent a loss of carbon storage.
The majority of areas with increased carbon storage are situated in the central portion of the fault basin. This area suffers from a severe rocky desertification disaster, and continuous control measures are implemented alongside fruitful vegetation restoration efforts. In contrast, areas with decreased carbon storage are primarily distributed in the administrative centers of various districts and counties. As urban construction land expands, carbon storage in these areas gradually decreases. The dense river networks further accelerate soil erosion, which, in turn, amplifies the severity of rocky desertification within the basin and leads to a decline in soil carbon storage
3.2. Prediction of Land Use Change and Carbon Storage Under Different Scenarios in 2020–2050
The FLUS model was used to obtain the results of land use types under three different scenarios of natural change, ecological protection, and cultivated land protection in 2050. The natural change scenarios setting comprehensively considers economic development and natural protection and follows the natural evolution law of land use structure. Ecological protection is based on curbing the reduction in carbon storage. In this situation, the carbon storage of the karst fault basin has been effectively protected, and the expansion of construction land has been restricted. The protection of cultivated land restricts its conversion to other land types (Figure 6). When compared to the data for 2020, both the natural evolution scenario (Q1) and the cultivated land protection scenario (Q3) show a moderate increase in the area of cultivated land, with both scenarios seeing a rise of approximately 2700 km2. However, in regards to the ecological protection scenario (Q2), cultivated land area decreased slightly, dropping by around 660 km2. In all three scenarios, the area of forest land expanded, and in the ecological protection scenario, the area of forest land expanded by 1630 km2, indicating that in 2050, the implementation of existing ecological restoration measures can effectively increase vegetation coverage (Figure 7). The area of grassland decreased in all three scenarios. The area of grassland decreased by more than 4000 km2 in the natural evolution scenario (Q1) and the cultivated land protection scenario (Q2), while it decreased by about 1000 km2 in the ecological protection scenario. Under the natural evolution scenario (Q1), the construction land increased significantly, and the expansion area reached 426 km2. Under the ecological protection scenario (Q2), the area of construction land did not change significantly.
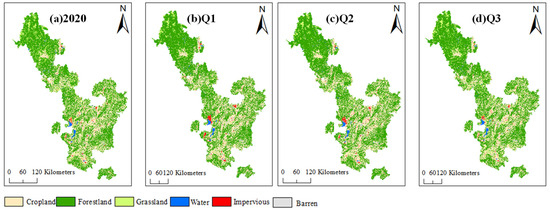
Figure 6.
Comparison of land use across three different scenarios (Q1, Q2, Q3) relative to the 2020 baseline in the karst fault basin.
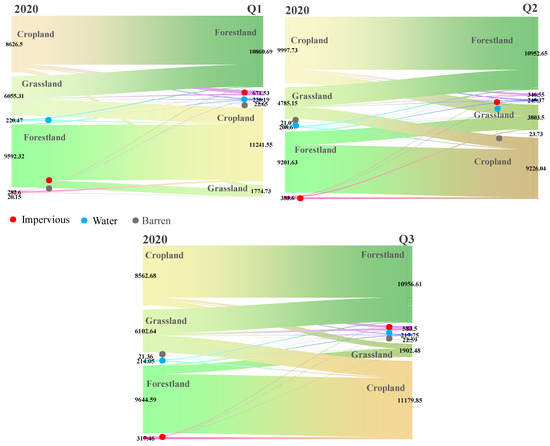
Figure 7.
Land use transfer pattern of the karst fault basin under different scenarios (km2).
The land use type map generated by the FLUS model was utilized to estimate carbon storage through the InVEST model. The changes in carbon stocks in 2050 under each scenario are shown in Figure 8, and the carbon density distribution map of the karst fault basin under different scenarios in 2050 can be seen in Figure 9. In the natural evolution scenario, total carbon storage in the karst fault basin experienced a significant decline, with a reduction of 2.8 × 10⁶ t. In the cultivated land protection scenario, total carbon storage also saw a decrease, with a reduction of 2.0 × 10⁶ t. Conversely, under the ecological protection scenario, total carbon storage increased substantially, rising by 5.7 × 10⁶ t.
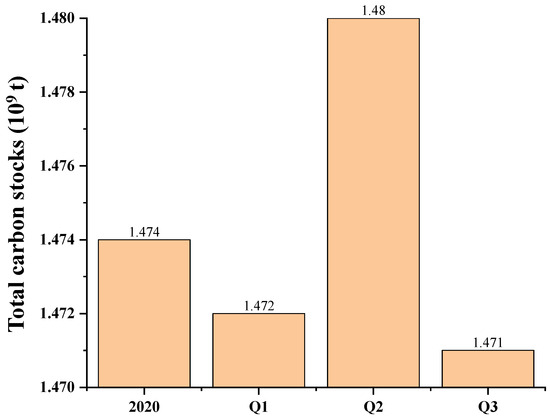
Figure 8.
Changes in carbon stocks in 2050 under each scenario.
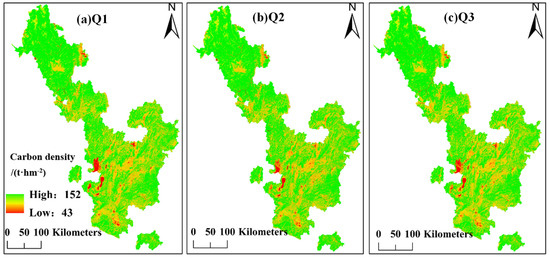
Figure 9.
Carbon density distribution map of the karst fault basin under different scenarios in 2050.
3.3. Spatial Changes of Carbon Density in Three Prediction Scenarios at the County Scale
To provide further clarity on the trend of carbon storage at the county scale, this study utilizes the natural breakpoint method to categorize the changes in carbon storage in the karst fault basin between 1985 and 2020, as well as under three scenarios (Figure 10). The divisions are based on four grades: significantly increased area, partially increased area, partially reduced area, and significantly reduced area. From 1985 to 2020, apart from the central and northern regions of the basin, the carbon reserves in southern Mile County, Jianshui County, Mengzi County, and other areas have significantly decreased, with the severity of rocky desertification showing a strong correlation with carbon reserves. Southern Mengzi County and other areas are representative of the rocky desertification fault basin, experiencing serious degrees of rocky desertification and facing challenges in implementing rocky desertification control measures. The southern basin edge, characterized by higher altitudes and limited human development and construction, exhibits a certain association with the economic development level of the region. Unlike the highly developed urban areas in the economically prosperous coastal regions, these areas exhibit relatively larger expanses of construction land. Most of the karst fault basin areas belong to China’s “old, less, edge, and poor” regions, where economic development is relatively weak. Consequently, urban development is limited, and more forest land is preserved, allowing for easier implementation of recovery measures and the achievement of positive results.
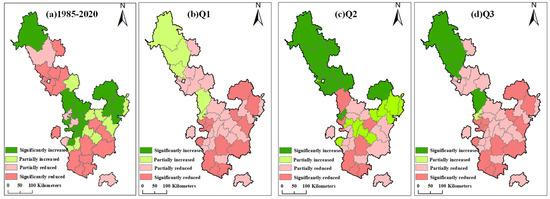
Figure 10.
Changes in carbon storage at the county level in the karst fault basin under three different scenarios.
Under different prediction scenarios, the changing trend of carbon storage varies significantly in each county. Under the natural evolution scenario, the carbon storage in only five districts and counties, namely Muli Tibetan Autonomous County, Yanyuan County, and Yanbian County in the Northern Region, increased, while other counties and cities are predicted to experience varying degrees of reduction. This indicates the vulnerability of the ecosystem in many areas, where natural processes alone are insufficient to enhance carbon sequestration. Under the ecological protection scenario, the carbon storage in the northern and eastern central parts of the entire fault basin shows an increase, but the southern counties still maintain a downward trend. In the context of cultivated land protection, the change in carbon storage follows a similar pattern to that in the natural evolution scenario. Apart from the southern and central counties, the carbon storage in other counties will demonstrate a downward trend. These findings emphasize the importance of ecological protection and land management strategies in fostering carbon sequestration, particularly in fragile ecosystems.
4. Discussions
4.1. Carbon Sequestration Potential Analysis of Karst Fault Basin
Assessing ecosystem carbon storage in the karst fault basin through land use change and carbon density change provides valuable data for estimating the carbon sink potential and informing land space planning and regional ecological security under dual carbon targets. Over the 35-year study period from 1985 to 2020, the carbon storage in the karst fault basin underwent significant changes. The increase or decrease in carbon storage is strongly correlated with the decrease in high-carbon density land use types and the increase in low-density land use types. The karst fault basin has experienced backward economic development. In the late 20th century, extensive deforestation and grassland reclamation led to the conversion of forest land and grassland into cultivated land. This shift increased the proportion of low-carbon density land types and resulted in a reduction in carbon storage. In the early 21st century, there was a noticeable expansion of construction land area. Simultaneously, the rocky desertification control project was gradually implemented and achieved initial success. This has led to a significant increase in vegetation coverage in the entire southwest region and a rebound in carbon storage contributed by forest land. These findings highlight the dynamic nature of carbon storage in the karst fault basin and the influence of land use changes on carbon density. They emphasize the importance of implementing sustainable land management practices to maintain and enhance carbon storage potential in karst rift basins. Additionally, these findings underscore the need for balanced land use planning that considers both economic development and ecological conservation goals in order to achieve regional ecological security and contribute to dual carbon targets. This is consistent with the study of carbon storage and the vegetation change law in a typical karst area, i.e., Nanbei Panjiang River Basin, by Luo et al. [47].
4.2. Implications of Carbon Storage Results Under Different Scenarios for Future Planning
By 2050, the carbon storage in the karst fault basin is projected to decrease under the natural evolution and cultivated land protection scenarios, while it is expected to increase under the ecological protection scenario. The decrease in carbon storage under the natural evolution and cultivated land protection scenarios indicates that these situations are not favorable for improving the ecosystem’s capacity for carbon services in the karst fault basin. It also suggests that the region’s carbon sink capacity may not be fully utilized. It is important to note that in the context of cultivated land protection, the scenario setting aims to expand the area of cultivated land by converting other land types, such as forest land and grassland. This approach may neglect ecological protection and resource utilization limitations, resulting in a decrease in carbon storage. Therefore, it is crucial to strike a balance between ecological protection and cultivated land protection, with ecological priorities remaining the primary focus in territorial spatial planning in the area. Under the ecological protection scenario, the area of forest land increases, the decreasing trend of grassland area decreases, and the total carbon storage significantly increases. This indicates that further implementation of ecological environmental protection measures in the karst fault basin can effectively promote ecological restoration and enhance the ecosystem’s carbon sequestration capacity. Therefore, future territorial spatial planning should prioritize ecological protection strategies to optimize carbon storage and achieve regional coordinated green development.
Additionally, it is important to consider that the karst fault basin covers a large area, and each county within it displays different economic development levels and natural conditions. Muli Tibetan Autonomous County in the southern part of the basin exhibits extensive vegetation coverage and plays a role as a “carbon sink” under all three prediction scenarios during the 35-year study period. On the other hand, Jianshui County, Mengzi County, and Luxi County in the eastern part of the basin, which is severely affected by rocky desertification, are projected to experience a decrease in carbon reserves by 2050. Therefore, monitoring, as well as refined ecological and environmental protection policies, should be strengthened in areas where carbon storage is prone to loss, and the management of land use structure should be optimized.
In conclusion, the future of the karst fault basin lies in implementing ecological protection strategies, monitoring areas at risk of carbon storage loss, and optimizing land use management to achieve regional coordinated green development.
4.3. Limitations of This Study
Due to its simplicity and flexibility, the InVEST model is commonly employed in ecosystem service modeling. However, it also has some limitations. Firstly, the data acquisition for carbon density mostly relies on a small number of regions investigated in the previous literature, and different scholars may present significant differences in the selected indicators for the same region. This can lead to uncertainties in regards to carbon density estimation. Additionally, the model assumes a uniform carbon density across the land use types, which remains constant over time. However, in reality, carbon density can vary over longer periods. Therefore, future research should focus on the dynamic measurement of carbon density to verify its temporal rationality.
Regarding the FLUS model, its uncertainty primarily arises from two aspects: uncertainty analysis of land use prediction and uncertainty analysis of carbon storage prediction. The latter is mainly due to inherent limitations of the InVEST model, while the uncertainty of land use prediction has been improved in this study through the coupling of the Markov module and the FLUS model. This combined approach can provide insights for future land use adjustments in the study area and help reduce uncertainties.
In summary, while the InVEST model and FLUS model each have their limitations, they can still provide valuable information for carbon storage estimation and land use planning. Future research should focus on addressing the uncertainties associated with data acquisition and temporal variations in carbon density and on improving the accuracy of land use predictions to enhance the reliability of the models.
5. Conclusions
In this study, the coupled InVEST and FLUS models were used to calculate the spatial and temporal changes in carbon storage in the karst fault basin from 1985 to 2020. Based on this, changes under three different scenarios in the study area in 2050 were predicted. The following conclusions were drawn:
- (1)
- From 1985 to 2020, carbon storage in the karst fault basin exhibited a fluctuating downward trend. This was primarily due to an increase in carbon storage in construction land and cultivated land and a decrease in carbon storage in grassland. The central part of the karst fault basin experienced significant carbon storage loss, while the carbon density in the marginal areas was relatively high.
- (2)
- Cultivated land, forest land, and grassland remained the most important land use types in the karst fault basin under the three scenarios. Nevertheless, there was a considerable reduction in grassland area, coupled with the growth of construction and cultivated lands. Across the three scenarios carbon storage in the ecological protection state showed a significant increase, while carbon storage under the cultivated land protection and natural evolution scenarios decreased. Notably, under the natural evolution scenario, the expansion of construction land area was 426 km2, representing a 53.6% increase. This expansion resulted in a carbon loss of 2.8 × 10⁶ t.
- (3)
- Based on the predictions under the three scenarios, it is crucial to continue implementing ecological protection in the study area and combine cultivated land protection with ecological measures to enhance the carbon sink capacity of the karst area. Additionally, efforts to inhibit grassland degradation and implement hierarchical control at the county level, along with refined ecological restoration measures, are necessary. Failure to do so may significantly reduce the carbon sink potential of the area and transform the karst fault basin into a carbon source, hindering the achievement of China’s carbon peaking and carbon neutrality goals.
Overall, these results highlight the critical role of sustainable land management and ecological restoration efforts in boosting carbon sequestration and reducing carbon emissions in the karst fault basin.
Author Contributions
J.Z. came up with the framework for the article and wrote the first draft of the paper; R.T. processed the data to construct the model; W.L. proposed ideas and revised the paper; G.Z. assisted in processing the data; X.H. organized the paper comments; Y.G. worked with Y.Z. to create the illustrations; and Y.Y. perfected the graphs and charts. All authors have read and agreed to the published version of the manuscript.
Funding
This work was partially supported by the National Natural Science Foundation of China (Grant No: 52209028).
Institutional Review Board Statement
Not applicable.
Informed Consent Statement
Not applicable.
Data Availability Statement
The datasets generated and/or analyzed during the current study are not publicly available due to obligations to the data provider but are available from the corresponding author upon reasonable request.
Acknowledgments
We are grateful to Guan Yinghui of the School of Water Conservation, Beijing Forestry University, for her valuable comments during the creation of this thesis, which have greatly aided the production of this paper.
Conflicts of Interest
Authors Jiabin Zhang and Guobao Zhang are employed by PowerChina Beijing Engineering Corporation Limited. Author Ying Zhou is employed by Beijing Guan Hua Ying Cai International Economics & Technology Corporation Limited. The remaining authors declare that the research was conducted in the absence of any commercial or financial relationships that could be construed as a potential conflict of interest.
References
- Lu, F.; Hu, H.F.; Sun, W.J.; Zhu, J.J.; Liu, G.B.; Zhou, W.M.; Zhang, Q.F.; Shi, P.L.; Liu, X.P.; Wu, X.; et al. Effects of national ecological restoration projects on carbon sequestration in China from 2001 to 2010. Proc. Natl. Acad. Sci. USA 2018, 115, 4039–4044. [Google Scholar] [CrossRef]
- Zhu, L.; Song, R.; Sun, S.; Li, Y.; Hu, K. Land use/land cover change and its impact on ecosystem carbon storage in coastal areas of China from 1980 to 2050. Ecol. Indic. 2022, 142, 109178. [Google Scholar] [CrossRef]
- Lambin, E.F.; Turner, B.L.; Geist, H.J.; Agbola, S.B.; Angelsen, A.; Bruce, J.W.; Coomes, O.T.; Dirzo, R.; Fischer, G.; Folke, C.; et al. The causes of land-use and land-cover change: Moving beyond the myths. Glob. Environ. Change-Hum. Policy Dimens. 2001, 11, 261–269. [Google Scholar] [CrossRef]
- Houghton, R.A. Revised estimates of the annual net flux of carbon to the atmosphere from changes in land use and land management 1850-2000. Tellus Ser. B-Chem. Phys. Meteorol. 2003, 55, 378–390. [Google Scholar]
- Lai, L.; Huang, X.; Yang, H.; Chuai, X.; Zhang, M.; Zhong, T.; Chen, Z.; Chen, Y.; Wang, X.; Thompson, J.R. Carbon emissions from land-use change and management in China between 1990 and 2010. Sci. Adv. 2016, 2, e1601063. [Google Scholar] [CrossRef]
- Lawler, J.J.; Lewis, D.J.; Nelson, E.; Plantinga, A.J.; Polasky, S.; Withey, J.C.; Helmers, D.P.; Martinuzzi, S.; Pennington, D.; Radeloff, V.C. Projected land-use change impacts on ecosystem services in the United States. Proc. Natl. Acad. Sci. USA 2014, 111, 7492–7497. [Google Scholar] [CrossRef]
- Kondo, M.; Ichii, K.; Patra, P.K.; Canadell, J.G.; Poulter, B.; Sitch, S.; Calle, L.; Liu, Y.Y.; van Dijk, A.I.J.M.; Saeki, T.; et al. Land use change and el nino-southern oscillation drive decadal carbon balance shifts in southeast Asia. Nat. Commun. 2018, 9, 1154. [Google Scholar] [CrossRef]
- Jiang, W.; Deng, Y.; Tang, Z.; Lei, X.; Chen, Z. Modelling the potential impacts of urban ecosystem changes on carbon storage under different scenarios by linking the clues and the invest models. Ecol. Model. 2017, 345, 30–40. [Google Scholar] [CrossRef]
- Phang, V.X.H.; Chou, L.M.; Friess, D.A. Ecosystem carbon stocks across a tropical intertidal habitat mosaic of mangrove forest, seagrass meadow, mudflat and sandbar. Earth Surf. Process. Landf. 2015, 40, 1387–1400. [Google Scholar] [CrossRef]
- Xu, Z.; Fan, W.; Wei, H.; Zhang, P.; Ren, J.; Gao, Z.; Ulgiati, S.; Kong, W.; Dong, X. Evaluation and simulation of the impact of land use change on ecosystem services based on a carbon flow model: A case study of the manas river basin of Xinjiang, China. Sci. Total Environ. 2019, 652, 117–133. [Google Scholar] [CrossRef]
- Zhang, M.; Huang, X.; Chuai, X.; Yang, H.; Lai, L.; Tan, J. Impact of land use type conversion on carbon storage in terrestrial ecosystems of China: A spatial-temporal perspective. Sci. Rep. 2015, 5, 10233. [Google Scholar] [CrossRef]
- Fu, Q.; Li, B.; Hou, Y.; Bi, X.; Zhang, X.S. Effects of land use and climate change on ecosystem services in central asia’s arid regions: A case study in altay prefecture, China. Sci. Total Environ. 2017, 607, 633–646. [Google Scholar] [CrossRef]
- Nelson, E.; Sander, H.; Hawthorne, P.; Conte, M.; Ennaanay, D.; Wolny, S.; Manson, S.; Polasky, S. Projecting global land-use change and its effect on ecosystem service provision and biodiversity with simple models. PLoS ONE 2010, 5, e14327. [Google Scholar] [CrossRef] [PubMed]
- Li, K.; Cao, J.; Adamowski, J.F.; Biswas, A.; Zhou, J.; Liu, Y.; Zhang, Y.; Liu, C.; Dong, X.; Qin, Y. Assessing the effects of ecological engineering on spatiotemporal dynamics of carbon storage from 2000 to 2016 in the loess plateau area using the invest model: A case study in Huining county, China. Environ. Dev. 2021, 39, 100641. [Google Scholar] [CrossRef]
- Babbar, D.; Areendran, G.; Sahana, M.; Sarma, K.; Raj, K.; Sivadas, A. Assessment and prediction of carbon sequestration using markov chain and invest model in Sariska tiger reserve, India. J. Clean. Prod. 2021, 278, 123333. [Google Scholar] [CrossRef]
- Lin, T.; Wu, D.F.; Yang, M.Z.; Ma, P.F.; Liu, Y.Y.; Liu, F.; Gan, Z.Y. Evolution and simulation of terrestrial ecosystem carbon storage and sustainability assessment in karst areas: A case study of Guizhou province. Int. J. Environ. Res. Public Health 2022, 19, 16219. [Google Scholar] [CrossRef] [PubMed]
- Hoque, M.Z.; Cui, S.H.; Islam, I.; Xu, L.L.; Ding, S.P. Dynamics of plantation forest development and ecosystem carbon storage change in coastal Bangladesh. Ecol. Indic. 2021, 130, 107954. [Google Scholar] [CrossRef]
- Anputhas, M.; Janmaat, J.A.; Nichol, C.F.; Wei, X. Modelling spatial association in pattern based land use simulation models. J. Environ. Manag. 2016, 181, 465–476. [Google Scholar] [CrossRef]
- Piyathilake, I.D.U.H.; Udayakumara, E.P.N.; Ranaweera, L.V.; Gunatilake, S.K. Modeling predictive assessment of carbon storage using invest model in uva province, Sri Lanka. Model. Earth Syst. Environ. 2022, 8, 2213–2223. [Google Scholar] [CrossRef]
- Fu, F.; Deng, S.; Wu, D.; Liu, W.; Bai, Z. Research on the spatiotemporal evolution of land use landscape pattern in a county area based on ca-markov model. Sustain. Cities Soc. 2022, 80, 103760. [Google Scholar] [CrossRef]
- Huang, D.; Huang, J.; Liu, T. Delimiting urban growth boundaries using the clue-s model with village administrative boundaries. Land Use Policy 2019, 82, 422–435. [Google Scholar] [CrossRef]
- Zhou, L.; Dang, X.; Sun, Q.; Wang, S. Multi-scenario simulation of urban land change in shanghai by random forest and ca-markov model. Sustain. Cities Soc. 2020, 55, 102045. [Google Scholar] [CrossRef]
- Lin, X.; Jiao, X.; Tian, Z.Q.; Sun, Q.Q.; Zhang, Y.X.; Zhang, P.; Ji, Z.X.; Chen, L.; Lun, F.; Chang, X.; et al. Projecting diversity conflicts of future land system pathways in China under anthropogenic and climate forcing. Earths Future 2023, 11, e2022EF003406. [Google Scholar] [CrossRef]
- Zhao, M.M.; He, Z.B.; Du, J.; Chen, L.F.; Lin, P.F.; Fang, S. Assessing the effects of ecological engineering on carbon storage by linking the ca-markov and invest models. Ecol. Indic. 2019, 98, 29–38. [Google Scholar] [CrossRef]
- Liu, X.; Liang, X.; Li, X.; Xu, X.; Ou, J.; Chen, Y.; Li, S.; Wang, S.; Pei, F. A future land use simulation model (flus) for simulating multiple land use scenarios by coupling human and natural effects. Landsc. Urban Plan. 2017, 168, 94–116. [Google Scholar] [CrossRef]
- Li, Y.; Liu, Z.; Li, S.; Li, X. Multi-scenario simulation analysis of land use and carbon storage changes in Changchun city based on flus and invest model. Land 2022, 11, 647. [Google Scholar] [CrossRef]
- Jiang, Z.C.; Lian, Y.Q.; Qin, X.Q. Rocky desertification in southwest China: Impacts, causes, and restoration. Earth-Sci. Rev. 2014, 132, 1–12. [Google Scholar] [CrossRef]
- Tang, X.G.; Xiao, J.F.; Ma, M.G.; Yang, H.; Li, X.; Ding, Z.; Yu, P.J.; Zhang, Y.G.; Wu, C.Y.; Huang, J.; et al. Satellite evidence for China’s leading role in restoring vegetation productivity over global karst ecosystems. For. Ecol. Manag. 2022, 507, 120000. [Google Scholar] [CrossRef]
- Chen, L.; Tan, L.; Zhao, M.; Sinha, A.; Wang, T.; Gao, Y. Karst carbon sink processes and effects: A review. Quat. Int. 2023, 652, 63–73. [Google Scholar] [CrossRef]
- Jiang, Z.; Lian, Y.; Qin, X. Carbon cycle in the epikarst systems and its ecological effects in south China. Environ. Earth Sci. 2013, 68, 151–158. [Google Scholar] [CrossRef]
- Wang, S.; Liu, Z.; Ni, J.; Yan, J.; Liu, X. A review of research progress and future prospective of carbon cycle in karst area of south China. Earth Environ. 2017, 45, 2–9. [Google Scholar]
- Yan, J.; Wang, Y.P.; Zhou, G.; Li, S.; Yu, G.; Li, K. Carbon uptake by karsts in the Houzhai Basin, southwest China. J. Geophys. Res.-Biogeosci. 2011, 116, G04012. [Google Scholar] [CrossRef]
- Zhang, W.; Wang, W.; Zhong, J.; Chen, S.; Yi, Y.; Xu, X.; Chen, S.; Li, S.-L. Carbon sequestration and decreased CO2 emission caused by biological carbon pump effect: Insights from diel hydrochemical variations in subtropical karst reservoirs. J. Hydrol. 2024, 632, 130909. [Google Scholar] [CrossRef]
- Song, X.; Gao, Y.; Wen, X.; Guo, D.; Yu, G.; He, N.; Zhang, J. Carbon sequestration potential and its eco-service function in the karst area, China. J. Geogr. Sci. 2017, 27, 967–980. [Google Scholar] [CrossRef]
- Gong, W.; Duan, X.; Mao, M.; Hu, J.; Sun, Y.; Wu, G.; Zhang, Y.; Xie, Y.; Qiu, X.; Rao, X.; et al. Assessing the impact of land use and changes in land cover related to carbon storage by linking trajectory analysis and invest models in the nandu river basin on Hainan island in China. Front. Environ. Sci. 2022, 10, 1038752. [Google Scholar] [CrossRef]
- Ni, J.; Luo, D.H.; Xia, J.; Zhang, Z.H.; Hu, G. Vegetation in karst terrain of southwestern China allocates more biomass to roots. Solid Earth 2015, 6, 799–810. [Google Scholar] [CrossRef]
- Huang, Q.H.; Cai, Y.L.; Xing, X.S. Rocky desertification, antidesertification, and sustainable development in the karst mountain region of southwest China. Ambio 2008, 37, 390–392. [Google Scholar] [CrossRef]
- Zhang, J.; Liu, M.L.; Liu, X.N.; Luo, W.Q.; Wu, L.; Zhu, L.H. Spectral analysis of seasonal rock and vegetation changes for detecting karst rocky desertification in southwest China. Int. J. Appl. Earth Obs. Geoinf. 2021, 100, 102337. [Google Scholar] [CrossRef]
- Yang, J.; Huang, X. The 30 m annual land cover dataset and its dynamics in China from 1990 to 2019. Earth Syst. Sci. Data 2021, 13, 3907–3925. [Google Scholar] [CrossRef]
- Li, Y.; Geng, H. Spatiotemporal trends in ecosystem carbon stock evolution and quantitative attribution in a karst watershed in southwest China. Ecol. Indic. 2023, 153, 110429. [Google Scholar] [CrossRef]
- Liu, C.; Liu, Y.; Guo, K.; Wang, S.; Liu, H.; Zhao, H.; Qiao, X.; Hou, D.; Li, S. Aboveground carbon stock, allocation and sequestration potential during vegetation recovery in the karst region of southwestern China: A case study at a watershed scale. Agric. Ecosyst. Environ. 2016, 235, 91–100. [Google Scholar] [CrossRef]
- Wang, M.; Chen, H.; Zhang, W.; Wang, K. Soil organic carbon stock and its changes in a typical karst area from 1983 to 2015. J. Soils Sediments 2021, 21, 42–51. [Google Scholar] [CrossRef]
- Fang, Z.; Ding, T.; Chen, J.; Xue, S.; Zhou, Q.; Wang, Y.; Wang, Y.; Huang, Z.; Yang, S. Impacts of land use/land cover changes on ecosystem services in ecologically fragile regions. Sci. Total Environ. 2022, 831, 154967. [Google Scholar] [CrossRef] [PubMed]
- Wu, X.; Shen, C.; Shi, L.; Wan, Y.; Ding, J.; Wen, Q. Spatio-temporal evolution characteristics and simulation prediction of carbon storage: A case study in Sanjiangyuan area, China. Ecol. Inform. 2024, 80, 102485. [Google Scholar] [CrossRef]
- Li, X.; Chen, G.; Liu, X.; Liang, X.; Wang, S.; Chen, Y.; Pei, F.; Xu, X. A new global land-use and land-cover change product at a 1-km resolution for 2010 to 2100 based on human-environment interactions. Ann. Am. Assoc. Geogr. 2017, 107, 1040–1059. [Google Scholar] [CrossRef]
- Xu, H.; Song, Y.; Tian, Y. Simulation of land-use pattern evolution in hilly mountainous areas of north China: A case study in Jincheng. Land Use Policy 2022, 112, 105826. [Google Scholar] [CrossRef]
- Luo, D.; Zhou, Z.; Chen, Q.; Zhang, L.; Wu, L.; Wu, T. Responses of carbon storage to land use pattern in karst area: A case study of Nanbei panjiang river basin. Acta Ecol. Sin. 2023, 43, 3500–3516. [Google Scholar]
Disclaimer/Publisher’s Note: The statements, opinions and data contained in all publications are solely those of the individual author(s) and contributor(s) and not of MDPI and/or the editor(s). MDPI and/or the editor(s) disclaim responsibility for any injury to people or property resulting from any ideas, methods, instructions or products referred to in the content. |
© 2025 by the authors. Licensee MDPI, Basel, Switzerland. This article is an open access article distributed under the terms and conditions of the Creative Commons Attribution (CC BY) license (https://creativecommons.org/licenses/by/4.0/).