Article

The Impact of Rural E-Commerce on Farmers’ Income Gap: Implications for Farmers’ Sustainable Development

1
School of Economics and Management, Jiangxi Agricultural University, Nanchang 330045, China
2
Research Center for the Three Rural Issues, Jiangxi Agricultural University, Nanchang 330045, China
3
South China Institute of Innovative Finance, Guangdong University of Finance, Guangzhou 510521, China
*
Authors to whom correspondence should be addressed.
Sustainability 2025, 17(9), 3921; https://doi.org/10.3390/su17093921
Submission received: 2 April 2025 / Revised: 23 April 2025 / Accepted: 24 April 2025 / Published: 26 April 2025
(This article belongs to the Special Issue Rural Economy and Sustainable Community Development)

Abstract

:
Income inequality impedes rural economic development. As the digital economy advances, e-commerce (EC) offers a novel solution to reduce rural income inequality. Based on the framework of the equality of opportunity theory, this research utilizes data from China Rural Revitalization Survey, using the RIF model and mediation effect model to investigate the influence and mechanisms of e-commerce operations (EOs) on the farmers’ income gap (FIG), while also analyzing the heterogeneity of EO’s effects on the FIG. Consequently, the impact of the varying scales and modes of EOs on the FIG is further examined. The findings indicate that EO can substantially diminish the FIG, as corroborated by robustness and endogeneity tests. The findings of the intermediate effect indicate that EO diminishes the FIG by reducing the disparity in labor endowment. The heterogeneity study results indicated that EOs are more effective in reducing the FIG in western China, major grain-producing areas, and mountainous areas. Further discussion reveals a stronger reduction effect of large-scale and platform EC. This study provides micro-level evidence that the digital economy empowers farmers for sustainable development and prosperity. The government should improve rural EC support and create a mechanism for disadvantaged rural populations. To reduce EC development discrepancies and promote farmer equity, specific assistance programs for undeveloped regions are needed. Local governments can also strengthen skill training programs for farmers, especially low-income ones, to boost labor skills. Finally, they can assist rural EC’s transformation to large scale and flat, maximize its role in employment, and narrow the FIG.

1. Introduction

For a long time, poverty and income inequality have hindered sustainable global economic and social development. After eliminating absolute poverty, China has set easing income inequality and achieving common prosperity as part of its next stage of development goals. And rural areas are the most arduous key to achieving this goal. Household differentiation, rural labor migration, and regional development imbalances have exacerbated the rural income gap [1,2]. The per capita disposable income of low-income families and high-income families in rural China will be CNY 5264 and CNY 50,136, respectively, with a ratio of 1:9.52, which is compared to 1:6.47, as the income gap has been widening, and the Gini coefficient of rural residents’ income has increased from 0.333 in 2003 to 0.365 in 2023 (data source: National Bureau of Statistics of the People’s Republic of China), showing a trend of growth. The increasing income gap will result in numerous adverse effects, including diminished happiness, worsening health conditions, consumption constraints, class stratification, and other issues [3]. These effects hinder the construction of rural rejuvenation and rural modernization. Therefore, how to narrow the FIG and form a new pattern of reasonable and orderly income distribution has emerged as a critical issue that needs to be addressed to foster sustainable rural development.
As information technology penetrates rural areas, the EC is emerging as a new catalyst for sustainable development in rural areas [4]. EC is a typical approach to transform the traditional real economy by digital technology and form an integrated rural industry support system by combining Internet resources with traditional rural elements. 
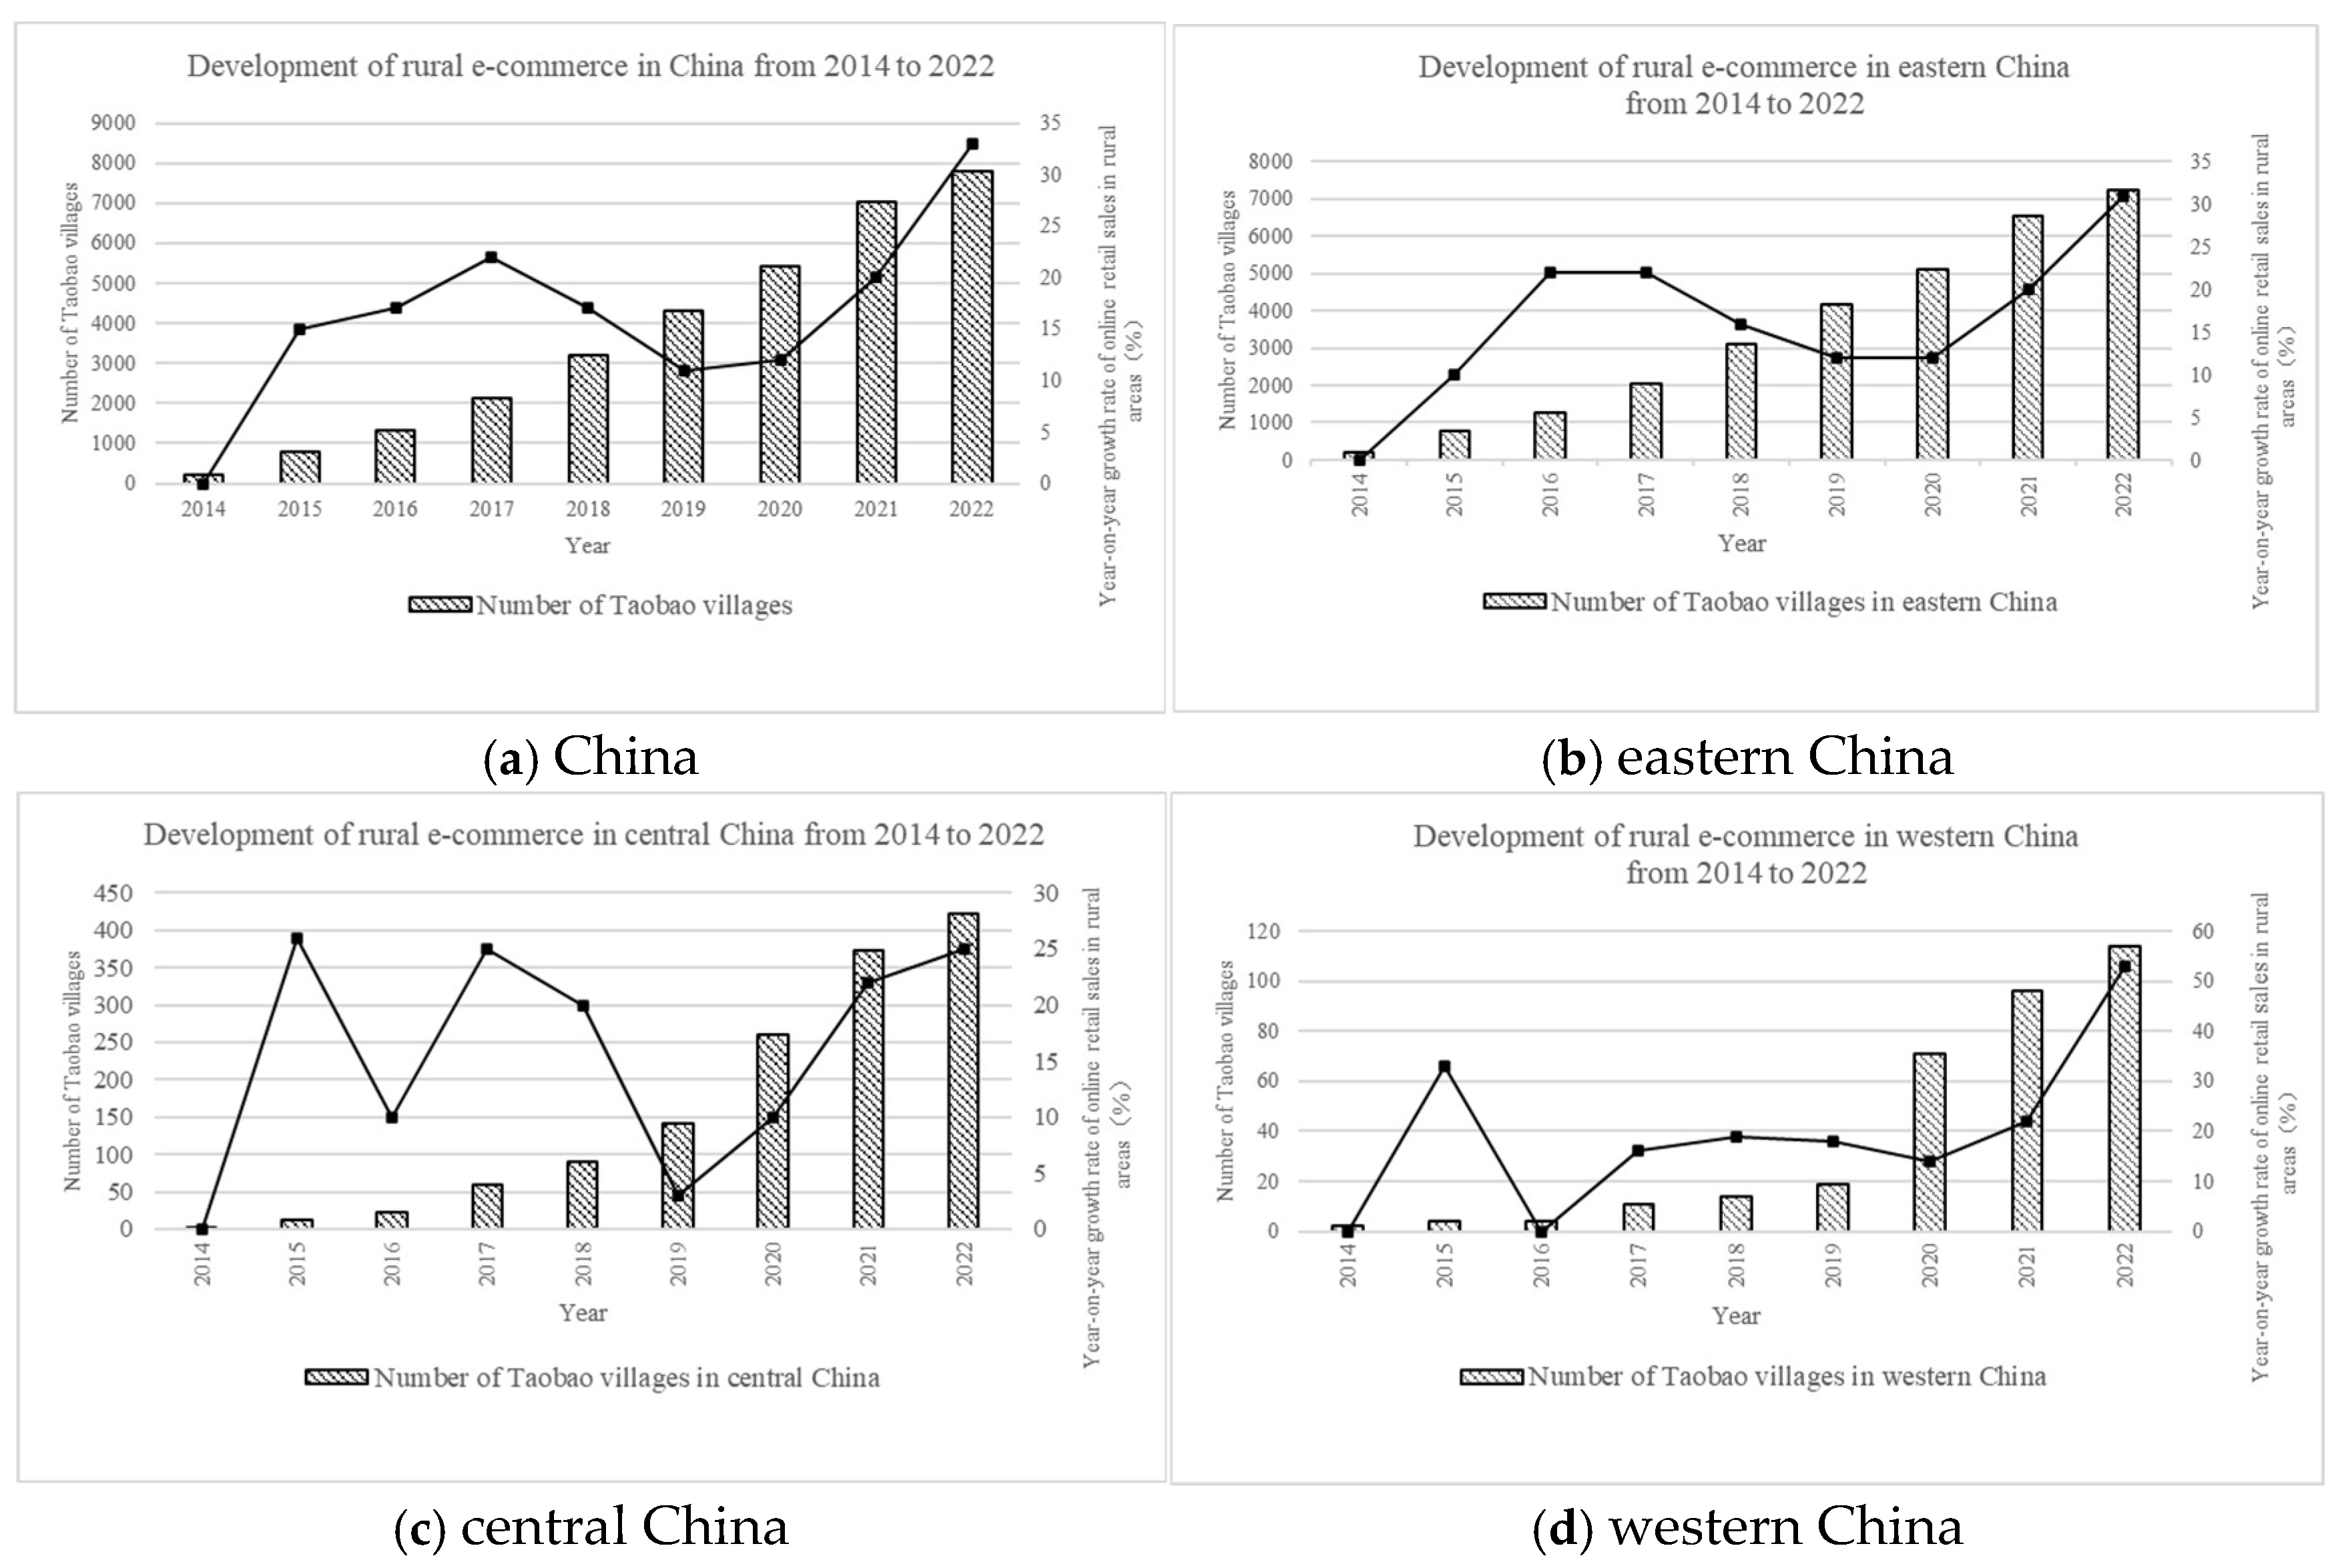
Figure 1 shows the overall growth trend of Taobao villages and sales. EC reduces disparities in information, enables low-income populations to connect to enormous markets, introduces employment and business opportunities, and boosts income [5].
More and more scholars are paying attention to the income effect of EC, with a particular focus on two core issues: income effects and income distribution. The current study predominantly investigates (1) the influence of EC on farmers’ income and (2) its contribution to urban–rural income inequalities. Scholars generally recognize the role of EC in increasing farmers’ income and believe that EC can increase farmers’ operating income and wage income. EC using information technology offers farmers efficient means to access product markets, enabling them to acquire timely market information, enhance product distribution channels, and alter their previous disadvantageous status as price recipients [6]. EC can improve bargaining power by shortening transaction links and costs [7], thereby augmenting operational income [8,9]. It also enables farmers’ seamless access to factor markets, serving as a crucial conduit for enhancing farmers’ revenue development [10]. For example, Qiu et al. [11] pointed out that the Internet technology used in EC can effectively break the information asymmetry, improve the transaction efficiency of farmers, alleviate the financing constraints of farmers, and improve the operating income of farmers regarding three aspects: improving the convenience of information acquisition, reducing the cost of EO, and improving financial services. Meanwhile, the development of EC can provide many job opportunities, as well as increase farmers’ wage income [12,13,14]. Specifically, the development of EC requires and can lead to the development of supporting industries, such as processing, logistics, and other related industries [15], which creates more jobs for farmers and increases their wage income [16]. In addition, current research indicates that EC exhibits three correlations with the urban–rural income disparity: “widening gap”, “narrowing gap”, and “inverted U-shaped relationship”, which have yet to yield a definitive result [17]. Certain scholars contend that the “digital divide” results in urban areas possessing more comprehensive digital infrastructure and social environments than rural regions, facilitating access to the benefits of EC and consequently exacerbating the urban–rural income disparity [18]. When it comes to the digital divide, Bowen and Morris [19] find that farmers and rural farms not only lack access to information technology, but also lack digital literacy and the ability to use it, which makes it difficult for farmers to grasp the dividends brought by EC, and the gap between farmers and urban residents is widening. Some experts contend that the extensive dissemination of digital technology and the ongoing policy investments have effectively bridged the “digital divide”. Moreover, several experts contend that the influence of EC development on the urban–rural income disparity is non-linear. Initially, urban inhabitants have had larger advantages; however, as the development of EC occurs, rural inhabitants will also obtain benefits, with an inverted U-shaped influence trend [20]. Li et al. [21] explained that the EC elements are initially concentrated in cities, which leads to the widening of the digital divide between urban and rural areas and the widening of the income gap. After the development of cities matures, the feedback effect on rural areas will be formed through factor spillover, market expansion, and policy guidance, and the income gap between urban and rural areas will be narrowed.
It can be seen that, firstly, most of the existing studies on the discussion and measurement of rural EC focus on the macro level, that is, the impact of EC policies, and the research results have been relatively perfect. Second, when discussing income inequality and income disparity, most of the existing studies focus on the problem of urban–rural income disparity, but the widening FIG is also a major obstacle to alleviating relative poverty and improving people’s happiness, which has a relatively broad space for exploration and high exploration value. Therefore, this paper chooses to observe the individual EO behavior of farmers from a micro perspective, and the overall goal of the research is to investigate the impact of EOs on the FIG, and the specific content is carried out around three issues. First of all, can EO narrow the FIG, and if so, what is the impact mechanism? Secondly, is there any difference in the impact of EO on the FIG under different geographical locations, different agricultural functional zones, and different terrain conditions? Finally, is there any difference in the impact of different EO scales and types on the FIG?
The marginal contributions of this study are as follows: First, the economic effect of EC is observed by using micro-individual variables. Compared with macro policies, which can reflect more overall economic activities, micro-behavior variables are more in-depth, which allows them to not only explore the economic effects of EO behaviors but also examine the differences in economic effects brought on by different models of EO behaviors, which are organically complementary to macro policy research and have targeted guiding significance for further exploring EC, the digital economy, and related policy formulation and improvement. The second is to expand the boundaries of the analysis of the economic effect of EO, place the research perspective on the FIG, and explore new breakthroughs in alleviating relative poverty and income inequality by using an income indicator in addition to the income gap between urban and rural areas. Thirdly, the heterogeneous impact of EO on the FIG is discussed, and the development potential of EC in different scenarios and regions is considered, which provides useful empirical insights for the implementation of targeted policies. Fourth, the impact of different EO conditions on the FIG is further distinguished, and a feasible path for the inclusive development of EC is proposed so as to make full use of the characteristics and advantages of EC to promote rural development.

2. Theoretical Framework

2.1. The Impact of EO on the FIG

According to the theory of equality of opportunity, income inequality is mainly affected by two types of factors: effort and environment [22]. Effort factors include individual controllable factors such as individual work and education level. Environmental factors include family background, place of birth, gender, race, and other factors that are not controlled by individuals. People are more likely to accept the inequality caused by effort than the inequality caused by environmental factors. Opportunity inequality brought on by environmental factors will reduce individual enthusiasm for work, hinder economic growth [23], and further lead to the widening of the income gap, thus causing social conflicts [24]. Operating income and wage income constitute the primary sources of farmers’ revenue [25], with the FIG mostly reflected in the significant difference between operational income and wage income. However, more market opportunities and employment opportunities for rural low-income groups can narrow the gap between operational income and wage income.
Digital technology has reconfigured the structure and dynamics of the human economy and society. The technological revolution is also shaping new social development mechanisms, giving birth to new production relations, social classes, and major contradictions [26]. As an emerging form of the digital economy [27], EC has unique advantages in alleviating income inequality and narrowing the FIG. EC has the characteristics of inclusive growth, which can promote the income growth of the bottom group [28]. Rural households with low income are more likely to participate in small-scale agricultural activities compared to rural households with greater earnings. However, due to the regional, seasonal, and perishable characteristics of most agricultural products, it is usually difficult for small-scale rural business owners to profit from the traditional circulation mode of agricultural products with multiple links, high cost, high loss, and low efficiency. The digital platform built by EC for the countryside provides the corresponding way to address this. The agricultural commodities of EC can facilitate direct connections between agricultural production and marketing, enabling small farmers to eliminate reliance on intermediaries [29], thereby enhancing agricultural product sales and significantly increasing household income. The advancement of rural EC may revitalize neighboring sectors, expand the income avenues for local inhabitants, and particularly enhance the overall income growth of low-income farmers who previously faced economic limitations. EC frequently serves as a crucial job resource for marginalized and economically disadvantaged individuals, including surplus rural labor, returning home, and laid-off migrant workers who own less capital. The dissemination and application of digital economic models, such as EC in rural regions, facilitate the reduction in the regional digital divide, generate new employment opportunities, absorb excess rural labor [12], and thereby diminish the FIG. Therefore, this paper proposes Hypothesis 1:
H1. 
EO can significantly narrow the FIG.

2.2. The Impact Mechanism of EO on the FIG

The income of rural families mostly relies on labor input; thus, differences in labor endowment across these households affect employability and job prospects, ultimately resulting in wage income disparity. And labor endowment usually refers to the labor ability, time, skills, and efficiency of resource allocation possessed by individuals or families, including the total amount of labor time such as disposable time, the diversity of labor skills, and the labor elasticity that reflects the flexible allocation ability between different economic activities. Against the background of intensified urbanization, China’s rural surplus labor force presents significant characteristics of aging and feminization. Both groups have weaker endowments, are disadvantaged in the labor market, and have lower income levels. The physical quality of older workers is lower than that of young and middle-aged workers, and they have a lower education level, a weak ability to learn and accept new technologies [30], and a lack of employment opportunities and development opportunities, resulting in a lower income level. In addition, under the traditional family division of the labor concept of “male master outside the home, female master in the home”, rural women not only bear more responsibilities to take care of the family and raise the younger generation but also take into account agricultural production, which greatly occupies the non-farm employment time, resulting in a lower proportion of non-farm transfer, reduced employability and employment opportunities, and thus reduced wage income.
EC provides inclusive non-agricultural employment opportunities for low-income farmers such as the rural older labor force and the female labor force, so that they can obtain wage income through part-time employment and narrow the income gap. In the digital economy model, the production and operation process can be broken down into a large number of “de-skilled” tasks by digital technology [31]. The non-agricultural employment generated by EC can be accessed by farmers with lower skill levels, compensating for the skill deficits of elderly and female farmers, diminishing differences in labor endowment among farmers, and narrowing the wage income gap. The EC sector exhibits significant flexibility, transcending the limitations of time and location [32], and can realize nearby employment, and the physical and intellectual requirements for completing work tasks are not high. These attributes align more closely with the work requirements of the older and female labor forces, diminishing the differences in health, physical strength, and intelligence among farmers, hence reducing the FIG. Thus, we propose Hypothesis 2:
H2. 
EO can reduce the FIG by narrowing the differences in labor endowment among farmers.

2.3. The Heterogeneous Impact of EO on the FIG

EC affects the FIG differently according to location, agricultural function zoning, and landscape. Eastern, central, and western areas have different EC development stages due to economic development. Central and eastern regions have earlier, faster, and wider-ranging EC, fierce rivalry, saturated markets, higher entry barriers, and poor market access for low-income groups. Due to the late development of EC in the west, and strong policy support, it can give more job and entrepreneurship opportunities for low-income people, closing the rural income gap. Rural EC mostly deals with agriculture. The major grain-producing areas have excellent natural resource endowments, more advanced agricultural production technologies and high agricultural outputs [33]. This can minimize unit costs, improve sales efficiency, and lower price volatility, benefiting low-income people and farmers. Mountainous locations have poor transportation and environmental conditions, a single industrial framework, several agricultural output and operation limits, and a small income disparity. The emergence of rural EC has innovated the method of industrial development, enriched the industrial format [34], increased income opportunities for low-income groups, and diminished the FIG, and the specific influence mechanism is shown in Figure 2. Thus, we propose Hypothesis 3:
H3. 
The impact of EO on the FIG is heterogeneous in terms of geographical location, agricultural function zoning, and terrain conditions.

3. Research Design

3.1. Data Sources

This paper uses China Rural Revitalization Survey (CRRS) data from 2020. The survey examines key areas of rural development in China, including “population and labor”, “industrial structure”, “farmers’ income and expenditure and social well-being”, “household consumption”, “rural governance”, and “comprehensive reform”. First, 10 provinces were randomly selected from the eastern, central, western, and northeastern regions. Secondly, according to the per capita GDP level, 5 counties (cities and districts) were randomly selected from each province, and then 3 townships (towns) were randomly selected from each county (city and district). Finally, 12~14 rural households were randomly selected by the equidistant sampling method to investigate their agricultural production, rural development, and the income of rural households in the previous year. We took 3833 samples. The study eliminated missing and abnormal data, yielding 3127 valid farmer samples.

3.2. Variable Selection

3.2.1. Dependent Variables

The dependent variable of this study is the FIG. Referring to the existing literature, this paper uses the Gini coefficient of farmers’ yearly per capita income to assess the income gap among farmers [35]. In this paper, it is assumed that the sample can be divided into n groups, and w i , m i , and p i are set to represent the share of the farmers’ income in group i in the total income of all samples, the average household income, and the frequency of farmers (I = 1, 2, … n); after ranking all the sample farmers by income ( m i ), from small to large, the Gini coefficient to measure the FIG is as follows.
G i n i = 1 i = 1 n 2 B i = 1 i = 1 n p i ( 2 Q i w i )
Q i = k = 1 i w k expresses the cumulative share of income from 1 to i, B represents the area at the lower right of the Lorentz curve, and i = 1 n w i = 1 , i = 1 n p i = 1 .

3.2.2. Core Independent Variables

This paper references the study of Guan et al. [27] and includes the question, “Does your family operate and have products traded through the network”? in the farmers’ questionnaire. The assessment of EO considers farmers selling products online as indicative of EO, with a value of 1; conversely, the absence of such behavior is designated a value of 0.

3.2.3. Mediating Variables

Based on the previous theoretical analysis, it can be seen that the key to narrowing the FIG is to promote the rural low-income groups to increase their income, while for rural older laborers and rural women, as the main rural disadvantaged groups [36], the disadvantage of their labor endowment leads to their weaker ability to increase their income. On the other hand, EO can reduce the FIG by narrowing the labor endowment differences among farmers, especially by weakening the labor endowment deficiencies of older farmers and female farmers. Considering that farmers’ part-time employment can comprehensively reflect the labor time allocation capacity, skill diversity, resource allocation efficiency, and other dimensions of their labor endowment, and referencing that Zhang et al. [37] use part-time employment as one of the indicators for measuring labor endowment, we adopt the “Whether or not older or female farmers are part-time workers” to measure the difference in labor endowment among farmers. If it does, it means that the difference in labor endowment is reduced (DLER), and the value is 1; otherwise, the value is 0.

3.2.4. Control Variables

Referencing the existing literature, in addition to EO, this study proposed three tiers of control variables, including the individual traits of the householder, family traits, and village traits [38,39]. All variables and their definitions are shown in Table 1.

3.3. Model Construction

RIF Mode

This paper uses the centralized influence function (re-centered influence function, RIF) regression method established by Firpoi et al. for baseline regression [40]. Unlike the conventional regression method, the dependent variable in RIF regression may represent either the income level in a traditional context or income inequality measurements, such as quantiles, variance, and the Gini coefficient derived from the influence function, thereby facilitating an immediate relationship between the inequality index and its factors. Consequently, we can directly examine the marginal effect of EO on the FIG from a distributional perspective. Moreover, in contrast to standard least squares regression, RIF regression may effectively alleviate endogeneity issues arising from omitted variables, hence providing more robust and solid estimation results. This paper will use the Gini coefficient to quantify the FIG, consistent with standard practices in the literature, and its decentralization impact function can be expressed as follows:
R I F ( y ; v G i n i ) = 1 + 2 μ 2 R ( F Y ) y 2 μ 1 { y [ 1 p ( y ) ] + G L [ p ( y ) ; F Y ] }
v G i n i is the Gini coefficient, F Y is the income distribution, μ is the overall income expectation, G L is the generalized Lorentz curve, R is the integral of the generalized Lorentz curve on [0, 1], and p is the income distribution.
Combined with Equations (1) and (2), the regression model formula is shown below:
G i n i ( I n c o m e ) = δ E - c o m m e r c e + β X + ε
G i n i ( I n c o m e ) is the Gini coefficient of per capita income of farmers, which is used to measure the FIG; E - c o m m e r c e indicates the farmers’ EO behavior, δ describes the impact of EO on the FIG; if δ is positive, it means that EO expands the FIG, while if not, it narrows the FIG; X is the control variable in this paper, and ε is the random error term.

4. Analysis of Empirical Results

4.1. Baseline Regression

Before conducting the baseline regression, we conducted a multicollinearity test and a heteroscedasticity test on the variables. The VIF value of 1.12 in the multicollinearity test results indicated that there is no serious multicollinearity problem. The results of the heteroskedasticity test showed that the p-value was 0.4504, which was greater than 0.05, and the null hypothesis of homoscedasticity was not rejected. The results showed that the variables passed the multicollinearity test and the heteroskedasticity test. Subsequently, baseline regression was performed using Stata 16.0 software.
The regression results of EO on FIG are shown in Table 2. The findings indicate that the EO adversely affects the FIG at a significant level of 1%. This suggests that EO may significantly narrow the FIG, hence confirming the research hypothesis H1. The control variables, including farmers’ MS, EA, health, VT, VL, and VEL, exert a considerable negative influence on the FIG, hence reducing the FIG. The age of farmers, the HCLS, HLFS, VTC, and the VPR significantly positively influence the FIG, hence intensifying the FIG. The possible reason for this is that within married families, it is convenient for the husband and wife to realize the division of labor that complements agricultural production and non-agricultural employment, broaden income sources, share income risks, and narrow the income gap with high-income families. The healthy physical condition of farmers can provide a strong guarantee for their employment, entrepreneurship, and wealth creation. At the village level, the industrial development of rural areas in mountainous areas is more difficult, and farmers are generally at a lower income level, but it also implies that there is a huge development potential of rural EC in mountainous areas, which has a higher marginal effect on promoting large-scale farmers’ income. However, the good geographical location, convenient transportation, and advanced economic development level of the village have created a homogeneous development environment for the farmers, and these favorable conditions are conducive to reducing the geographical constraints of agricultural production and creating non-agricultural employment opportunities for low-income farmers by promoting the balanced diffusion of production factors. On the contrary, the age of farmers will impose certain restrictions on their ability to work, reduce their competitiveness in the non-farm employment market, and put low-income households in a more disadvantaged position. If the scale of household farmland is too large, farmers will have psychological concerns when making decisions about non-farm employment, which will make them more inclined to farming. Compared with low-income rural households, the abundance of household labor and the reform of village assets may bring greater benefits to high-income farmers, thereby widening the FIG.

4.2. Robustness Tests

4.2.1. Replace the Dependent Variable

The Gini coefficient is used in the previous regression to quantify the FIG. In addition to the Gini coefficient, variance is another widely used index in the analysis of income inequality [35]. This study uses the variance of per capita family income to assess the FIG and subsequently does a regression analysis. The regression results after replacing the dependent variable are shown in Table 3. The results show that EO continues to exert a considerable adverse effect on the FIG, confirming that the above regression results are reliable.

4.2.2. Replace the Core Independent Variable

This study additionally uses the method of substituting the core independent variable to assess robustness. The quantity of family-operated Internet enterprises more accurately represents the scope of farmers’ EO. This research uses the quantity of household online stores as a metric for assessing farmers’ EO and performs a regression analysis [38], and the specific results are shown in Table 4. The findings show that even after substituting the core independent variable, EOs continue to exert a significant negative effect on the FIG, and these conclusions remain robust.

4.2.3. Replace the Model

In this study, quantile models were further used for robust regression. With reference to relevant studies, this study considers farmers with incomes at a 0.25 sub-point and below as the low-income group, those with a 0.50 sub-point as the middle-income group, and those with a 0.75 sub-point and above as the high-income group and carries out unconditional quantile regression [41]. Table 5 presents the quantile regression results. The findings show that as the decimal point increases, the influence of EO on farmers’ income diminishes, suggesting that EO has been more effective in raising the incomes of low-income groups, thereby affirming that EO may narrow the FIG.
Figure 3 more clearly illustrates the different effects of income growth due to EO across various sub-points. The solid black line in both the left and right panels denotes the regression curve value, while the shaded area indicates the 95% confidence interval. The right figure in Figure 3 illustrates that EO affects income in the 0.20 quintile by around 0.70, whereas the impact on the 0.98 quintile is nearly 0.00. The effect of income rise diminishes from the low-income group to the high-income group, affirming that EO can reduce the FIG.

4.3. Endogeneity Test

4.3.1. Reverse Causation

An endogenous problem may exist between EO and the FIG. EO diminishes the FIG by facilitating income growth for low-income groups; conversely, as the income of these groups rises, they can offer support for EO, thereby enhancing the probability of successful operations. Consequently, this paper uses the 2SLS model for the endogeneity test. This work utilizes village EC service stations (VESTs) as instrumental variables [42]. The VESTs will influence the EO behavior of farmers and satisfy the correlation criteria for instrumental variables; conversely, VESTs will not directly impact the FIG, thereby fulfilling the exogeneity criteria for instrumental variables. Table 6 shows the results of the endogeneity test using the 2SLS model. The results of the first stage regression show that the VEST coefficient is significant, fulfilling the correlation criteria for instrumental variables. The F value indicates that the VEST passes the weak instrumental variable test. Regression results show that EO significantly shrinks FIG, thereby reinforcing the validity of the research results presented in this paper.

4.3.2. Self-Selection Bias

Based on the consideration that EO is a self-selected behavior of farmers, the baseline regression probably exhibits an endogenous issue caused by self-selection bias, which can be effectively addressed by propensity score matching (PSM). This research uses the PSM method to re-evaluate and determine the ATT of EO on the FIG, and the specific results are shown in Table 7. Regression results show that regardless of the matching method, EO exerts a significant adverse effect on the FIG.
The PSM model definition needs to fulfill two requirements: the overlap hypothesis and the equilibrium characteristic. Figure 4 illustrates that post matching, the propensity scores of the EO and non-EO samples nearly coincide, demonstrating a significant common support interval, hence indicating the appropriateness of the matching process.
Table 8 shows the results of a balancing test to determine if the matching estimation results of the preceding propensity score balanced the data. This paper shows K-nearest neighbor matching. The results show that after matching, the control variable standardized deviation rates drop below 10%. The control variables’ t-test findings do not disprove the null hypothesis, balancing their covariate distributions. Thus, propensity score matching matches the balancing test findings.

4.4. Mechanism Analysis

Based on the preceding theoretical study, EO can shrink farmers’ labor endowment gaps and lessen the FIG. Table 9 shows the mediation effect mechanism findings for verifying the previous mechanism. The results support research hypothesis H2 that EO can greatly decrease the FIG by reducing labor endowment.

4.5. Heterogeneity Test

This paper conducted a grouping regression of samples from geographical location, agricultural function zoning, and terrain conditions to examine the diverse influence of EO on the FIG. The results confirm the research hypothesis H3 that EO affects the FIG differently by location, agricultural function zoning, and terrain.

4.5.1. Geographical Location

Referring to the study of Qiu et al. [11], this paper divides the provinces where farmers live into three groups, eastern, central, and western, and performs group regression, and the results are shown in Table 10. From the results, it can be seen that compared with the central and eastern regions, EO can reduce the FIG in the western region, which further highlights the inclusive nature of EC. The development of the eastern region started early, and the market competition is fierce, which requires a more highly skilled labor force. In addition, there are already abundant development channels in the eastern region, and the driving role of EC in its economy may not be prominent. However, the western region has a weak economic foundation and generally low farmer incomes, but it has a strong late-mover advantage. The flexibility and inclusiveness of EC meet the development needs of the western region, coupled with the state’s policy direction toward the western region, so that EC has injected a lot of vitality into the income generation and income increase in farmers in the western region.

4.5.2. Agricultural Functional Zoning

Referring to the existing studies, this paper divides the areas where farmers are located into major grain-producing areas and non-major grain-producing areas from the perspective of agricultural functional zoning [43] and explores whether there are differences in the impact of EO on the FIG in different agricultural functional zones. Table 11 illustrates the effect of EO on the FIG across various agricultural functional zones. The findings indicate that, in contrast to non-major grain-producing areas, EO can lessen the FIG in major grain-producing areas. The main reasons for the difference may be the scale of production and the direction of policies. First, according to the theory of economies of scale, the average cost of production can be reduced as the scale of production expands. The major grain-producing areas have superior natural resources and sufficient land endowments, and their agricultural output is relatively large, and the average cost of farmers’ production is lower than that of the non-major grain-producing areas. The cost and quantity advantages of agricultural products provide farmers with greater profit margins for EO, and the effect of increasing income is more significant. Second, as a solid support for ensuring China’s food security, the government will give more financial support to the major grain-producing areas, which is not only reflected in the improvement of infrastructure but also in the vigorous support for the development of the agricultural industry. Among them, sufficient agricultural production is the basis for expanding the scale of rural EC, and the coverage of transportation, communications, and other infrastructure provides superior external conditions, and the government’s financial support has injected strong momentum and can guide products to brand development and industrialization. Eventually, a larger scale of EC will also create more opportunities for low-income farmers to increase their incomes.

4.5.3. Terrain Conditions

This paper also analyzes the heterogeneity of the effects of EC based on different terrain conditions [14]. Table 12 illustrates the effect of EO on the FIG across various terrain conditions. The results indicate that, in contrast to flat regions, EO can reduce the FIG in hilly locations. The explanation may lie in the fact that, firstly, the mountainous region is constrained by the natural environment, leading to a small income gap; secondly, EC possesses inclusive characteristics. The widespread adoption of EC in villages fosters mountain industry development, enabling low-income populations to access greater growth prospects, further lessening the FIG. The reason may be that, on the one hand, there is a large base of low-income groups in mountainous areas. Employment opportunities are scarcer in mountainous areas than in plains, forcing the main labor force to go out to work, resulting in a large surplus of vulnerable groups such as the elderly and women. The inclusive nature of EC is conducive to creating more localized employment opportunities and helping a large number of rural disadvantaged groups and surplus labor to increase their incomes, thereby reducing the FIG. On the other hand, the plains themselves have a relatively complete market mechanism, and their farmers already have more sales channels, and EC is only one of them, so its effect on narrowing the income gap is limited, and the marginal effect brought by EC may not be as obvious as in the mountainous areas. The development of EC has brought more breakthroughs to the transformation of rural areas in mountainous regions, so it has a greater marginal effect on the transformation of its original economic structure.

4.6. Further Discussion

The baseline study analyzed the influence of EO on the FIG; nevertheless, the effects of varying EO scales and models on FIG remain uncertain. This research further analyzes the differential effects of various EO scales and models, with the aim to figure out which combinations are most effective in diminishing the FIG.

4.6.1. The Influence of Different EC Business Scales

This paper categorizes EO into large-scale EC and small-scale EC based on the mean value of EC sales and examines the effect of varying scales of EO on the FIG. The results of different EO scales on the FIG are shown in Table 13. The findings show that large-scale EO can lessen the FIG. The expansion of EO will stimulate the growth of associated industries, including agricultural product processing, packaging, and logistics. Therefore, it will generate additional employment opportunities and enhance income streams, ultimately benefiting low-income groups and reducing the FIG. The EO increases the value of agricultural products, enabling farmers throughout the industrial chain to share greater profits and assisting in balancing the income levels of various farmers. Moreover, large-scale EO requires collective coordination, facilitating a more equitable allocation of resources and advantages among farmers, hence mitigating the FIG arising from individual differences.

4.6.2. The Influence of Different EO Models

The current EO model for farmers is divided into two main categories. One model involves managing and selling agricultural products on platforms like Taobao, Jingdong, Pinduoduo, and others. The other involves using social platforms like WeChat, Weibo, and live-streaming services [44]. EC platforms enable the collection of external objective data to lower transaction costs and the acquisition of “social uncertainty” information to improve efficiency. And the information feedback mechanism of EC platforms affects consumers’ decision-making, and good eWOM can establish credibility for merchants [45]. In order to attract more consumers, merchants need to be responsible for product quality, ensure the quality of agricultural products, and form a brand premium. Instead of platform EC models, social EC models like WeChat EC use interpersonal network relationships to connect producers and consumers [46]. Unlike online platforms, social EC has a low market entry barrier and simple operational principles [47].
This paper categorizes EO models into platform EC and social EC and further examines the influence of these distinct models on the FIG, and the specific results are shown in Table 14. The findings show that the platform EC model is more effective than the social EC model in lessening the FIG. The platform EC model typically possesses a larger user base and potential customer groups, resulting in a higher likelihood of extensive operations. The business scope and associated industrial connections are more complicated, and they can generate employment opportunities for a greater number of low-income individuals, thereby reducing the FIG.

5. Discussion

The vigorous development of the Internet and digital information technology has given birth to many new business forms. Driven by the “Internet plus agriculture” model, EC platforms provide a viable path for farmer employment and agricultural product sales, helping to alleviate income inequality. This study discusses the effect of farmers’ EO behavior on narrowing the FIG and carries out heterogeneity analysis from different perspectives. On this basis, it further discusses the effect difference of different EO scales and EO models, providing new theoretical support for a better understanding of the income distribution effect of rural EC.
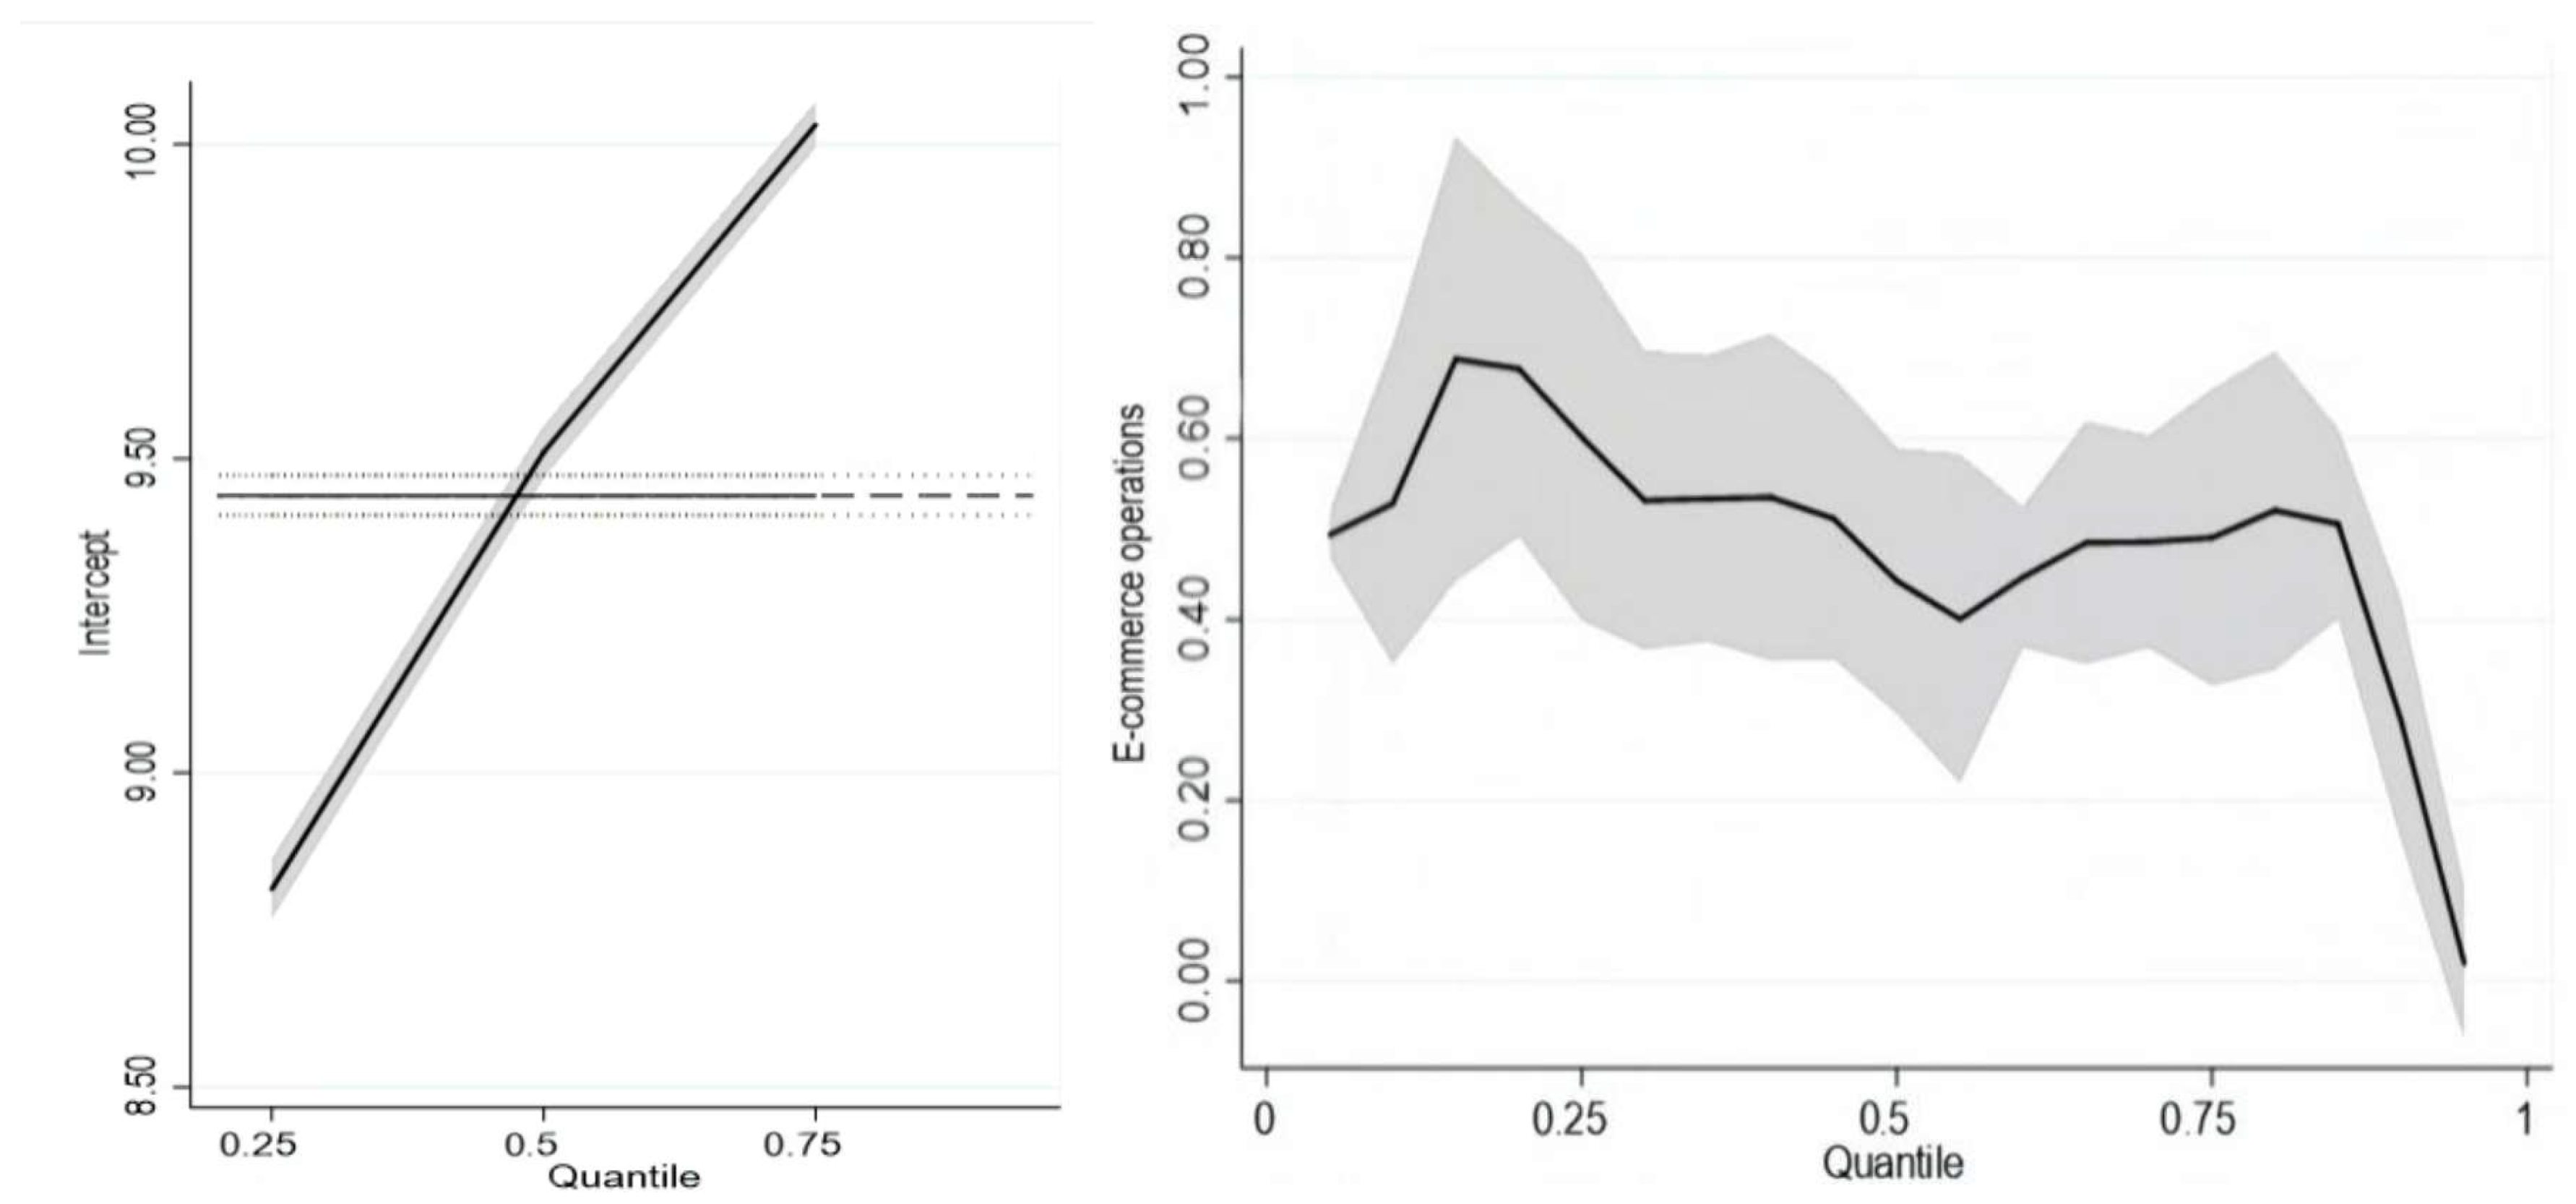
Specifically, this paper finds that farmers’ EO can significantly reduce the FIG, which is consistent with the conclusions of previous scholars [
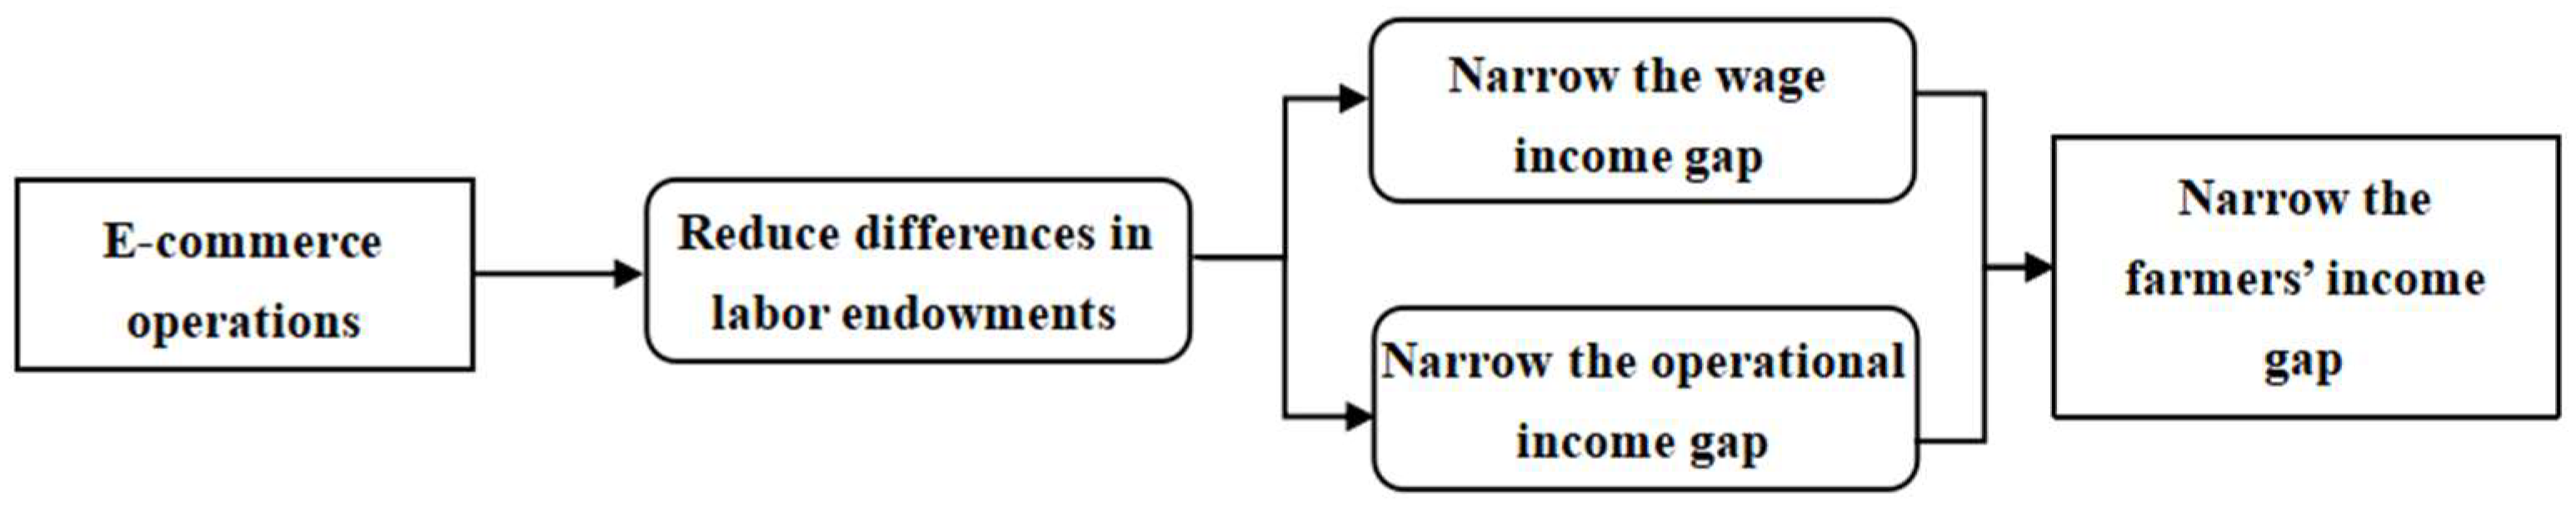
27]. However, different from related articles, when studying the relationship between EO and the FIG, scholars often start from the income increase effect of EO, and further verify the effect of EO in reducing the FIG through quantile regression. This paper uses the RIF model to establish a direct relationship between income inequality and EO and uses quantile regression to support it, hoping to provide a more intuitive and richer supplement for exploring the influencing factors of EO’s economic effect and income inequality. In explaining the influencing mechanism, this paper hypothesizes that EO can narrow the income gap of farmers by narrowing the difference in farmers’ labor endowment and uses the part-time employment of older farmers or female farmers to measure the difference in labor endowment among farmers, and the hypothesis is finally verified. Contrary to the findings of Niu et al. [48], who found that part-time employment widened the FIG, the difference is that this paper focused on part-time employment between older and female farmers. The more active their part-time work behavior is, it indicates that the lack of labor endowment has eased their work constraints, reflecting the improvement of the ability of rural disadvantaged groups and low-income farmers to increase their income, thus having a positive impact on narrowing the FIG.
In addition, this paper explores the heterogeneity of EO effects in different geographical locations, agricultural functional zones, and topography. First, in terms of geographical location, the conclusions of this paper are consistent with those of most of the literature, and it is found that the effect of EO on poverty in the central and western regions is more significant, but not in the more economically developed eastern regions [49]. The main reason for this is that the development of the central and western regions started late, and the original development channels were relatively simple; the introduction of EC can bring a higher marginal effect to the income of low-income farmers in these areas. Secondly, in terms of agricultural functional zoning, the results show that EO in the major grain-producing areas can better narrow the FIG. Previous studies have found that the establishment of major grain-producing areas increases farmers’ operating income and strengthens the tendency of finance to support agriculture [25], which also provides a favorable explanation for the conclusions of this paper. The large scale of agricultural production in the major grain-producing areas helps farmers reduce costs, increase profits in the process of EO, and increase the operating income. Financial support for agriculture can promote the development of the agricultural industry, which is conducive to the expansion of the scale of EO, and further exerts the poverty alleviation and inclusiveness of EC. Finally, in terms of topography, EO can reduce the FIG in mountainous areas more than in plain areas. The relevant literature has also concluded that rural EC has a higher income increase effect in mountainous areas [14], which is explained in this paper as the base of low-income groups in mountainous areas being larger, and the marginal effect of EC on their income increase is more significant, so it is conducive to weakening the FIG on a large scale. In addition, since this paper uses the data of individual farmers’ EO, it is convenient for us to explore the differences in the effects of EO after further subdividing the scale and mode of EO, and the results show that large-scale EO and platform EC can narrow the FIG. When the platform economy develops to a certain scale, it is conducive to achieving economies of scale and reducing marginal costs [50], which not only brings greater profit margins to EC farmers but also creates more jobs for low-income groups, and the poverty alleviation effect of EC can be brought into play to a greater extent.
Overall, the theory of equal opportunity provides a basic logical framework for explaining the alleviation of income inequality by rural EC. The development of EC in rural areas can stimulate the vitality of surrounding industries, broaden the income channels of local residents, and bring economic opportunities to low-income rural households. At the same time, EC-related work is highly flexible, breaks through the restrictions of working hours and locations, and can be performed by farmers with lower skill levels, reducing the differences in labor endowments among rural households, all of which help to reduce income inequality caused by environmental factors. The theoretical contribution of this paper is to explore the direct relationship and mechanism between rural EC and FIG, verify the digital dividend and co-prosperity effect brought on by EC, and explore a new path of rural development. In addition, the differences in the effectiveness of EC under different conditions and contexts also help us to further infer that digital technology can bring greater development opportunities to developing countries and regions. All of these provide a theoretical reference for developing countries to gather the momentum of rural development, alleviate income inequality, and improve people’s satisfaction and happiness.
However, this study also has some specific shortcomings, which need to be improved in future studies. First, due to the limited availability of data, this paper only uses the data from the CRRS 2020 to study the impact of EO on the FIG, which inevitably have the limitations of cross-sectional data. The lack of timeliness of the data makes it difficult to fully reflect the long-term impact of EO on the FIG, and we will dynamically track and analyze the relationship between EO and the FIG after obtaining sufficient data and include more possible relevant factors. Second, in reality, EO will have an impact on the FIG in richer and more complex ways, and the discussion of its impact mechanism in this paper is still not comprehensive enough. For example, China’s rural areas are a typical “humane society”, according to the theory of social capital. Once farmers operate EC, their advanced technology, rich experience, and broad opportunities can be spread through social networks, benefiting more farmers and regulating the FIG. On the contrary, according to the “skill bias theory”, in the process of EO, the difference in labor skills between farmers will also show a large gap in their wage income, thereby widening the FIG. All these situations require us to take into account the actual circumstances in rural areas. Third, due to the complexity and volatility of income inequality within rural areas, the results of this study may be valid for specific time periods or specific scenarios, and the scope of replication is limited. Especially during the COVID-19 pandemic, the types of products and channels that residents consumed underwent major changes. The demand for fresh food and agricultural hoarding increased significantly, and the corresponding lockdown measures forced urban and rural residents to shift their consumption channels from offline to online, providing opportunities for the development of rural EC. However, at the same time, the spread of the COVID-19 epidemic restricted farmers from going out for non-farm employment, and there were also differences in the ability of rural households to resist risks under different levels of household economic resilience, and the income pattern of rural households changed accordingly. In the post-COVID-19 pandemic era, the new forms and models of rural industries spawned by the prosperity of the Internet economy have created new ways for farmers to find employment and start businesses, and the government has also vigorously strengthened the non-agricultural employment guarantee for rural women and older farmers. Whether rural EC can further release the dividend of poverty and whether low-income farmers who experience livelihood risks can grasp the pulse of the times and steadily increase their incomes still need to be further explored after obtaining more data. Therefore, in the future, we need to conduct a long-term analysis based on the actual data of EC business activities in different regions to more systematically reflect the dynamic impact of EO on FIG.

6. Conclusions and Implications

6.1. Research Conclusions

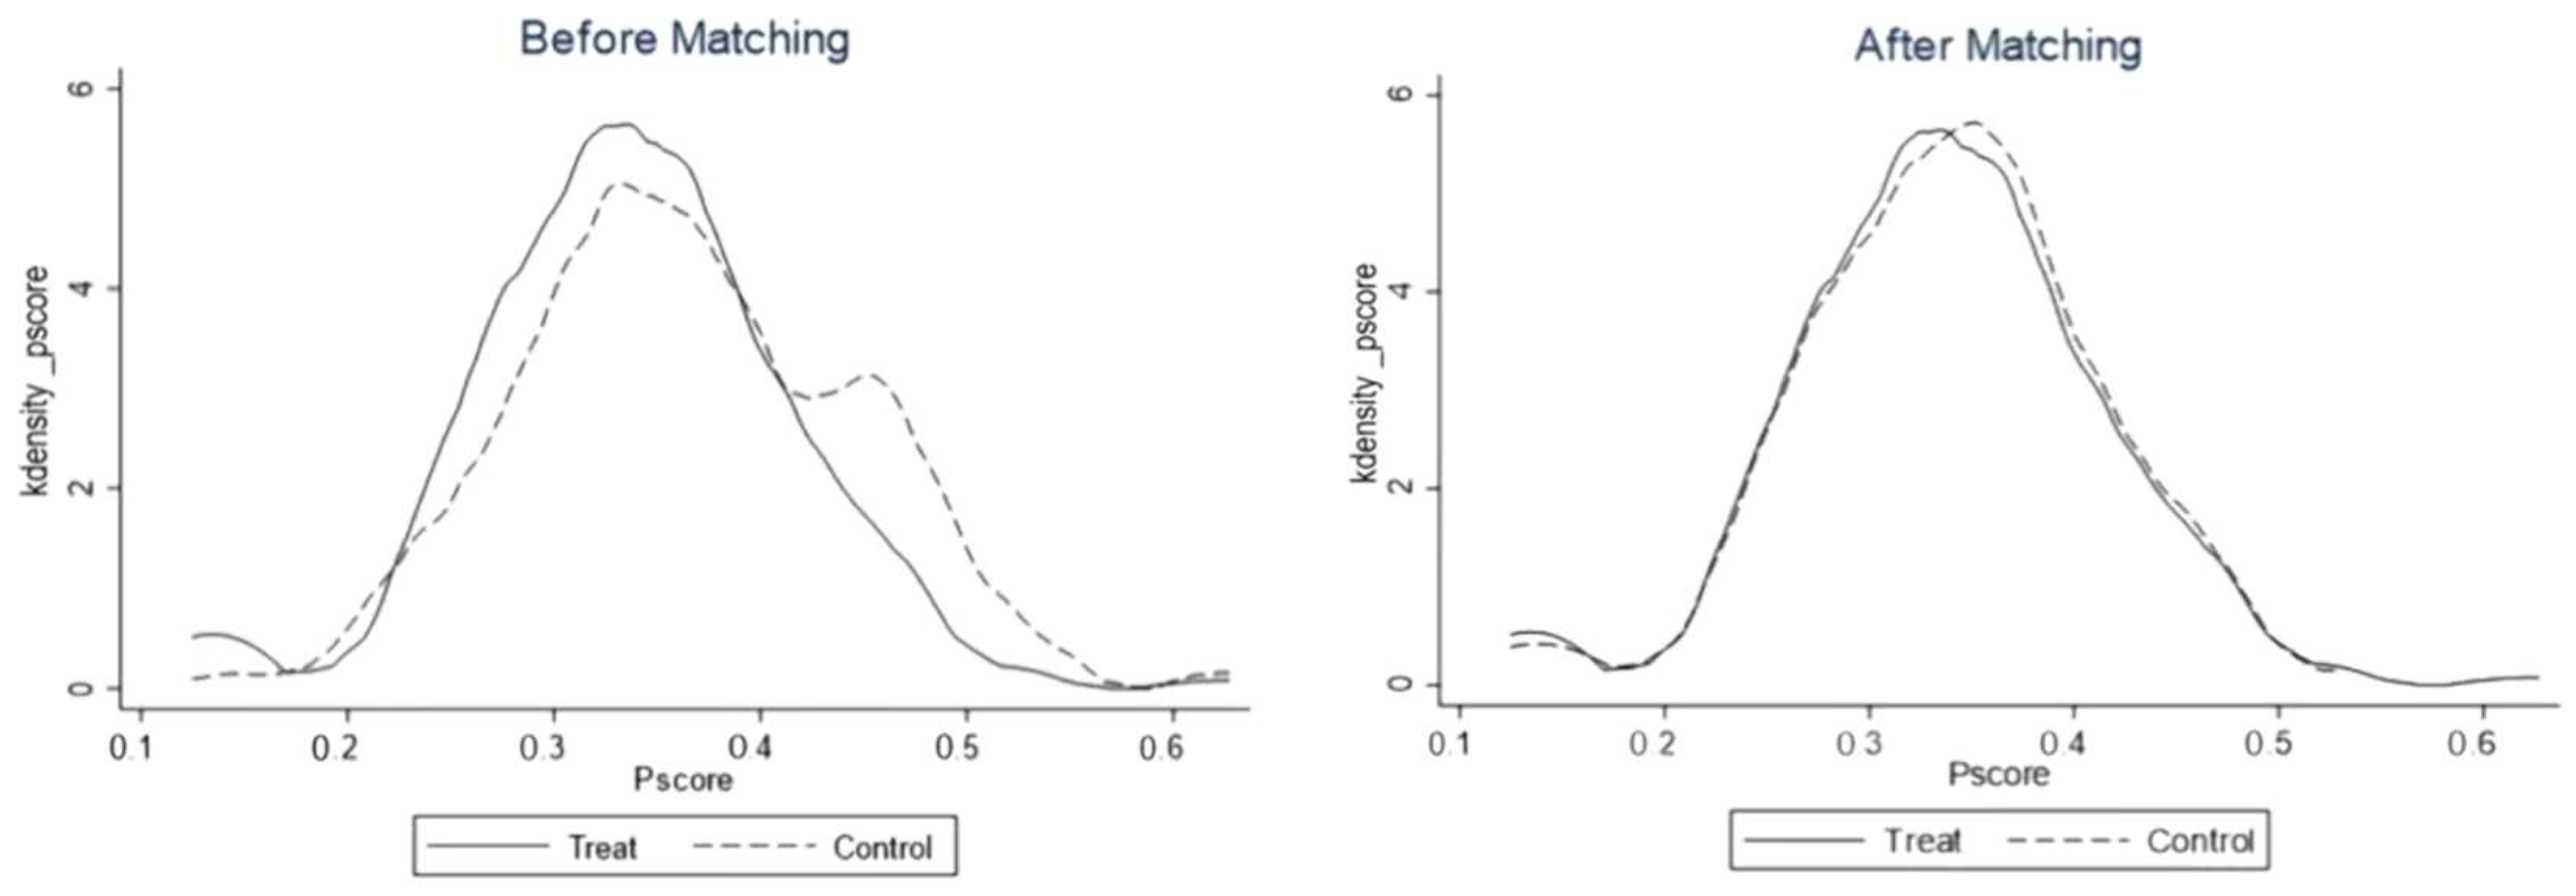
Based on the data of China Rural Revitalization Survey, this paper uses the RIF model and the mediation effect model to investigate the influence and mechanisms of EO on the FIG and discusses the heterogeneity of EO on the FIG. On this basis, this study further distinguishes the effects of different EO scales and EO models on the FIG and finally draws the following conclusions.
First, EO significantly narrows the FIG, alleviates income inequality within rural areas, and has characteristics of inclusive growth. This shows that in order to fully utilize the efficiency of EC and promote the sustainable development of farmers, it is necessary to increase the implementation of rural EC and optimize the business environment of EC.
Second, EO reduces the FIG by narrowing the difference in labor endowment. The “de-skilling” and flexibility of non-farm jobs related to EC make up for the lack of work skills and time of rural disadvantaged groups, such as the older labor force and women, reduce the difference in labor endowment among rural households, and narrow the FIG.
Third, the impact of EO on the FIG is heterogeneous in different geographical locations, agricultural function zones, and terrain conditions. Specifically, EO can narrow the FIG in the west, major grain-producing areas, and mountainous areas. It is mainly affected by factors such as the level of economic development, the scale of agricultural production, and policy inclination. It shows that regions with relatively backward economic levels need to grasp the digital dividends brought on by the digital economy and take advantage of the late-mover advantage to generate income and increase income, and the government also needs to introduce relevant policies to bridge the digital divide and ensure fair development opportunities for farmers.
Fourth, compared with small-scale EC and social EC, large-scale EC and platform EC are better able to narrow the FIG. EOs that reach a certain scale can create more jobs and play a greater role in supporting agriculture.

6.2. Research Implications

First, enhance support for rural EC, persist in advancing EC technology, managerial expertise, and capital to rural areas, further diminishing the technical, financial, and other barriers to EC operations. Utilize the convenience of the Internet to alleviate farmers’ information disadvantages, create a fairer and more convenient EC operating environment, and enable low-income groups to enjoy more EC benefits. Reduce income disparities by addressing inequalities caused by environmental factors.
Second, establish an EC support structure for rural vulnerable groups to elevate their EC skills. The government ought to enhance the EC capabilities of rural at-risk populations by facilitating EC training programs and conducting visits to EC demonstration sites. Motivate EC operators and platforms to create additional employment and development opportunities for vulnerable farmers, thereby maximizing the advantages of EC.
Third, bridge the gap in regional EC advancement. To address the slow development of EC sectors, governments ought to enhance policy preferences, motivate the integration of industry and resource endowments, pinpoint breakthroughs in EC development, and fully harness its potential. Additionally, establishing regional cooperation and benefit-sharing mechanisms will facilitate the high-level growth of rural EC and mitigate income disparity.
Fourth, facilitate the scaling and platforms of rural EC. Intensify the support strength in the rural EC sector, establish synergies within rural EC industrial clusters, extend the value chain of the rural EC industry, generate scale effects, create additional EC-related employment opportunities, and assist vulnerable farmers in improving their incomes.

Author Contributions

Conceptualization, H.Q. and Z.W.; methodology, H.Q. and L.L.; software, H.D.; validation, M.L. and X.C.; formal analysis, H.Q., H.D., and M.L.; investigation, H.D. and M.L.; resources, H.Q.; data curation, H.D.; writing—original draft preparation, H.Q. and H.D.; writing—review and editing, H.Q., H.D., and L.L.; visualization, X.C.; supervision, Z.W.; project administration, H.Q.; funding acquisition, H.Q. All authors have read and agreed to the published version of the manuscript.

Funding

This research was funded by the National Social Science Foundation of China (Grant No. 22CGL027).

Institutional Review Board Statement

Not applicable.

Informed Consent Statement

Not applicable.

Data Availability Statement

The data presented in this study are available on request from the corresponding author.

Conflicts of Interest

The authors declare no conflict of interest.

References

  1. Luo, C.; Li, S.; Sicular, T. The long-term evolution of national income inequality and rural poverty in China. China Econ. Rev. 2020, 62, 101465. [Google Scholar] [CrossRef]
  2. Zhang, J. A Survey on Income Inequality in China. J. Econ. Lit. 2021, 59, 1191–1239. [Google Scholar] [CrossRef]
  3. Guo, H.; Yang, Y.; Pan, C.; Xu, S.; Yan, N.; Lei, Q. Study on the Impact of Income Gap on Health Level of Rural Residents in China. Int. J. Environ. Res. Public Health 2022, 19, 7590. [Google Scholar] [CrossRef]
  4. Cheng, Y.; Zheng, D. Does the Digital Economy Promote Coordinated Urban-Rural Development? Evidence from China. Sustainability 2023, 15, 5460. [Google Scholar] [CrossRef]
  5. Soldatos, J.; Kefalakis, N.; Despotopoulou, A.; Bodin, U.; Musumeci, A.; Scandura, A.; Aliprandi, C.; Arabsolgar, D.; Colledani, M. A digital platform for cross-sector collaborative value networks in the circular economy. Procedia Manuf. 2021, 54, 64–69. [Google Scholar] [CrossRef]
  6. Wang, Y.; Wu, Y. Digital Economy, Rural E-Commerce Development, and Farmers’ Employment Quality. Sustainability 2025, 17, 2949. [Google Scholar] [CrossRef]
  7. Tang, K.; Xiong, Q.; Zhang, F. Can the E-Commercialization Improve Residents’ Income?-Evidence From ‘Taobao Counties’ in China. Int. Rev. Econ. Financ. 2022, 78, 540–553. [Google Scholar] [CrossRef]
  8. Goldfarb, A.; Tucker, C. Digital economics. J. Econ. Lit. 2019, 57, 3–43. [Google Scholar] [CrossRef]
  9. Peng, C.; Biao, M.; Zhang, C. Poverty alleviation through e-commerce: Village involvement and demonstration policies in rural China. J. Integr. Agric. 2021, 20, 998–1011. [Google Scholar] [CrossRef]
  10. Li, X.; Guo, H.; Jin, S.; Ma, W.; Zeng, Y. Do farmers gain internet dividends from E-commerce adoption? Evidence from China. Food Policy 2021, 101, 102024. [Google Scholar] [CrossRef]
  11. Qiu, H.; Zhang, X.; Feng, M.; Zhang, Z.; Wang, J.; Wang, Z. Exploring the Income-Increasing Benefits of Rural E-Commerce in China: Implications for the Sustainable Development of Farmers. Sustainability 2024, 16, 7437. [Google Scholar] [CrossRef]
  12. Gao, Y.; Zang, L.; Sun, J. Does Computer Penetration Increase Farmers’ Income? An Empirical Study from China. Telecommun. Policy 2018, 42, 345–360. [Google Scholar] [CrossRef]
  13. Zatonatska, T.; Fedirko, O. Modeling of the E-Commerce Impact on the Employment in EU. In Proceedings of the 2019 IEEE International Conference on Advanced Trends in Information Theory (ATIT), Kyiv, Ukraine, 18–20 December 2019. [Google Scholar] [CrossRef]
  14. Li, G.; Qin, J. Income effect of rural E-commerce: Empirical evidence from Taobao villages in China. J. Rural. Stud. 2022, 96, 129–140. [Google Scholar] [CrossRef]
  15. Qi, J.; Zheng, X.; Cao, P.; Zhu, L. The effect of e-commerce agribusiness clusters on farmers’ migration decisions in China. Agribusiness 2019, 35, 20–35. [Google Scholar] [CrossRef]
  16. Li, W.; He, W. Revenue-increasing effect of rural e-commerce: A perspective of farmers’ market integration and employment growth. Econ. Anal. Policy 2024, 81, 482–493. [Google Scholar] [CrossRef]
  17. Bauer, J. The Internet and income inequality: Socio-economic challenges in a hyperconnected society. Telecommun. Policy 2018, 42, 333–343. [Google Scholar] [CrossRef]
  18. Qiu, Y.; He, N.; Yan, C.; Rao, Q. Whether the digital divide widens the income gap between China’s regions? PLoS ONE 2023, 18, e0273334. [Google Scholar] [CrossRef]
  19. Bowen, R.; Morris, W. The digital divide: Implications for agribusiness and entrepreneurship. Lessons from Wales. J. Rural. Stud. 2019, 72, 75–84. [Google Scholar] [CrossRef]
  20. Jiang, Q.; Li, Y.; Si, H. Digital Economy Development and the Urban-Rural Income Gap: Intensifying or Reducing. Land 2022, 11, 1980. [Google Scholar] [CrossRef]
  21. Li, L.; Zeng, Y.; Ye, Z.; Guo, H. E-commerce development and urban-rural income gap: Evidence from Zhejiang Province, China. Pap. Reg. Sci. 2021, 100, 475–495. [Google Scholar] [CrossRef]
  22. Roemer, J. A Pragmatic Theory of Responsibility for the Egalitarian Planner. Philos. Public Aff. 1993, 22, 146–166. [Google Scholar] [CrossRef]
  23. Marrero, G.; Rodríguez, J. Inequality of Opportunity and Growth. J. Dev. Econ. 2013, 104, 107–122. [Google Scholar] [CrossRef]
  24. Szewczyk, J.; Crowder-Meyer, M. Community income inequality and the economic gap in participation. Polit. Behav. 2022, 44, 479–504. [Google Scholar] [CrossRef]
  25. Qian, L.; Yu, K.; Cao, B.; Zhong, Y. Widening or narrowing? The impact of the establishment of major grain-producing areas on urban-rural income gap. J. China Agric. Univ. 2025, 30, 294–307. [Google Scholar]
  26. Epicoco, M. Technological revolutions and economic development: Endogenous and exogenous fluctuations. J. Knowl. Econ. 2021, 12, 1437–1461. [Google Scholar] [CrossRef]
  27. Guan, X.; He, L.; Hu, Z. Impact of Rural E-Commerce on Farmers’ Income and Income Gap. Agriculture 2024, 14, 1689. [Google Scholar] [CrossRef]
  28. Qin, Y.; Fang, Y. The effects of e-commerce on regional poverty reduction: Evidence from China’s rural e-commerce demonstration county program. China. World. Econ. 2022, 30, 161–186. [Google Scholar] [CrossRef]
  29. Leong, C.; Pan, S.; Newell, S.; Cui, L. The emergence of self-organizing E-commerce ecosystems in remote villages of China. Mis Q. 2016, 40, 475–484. [Google Scholar] [CrossRef]
  30. Hernæs, E.; Kornstad, T.; Markussen, S.; Røed, K. Ageing and labor productivity. Labour Econ. 2023, 82, 102347. [Google Scholar] [CrossRef]
  31. Richardson, L.; Bissell, D. Geographies of digital skill. Geoforum 2019, 99, 278–286. [Google Scholar] [CrossRef]
  32. Zhang, Y.; Long, H.; Ma, L.; Tu, S.; Li, Y.; Ge, D. Analysis of rural economic restructuring driven by e-commerce based on the space of flows: The case of Xiaying village in central China. J. Rural. Stud. 2022, 93, 196–209. [Google Scholar] [CrossRef]
  33. Su, Z.; Zhou, L. The Impact of Major Grain Producing Area Policy Implementation on the Business Profits of Agricultural Enterprises. Chin. Rural. Econ. 2024, 06, 136–151. [Google Scholar]
  34. Qin, Q.; Guo, H.; Shi, X.; Chen, K. Rural E-commerce and county economic development in China. China. World. Econ. 2023, 31, 26–60. [Google Scholar] [CrossRef]
  35. Shi, C. The Impact of Land Transfer on Rural Household Income Gap: Exacerbation or Alleviation? Res. Econ. Manag. 2020, 41, 79–92. [Google Scholar] [CrossRef]
  36. Wan, L.; Xiang, D. Research on Poverty Reduction of Rural Vulnerable Groups under Accurate Poverty Alleviation Strategy. China Agric. Univ. (Soc. Sci. Ed.) 2016, 33, 46–53. [Google Scholar] [CrossRef]
  37. Zhang, J.; Chen, M.; Xie, X.; Lai, Z.; Liu, Y.; Zhang, S.; Zhang, Y. Farmer’s Labor Endowment, Farmland Fragmentation and Farmer’s Ecological Farming Decision-making Behavior. Chin. J. Agric. Resour. Reg. Plan. 2022, 43, 28–36. [Google Scholar] [CrossRef]
  38. Luo, Q. The Income-increasing Effect and Mechanisms of Rural E-Commerce-Evidence from China’s Rural Revitalization Survey. China Bus. Mark. 2022, 36, 47–59. [Google Scholar] [CrossRef]
  39. Liu, B.; Zhou, J. Digital Literacy, Farmers’ Income Increase and Rural Internal Income Gap. Sustainability 2023, 15, 11422. [Google Scholar] [CrossRef]
  40. Firpoi, S.; Fortin, N.; Lemieux, T. Unconditional Quantiles. Econometrica 1978, 77, 953–973. [Google Scholar]
  41. Cheng, M.; Shi, Q.; Jin, Y.; Gai, Q. Income Gap of Rural Households and Its Root Causes: Models and Empirical Evidence. J. Manag. World 2015, 7, 17–28. [Google Scholar] [CrossRef]
  42. Lu, H.; Sun, G.; Zhou, L.; Zhang, W.; Zou, J. The impact and mechanism of E-commerce of agricultural products on nongrain production of cultivated land in rural China. J. Environ. Manag. 2025, 373, 123639. [Google Scholar] [CrossRef]
  43. Jiang, S.; Cheng, S.; Zhuang, Y. Research on E-commerce Entering Rural Areas Empowering Rural Revitalization: A Quasi-Natural Experiment Based on the “National E-commerce Demonstration County” Initiative. Inq. Econ. Iss. 2025, 03, 172–190. [Google Scholar]
  44. Hao, Z.; Pan, Z. Building Guanxi network in the mobile social platform: A social capital perspective. Int. J. Inf. Manag. 2019, 44, 109–120. [Google Scholar] [CrossRef]
  45. Yan, Q.; Wu, S.; Wang, L.; Wu, P.; Chen, H.; Wei, G. E-WOM from e-commerce websites and social media: Which will consumers adopt? Electron. Commer. Res. Appl. 2016, 17, 62–73. [Google Scholar] [CrossRef]
  46. Liu, S.; Perry, P.; Gadzinski, G. The implications of digital marketing on WeChat for luxury fashion brands in China. J. Brand Manag. 2019, 26, 395–409. [Google Scholar] [CrossRef]
  47. Yang, R.; Che, T. Do social ties matter for purchase frequency? The role of buyers’ attitude towards social media marketing. Comput. Hum. Behav. 2020, 110, 106376. [Google Scholar] [CrossRef]
  48. Niu, W.; Shen, S.; Luo, L.; Zhang, B.; Jin, Y. Does farmer’s concurrent business expand income gap in rural areas? A case study in upper-middle Yellow River Basin. J. Arid. Land. Resour. Environ. 2022, 36, 80–87. [Google Scholar] [CrossRef]
  49. Cao, Z. Has e-commerce promoted common prosperity for farmers and rural areas: Based on the dual perspectives of income growth and disparity reduction. West Forum 2024, 34, 95–110. [Google Scholar] [CrossRef]
  50. Hao, N.; Ji, M. Development of Platform Economy and Urban-Rural Income Gap: Theoretical Deductions and Empirical Analyses. Sustainability 2023, 15, 7684. [Google Scholar] [CrossRef]
Figure 1. Development of rural EC in China from 2014 to 2022. Data source: Ali Research.
Sustainability 17 03921 g001
Figure 2. Influence mechanism of EO on the FIG.
Sustainability 17 03921 g002
Figure 3. The effect of increasing the income of EO on different income groups.
Sustainability 17 03921 g003
Figure 4. Propensity score distribution.
Sustainability 17 03921 g004
Table 1. Variables.
Table 1. Variables.
Variable NameVariable DefinitionMeanStd
FIGGini coefficient0.3630.082
EOWhether to sell products through the Internet
(Yes = 1, No = 0)
0.0710.257
DLERWhether older or female farmers have part-time jobs
(Yes = 1, No = 0)
0.0660.243
GenderMale or not
(Yes = 1, No = 0)
0.9550.206
AgeYear55.05811.470
Marital status (MS)Married = 1; unmarried = 00.9860.119
Educational attainment (EA)Educational experience of the householder1.8270.769
Political appearances (PA)Member = 1; non-member = 00.2390.426
HealthHealth level4.5041.042
Technical training (TT)Participate in technical training (yes = 1; no = 0)0.0670.249
Agricultural grant (AG)Agricultural subsidy (CNY); logarithm5.8342.419
Household cultivated land scale (HCLS) Operating land area (Ha) 0.1050.304
Household labor force size (HLFS)Amount of household labor force2.6211.406
Cooperative participation (CP)Whether any family member participates in the cooperative (yes = 1; no = 0)0.2490.432
Village topography (VT)Mountain = 1; plain = 00.5560.497
Village location (VL)Suburban = 1; non-suburban = 00.2050.404
Village traffic condition (VTC)Distance to the county seat (km)23.23116.813
Village property reform (VPR)Asset reform = 1,
No asset reform = 0
0.6530.476
Village economic level (VEL)Village per capita income (CNY); logarithm9.4580.552
Table 2. The regression results of EO on FIG.
Variable Name(1)(2)(3)(4)
EO−0.006 ***−0.003 ***−0.031 ***−0.019 ***
(0.001)(0.001)(0.006)(0.006)
Gender −0.008−0.005−0.004
(0.008)(0.005)(0.004)
Age 0.016 **0.012 **0.012 **
(0.007)(0.006)(0.006)
MS −0.076 ***−0.081 ***−0.082 ***
(0.013)(0.021)(0.017)
EA −0.009 *−0.003 **−0.003 **
(0.005)(0.001)(0.001)
PA −0.005−0.004−0.003
(0.003)(0.004)(0.003)
Health −0.003 **−0.005 ***−0.013 ***
(0.001)(0.001)(0.001)
TT −0.006−0.006−0.005
(0.006)(0.006)(0.005)
AG 0.002 *0.001
(0.001)(0.001)
HCLS 0.003 **0.002 *
(0.001)(0.001)
HLFS 0.004 ***0.004 ***
(0.001)(0.001)
CP −0.003−0.002
(0.003)(0.002)
VT −0.016 ***
(0.001)
VL −0.022 ***
(0.004)
VTC −0.007 ***
(0.001)
VPR 0.011 ***
(0.003)
VEL −0.011 ***
(0.003)
Constant term (CT)0.355 ***0.436 ***0.317 ***0.525 ***
(0.012)(0.008)(0.014)(0.023)
R20.0070.0330.0420.080
N3127312731273127
Note: The data come from the compilation of regression results. *** p < 0.01, ** p < 0.05, and * p < 0.1; values in parentheses are standard errors.
Table 3. Replace the dependent variable.
Variable Name(1)(2)(3)(4)
EO−0.010 ***−0.007 ***−0.023 ***−0.016 ***
(0.003)(0.002)(0.006)(0.003)
Gender −0.007−0.007−0.008
(0.007)(0.007)(0.007)
Age 0.004 ***0.004 ***0.004 ***
(0.001)(0.001)(0.002)
MS −0.076 ***−0.081 ***−0.082 ***
(0.011)(0.011)(0.011)
EA −0.003 **−0.003 **−0.004 ***
(0.001)(0.001)(0.001)
PA −0.005−0.004−0.003
(0.003)(0.004)(0.003)
Health −0.003 **−0.003 **−0.003 **
(0.001)(0.001)(0.001)
TT −0.003−0.003−0.004
(0.003)(0.003)(0.003)
AG 0.002 *0.002
(0.001)(0.001)
HCLS 0.003 **0.003 **
(0.001)(0.001)
HLFS 0.004 ***0.004 ***
(0.001)(0.001)
CP −0.005−0.004
(0.003)(0.003)
VT −0.006 ***
(0.001)
VL −0.022 ***
(0.004)
VTC −0.007 ***
(0.001)
VPR 0.011 ***
(0.003)
VEL −0.011 ***
(0.003)
CT0.366 ***0.513 ***0.376 ***0.488 ***
(0.002)(0.012)(0.011)(0.020)
R20.0070.0330.0420.080
N3127312731273127
Note: The data come from the compilation of regression results. *** p < 0.01, ** p < 0.05, and * p < 0.1; values in parentheses are standard errors.
Table 4. Replace the core independent variable.
Variable Name(1)(2)(3)(4)
EO−0.026 ***−0.023 ***−0.023 ***−0.020 ***
(0.006)(0.005)(0.005)(0.005)
Gender −0.007−0.007−0.007
(0.007)(0.007)(0.007)
Age 0.007 ***0.010 ***0.009 ***
(0.001)(0.001)(0.002)
MS −0.077 ***−0.082 ***−0.084 ***
(0.012)(0.012)(0.012)
EA −0.001−0.001−0.003
(0.001)(0.001)(0.002)
PA −0.006 *−0.005−0.003
(0.004)(0.004)(0.003)
Health −0.004 **−0.004 ***−0.003 **
(0.002)(0.002)(0.002)
TT −0.007−0.007−0.007
(0.006)(0.006)(0.006)
AG 0.013 **0.001
(0.006)(0.001)
HCLS 0.006 **0.005 **
(0.003)(0.002)
HLFS 0.004 ***0.005 ***
(0.001)(0.001)
CP −0.003−0.004
(0.003)(0.003)
VT −0.006 ***
(0.001)
VL −0.022 ***
(0.004)
VTC −0.002 ***
(0.001)
VPR 0.011 ***
(0.003)
VEL −0.011 ***
(0.003)
CT0.364 ***0.413 ***0.387 ***0.507 ***
(0.002)(0.017)(0.018)(0.032)
R20.0070.0330.0420.080
N3127312731273127
Note: The data come from the compilation of regression results. *** p < 0.01, ** p < 0.05, and * p < 0.1; values in parentheses are standard errors.
Table 5. Quantile regression results.
Variable NamePer Capita Household Income
Q25Q50Q75
EO0.363 ***0.309 ***0.268 ***
Control variables (CVs)YesYesYes
CT6.5566.4046.793
(0.033)(0.021)(0.022)
N312731273127
Note: The data come from the compilation of regression results. *** p < 0.01; values in parentheses are standard errors.
Table 6. Endogeneity test.
Variable Name2SLS
First StageSecond Stage
VEST0.487 ***
(0.069)
EO −0.282 ***
(0.047)
CVYesYes
CT0.572 ***0.378 ***
(0.082)(0.024)
Cragg–Donald–Wald F123.787
Wald chi2 197.84
Note: The data come from the compilation of regression results. *** p < 0.01.
Table 7. PSM regression results of EO on the FIG.
Matching MethodIntervention GroupControl GroupATT
One-to-one9.76610.549−0.783 ***
K-nearest neighbor9.76610.542−0.776 ***
Radius9.76610.543−0.777 ***
Nuclear9.76610.542−0.776 ***
Local linear regression9.76610.622−0.856 ***
Spline9.76610.762−0.996 ***
Mahalanobis9.76610.537−0.771 ***
Note: One-to-one matching has been put back; in k nearest neighbor matching, k is 4; in radius matching, a 0.001 radius is selected; in kernel matching, the kernel matching is normal and the bandwidth is 0.06. In local linear regression matching, the kernel function is normal and the bandwidth is 0.8. The 100 iterations of the self-service sampling method are used for spline matching; *** p < 0.01.
Table 8. Balance test of control variables.
Control VariablesMean Before MatchingMean After MatchingDeviation Rate (%)t-Test
InterventionControlInterventionControlBeforeAftert-Valuep > t
Gender0.9600.9570.9620.9481.57.10.700.482
Age51.67756.64252.12951.271−45.67.90.810.417
MS0.9870.9810.9860.9814.13.80.380.704
EA2.0141.8131.9811.91024.58.70.890.376
PA0.3180.2330.3140.26219.29.81.180.237
Health3.7444.5623.8103.691−82.09.91.180.239
TT0.2780.0500.2520.22464.58.10.690.493
AG5.7245.8425.7425.909−4.7−6.6−0.650.514
HCLS51.19921.57938.00535.91025.61.80.260.793
HLFS2.9422.5972.9383.03827.2−7.9−0.860.388
CP0.3810.2390.3570.34331.23.10.310.760
VT0.5430.5570.5480.48612.4−2.91.270.205
VL0.2600.2000.2570.21014.29.31.150.250
VTC24.07623.16623.73424.6815.3−5.5−0.550.581
VPR0.5610.6600.5570.581−20.4−4.9−0.490.623
VEL9.6249.4469.6059.57431.85.50.560.579
Table 9. Mediating mechanism test results.
Variable Name(1)(2)(3)
FIGDifferences in Labor Endowments NarrowedFIG
EO−0.019 ***0.005 ***−0.027 ***
(0.006)(0.001)(0.002)
DLER −0.067 ***
(0.003)
CVYesYesYes
CT0.365 ***0.367 ***0.327 ***
(0.002)(0.002)(0.009)
N312731273127
R20.0270.0020.076
Note: The data come from the compilation of regression results. *** p < 0.01; values in parentheses are standard errors.
Table 10. Regression results of heterogeneity analysis for different geographical locations.
Variable Name(1)(2)(3)
EastMiddleWest
EO−0.009−0.017 *−0.036 **
(0.011)(0.008)(0.012)
CVYesYesYes
CT0.515 ***0.673 ***0.460 ***
(0.059)(0.055)(0.058)
N8509171360
Note: The data come from the compilation of regression results. *** p < 0.01, ** p < 0.05, and * p < 0.1; values in parentheses are standard errors.
Table 11. Regression results of heterogeneity analysis for different agricultural functional zones.
Variable Name(1)(2)
Major Grain-Producing AreasNon-Major Grain-Producing Areas
EO−0.035 ***−0.017 *
(0.009)(0.007)
CVYesYes
CT0.372 ***0.358 ***
(0.002)(0.002)
N15911536
Note: The data come from the compilation of regression results. *** p < 0.01, and * p < 0.1; values in parentheses are standard errors.
Table 12. Regression results of heterogeneity analysis for different terrain conditions.
Variable Name(1)(2)
PlainMountainous Region
EO−0.012−0.038 ***
(0.008)(0.008)
CVYesYes
CT0.375 ***0.357 ***
(0.002)(0.002)
N13891738
Note: The data come from the compilation of regression results. *** p < 0.01; values in parentheses are standard errors.
Table 13. The influence of different EO scales on the FIG.
Variable Name(1)(2)
Large-scale EO−0.055 ***
(0.007)
Small-scale EO −0.021 ***
(0.005)
CVYesYes
CT0.364 ***0.362 ***
(0.002)(0.002)
N31273127
Note: The data come from the compilation of regression results. *** p < 0.01; values in parentheses are standard errors.
Table 14. The influence of different EO models on the FIG.
Variable Name(1)(2)
Platform EC−0.027 ***
(0.006)
Social EC −0.004
(0.003)
CVYesYes
CT0.364 ***0.363 ***
(0.002)(0.002)
N31273127
Note: The data come from the compilation of regression results. *** p < 0.01; values in parentheses are standard errors.
Disclaimer/Publisher’s Note: The statements, opinions and data contained in all publications are solely those of the individual author(s) and contributor(s) and not of MDPI and/or the editor(s). MDPI and/or the editor(s) disclaim responsibility for any injury to people or property resulting from any ideas, methods, instructions or products referred to in the content.

