

Impact of Accessibility to Educational Facilities on Commuters’ Transportation Choices: Married Females and School-Age Children


Abstract
1. Introduction
2. Literature Review
2.1. Factors Influencing Transportation Mode Choice Behavior
2.2. Accessibility to Education Facility and Transportation Mode Choice
3. Methodology
3.1. Data
3.2. Models for Empirical Analyses
3.3. Variables
4. Empirical Results and Discussion
4.1. The Probability of Using Public Transportation as a Mode of Commuting
4.2. Differences in Average Commuting Times by City
5. Discussion
6. Conclusions
Funding
Institutional Review Board Statement
Informed Consent Statement
Data Availability Statement
Acknowledgments
Conflicts of Interest
References
- Lee, B.S.; McDonald, J.F. Determinants of Commuting Time and Distance for Seoul Residents: The Impact of Family Status on the Commuting of Women. Urban Stud. 2003, 40, 1283–1302. [Google Scholar] [CrossRef]
- Lu, H.; Gan, H. Unraveling the Influence of Perceived Built Environment on Commute Mode Choice Based on Hybrid Choice Model. Appl. Sci. 2024, 14, 7921. [Google Scholar] [CrossRef]
- McQuaid, R.W.; Chen, T. Commuting Times—The Role of Gender, Children and Part-Time Work. Res. Transp. Econ. 2012, 34, 66–73. [Google Scholar] [CrossRef]
- Gimenez-Nadal, J.I.; Molina, J.A. Commuting Time and Household Responsibilities: Evidence Using Propensity Score Matching. J. Reg. Sci. 2016, 56, 332–359. [Google Scholar] [CrossRef]
- Ortúzar, J.D.; Willumsen, L.G. Modelling Transport, 4th ed.; Wiley Press: Oxford, UK, 2011; ISBN 978-0-470-76039-0. [Google Scholar]
- Truong, L.; Somenahalli, S.V.C. Exploring Frequency of Public Transport Use among Older Adults: A Study in Adelaide, Australia. Travel Behav. Soc. 2015, 2, 148–155. [Google Scholar] [CrossRef]
- Pettersson, P.; Schmöcker, J.D. Active Ageing in Developing Countries?—Trip Generation and Tour Complexity of Older People in Metro Manila. J. Transp. Geogr. 2010, 18, 613–623. [Google Scholar] [CrossRef]
- Jin, H.; Yu, J. Gender Responsiveness in Public Transit: Evidence from the 2017 US National Household Travel Survey. J. Urban Plan. Dev. 2021, 147, 04021021. [Google Scholar] [CrossRef]
- Nguyen, T.M.C.; Kato, H.; Phan, L.B. Is Built Environment Associated with Travel Mode Choice in Developing Cities? Evidence from Hanoi. Sustainability 2020, 12, 5773. [Google Scholar] [CrossRef]
- Batabyal, A.A.; Beladi, H. Commuting to Work in Cities: Bus, Car, or Train? Reg. Sci. Policy Pract. 2022, 13, 599–610. [Google Scholar] [CrossRef]
- Hjorthol, R.; Vågane, L. Allocation of Tasks, Arrangement of Working Hours and Commuting in Different Norwegian Households. J. Transp. Geogr. 2014, 35, 75–83. [Google Scholar] [CrossRef]
- Wheatley, D. Travel-to-Work and Subjective Well-Being: A Study of UK Dual Career Households. J. Transp. Geogr. 2014, 39, 187–196. [Google Scholar] [CrossRef]
- Campaña, J.C.; Gimenez-Nadal, J.I. Gender Gaps in Commuting Time: Evidence from Peru, Ecuador, Chile, and Colombia. J. Fam. Econ. Iss. 2024, 45, 596–620. [Google Scholar] [CrossRef]
- Marcén, M.; Morales, M. Culture and the Cross-Country Differences in the Gender Commuting Gap. J. Transp. Geogr. 2021, 96, 103184. [Google Scholar] [CrossRef]
- Lejsková, P.; Pojkarová, K.; Kudláčková, N.; Becková, H.; Čubranić-Dobrodolac, M. Gender Differences in Transport Behaviour Patterns. LOGI–Sci. J. Transp. Logist. 2023, 14, 329–340. [Google Scholar] [CrossRef]
- Liu, Y.; Min, S.; Shi, Z.; He, M. Exploring Students’ Choice of Active Travel to School in Different Spatial Environments: A Case Study in a Mountain City. J. Transp. Geogr. 2024, 115, 103795. [Google Scholar] [CrossRef]
- Wang, X.; Shao, C.; Yin, C.; Guan, L. Built Environment, Life Events and Commuting Mode Shift: Focus on Gender Differences. Transp. Res. Part D Transp. Environ. 2020, 88, 102598. [Google Scholar] [CrossRef]
- Hayauchi, G.; Nakamura, F.; Ariyoshi, R.; Tanaka, S.; Miura, S. A Study on Influence of Topographical Factors to Mode Choice. J. Jap. Soc. Civil Eng. 2019, 75, 565–574. [Google Scholar] [CrossRef]
- Sun, B.D.; Ermagun, A.; Dan, B. Built Environmental Impacts on Commuting Mode Choice and Distance: Evidence from Shanghai. Transp. Res. Part D Transp. Environ. 2017, 52, 441–453. [Google Scholar] [CrossRef]
- Hasan, A. Development of Intercity Mode Choice Models for Saudi Arabia. J. King Abdulaziz univ. Eng. Sci. 2006, 17, 3–21. [Google Scholar] [CrossRef]
- Assi, K.J.; Nahiduzzaman, K.M.; Ratrout, N.T.; Aldosary, A.S. Mode Choice Behavior of High School Goers: Evaluating Logistic Regression and MLP Neural Networks. Case Stud. Transp. Policy 2018, 6, 225–230. [Google Scholar] [CrossRef]
- Stewart, O.; Moudon, A.V.; Claybrooke, C. Common Ground: Eight Factors that Influence Walking and Biking to School. Transp. Policy 2012, 24, 240–248. [Google Scholar] [CrossRef]
- Zhang, R.; Yao, E.; Liu, Z. School Travel Mode Choice in Beijing, China. J. Transp. Geogr. 2017, 62, 98–110. [Google Scholar] [CrossRef]
- Singh, N.; Vasudevan, V. Understanding School Trip Mode Choice—The Case of Kanpur (India). J. Transp. Geogr. 2018, 66, 283–290. [Google Scholar] [CrossRef]
- Ahern, S.M.; Arnott, B.; Chatterton, T.; De Nazelle, A.; Kellar, I.; McEachan, R.R.C. Understanding Parents’ School Travel Choices: A Qualitative Study Using the Theoretical Domains Framework. J. Transp. Health 2017, 4, 278–293. [Google Scholar] [CrossRef]
- Fitzhugh, E.C.; Everett, J.; Daugherty, L. What Parental Correlates Predict Children’s Active Transportation to School in the Southeast United States? J. Phys. Act. Health 2021, 18, 705–713. [Google Scholar] [CrossRef]
- Guthrie, A.; Fan, Y. Weakening Obstacles to Transit Use: Changes in Relationships with Child Rearing and Automobile Access from 2000 to 2010. Transp. Res. Rec. 2016, 2561, 103–110. [Google Scholar] [CrossRef]
- Echeverria, L.; Gimenez-Nadal, J.; Molina, J.A. Commuting in Dual-Earner Households: International Gender Differences with Time Use Surveys. Rev. Econ. Househ. 2024, 1–23. [Google Scholar] [CrossRef]
- Yang, H.C.; Jin, L.; Lazar, A.; Todd-Blick, A.; Sim, A.; Wu, K.; Chen, Q.; Spurlock, C. Gender Gaps in Mode Usage, Vehicle Ownership, and Spatial Mobility When Entering Parenthood: A Life Course Perspective. Systems 2023, 11, 314. [Google Scholar] [CrossRef]
- Borghorst, M.; Mulalic, I.; Van Ommeren, J. Commuting, Children and the Gender Wage Gap. In Tinbergen Institute Discussion Paper; 2021; TI 2021-089/VIII, pp. 1–48. Available online: https://papers.tinbergen.nl/21089.pdf (accessed on 22 April 2025).
- Borghorst, M.; Mulalic, I.; Ommeren, J. Commuting, Gender and Children. J. Urban Econ. 2024, 144, 103709. [Google Scholar] [CrossRef]
- Ma, S.; Yin, X.; Tang, D.; Liu, C. An Analysis of Residents’ Commuting Behavior Considering Household Heterogeneity. J. Phys. Conf. Ser. 2019, 1168, 032100. [Google Scholar] [CrossRef]
- Liu, Y.; Shen, R.; He, M.; Li, X.; Shi, Z. Gender Differences in Commuting Travel Mode Choices among Young Adults: A Spatial Heterogeneity Perspective. J. Transp. Geogr. 2025, 123, 104145. [Google Scholar] [CrossRef]

| Variables | Mean | Std. Dev. | Min. | Max. |
|---|---|---|---|---|
| (a) | ||||
| Use of public transit (1 for city bus, express/intercity bus, subway/train; 0 for passenger car or small van) | 0.323 | 0.468 | 0 | 1 |
| Age | 45.007 | 12.546 | 17 | 85 |
| Educational attainments | ||||
| No schooling | 0.001 | 0.032 | 0 | 1 |
| Elementary school | 0.016 | 0.125 | 0 | 1 |
| Middle school | 0.044 | 0.206 | 0 | 1 |
| High school | 0.324 | 0.468 | 0 | 1 |
| College | 0.180 | 0.384 | 0 | 1 |
| University | 0.357 | 0.479 | 0 | 1 |
| Master’s | 0.060 | 0.238 | 0 | 1 |
| PhD | 0.018 | 0.133 | 0 | 1 |
| Employment status | ||||
| Paid worker | 0.823 | 0.382 | 0 | 1 |
| Self-employed w/o employees | 0.106 | 0.308 | 0 | 1 |
| Self-employed w/ employees | 0.052 | 0.222 | 0 | 1 |
| Non-paid family worker | 0.019 | 0.138 | 0 | 1 |
| Marital status | ||||
| Single | 0.277 | 0.447 | 0 | 1 |
| Have a spouse | 0.638 | 0.481 | 0 | 1 |
| Widowed | 0.023 | 0.149 | 0 | 1 |
| Divorced | 0.062 | 0.241 | 0 | 1 |
| Occupation | ||||
| Managers | 0.009 | 0.096 | 0 | 1 |
| Professionals and related workers | 0.218 | 0.413 | 0 | 1 |
| Clerks | 0.228 | 0.42 | 0 | 1 |
| Service workers | 0.118 | 0.322 | 0 | 1 |
| Sales workers | 0.109 | 0.312 | 0 | 1 |
| Agriculture, forestry, and fisheries skilled workers | 0.021 | 0.143 | 0 | 1 |
| Craft and related trades workers | 0.091 | 0.287 | 0 | 1 |
| Plant and machine operators and assemblers | 0.117 | 0.321 | 0 | 1 |
| Elementary workers | 0.082 | 0.275 | 0 | 1 |
| Armed forces | 0.007 | 0.086 | 0 | 1 |
| Duration in current job | ||||
| Less than 6 months | 0.071 | 0.256 | 0 | 1 |
| 6 months to 1 year | 0.070 | 0.255 | 0 | 1 |
| 1 to 3 years | 0.154 | 0.361 | 0 | 1 |
| 3 to 5 years | 0.122 | 0.327 | 0 | 1 |
| 5 to 10 years | 0.178 | 0.383 | 0 | 1 |
| 10 to 15 years | 0.145 | 0.352 | 0 | 1 |
| 15 to 20 years | 0.084 | 0.278 | 0 | 1 |
| At least 20 years | 0.176 | 0.381 | 0 | 1 |
| Number of pre-school kids | 0.158 | 0.456 | 0 | 5 |
| Number of elementary school kids | 0.029 | 0.171 | 0 | 2 |
| Number of middle school kids | 0.087 | 0.309 | 0 | 3 |
| Number of high school kids | 0.086 | 0.303 | 0 | 4 |
| Number of commuters | 1.782 | 0.789 | 1 | 11 |
| Length of residing in current housing unit | ||||
| Less than 1 year | 0.138 | 0.345 | 0 | 1 |
| 1 to 2 years | 0.127 | 0.333 | 0 | 1 |
| 2 to 3 years | 0.102 | 0.302 | 0 | 1 |
| 3 to 5 years | 0.151 | 0.358 | 0 | 1 |
| 5 to 10 years | 0.186 | 0.389 | 0 | 1 |
| 10 to 15 years | 0.116 | 0.321 | 0 | 1 |
| 15 to 20 years | 0.063 | 0.244 | 0 | 1 |
| 20 to 25 years | 0.051 | 0.22 | 0 | 1 |
| At least 25 years | 0.065 | 0.247 | 0 | 1 |
| Type of housing unit | ||||
| Single-detached | 0.238 | 0.426 | 0 | 1 |
| Apartment | 0.595 | 0.491 | 0 | 1 |
| Townhouse | 0.025 | 0.157 | 0 | 1 |
| Multi-generational housing | 0.095 | 0.293 | 0 | 1 |
| Unit in non-residential building | 0.010 | 0.101 | 0 | 1 |
| Officetel | 0.031 | 0.173 | 0 | 1 |
| Room in a hotel, inn, or other lodging facility | 0.001 | 0.025 | 0 | 1 |
| Dormitory and social facilities | 0.000 | 0.017 | 0 | 1 |
| Shack or vinyl house | 0.000 | 0.015 | 0 | 1 |
| Others | 0.003 | 0.058 | 0 | 1 |
| (b) | ||||
| Elementary school kids by private car | 4.2 | 1.7 | 2.3 | 15.6 |
| Elementary school kids by public transit | 12.0 | 8.4 | 4.4 | 45.6 |
| Middle school kids by private car | 5.6 | 2.5 | 3.1 | 22.5 |
| Middle school kids by public transit | 16.6 | 10.5 | 6.1 | 57.4 |
| High school kids by private car | 8.0 | 8.7 | 3.9 | 120 |
| High school kids by public transit | 20.0 | 13.2 | 6.9 | 120 |
| Variables | Female | Male |
|---|---|---|
| Age | 0.001 | 0.007 ** |
| (−1.22) | (−8.65) | |
| Education (reference: no schooling) | ||
| Elementary school | −0.492 ** | −0.754 ** |
| (−3.12) | (−2.81) | |
| Middle school | −1.017 ** | −1.142 ** |
| (−6.56) | (−4.29) | |
| High school | −1.462 ** | −1.444 ** |
| (−9.48) | (−5.45) | |
| College | −1.584 ** | −1.519 ** |
| (−10.19) | (−5.72) | |
| University | −1.531 ** | −1.196 ** |
| (−9.86) | (−4.51) | |
| Master’s | −1.721 ** | −1.094 ** |
| (−10.95) | (−4.11) | |
| PhD | −1.697 ** | −1.233 ** |
| (−10.28) | (−4.60) | |
| Employment status (reference: paid worker) | ||
| Self-employed without employees | −0.633 ** | −0.558 ** |
| (−26.49) | (−24.63) | |
| Self-employed with employees | −1.035 ** | −1.011 ** |
| (−28.19) | (−30.98) | |
| Non-paid family worker | −0.695 ** | −0.116 + |
| (−16.86) | (−1.91) | |
| Marital status (reference: single) | ||
| Have a spouse | −1.048 ** | −0.764 ** |
| (−52.09) | (−40.87) | |
| Widowed | −0.491 ** | −0.490 ** |
| (−13.09) | (−7.40) | |
| Divorced | −0.753 ** | −0.540 ** |
| (−26.44) | (−17.32) | |
| Occupation (reference: manager) | ||
| Professionals and related workers | 0.724 ** | 0.534 ** |
| (−6.77) | (−8.66) | |
| Clerks | 0.761 ** | 0.356 ** |
| (−7.09) | (−5.76) | |
| Service workers | 0.627 ** | 0.344 ** |
| (−5.8) | (−5.14) | |
| Sales workers | 0.748 ** | 0.291 ** |
| (−6.85) | (−4.48) | |
| Agriculture, forestry, and fisheries skilled workers | 0.106 | −0.283 * |
| (−0.57) | (−2.35) | |
| Craft and related trades workers | 1.027 ** | 0.186 ** |
| (−9.07) | (−2.90) | |
| Plant and machine operators and assemblers | 0.556 ** | 0.053 |
| (−4.95) | (−0.83) | |
| Elementary workers | 0.962 ** | 0.376 ** |
| (−8.81) | (−5.84) | |
| Armed forces | −2.226 ** | −1.483 ** |
| (−5.07) | (−11.11) | |
| Duration on current job (reference: less than six months) | ||
| 6 months to 1 year | −0.277 ** | −0.222 ** |
| (−9.56) | (−7.49) | |
| 1 to 3 years | −0.290 ** | −0.399 ** |
| (−11.62) | (−15.67) | |
| 3 to 5 years | −0.393 ** | −0.569 ** |
| (−14.90) | (−21.19) | |
| 5 to 10 years | −0.432 ** | −0.586 ** |
| (−17.15) | (−22.90) | |
| 10 to 15 years | −0.476 ** | −0.578 ** |
| (−17.63) | (−21.51) | |
| 15 to 20 years | −0.586 ** | −0.617 ** |
| (−18.21) | (−20.46) | |
| At least 20 years | −0.655 ** | −0.662 ** |
| (−21.65) | (−24.27) | |
| Number of kids in the household | ||
| Pre-school | −0.239 ** | −0.069 ** |
| (−13.76) | (−4.58) | |
| Elementary school | −0.258 ** | −0.082 * |
| (−6.79) | (−2.17) | |
| Middle school | −0.228 ** | −0.141 ** |
| (−10.76) | (−6.36) | |
| High school | −0.120 ** | −0.068 ** |
| (−5.85) | (−3.13) | |
| Number of commuters in the household | 0.133 ** | 0.143 ** |
| (−16.04) | (−18.71) | |
| Duration of residing in the current household (ref.: less than 1 year) | ||
| 1 to 2 years | −0.062 ** | 0.03 |
| (−2.60) | (−1.34) | |
| 2 to 3 years | −0.101 ** | 0.008 |
| (−4.00) | (−0.34) | |
| 3 to 5 years | −0.085 ** | 0.093 ** |
| (−3.70) | (−4.32) | |
| 5 to 10 years | −0.143 ** | 0.006 |
| (−6.46) | (−0.27) | |
| 10 to 15 years | −0.161 ** | −0.012 |
| (−6.51) | (−0.49) | |
| 15 to 20 years | −0.074 * | 0.089 ** |
| (−2.52) | (−3.12) | |
| 20 to 25 years | −0.012 | 0.018 |
| (−0.38) | (−0.57) | |
| At least 25 years | −0.351 ** | −0.197 ** |
| (−11.18) | (−6.44) | |
| Type of housing unit (reference: single-detached) | ||
| Apartment | −0.047 ** | −0.013 |
| (−3.03) | (−0.87) | |
| Townhouse | 0.135 ** | 0.120 ** |
| (−3.49) | (−3.11) | |
| Multi-generational housing | 0.849 ** | 0.642 ** |
| (−36.15) | (−29.89) | |
| Unit in non-residential building | 0.401 ** | 0.516 ** |
| (−6.86) | (−9.67) | |
| Officetel | 0.653 ** | 0.480 ** |
| (−17.55) | (−14.42) | |
| Room in a hotel, inn, or other lodging facility | 1.438 ** | 1.012 ** |
| (−4.58) | (−5.3) | |
| Dormitory and social facilities | 0.072 | −0.182 |
| (−0.16) | (−0.52) | |
| Shack or vinyl house | −0.639 + | −0.871 |
| (−1.72) | (−1.32) | |
| Others | −0.382 ** | 0.390 ** |
| (−3.33) | (−4.15) | |
| Constant | 0.169 | −0.723 * |
| (−0.72) | (−2.45) | |
| Observations | 132,112 | 185,691 |
| Pseudo R-squared | 0.127 | 0.108 |
| Log-L | −79,303 | −90,385 |
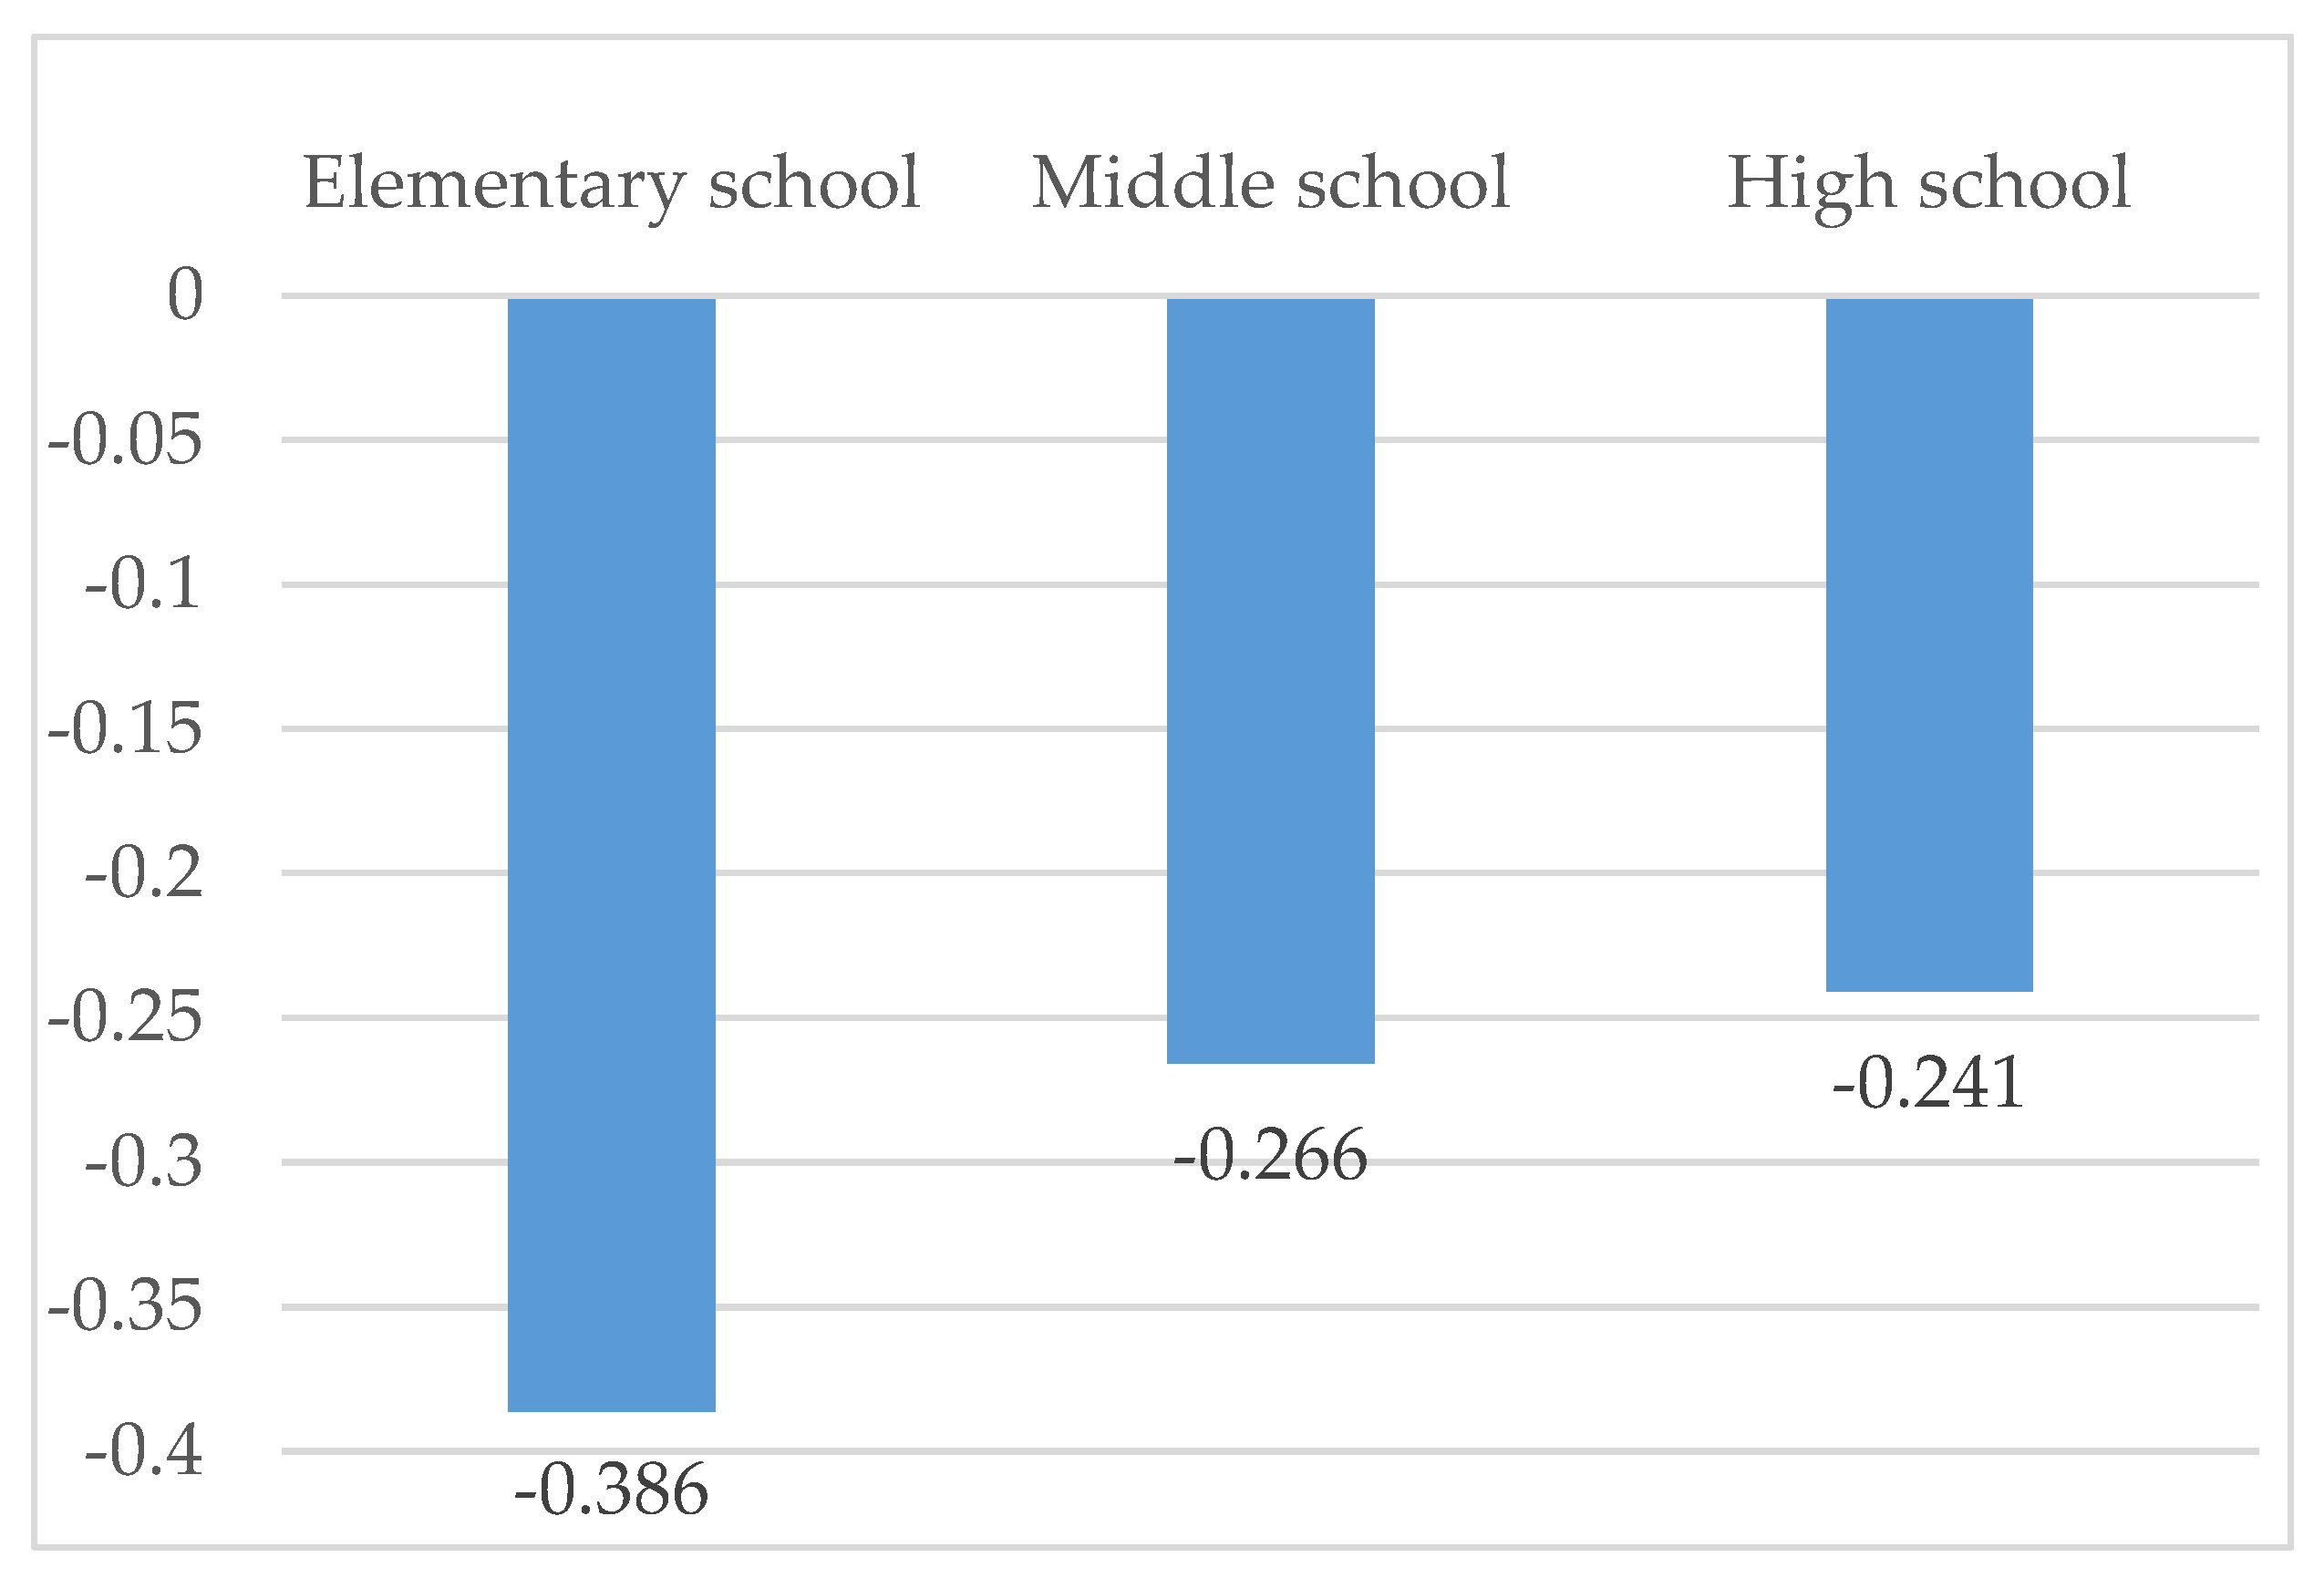
| Variables | (1) | (2) | (3) |
|---|---|---|---|
| ΔTj | |||
| Elementary school | −0.386 ** | ||
| (−6.40) | |||
| Middle school | −0.266 ** | ||
| (−9.61) | |||
| High school | −0.241 ** | ||
| (−11.59) | |||
| Observations | 9179 | 24,987 | 25,156 |
| Pseudo R-squared | 0.15 | 0.156 | 0.175 |
| Log-L | −4126 | −11,264 | −11,756 |
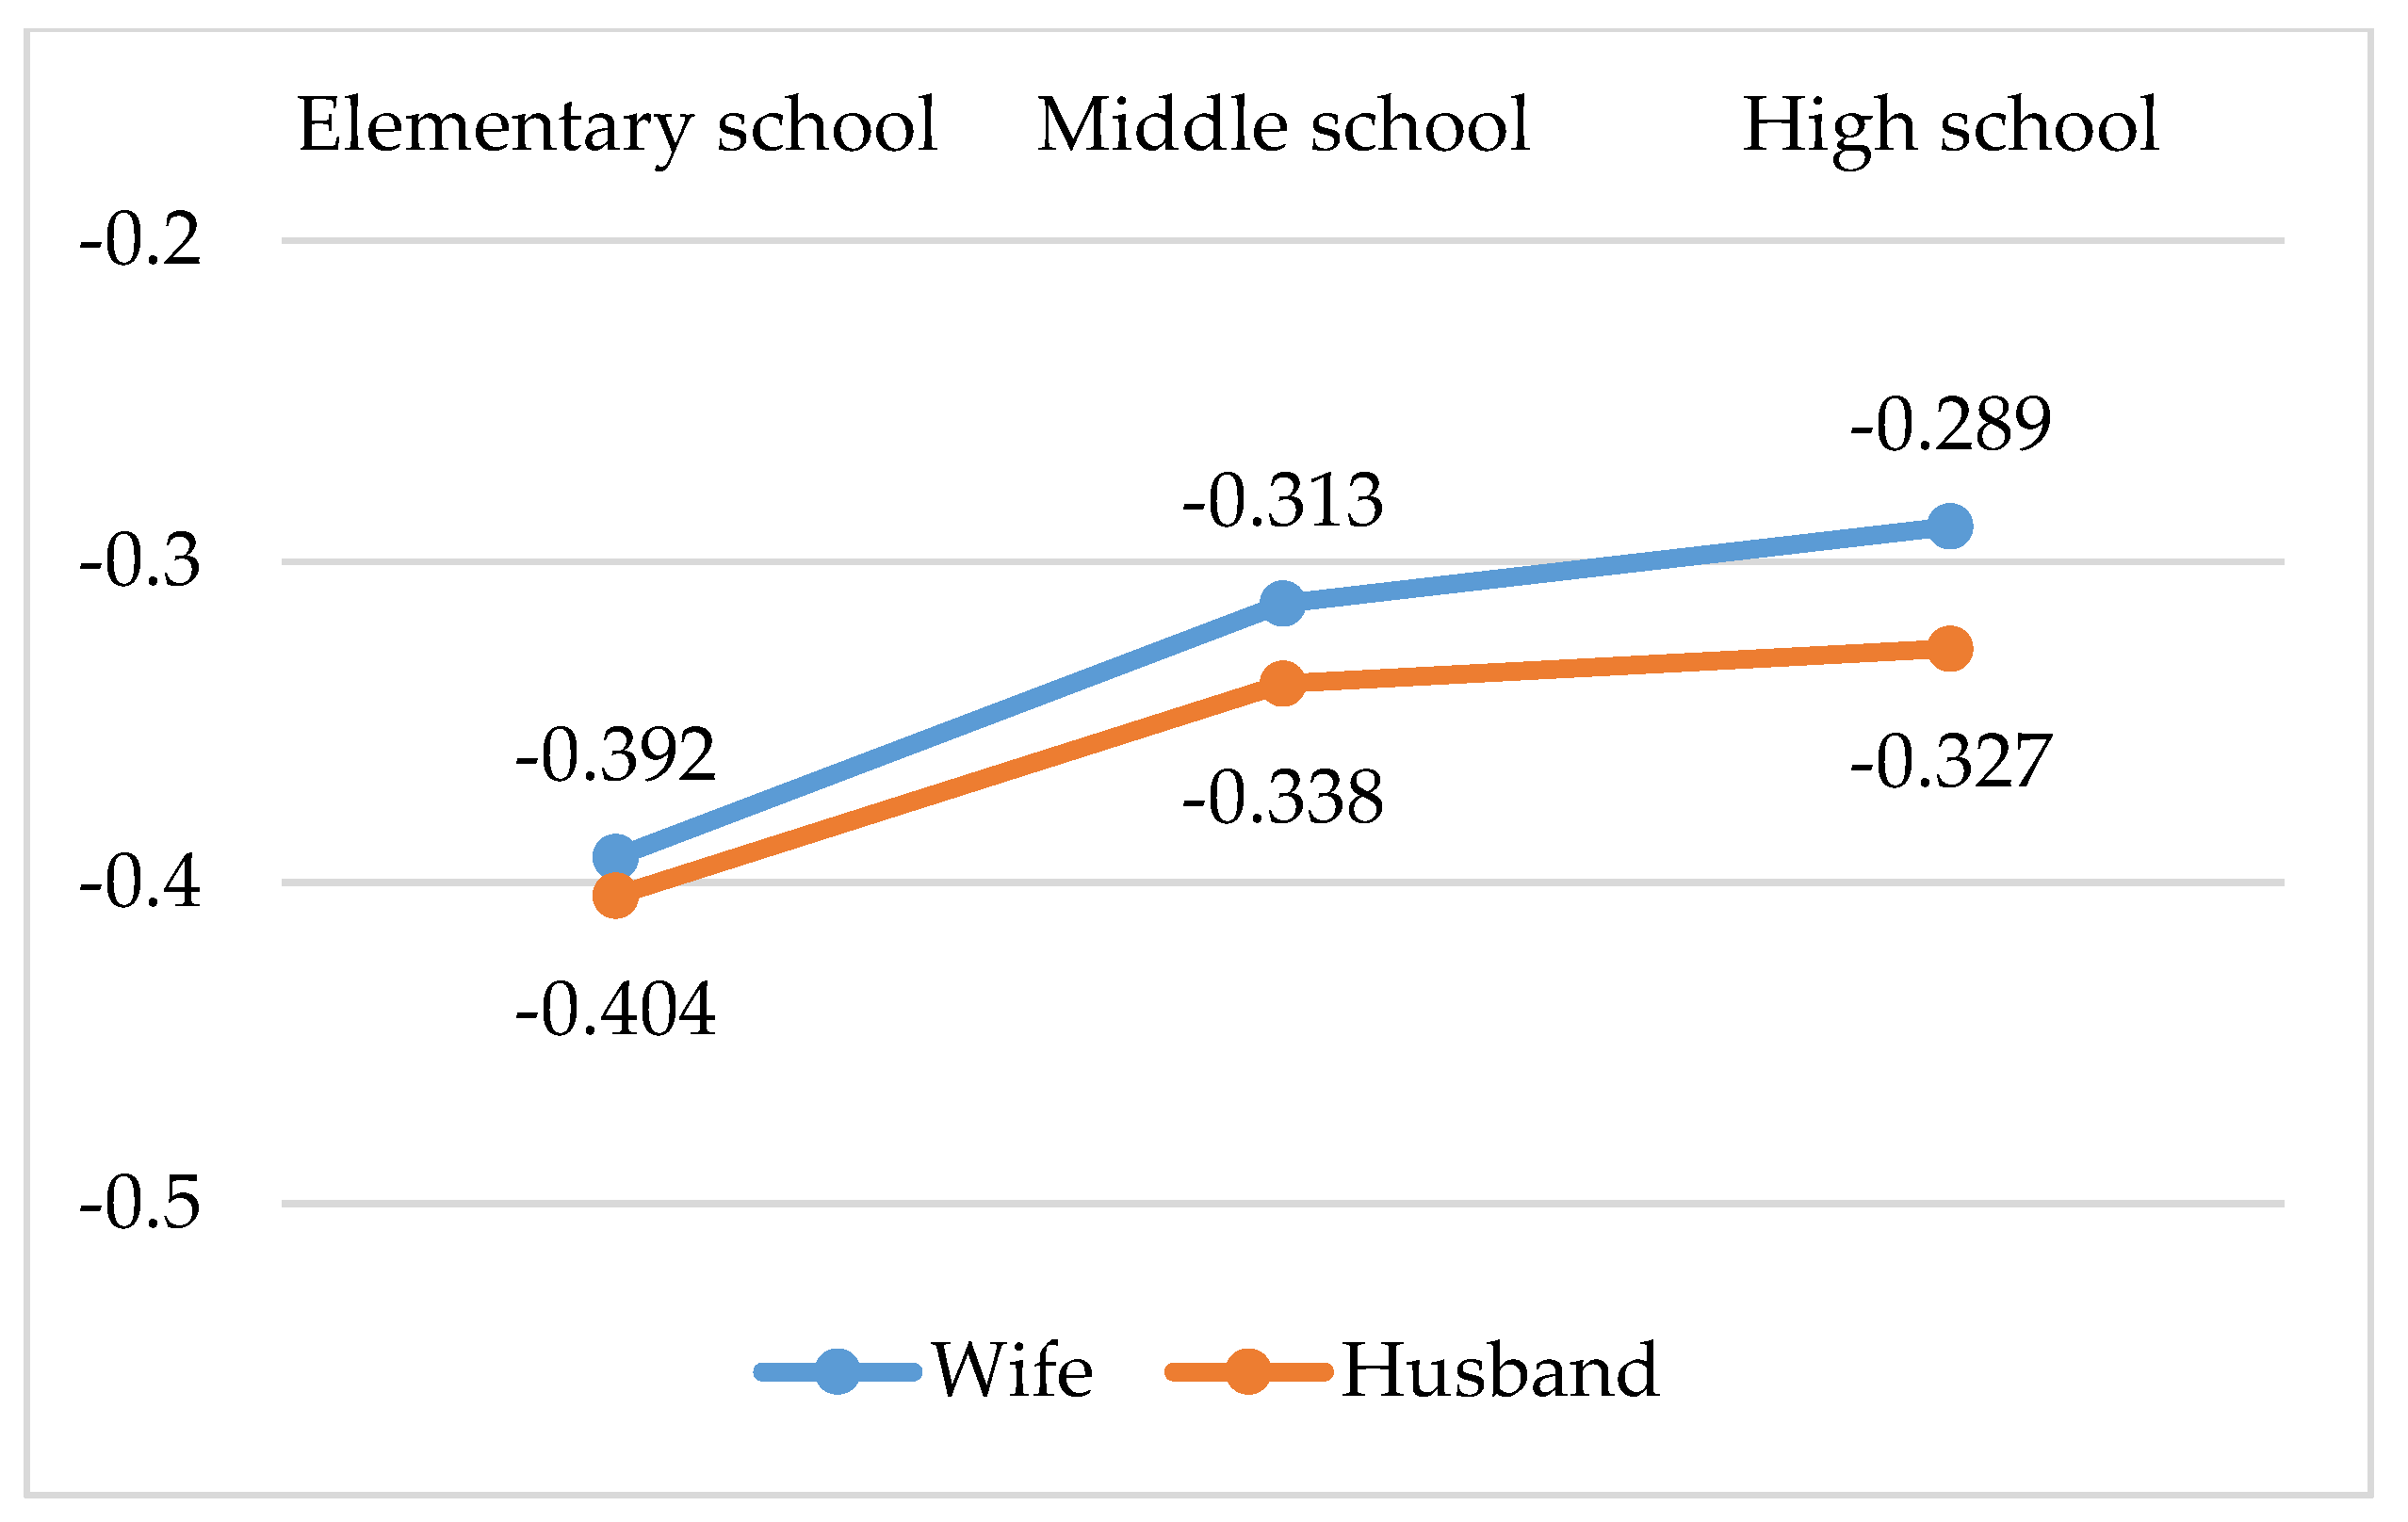
| Variables | (1) | (2) | (3) | |||
|---|---|---|---|---|---|---|
| Wife | Husband | Wife | Husband | Wife | Husband | |
| ΔTj | ||||||
| Elementary school | −0.392 ** | −0.404 ** | ||||
| (−6.09) | (−4.24) | |||||
| Middle school | −0.313 ** | −0.338 ** | ||||
| (−7.29) | (−5.35) | |||||
| High school | −0.289 ** | −0.327 ** | ||||
| (−8.33) | (−7.13) | |||||
| Observations | 3816 | 5360 | 3816 | 5360 | 3816 | 5360 |
| Pseudo R-squared | 0.171 | 0.158 | 0.186 | 0.172 | 0.192 | 0.183 |
| Log-L | −1910 | −2069 | −1875 | −2034 | −1862 | −2009 |
Disclaimer/Publisher’s Note: The statements, opinions and data contained in all publications are solely those of the individual author(s) and contributor(s) and not of MDPI and/or the editor(s). MDPI and/or the editor(s) disclaim responsibility for any injury to people or property resulting from any ideas, methods, instructions or products referred to in the content. |
© 2025 by the author. Licensee MDPI, Basel, Switzerland. This article is an open access article distributed under the terms and conditions of the Creative Commons Attribution (CC BY) license (https://creativecommons.org/licenses/by/4.0/).
Share and Cite
Kim, W. Impact of Accessibility to Educational Facilities on Commuters’ Transportation Choices: Married Females and School-Age Children. Sustainability 2025, 17, 3920. https://doi.org/10.3390/su17093920
Kim W. Impact of Accessibility to Educational Facilities on Commuters’ Transportation Choices: Married Females and School-Age Children. Sustainability. 2025; 17(9):3920. https://doi.org/10.3390/su17093920
Chicago/Turabian StyleKim, Wonchul. 2025. "Impact of Accessibility to Educational Facilities on Commuters’ Transportation Choices: Married Females and School-Age Children" Sustainability 17, no. 9: 3920. https://doi.org/10.3390/su17093920
APA StyleKim, W. (2025). Impact of Accessibility to Educational Facilities on Commuters’ Transportation Choices: Married Females and School-Age Children. Sustainability, 17(9), 3920. https://doi.org/10.3390/su17093920