
Obtaining New Materials from Liquid Pyrolysis Products of Used Tires for Waste Valorization

 ,
,  ,
,  ,
,  ,
,
Abstract
1. Introduction
2. Materials and Methods
2.1. Materials
2.2. Methods
2.2.1. Resin Synthesis
2.2.2. Extraction Separation
2.2.3. Method of Modification of Waterproofing Mastic with GF Extract
2.3. Methods of Analysis
2.3.1. Gas Chromatography with Mass Spectrometric Detection
2.3.2. IR Spectroscopy
2.3.3. Determination of Physical and Technological Indicators
2.3.4. Cost-Effectiveness Assessment
3. Results
3.1. Analysis of fr. ≤ 200 and the Feasibility of Its Use
3.2. Obtaining Commercial Gasoline
3.2.1. Polycondensation with Formaldehyde
3.2.2. Extraction
3.2.3. Obtaining Gasoline
3.3. Application of the Extract
3.4. The Economic Efficiency of the Researched Processes
4. Conclusions
Author Contributions
Funding
Institutional Review Board Statement
Informed Consent Statement
Data Availability Statement
Conflicts of Interest
References
- Zhang, M.; Qi, Y.; Zhang, W.; Wang, M.; Li, J.; Lu, Y.; Zhang, S.; He, J.; Cao, H.; Tao, X.; et al. A review on waste tires pyrolysis for energy and material recovery from the optimization perspective. Renew. Sustain. Energy Rev. 2024, 199, 114531. [Google Scholar] [CrossRef]
- Serrano, D.; Horvat, A.; Batuecas, E.; Abelha, P. Waste tyres valorisation through gasification in a bubbling fluidised bed: An exhaustive gas composition analysis. Renew. Energy 2022, 200, 1438–1446. [Google Scholar] [CrossRef]
- Al-Qadri, A.A.; Ahmed, U.; Ahmad, N.; Jameel, A.G.A.; Zahid, U.; Naqvi, S.R. A review of hydrogen generation through gasification and pyrolysis of waste plastic and tires: Opportunities and challenges. Int. J. Hydrogen Energy 2024, 77, 1185–1204. [Google Scholar] [CrossRef]
- Arumugam, D.B.; Ganesan, M.C. A Review on Valorisation of Waste Tire with Lignocellulose Catalytic Co-Pyrolysis to High Value Products. Mater. Today Proc. 2023, in press. [CrossRef]
- Ramani, B.; Anjum, A.; Bramer, E.; Dierkes, W.; Blume, A.; Brem, G. A comprehensive study on the effect of the pyrolysis temperature on the products of the flash pyrolysis of waste tires. J. Environ. Chem. Eng. 2025, 13, 115468. [Google Scholar] [CrossRef]
- Hashamfirooz, M.; Dehghani, M.H.; Khanizadeh, M.; Aghaei, M.; Bashardoost, P.; Hassanvand, M.S.; Hassanabadi, M.; Momeniha, F. A systematic review of the environmental and health effects of waste tires recycling. Heliyon 2025, 11, e41909. [Google Scholar] [CrossRef]
- Pyshyev, S.; Lypko, Y.; Demchuk, Y.; Kukhar, O.; Korchak, B.; Pochapska, I.; Zhytnetskyi, I. Characteristics and applications of waste tire pyrolysis products: A review. Chem. Chem. Technol. 2024, 18, 244–257. [Google Scholar] [CrossRef]
- Dewang, Y.; Sharma, V.; Singla, Y.K. A critical review of waste tire pyrolysis for diesel engines: Technologies, challenges, and future prospects. Sustain. Mater. Technol. 2025, 43, e01291. [Google Scholar] [CrossRef]
- Suiuay, C.; Katekaew, S.; Senawong, K.; Junsiri, C.; Srichat, A.; Laloon, K. Pilot-scale production of gasoline and diesel-like fuel from natural rubber scrap: Fractional condensation of pyrolysis vapors and optimization of pyrolysis parameters by using response surface methodology (RSM). Fuel 2024, 364, 131059. [Google Scholar] [CrossRef]
- Moonsin, P.; Roschat, W.; Phewphong, S.; Watthanalao, S.; Maneerat, B.; Arthan, S.; Thammayod, A.; Leelatam, T.; Yoosuk, B.; Janetaisong, P.; et al. The physicochemical properties of liquid biofuel derived from the pyrolysis of low-quality rubber waste. Case Stud. Chem. Environ. Eng. 2025, 11, 101085. [Google Scholar] [CrossRef]
- Czajczyńska, D.; Krzyżyńska, R.; Ghazal, H.; Jouhara, H. Experimental investigation of waste tyres pyrolysis gas desulfurization through absorption in alkanolamines solutions. Int. J. Hydrogen. Energ. 2024, 52, 1006–1014. [Google Scholar] [CrossRef]
- Jankovská, Z.; Peikertová, P.; Tokarský, J.; Matějová, L. Carbons prepared by microwave co-pyrolysis of waste scrap tyres and corn cob: Effect of cation size and charge on xylene adsorption. J. Environ. Chem. Eng. 2024, 12, 114374. [Google Scholar] [CrossRef]
- Pyshyev, S.; Lypko, Y.; Korchak, B.; Poliuzhyn, I.; Hubrii, Z.; Pochapska, I.; Rudnieva, K. Study on the composition of gasoline fractions obtained as a result of waste tires pyrolysis and production bitumen modifiers from it. J. Energy Inst. 2024, 114, 101598. [Google Scholar] [CrossRef]
- Pyshyev, S.; Lypko, Y.; Chervinskyy, T.; Fedevych, O.; Kułażyński, M.; Pstrowska, K. Application of tyre derived pyrolysis oil as a fuel component. S. Afr. J. Chem. Eng. 2023, 43, 342–347. [Google Scholar] [CrossRef]
- Alzahrani, N.; Nahil, M.A.; Williams, P.T. Co-pyrolysis of waste plastics and tires: Influence of interaction on product oil and gas composition. J. Energy Inst. 2025, 118, 101908. [Google Scholar] [CrossRef]
- Rodak, A.; Haponiuk, J.; Wang, S.; Formela, K. Waste tire rubber with low and high devulcanization level prepared in the planetary extruder. Sustain. Mater. Technol. 2025, 43, e01193. [Google Scholar] [CrossRef]
- Saputra, R.; Walvekar, R.; Khalid, M.; Mubarak, N.M.; Sillanpää, M. Current progress in waste tire rubber devulcanization. Chemosphere 2021, 265, 129033. [Google Scholar] [CrossRef]
- Straka, P.; Auersvald, M.; Vrtiška, D.; Kittel, H.; Šimáček, P.; Vozka, P. Production of transportation fuels via hydrotreating of scrap tires pyrolysis oil. Chem. Eng. J. 2023, 460, 141764. [Google Scholar] [CrossRef]
- Pychyev, S.; Lypko, Y.; Korchak, B.; Niavkevich, M.; Rudnieva, K. Investigation of the extraction separation of gasoline fractions obtained as a result of pyrolysis of waste tires. J. Coal Chem. 2023, 6, 28–37. [Google Scholar]
- DSTU 7687:2015; Euro Motor Gasoline. Technical Conditions. UkrNDNC SE: Kyiv, Ukraine, 2015.
- Pyshyev, S.; Demchuk, Y.; Gunka, V.; Sidun, I.; Shved, M.; Bilushchak, H.; Obshta, A. Development of mathematical model and identification of optimal conditions to obtain phenol-cresol-formaldehyde resin. Chem. Chem. Technol. 2019, 13, 212–217. [Google Scholar] [CrossRef]
- Lypko, Y. Development of Methods for the Use of Liquid Products of Thermal Destruction of Waste Tires. 2024. Available online: https://lpnu.ua/sites/default/files/2024/radaphd/27676/lypko-disertaciya.pdf (accessed on 24 May 2024).
- Chen, F.; Zhang, Y.; Wang, Y.; Zhao, L.; Gao, J.; Hao, T.; Xu, C. High efficiency separation of olefin from FCC naphtha: Influence of combined solvents and related extraction conditions. Fuel Process. Technol. 2020, 208, 106497. [Google Scholar] [CrossRef]
- National Institute of Standards and Technology (NIST). Chemistry WebBook: Name Search. Available online: https://webbook.nist.gov/chemistry/name-ser/ (accessed on 30 December 2024).
- DSTU EN 13016-1:2012; Petroleum Products—Liquid. Saturated Vapor Pressure. Part 1: Determination of the Saturated Vapor Pressure with Air Content (ASVP) and Calculation of the Equivalent Dry Vapor Pressure (DVPE) (EN 13016-1:2007, IDT). UkrRIORI “MASMA”: Kyiv, Ukraine, 2012.
- DSTU 7261:2012; Technical Chemical Products. Methods for Determining the Density of Liquids. Technical Committee for Standardization “Analysis of Gases, Liquids and Solids” (TC 122), State Enterprise “All-Ukrainian State Scientific and Production Center for Standardization, Metrology, Certification and Consumer Rights Protection” of the Ministry of Economic Development of Ukraine (“Ukrmetr-teststandart”): Kyiv, Ukraine, 2012.
- DSTU EN ISO 2160:2012; Petroleum Products. Method for Determination of the Corrosive Effect on Copper Plate (EN ISO 2160:1998, IDT). UkrRIORI “MASMA”: Kyiv, Ukraine, 2012.
- GOST 6307-75; Petroleum Products. Method for Determining the Presence of Water-Soluble Acids and Alkalis. With Amendment No. 1. Technical Committee for Standardization “Standardization of Refined Petroleum Products and Petrochemicals” (TC 38): Kyiv, Ukraine, 2022.
- DSTU EN ISO 20884:2012; Petroleum Products. Method for the Determination of Sulfur Content in Motor Vehicle Fuels by Wavelength Dispersive X-Ray Fluorescence Spectrometry (EN ISO 20884:2011, IDT). UkrRIORI “MASMA”: Kyiv, Ukraine, 2012.
- DSTU GOST 18995.2:2009; Chemical Liquid Products. Method for Determination of Refractive Index (GOST 18995.2-73, IDT). UkrNDNC SE: Kyiv, Ukraine, 2009.
- Auersvald, M.; Staš, M.; Šimáček, P. Electrometric bromine number as a suitable method for the quantitative determination of phenols and olefins in hydrotreated pyrolysis bio-oils. Talanta 2021, 225, 122001. [Google Scholar] [CrossRef] [PubMed]
- GOST 2177-99; Petroleum Products. Methods for Determining Fractional Composition. Interstate Council for Standardization, Metrology and Certification: Minsk, Belarus, 1999.
- DSTU EN ISO 868:2017; Plastics and Ebonite—Determination of Indentation Hardness Using a Durometer (Shore Hardness) (EN ISO 868:2003, IDT.; ISO 868:2003, IDT). International Organization for Standardization: Geneva, Switzerland, 2019.
- DSTU EN ISO 1183-1:2022; Plastics—Methods for Determining the Density of Non-Cellular Plastics—Part 1: Immersion, Liquid Pycnometer and Titration Methods (EN ISO 1183-1:2019, IDT.; ISO 1183-1:2019, IDT). UkrNDNC SE: Kyiv, Ukraine, 2022.
- DSTU EN ISO 527-2:2018; Plastics—Determination of Tensile Properties—Part 2: Test Conditions for Plastics Manufactured by Molding and Extrusion (EN ISO 527-2:2012, IDT.; ISO 527-2:2012, IDT). Technical Committee for Standardization “Rubbers, Rubber and Rubber Products” (TC 128): Kyiv, Ukraine, 2018.
- DSTU EN ISO 291:2017; Plastics—Standard Atmospheric Conditions for Conditioning and Testing (EN ISO 291:2008, IDT.; ISO 291:2008, IDT). Technical Committee for Standardization “Rubbers, Rubber and Rubber Products” (TC 128): Kyiv, Ukraine, 2017.
- De Groot, P.A. Chapter 4—Carbon. In Handbook of Stable Isotope Analytical Techniques; Elsevier: Amsterdam, The Netherlands, 2009; pp. 229–329. [Google Scholar] [CrossRef]
- Mykytyuk, V.; Flys, V. Factors affecting the efficiency of the use of material resources in the enterprise and ways to increase it. Her. Econ. 2024, 1, 218–232. [Google Scholar] [CrossRef]
- Speight, J.G. Solvent Processes in Refining Technology; CRC Press: Boca Raton, FL, USA, 2023. [Google Scholar]
- On Approval of State Medical and Sanitary Standards for the Permissible Content of Chemical and Biological Substances in the Atmospheric Air of Populated Areas. Order 10.05.2024 No. 813 Ministry of Health of Ukraine. Available online: https://zakon.rada.gov.ua/laws/show/z0763-24#n9 (accessed on 19 June 2024).
- On Approval of State Medical and Sanitary Standards for the Permissible Content of Chemical and Biological Substances in the Air of the Working Area. Order 9 July 2024 No. 1192 Ministry of Health of Ukraine. Available online: https://zakon.rada.gov.ua/laws/show/z1107-24#Text (accessed on 11 April 2025).
- ACGIH Data Hub—2025. Available online: https://www.acgih.org/data-hub/ (accessed on 1 January 2025).
- Immediately Dangerous to Life or Health (IDLH) Values. Available online: https://www.cdc.gov/niosh/idlh/intridl4.html (accessed on 26 February 2021).
- Cherkashina, A.; Lavrova, I.; Lebedev, V. Development of a bitumen-polymer composition, resistant to atmospheric influences, based on petroleum bitumen and their properties study. Mater. Sci. Forum 2021, 1038, 352–358. [Google Scholar] [CrossRef]
- Ahirwar, D.; Telang, A.; Purohit, R.; Namdev, A. A short review on polyurethane polymer composite. Mater. Today Proc. 2022, 62, 3804–3810. [Google Scholar] [CrossRef]
- United Nations Development Programme. Available online: https://www.undp.org/uk/ukraine/tsili-staloho-rozvytku (accessed on 1 March 2021).
- Meyers, R.A. Handbook of Petroleum Refining Processes, 4th ed.; McGraw-Hill Education: New York, NY, USA, 2016. [Google Scholar]
- On Establishing the Tariff for Electricity Transmission Services of NPC “UKRENERGO” for 2025. Available online: https://zakon.rada.gov.ua/rada/show/v2200874-24#Text (accessed on 19 December 2024).
- Actual Sales Price of Natural Gas for January 2025. Available online: https://me.gov.ua/Documents/Detail/53a2e159-7d90-4901-b6ca-697e54e305b0?lang=uk-UA&title=FaktichnaTsinaRealizatsiiPrirodnogoGazuNaSichen2025 (accessed on 6 February 2025).
- Price Indices. Available online: https://index.minfin.com.ua/ua/markets/fuel/ (accessed on 25 April 2025).


| Indicator | fr. ≤ 200 °C | fr. ≤ 180 °C GC | Value Requirements for «Euro 4» Gasoline [20] |
|---|---|---|---|
| Saturated vapor pressure, kPa | 53 | 70 | 50–90 |
| Density at 15 °C, kg/m3 | 842 | 715 | 720–775 |
| Copper strip test result: corrosion class | 4 | 1 | 1 |
| Detection of water-soluble acids and alkalis using indicators | - | - | Not specified |
| Sulfur content, mg/kg | 51 | 15 | 50 |
| Refractive index, | 1.4782 | 1.4066 | Not specified |
| Br2 g/100 g raw materials | 67.9 | - | Not specified |
| Indicator | fr. ≤ 200 °C | fr. ≤ 180 °C GC |
|---|---|---|
| Initial boiling point | 75 | 40 |
| 10% °C | 105 | 73 |
| 20% °C | 121 | 80 |
| 30% °C | 134 | 87 |
| 40% °C | 144 | 92 |
| 50% °C | 152 | 98 |
| 60% °C | 159 | 104 |
| 70% °C | 166 | 110 |
| 80% °C | 174 | 118 |
| 90% °C | 187 | 134 |
| 95% °C | 205 | 149 |
| End boiling point | 206 | 165 |
| Residue, wt.% | 4 | 1 |
| Losses, wt.% | 1 | 1 |
| № | Formula | Structural Formula | Component | Retention Time, min | fr. ≤ 200 °C, wt.% |
|---|---|---|---|---|---|
| 1. | C4H10 |  | n-Butane | 1.270 | 1.7354 |
| 2. | C4H8 |  | 2-Butene | 1.295 | 8.9417 |
| 3. | C5H10 |  | Cyclopropane, 1,1-dimethyl- | 1.395 | 0.9598 |
| 4. | C5H12 |  | Butane, 2-methyl | 1.430 | 1.4518 |
| 5. | C5H10 |  | 2-Butene, 2-methyl- | 1.495 | 5.4922 |
| 6. | C5H10 |  | trans-2-Pentene | 1.535 | 4.0770 |
| 7. | C5H8 |  | 1,3-Pentadiene | 1.575 | 9.8423 |
| 8. | C6H12 |  | 1-Hexene | 1.745 | 1.7726 |
| 9. | C6H14 |  | Pentane, 2-methyl- | 1.800 | 2.1411 |
| 10. | C6H14 |  | Pentane, 3-methyl- | 1.895 | 0.3924 |
| 11. | C6H12 |  | Pentane, 3-methylene- | 1.950 | 1.2646 |
| 12. | C6H14 |  | n-Hexane | 2.020 | 0.6737 |
| 13. | C6H12 |  | 2-Pentene, 3-methyl-, (E)- | 2.105 | 1.2128 |
| 14. | C6H12 |  | 2-butene, 2,3-dimethyl- | 2.135 | 1.3056 |
| 15. | C6H10 |  | Cyclopentane, methylene- | 2.235 | 1.1250 |
| 16. | C7H16 |  | Pentane, 2,4-dimethyl- | 2.295 | 1.0577 |
| 17. | C7H14 |  | 1-Pentene, 2,4-dimethyl- | 2.520 | 0.9281 |
| 18. | C6H10 |  | Cyclopentene, 1-methyl- | 2.605 | 1.9934 |
| 19. | C7H14 |  | 2-Pentene, 2,4-dimethyl- | 2.635 | 0.7536 |
| 20. | C6H6 |  | Benzene | 2.740 | 2.9639 |
| 21. | C7H16 | 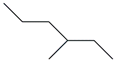 | Hexane, 3-methyl- | 2.775 | 0.4742 |
| 22. | C8H18 |  | Pentane, 2,2,4-trimethyl-, Isooctane | 2.940 | 0.2502 |
| 23. | C7H16 |  | Heptane | 3.040 | 0.4377 |
| 24. | C7H12 | 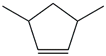 | Cyclopentene, 3,5-dimethyl- | 3.145 | 0.3083 |
| 25. | C7H12 |  | Cyclopentene, 1,5-dimethyl- | 3.190 | 0.2212 |
| 26. | C8H16 | 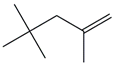 | 1-Pentene, 2,4,4-trimethyl- | 3.410 | 0.2634 |
| 27. | C8H16 | 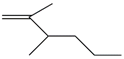 | 1-Hexene, 2,3-dimethyl- | 3.470 | 0.2715 |
| 28. | C8H16 | 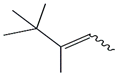 | 2-Pentene, 3,4,4-trimethyl- | 3.660 | 0.4860 |
| 29. | C7H12 |  | Cyclobutane, (1-methyl ethylidene)- | 3.730 | 0.4575 |
| 30. | C7H12 |  | Cyclohexene, 4-methyl- | 3.935 | 0.4583 |
| 31. | C7H12 |  | 2,4-Heptadiene | 4.140 | 0.3009 |
| 32. | C7H10 |  | 1-Methyl-1,4-cyclohexadiene | 4.435 | 0.3319 |
| 33. | C7H10 |  | 1,3-Cyclopentadiene, 1,2-dimethyl- | 4.965 | 1.2082 |
| 34. | C7H8 |  | Toluene | 5.400 | 5.9041 |
| 35. | C8H16 |  | 2-Pentene, 2,3,4-trimethyl- | 5.515 | 0.9735 |
| 36. | C8H16 | 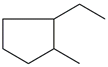 | Cyclopentane, 1-ethyl-2-methyl- | 5.805 | 0.2260 |
| 37. | C8H16 | 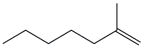 | 1-Heptene, 2-methyl- | 6.335 | 0.1953 |
| 38. | C8H14 |  | Cyclopentene, 1,2,3-trimethyl- | 6.525 | 0.1654 |
| 39. | C8H18 |  | Octane | 6.935 | 0.1512 |
| 40. | C8H14 |  | Cyclohexene, 3,5-dimethyl- | 7.090 | 0.1129 |
| 41. | C8H14 |  | Cyclopentene, 1-Ethyl-2-methyl- | 7.370 | 0.2171 |
| 42. | C8H12 | 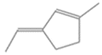 | Cyclopentene, 3-ethylidene-1-methyl- | 8.075 | 0.6563 |
| 43. | C8H14 |  | 1-Ethylcyclohexene | 8.880 | 0.1296 |
| 44. | C8H10 |  | Ethylbenzene | 10.200 | 1.2554 |
| 45. | C8H10 |  | m-Xylene | 10.680 | 4.5767 |
| 46. | C9H20 |  | Octane, 3-methyl- | 11.045 | 0.2635 |
| 47. | C8H10 |  | o-Xylene | 12.175 | 0.8445 |
| 48. | C10H22 |  | Hexane, 2,2,3,3-tetramethyl- | 12.975 | 0.1240 |
| 49. | C14H28 |  | 3-Heptene, 2,2,3,5,5,6,6-heptamethyl- | 15.820 | 0.3029 |
| 50. | C9H12 |  | Benzene, 1-Ethyl-3-methyl | 17.160 | 0.6734 |
| 51. | C10H16 |  | Bicyclo(2.2.1)heptane, 7,7-dimethyl-2-methylene- | 17.235 | 1.2785 |
| 52. | C10H18 |  | Bicyclo(4.1.0)heptane, 3,7,7-trimethyl- = Carane | 18.830 | 0.2526 |
| 53. | C9H12 |  | Mesitylene | 19.375 | 0.8236 |
| 54. | C10H22 |  | Decane | 19.860 | 0.1342 |
| 55. | C10H16 |  | 2,5,6-Trimethyl-1,3,6-heptatriene | 20.055 | 0.1667 |
| 56. | C10H18 |  | Cyclohexene, 1-methyl-4-(1-methylethyl)- | 20.335 | 1.0043 |
| 57. | C10H14 |  | o-Cymene | 20.440 | 2.9578 |
| 58. | C10H16 |  | Cyclohexene, 1-methyl-4-(1-methylethenyl) | 20.525 | 1.7237 |
| 59. | C10H14 |  | m-Cymene | 20.625 | 0.3296 |
| 60. | C10H14 |  | Benzene, 1-methyl-4-(1-methylethyl) | 21.010 | 0.1904 |
| 61. | C10H14 |  | Benzene, 1-methyl-3-propyl- | 21.145 | 0.3431 |
| 62. | C10H16 |  | Cyclohexene, 1-methyl-4-(1-methylethylidene)- | 21.565 | 0.3384 |
| 63. | C14H30 |  | Heptane, 2,2,3,3,5,6,6-heptamethyl- | 21.795 | 0.1502 |
| 64. | C12H16 |  | 1,2,4a,4b,7,8,8a,8b-Octahydrobiphenylene | 22.230 | 0.2448 |
| 65. | C10H10 |  | 1H-Indene, 3-methyl- | 22.360 | 0.2044 |
| 66. | C11H14 |  | 1-Methyl-4-[1-methyl-2-propenyl]benzene | 22.745 | 0.0826 |
| 67. | C12H16 |  | 3a,4,7,7a-tetrahydrodimethyl-4,7-methano-1H-Indene | 22.840 | 0.0646 |
| Identified compound in total, including: | 82.6149 | ||||
| – arenes | 20.9449 | ||||
| – alkanes | 9.4373 | ||||
| – unsaturated aliphatic hydrocarbons | 41.4117 | ||||
| – saturated alicyclic hydrocarbons | 1.4383 | ||||
| – unsaturated alicyclic hydrocarbons | 9.3826 | ||||
| Unidentified compounds | 17.3851 | ||||
| Total | 100.0000 | ||||
| Component | wt.% of Feedstock |
|---|---|
| Received | |
| fr. ≤ 200 °C | 100.00 |
| Formalin (formaldehyde content in formalin is 37 wt.%). | 7.50 |
| Hydrochloric acid (con.) | 3.00 |
| Total | 110.50 |
| Received | |
| Resin | 8.59 |
| Unreacted components | 92.72 |
| Losses and water | 9.19 |
| Total | 110.50 |
| Indicator | fr. ≤ 200 °C | Unreacted Components GF |
|---|---|---|
| Density at 15 °C, kg/m3 | 0.8420 | 0.8208 |
| Refractive index, | 1.4782 | 1.4677 |
| Bromine number, Br2/100 g of product | 67.90 | 59.29 |
| Indicator | Solvent | |||
|---|---|---|---|---|
| Phenol | Furfural | DEG | NMP | |
| MPC daily average, mg/m3 | 0.01 | 0.05 | 0.2 | 0.5 |
| MPC maximum one-time, mg/m3 | 0.03 | 0.05 | 1.0 | 100 |
| TLV-TWA, ppm (mg/m3) | 5 (19) | 0.2 (0.8) | - * (10) | 1 (4–5.1) |
| IDLH, ppm | 250 | 100 | - * | - * |
| № | Component | Volume Ratios of fr. ≤ 200 °C to Solvent | |
|---|---|---|---|
| NMP | DEG | ||
| wt.% of Raw Materials | |||
| Received | |||
| 1 | Raw materials | 100.00 | 100.00 |
| 2 | Solvent | 193.53 | 1506.63 |
| Total | 293.53 | 1606.63 | |
| Received | |||
| 1 | Raffinate | 38.55 | 43.27 |
| 2 | Extract | 61.45 | 56.73 |
| 3 | Solvent | 193.53 | 1506.63 |
| Total | 293.53 | 1606.63 | |
| Indicator | fr. ≤ 200 °C | NMP | DEG | ||
|---|---|---|---|---|---|
| Raffinate | Extract | Raffinate | Extract | ||
| Density at 15 °C, kg/m3 | 0.8420 | 0.8031 | 0.8648 | 0.8170 | 0.8652 |
| Refractive index, | 1.4782 | 1.4627 | 1.4868 | 1.4637 | 1.4861 |
| Bromine number, Br2/100 g of product | 67.90 | 67.73 | 68.48 | 60.72 | 70.39 |
| Component | wt.% for Unreacted Components of the GF | wt.% by fr. ≤ 200 °C |
|---|---|---|
| Received | ||
| Unreacted components of the GF | 100.00 | 92.72 |
| Solvent | 158.79 | 147.23 |
| Total | 258.79 | 239.95 |
| Received | ||
| Raffinate | 47.88 | 44.39434 |
| Extract | 52.12 | 48.32566 |
| Solvent | 158.79 | 147.2301 |
| Total | 258.79 | 239.95 |
| Indicator | fr. ≤ 200 °C | Unreacted Components of the GF | Raffinate | Extract |
|---|---|---|---|---|
| Density at 15 °C, kg/m3 | 0.8420 | 0.8208 | 0.7921 | 0.8465 |
| Refractive index, | 1.4782 | 1.4677 | 1.4587 | 1.4814 |
| Bromine number, Br2/100 g of product | 67.90 | 59.29 | 54.26 | 63.78 |
| Component | wt.% per Raffinate | wt.% per fr. ≤ 200 °C |
|---|---|---|
| Received | ||
| Raffinate | 35.00 | 44.39 |
| fr. ≤ 180 °C GC | 65.00 | 82.44 |
| Total | 100.00 | 126.84 |
| Received | ||
| Gasoline | 100.00 | 126.84 |
| Total | 100.00 | 126.84 |
| Indicator | Gasoline | Requirements for Euro 4 Gasoline [20] |
|---|---|---|
| Saturated steam pressure, kPa | 55 | 50–90 |
| Density at 15 °C, kg/m3, in range | 755 | 720–775 |
| Test on a copper plate, class | 1 | ≤1 |
| Sulfur content, mg/kg | 28 | ≤50 |
| Detonation resistance by experimental method: | ||
| - for gasoline 92 - for gasoline 95 | 93 | ≥92 ≥95 |
| Fractional composition: | ||
| - a volumetric fraction of vaporization at 150 °C, % vol. - final boiling point, °C - a volumetric fraction of the residue after boiling, % vol. | 81.5 175 1.9 | ≥75.0 ≤210 ≤2 |
| Sample | The Elemental Composition, wt.% | Higher Calorific Value, Q, kJ/kg | ||||
|---|---|---|---|---|---|---|
| C | H | S | N | O | ||
| fr. ≤ 200 °C | 83.61 | 10.66 | 0.0051 | 0.975 | 4.7499 | 41,151.84 |
| Obtained gasoline | 86.64 | 13.29 | 0.0028 | 0.001 | 0.0662 | 46,101.47 |
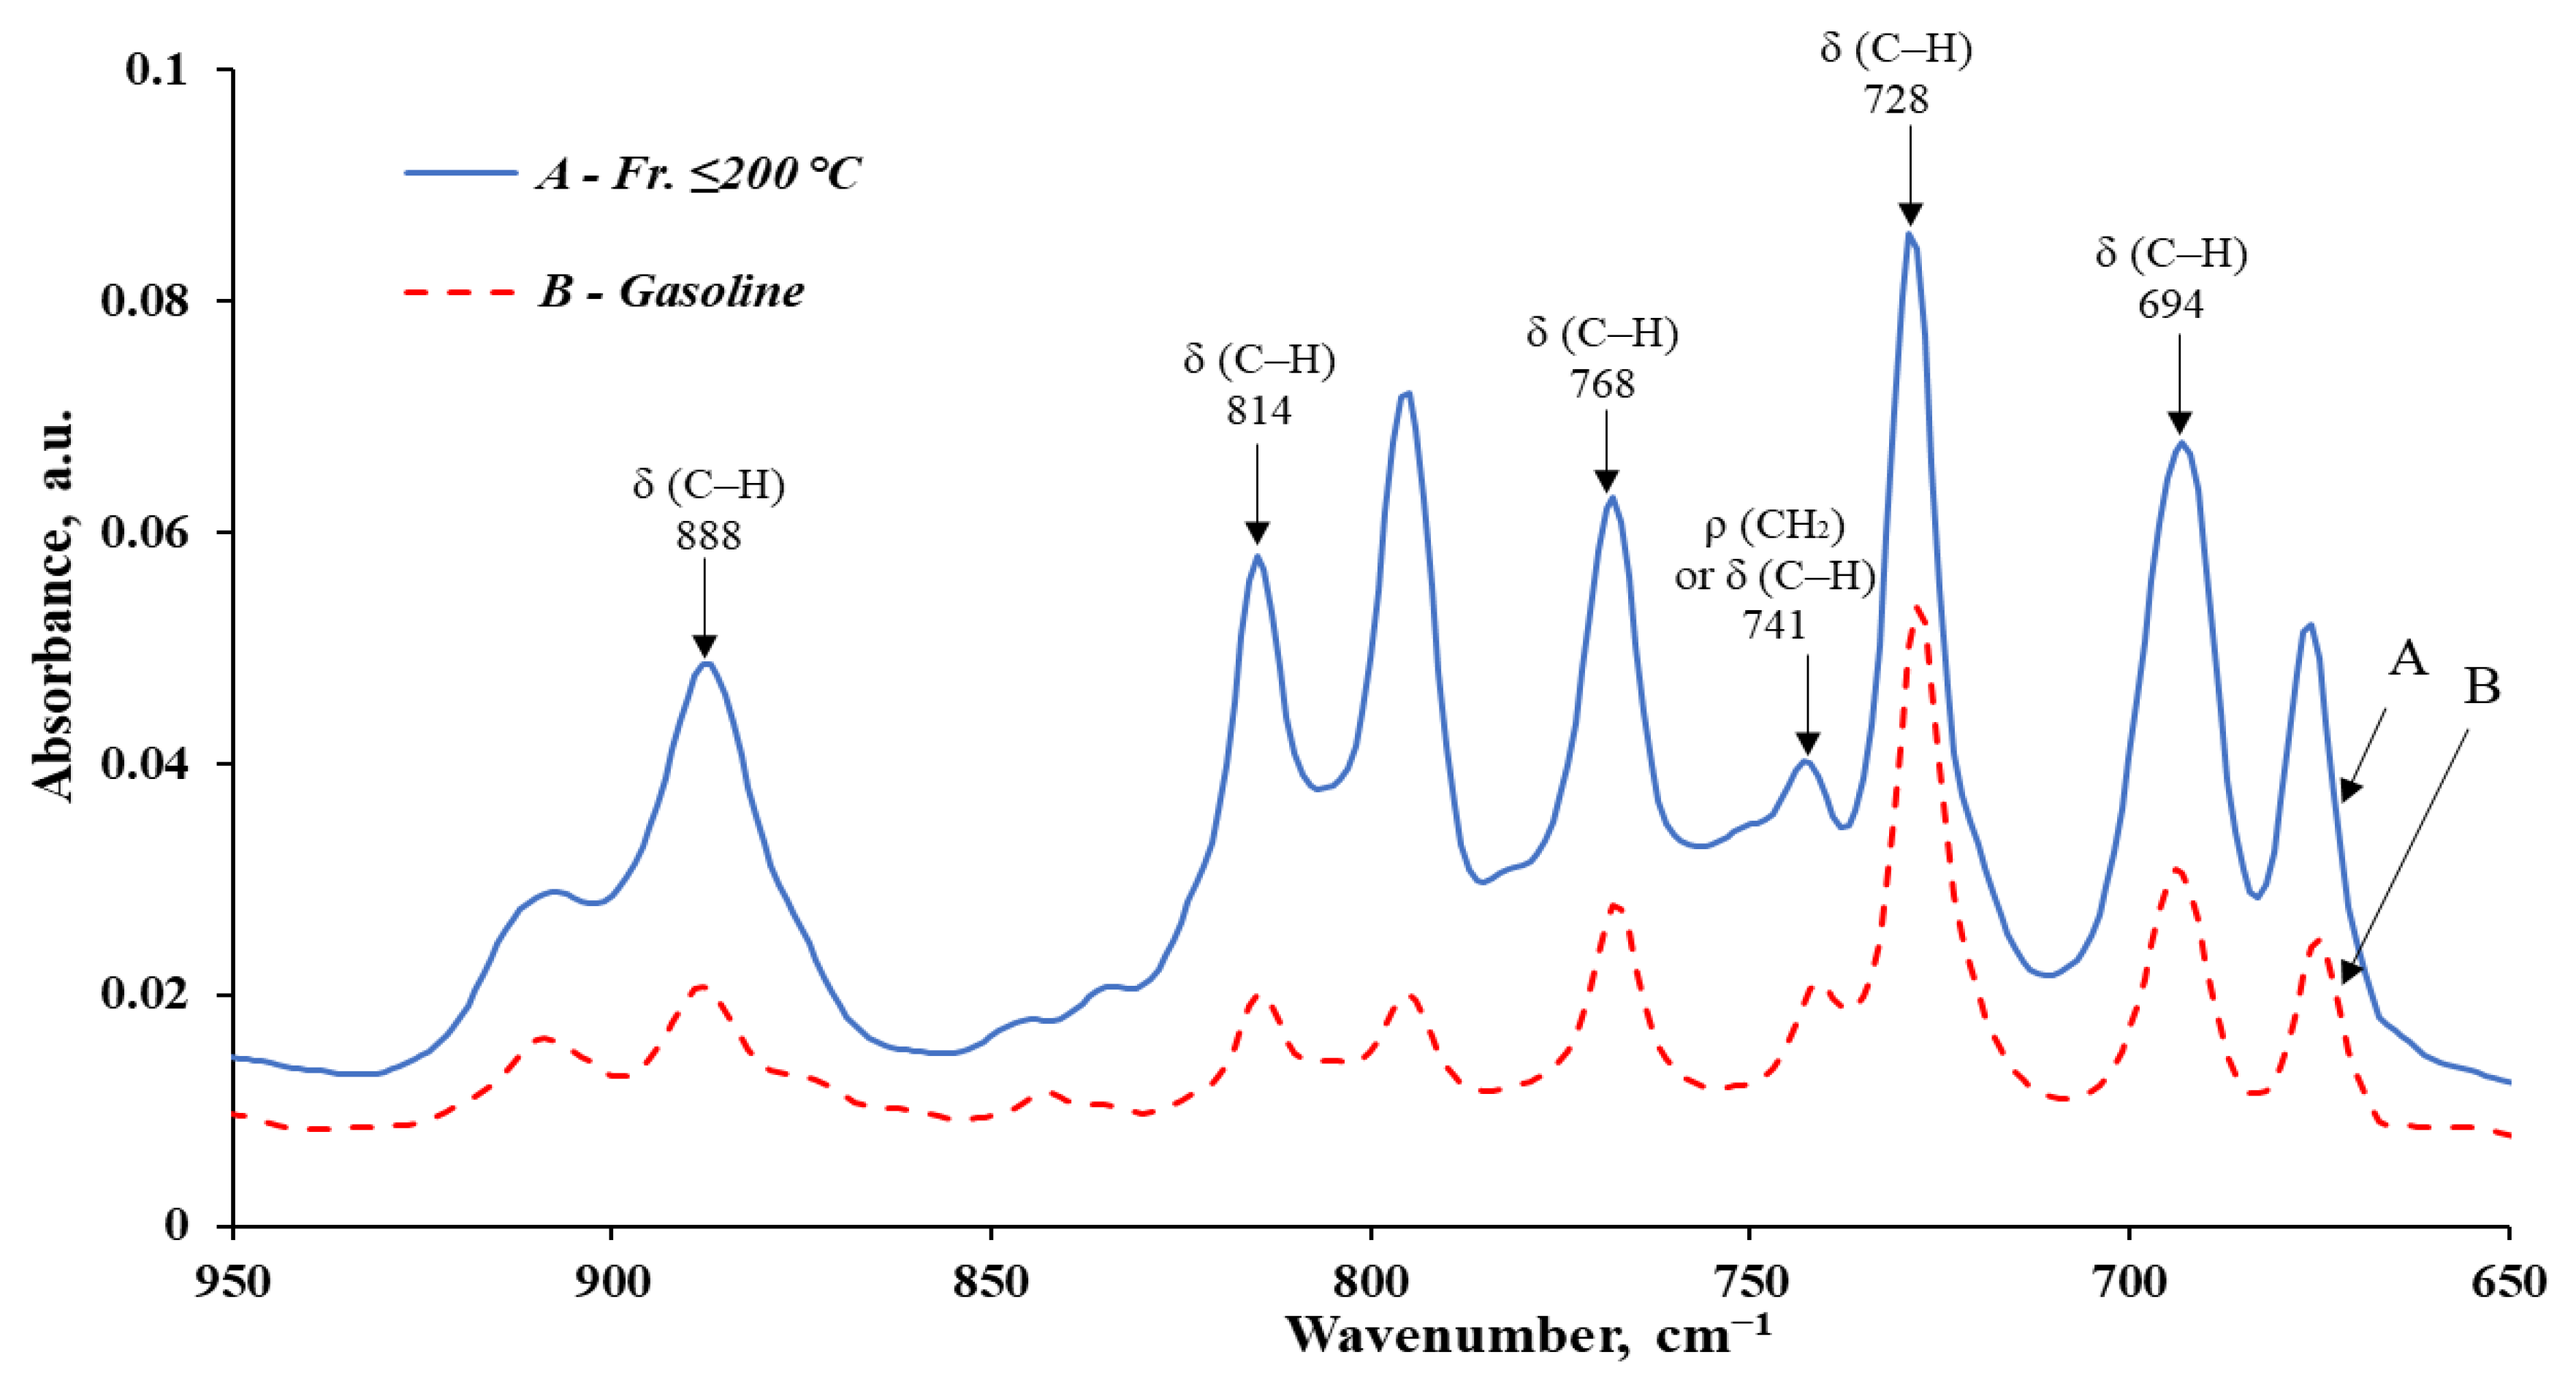
| № | Wavenumber, cm−1 | fr. ≤ 200 °C | Gasoline | Structural Fragment of the Molecule | Deformation, Oscillations, and Vibration | ||
|---|---|---|---|---|---|---|---|
| Absorbance, a.u. * | Relative % | Absorbance, a.u. * | Relative % | ||||
| 1 | 2957–2955 | 0.0795 | 8.11 | 0.1201 | 14.48 | -C-H(CH3) | Asymmetric stretching vibration of the CH3 group |
| 2 | 2924–2923 | 0.0838 | 8.55 | 0.1610 | 19.42 | -C-H(CH2) | Asymmetric stretching vibration of the CH2 group |
| 3 | 2871–2870 | 0.0550 | 5.61 | 0.0776 | 9.36 | -C-H(CH3) -C-H(CH2) | Symmetric stretching vibration of the CH3 group or CH2 group |
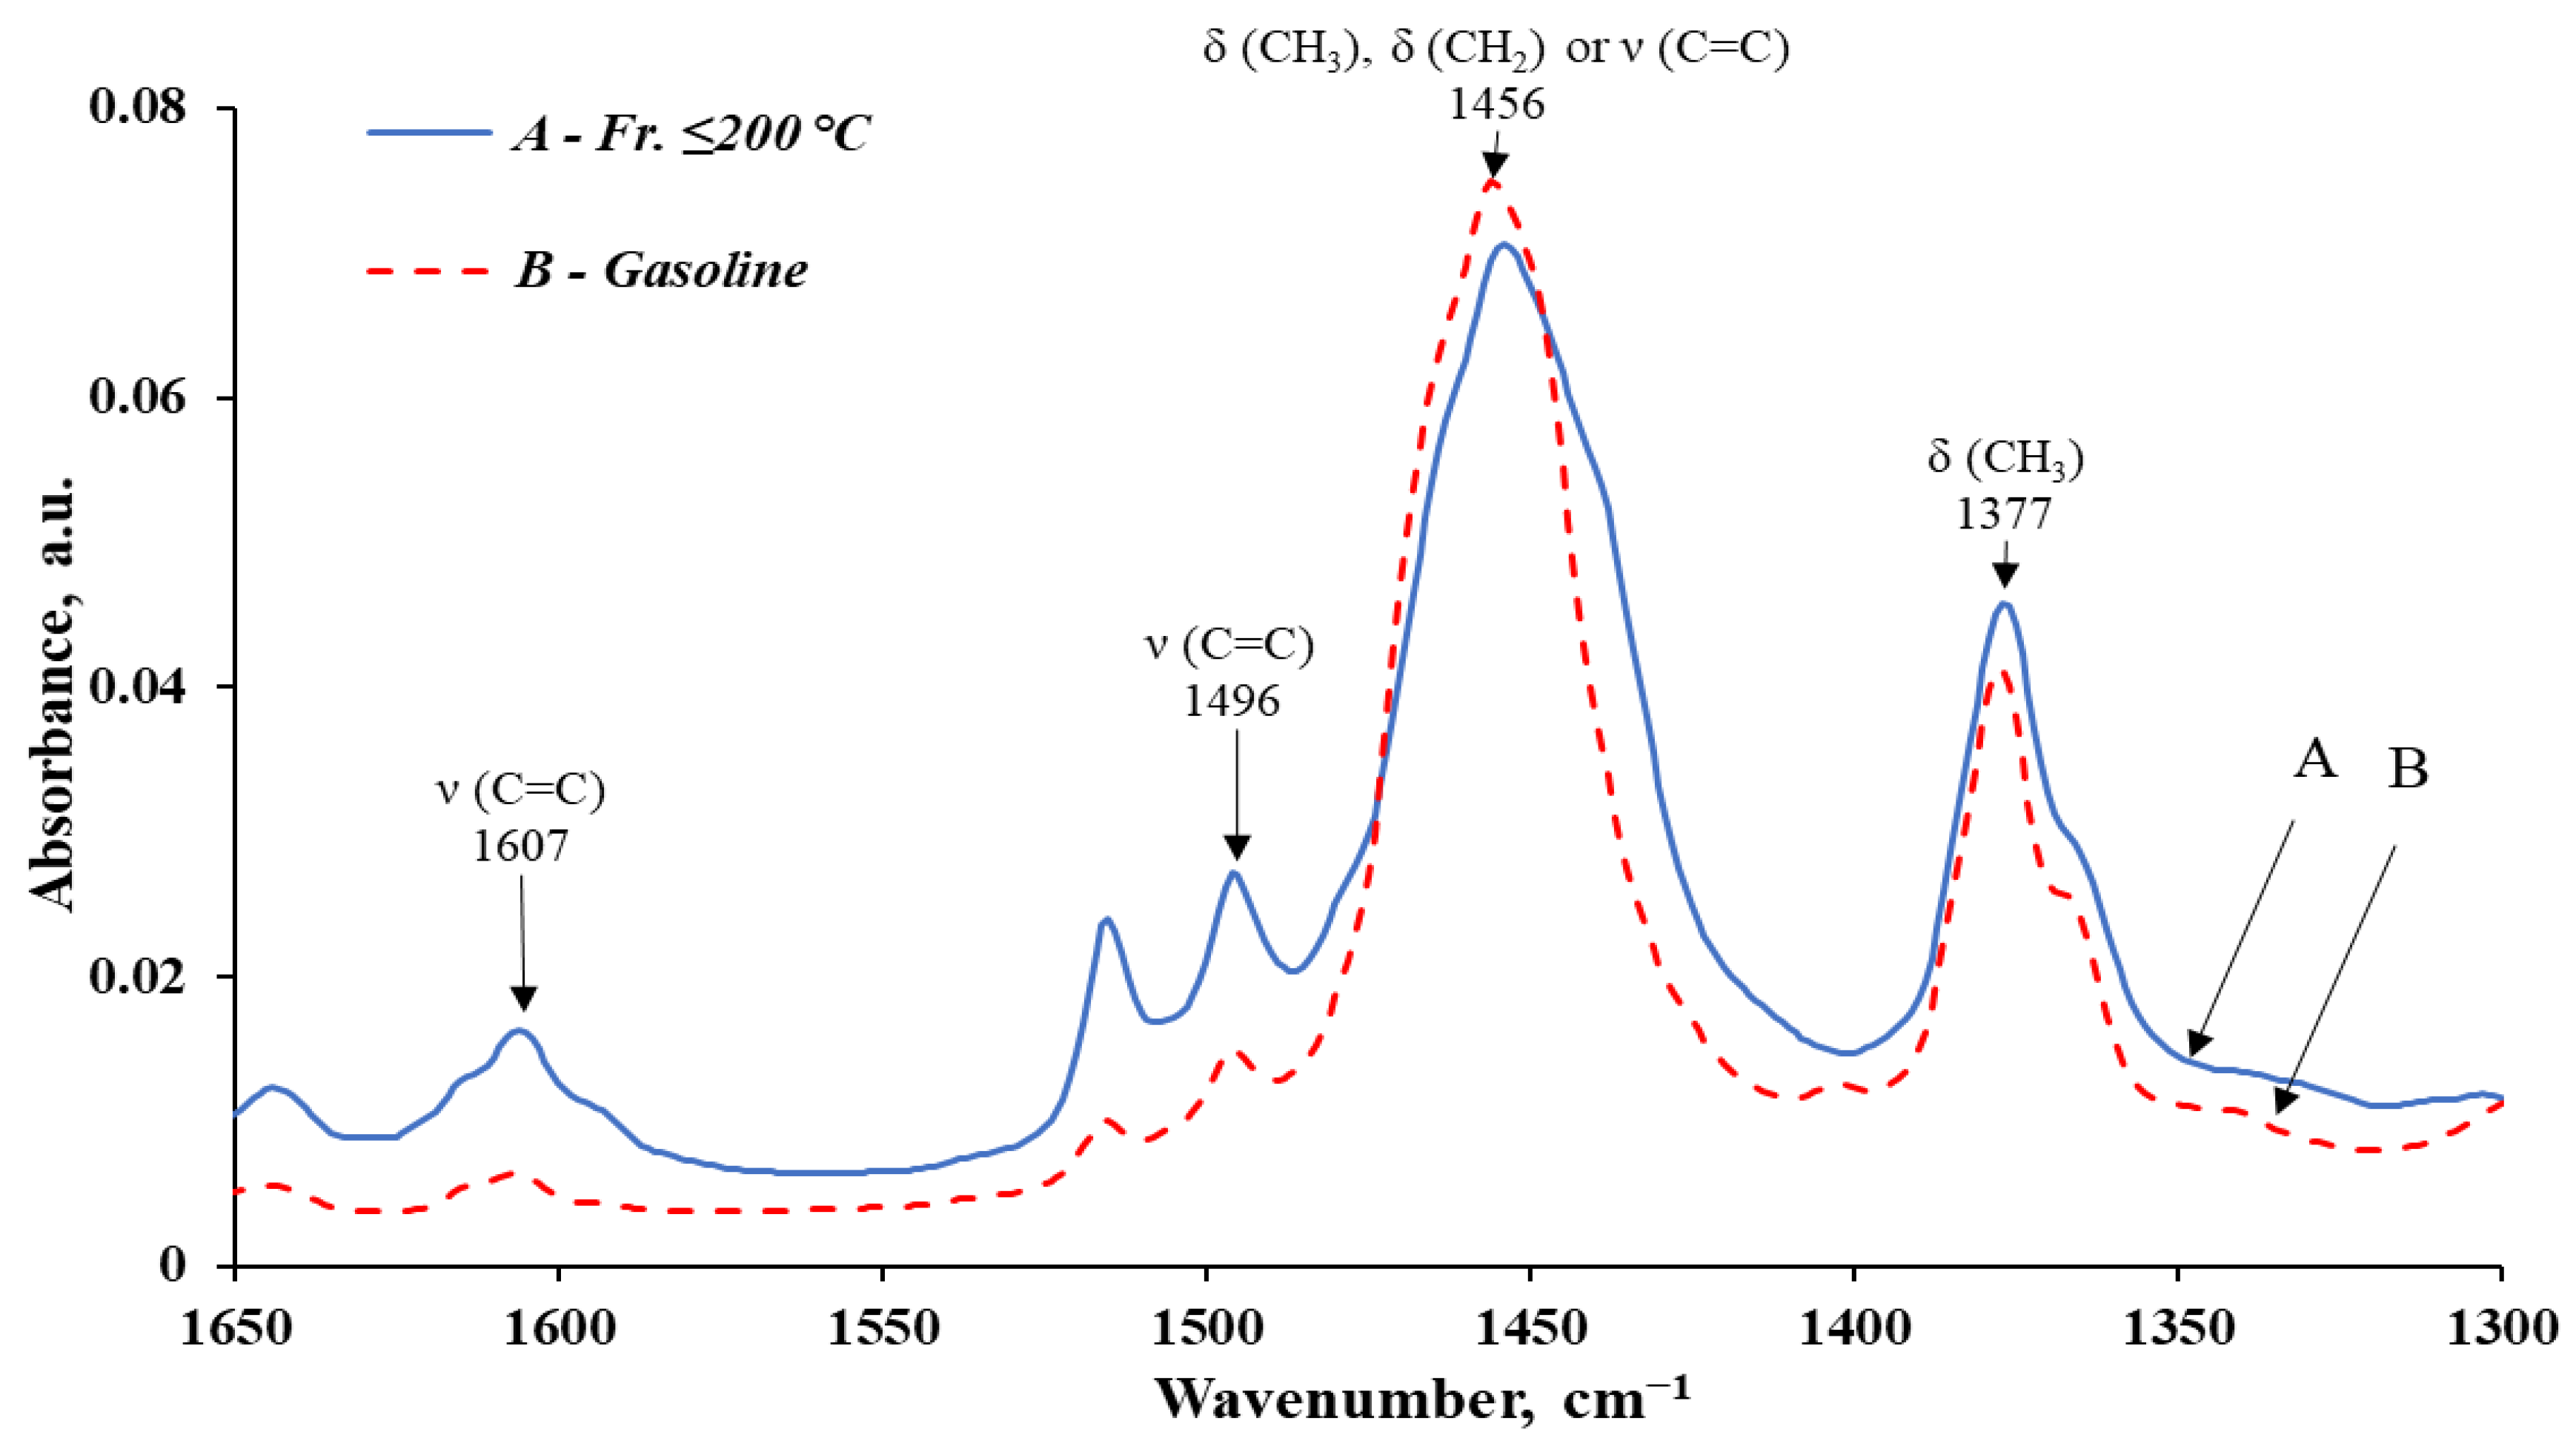
| 4 | 1607–1606 | 0.0113 | 1.15 | 0.0034 | 0.41 | Ar | C=C stretching vibration in the aromatic ring |
| 5 | 1496 | 0.0208 | 2.12 | 0.0112 | 1.35 | Ar | C=C stretching vibration in the aromatic ring |
| 6 | 1456–1454 | 0.0637 | 6.50 | 0.0708 | 8.53 | -C-H(CH3) -C-H(CH2) or Ar | Asymmetric bending vibration of the CH3 group Asymmetric bending of the CH2 group or C=C stretching in the aromatic ring |
| 7 | 1377 | 0.0380 | 3.88 | 0.0365 | 4.40 | -C-H(CH3) | Symmetric bending vibration of the CH3 group |
| 8 | 888–887 | 0.0359 | 3.67 | 0.0126 | 1.52 | RCH=CHR` or Ar | C–H bending in alkenes or outside the aromatic ring region (in the presence of three alkyl substituents) |
| 9 | 815–814 | 0.0459 | 4.69 | 0.0123 | 1.49 | ||
| 10 | 768 | 0.0515 | 5.25 | 0.0203 | 2.45 | ||
| 11 | 743–741 | 0.0288 | 2.94 | 0.0136 | 1.64 | -C-H(CH2) or Ar | Rocking vibration of CH2 (often in high molecular weight compounds) or C–H bending outside the aromatic region (with three alkyl substituents) |
| 12 | 729–728 | 0.0746 | 7.61 | 0.0463 | 5.58 | Ar | C–H bending outside the aromatic ring region (in the presence of 1–2 alkyl substituents) |
| 13 | 694–693 | 0.0569 | 5.81 | 0.0237 | 2.86 | Ar | |
| Total | 0.6457 | 65.90 | 0.6095 | 73.50 | – | – | |
| The remaining IR bands | 0.3341 | 34.10 | 0.2198 | 26.50 | – | – | |
| Component | wt.% per Feedstock (fr. ≤ 200 °C) |
|---|---|
| Received | |
| fr. ≤ 200 °C | 100.00 |
| Formalin (formaldehyde content in formalin is 37 wt.%) | 7.50 |
| Hydrochloric acid (conc.) | 3.00 |
| Solvent | 147.23 |
| fr. ≤ 180 °C GC | 82.45 |
| Total | 340.18 |
| Received | |
| Euro 4 gasoline including: - raffinate - fr. ≤ 180 °C GC | 126.84 44.39 82.45 |
| Resin | 8.59 |
| Extract | 48.33 |
| Solvent | 146.88 |
| Losses and water | 9.54 |
| Total | 340.18 |
| Composition | Density, g/cm3 | Drying Time, minutes | Water Absorption, % | Relative Elongation at Break, % | Shore Hardness, c.u. | Adhesion to Glass, % | |
|---|---|---|---|---|---|---|---|
| Starting polyurethane polymer | 1.412 | 120 | 0,9 | 400 | 60 | 85 | |
| Extract content, % wt. | 5.00 | 1.437 | 130 | 0,7 | 450 | 55 | 90 |
| 10.00 | 1.424 | 145 | 0,5 | 500 | 45 | 94 | |
| 20.00 | 1.478 | 290 | 0,6 | 380 | 50 | 89 | |
| Composition | Density, g/cm3 | Drying Time, minutes | Water Absorption, % | Relative Elongation at Break, % | Shore Hardness, c.u. | Adhesion to Glass, % | |
|---|---|---|---|---|---|---|---|
| Initial polyurethane polymer from 10 wt.% LPPT | 1.424 | 145 | 0.5 | 500 | 45 | 94 | |
| Taurite content, wt.% | 3.00 | 1.429 | 135 | 0.4 | 550 | 55 | 90 |
| 6.00 | 1.514 | 125 | 0.2 | 600 | 35 | 97 | |
| 9.00 | 1.536 | 120 | 0.2 | 480 | 55 | 90 | |
| № | Indicators | Dimension | Quantity | Approximate Unit Price, USD | Calculation of the Cost Per 1 Ton of Raw Material, USD |
|---|---|---|---|---|---|
| Option I: investigated methods of pyrolysis gasoline processing (fr. ≤ 200 °C) | |||||
| II.I Raw materials, reagents, energy costs | |||||
| 1 | Pyrolysis gasoline (fr. ≤ 200 °C) | tons | 1.0000 | 340 | 340.00 |
| 2 | Gas condensate (fr. ≤ 180 °C) | tons | 0.8245 | 490 | 404.01 |
| 3 | Reagents and catalysts | – | – | – | 84.06 |
| 3.1 | Formalin (formaldehyde content in formalin is 37 wt.%) | tons | 0.0750 | 630 | 47.25 |
| 3.2 | Hydrochloric acid | tons | 0.0300 | 240 | 7.20 |
| 3.3 | N-methyl pyrrolidone | tons | 0.0035 | 8460 | 29.61 |
| 4 | Energy consumption for the extraction process of fr. ≤ 200 °C and the production of additives to bitumen | – | – | – | 19.52 |
| 4.1 | Water steam | Gcal | 0.2411 | 35.75 | 8.62 |
| 4.2 | Electricity | kWh | 15.6260 | 0.167 | 2.61 |
| 4.3 | Return water | m3 | 4.0000 | 1.18 | 4.72 |
| 4.4 | Fuel (gas) | tons | 0.009 | 396.84 | 31.27 |
| Cost of total costs under option I | - | - | - | 847.59 | |
| I.II Received products | |||||
| 1 | Commercial gasoline | tons | 1.2684 | 1500 | 1902.60 |
| 2 | Adhesive additive for bitumen | tons | 0.0859 | 3050 | 262.00 |
| 3 | Plasticizer (additive to mastics) | tons | 0.4833 | 600 | 289.98 |
| Cost of products according to option I | - | - | - | 2454.58 | |
| Option II: processing of pyrolysis gasoline (fr. ≤ 200 °C) by hydrorefining | |||||
| II.I Raw materials, reagents, energy costs | |||||
| 1 | Pyrolysis gasoline (fr. ≤ 200 °C) | tons | 1.0000 | 340 | 340 |
| 2 | Reagents and catalysts | – | – | – | 30.45 |
| 2.1 | Hydrogen | tons | 0.0060 | 5000 | 30 |
| 2.2 | Reagents (aluminum-cobalt-molybdenum catalyst) | tons | 0.000015 | 30,000 | 0.45 |
| 3 | Energy consumption per 1 ton of raw material | – | – | – | 52.19 |
| 3.1 | Water steam | Gcal | 0.9500 | 35.75 | 33.96 |
| 3.2 | Electricity | kWh | 24.0000 | 0.167 | 4.01 |
| 3.3 | Return water | m3 | 6.0000 | 1.18 | 7.08 |
| 3.4 | Fuel (gas) | tons | 0.018 | 396.84 | 7.14 |
| Cost of total costs under option II | - | - | - | 422.64 | |
| II.II Received products | |||||
| 1 | Commercial gasoline | tons | 0.98 | 1500 | 1470.00 |
| 2 | Hydrocarbon gases | tons | 0.02 | 396.84 | 7.94 |
| Cost of products under option II | - | - | - | 1477.94 | |
| Methods | Calculation of Indicators | ||
|---|---|---|---|
| The Total Amount of Material Resources Used, USD | The Cost of Marketable Products, USD | The Material Consumption Coefficient | |
| Option I: investigated methods of pyrolysis gasoline processing (fr. ≤ 200 °C) | 847.59 | 2454.58 | 0.35 |
| Option II: processing of pyrolysis gasoline (fr. ≤ 200 °C) by hydrorefining | 422.64 | 1477.94 | 0.29 |
Disclaimer/Publisher’s Note: The statements, opinions and data contained in all publications are solely those of the individual author(s) and contributor(s) and not of MDPI and/or the editor(s). MDPI and/or the editor(s) disclaim responsibility for any injury to people or property resulting from any ideas, methods, instructions or products referred to in the content. |
© 2025 by the authors. Licensee MDPI, Basel, Switzerland. This article is an open access article distributed under the terms and conditions of the Creative Commons Attribution (CC BY) license (https://creativecommons.org/licenses/by/4.0/).
Share and Cite
Pyshyev, S.; Korchak, B.; Miroshnichenko, D.; Lebedev, V.; Yasinska, A.; Lypko, Y. Obtaining New Materials from Liquid Pyrolysis Products of Used Tires for Waste Valorization. Sustainability 2025, 17, 3919. https://doi.org/10.3390/su17093919
Pyshyev S, Korchak B, Miroshnichenko D, Lebedev V, Yasinska A, Lypko Y. Obtaining New Materials from Liquid Pyrolysis Products of Used Tires for Waste Valorization. Sustainability. 2025; 17(9):3919. https://doi.org/10.3390/su17093919
Chicago/Turabian StylePyshyev, Serhiy, Bohdan Korchak, Denis Miroshnichenko, Volodimir Lebedev, Alla Yasinska, and Yurii Lypko. 2025. "Obtaining New Materials from Liquid Pyrolysis Products of Used Tires for Waste Valorization" Sustainability 17, no. 9: 3919. https://doi.org/10.3390/su17093919
APA StylePyshyev, S., Korchak, B., Miroshnichenko, D., Lebedev, V., Yasinska, A., & Lypko, Y. (2025). Obtaining New Materials from Liquid Pyrolysis Products of Used Tires for Waste Valorization. Sustainability, 17(9), 3919. https://doi.org/10.3390/su17093919