Fixed parameters define the fundamental characteristics of the system, such as tire wear behavior and dynamics, such as the initial tread depth, wear rate per kilometer, and the legal safety limit. The input parameters also include cost-related parameters such as tire prices, inspection costs, and regrooving costs, as well as legal constraints. These directly impact the economic analysis of different maintenance strategies.
Decision variables, on the other hand, represent the parameters that can be adjusted within the simulation to optimize performance. They are key factors in determining optimal inspection and maintenance strategies. For instance, the inspection frequency and safety tread depth limit influence the trade-off between tire longevity and operational safety. The retread success rate further affects the economic and environmental impact of tire reuse. These decision variables enable scenario analysis and policy evaluation.
By structuring the table in this manner, we aim to provide clarity on the distinction between input parameters and decision levers. The detailed values and ranges ensure that the reader can fully grasp the scope of the simulation model.
To establish a baseline for comparison, an initial simulation model is designed to represent the case of single-use tires, where no maintenance actions such as regrooving or retreading are considered. This simplified model focuses solely on periodic inspections until the tread depth reaches the legal safety limit. It provides a reference scenario to evaluate the potential benefits of extending tire life through additional maintenance strategies.
3.4.2. Results for Multi-Use Tires
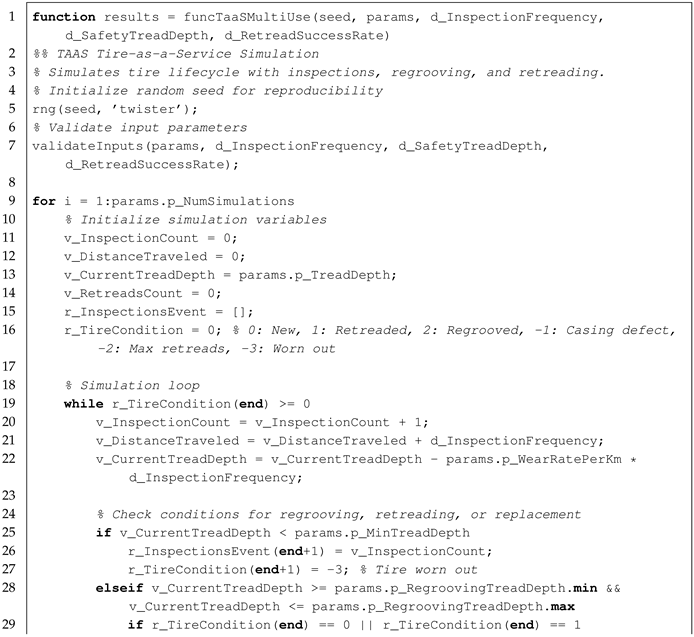
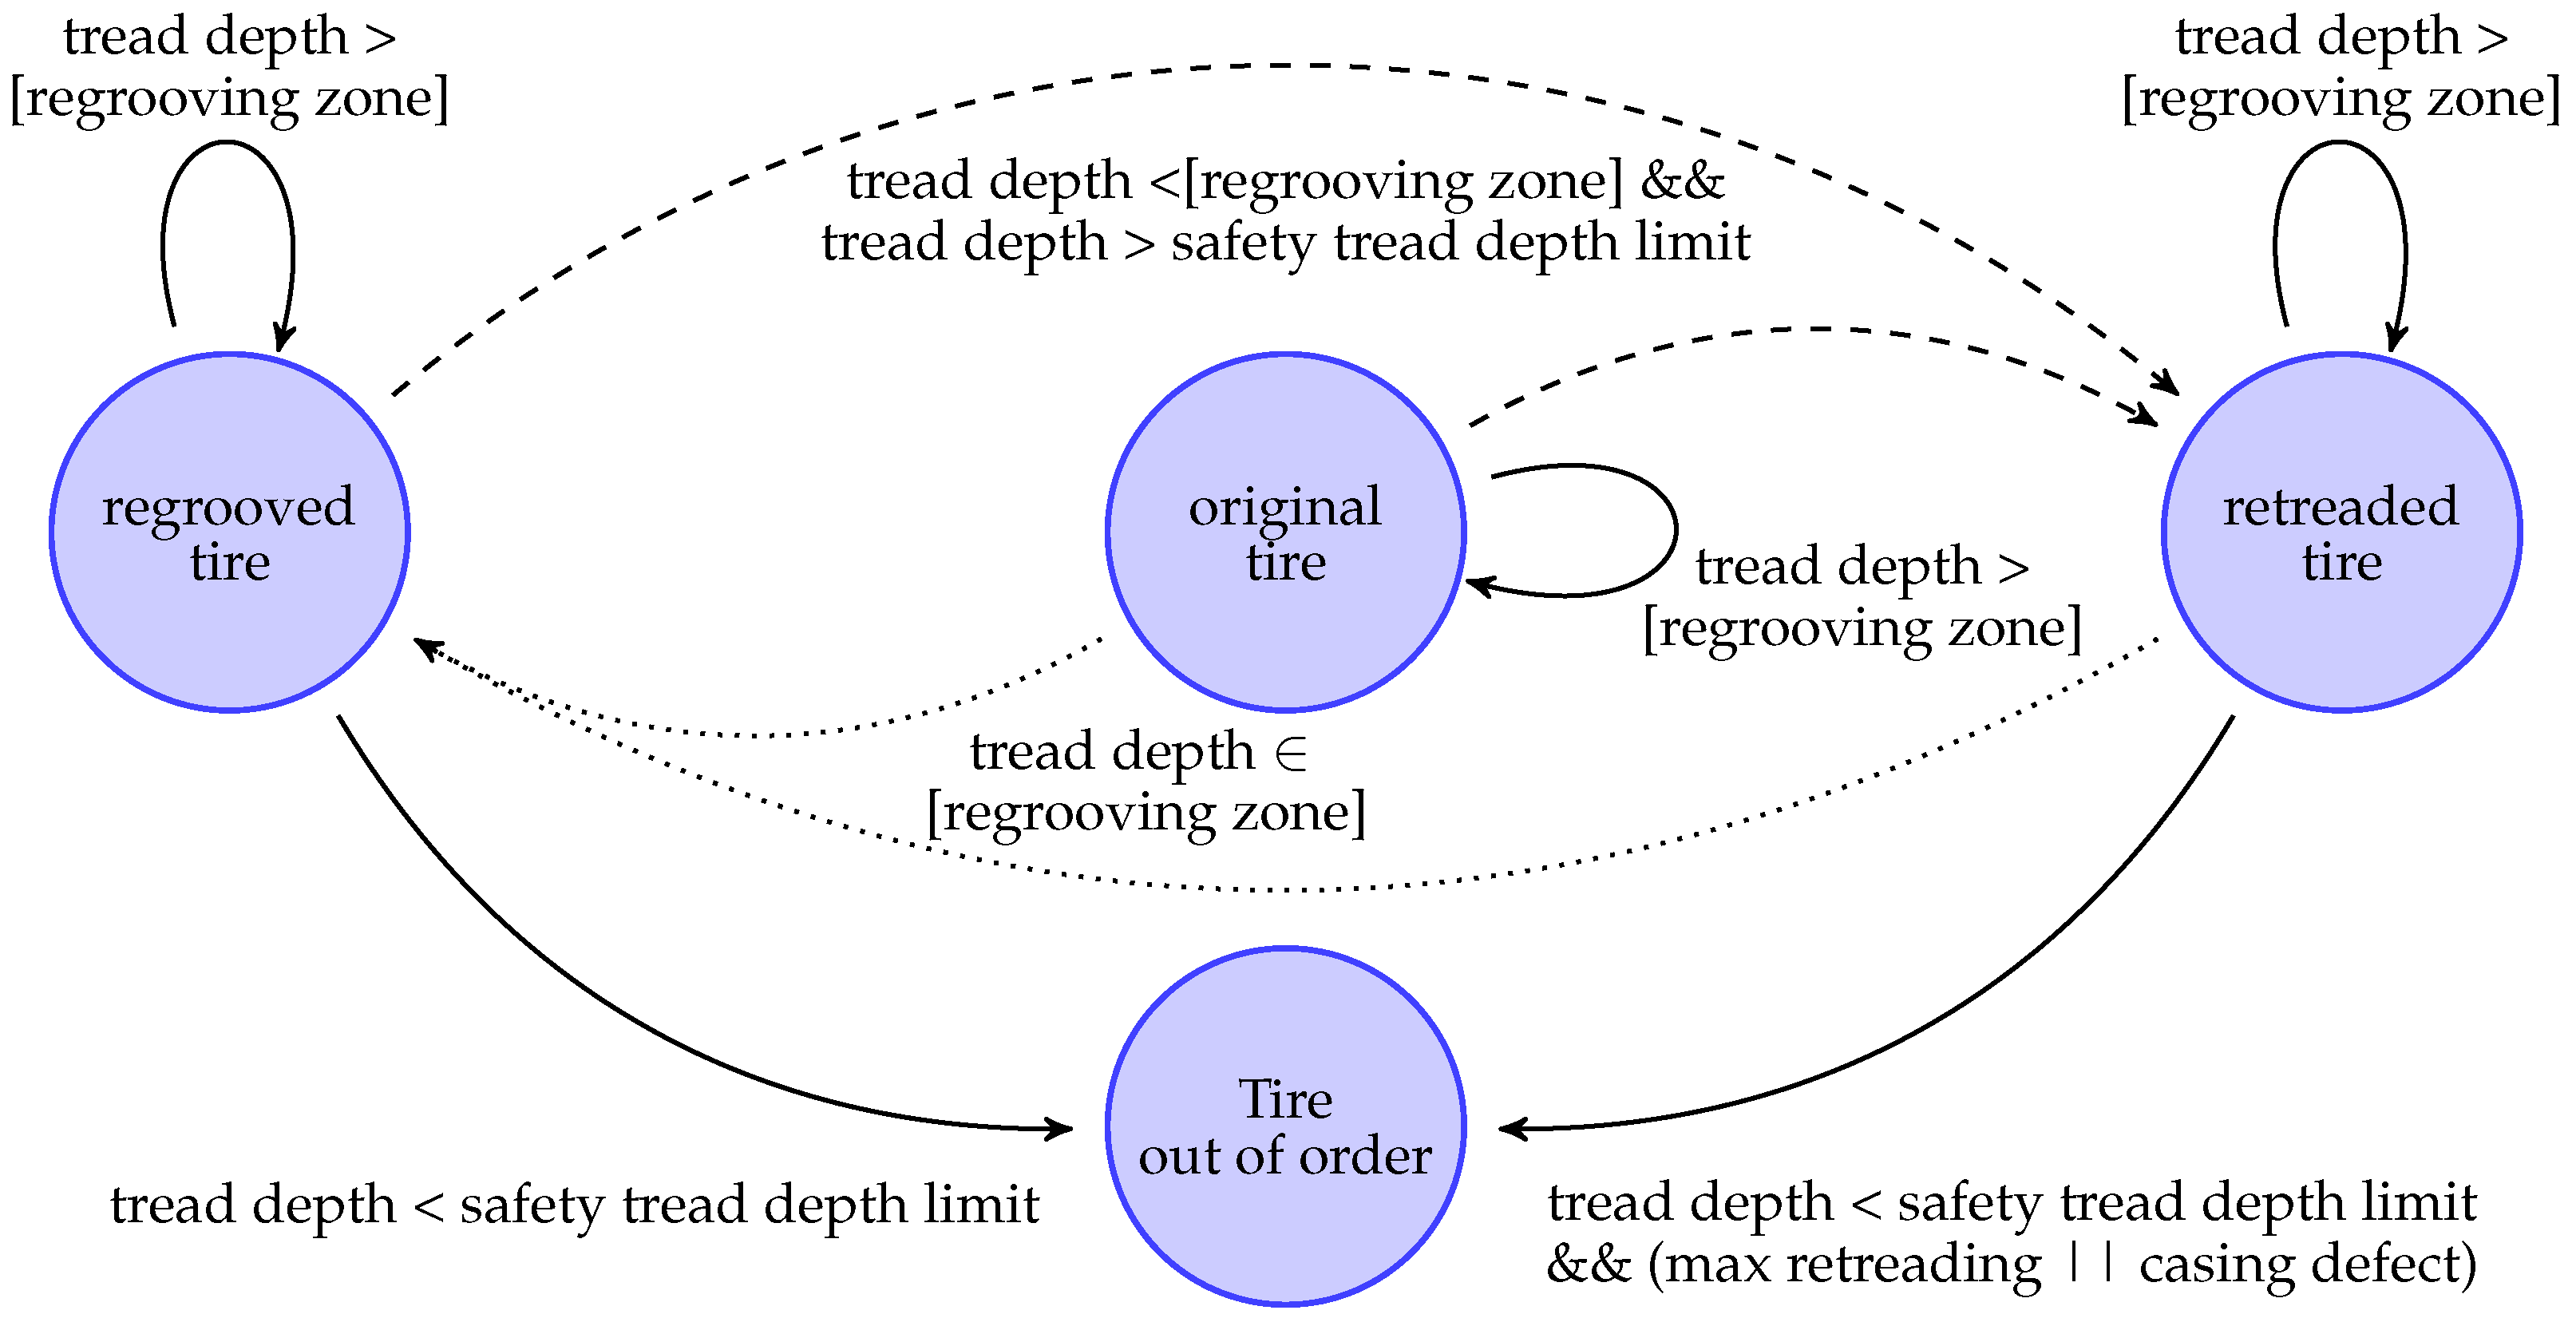
In the case of multi-life tires, the two main maintenance operations are regrooving and retreading. These interventions take place when the tread reaches the manufacturer’s recommended thresholds, which generally remain constant. The key difference lies in the probability of successful retreading, which is heavily influenced by the condition of the casing. This, in turn, depends on its design and operating conditions. The MATLAB code for simulating the multi-life tire model is provided in Listing A2.
Assuming that the decision variables
d_SafetyTreadDepth and
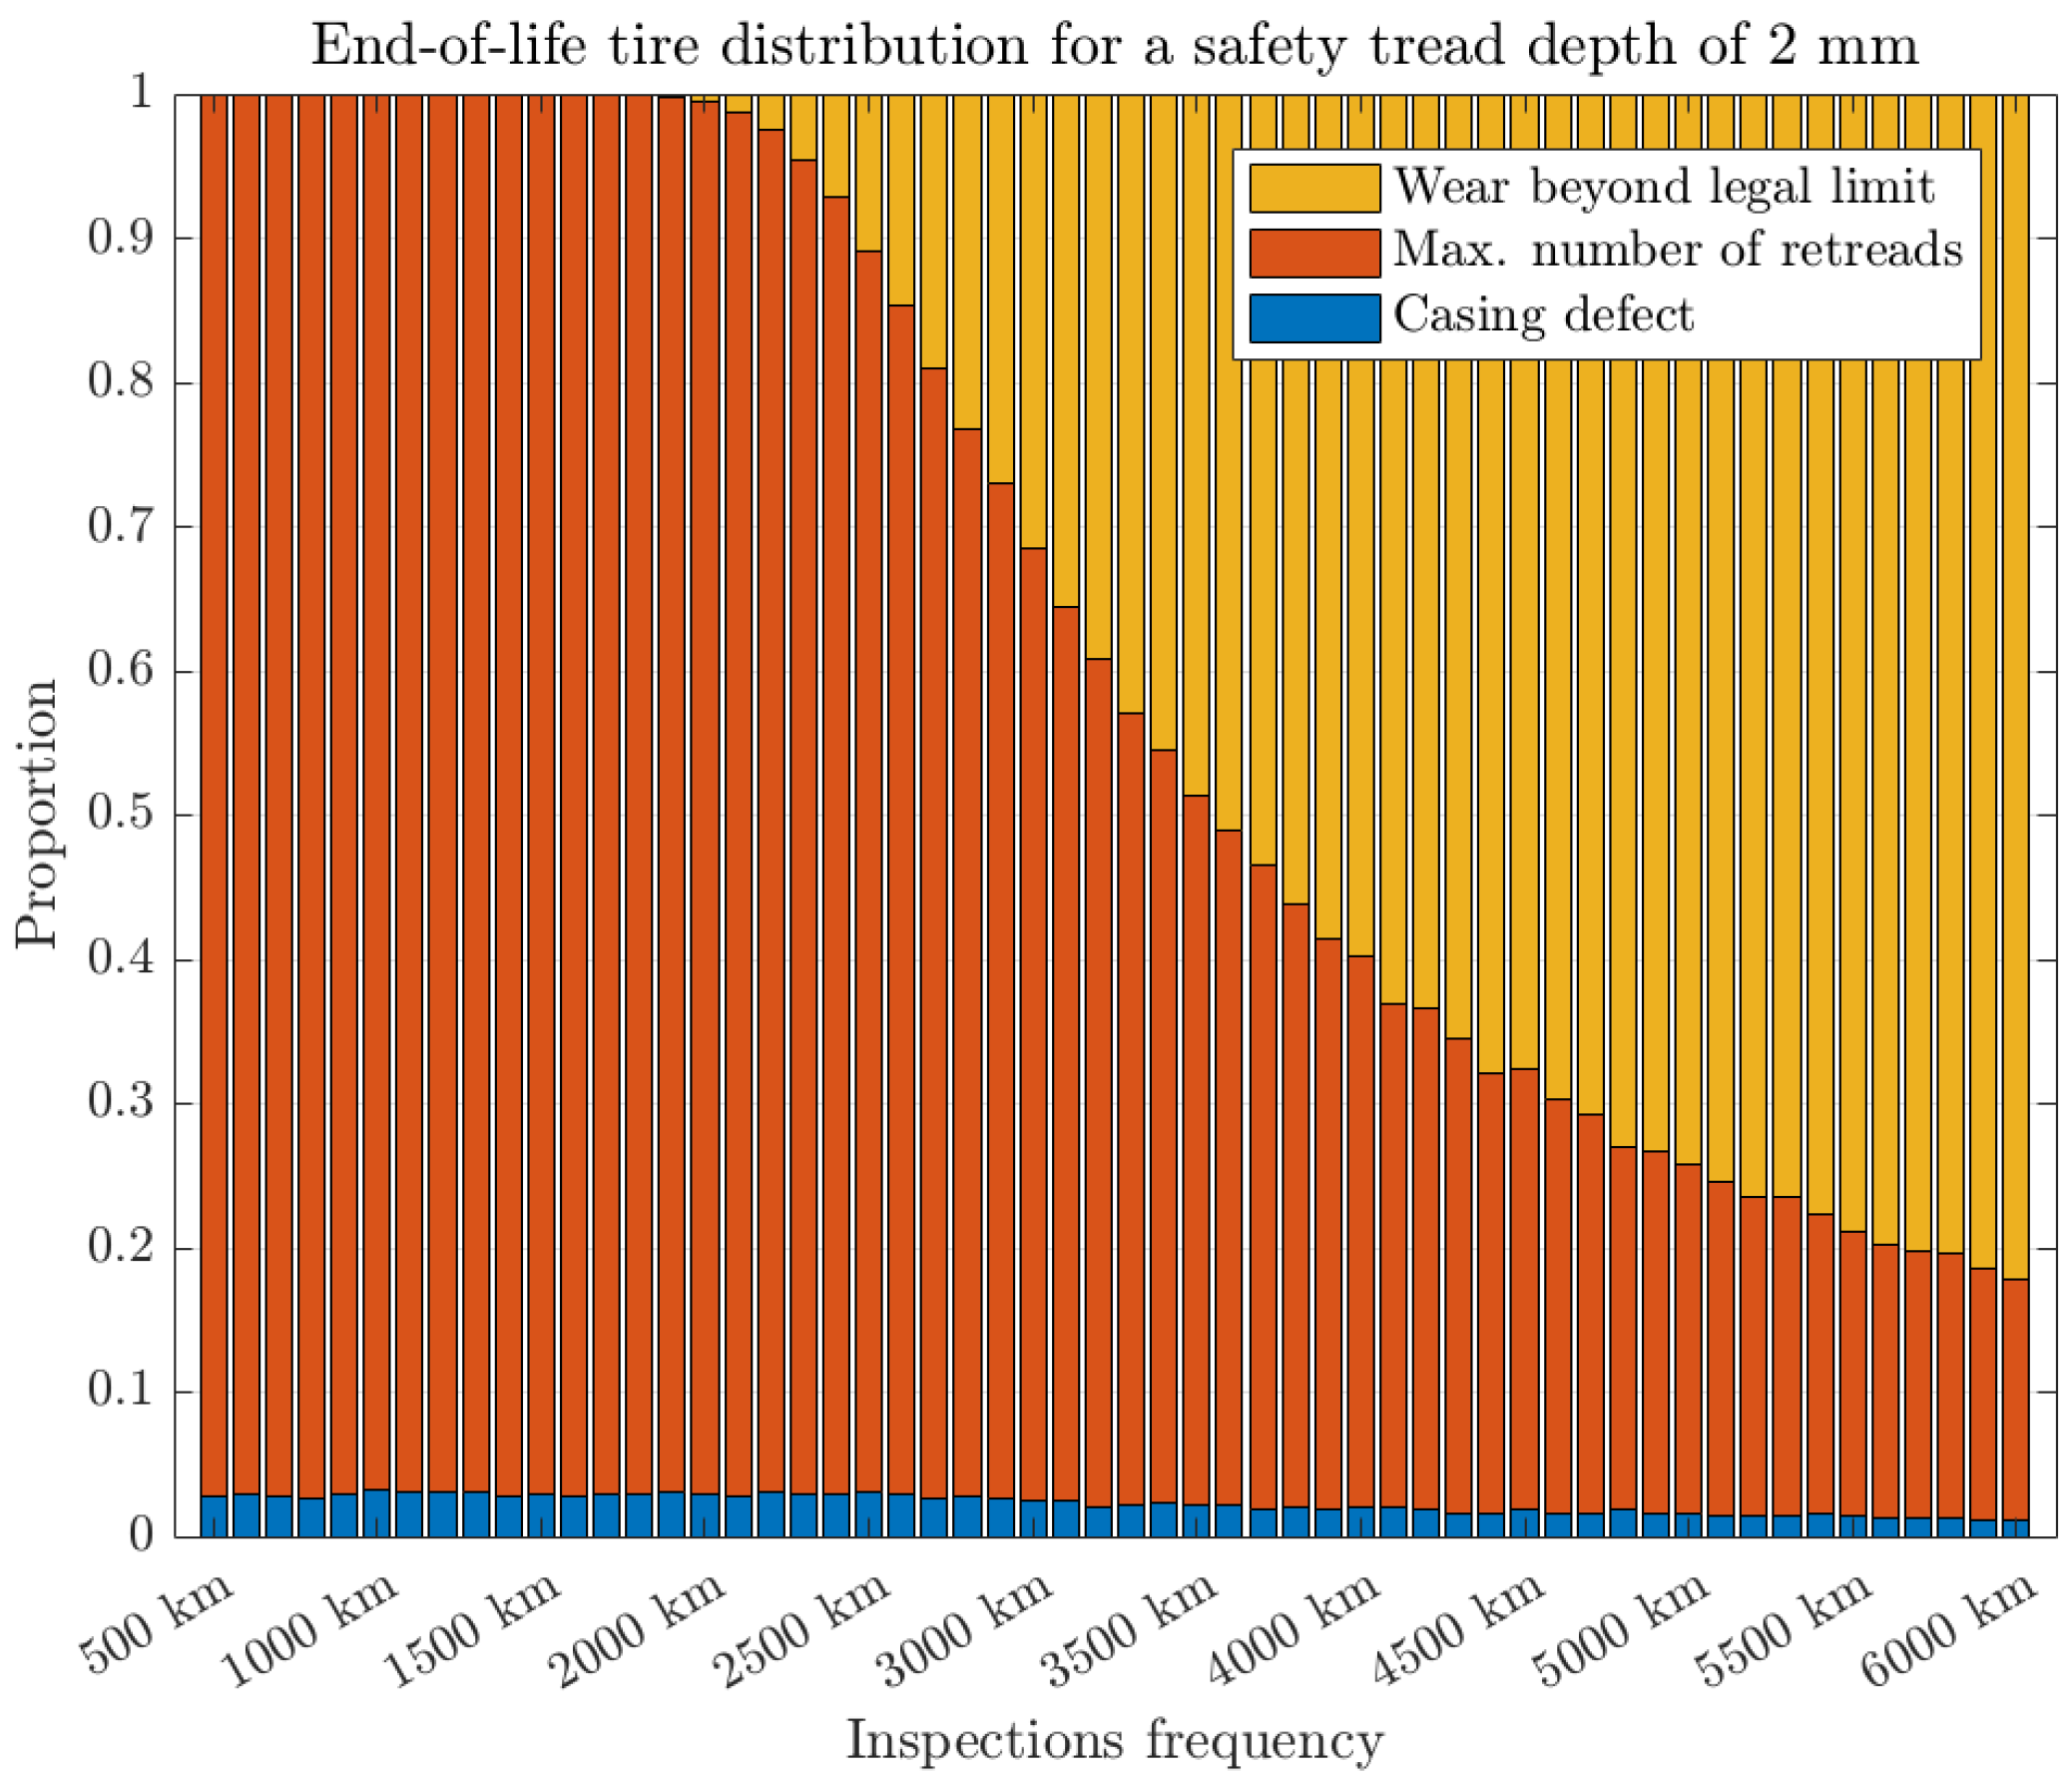
d_RetreadSuccessRate are set to 2 mm and 97%, respectively,
Figure 3 illustrates the distribution of tire end-of-life causes. This figure provides a detailed breakdown of the different failure modes observed across various inspection intervals. This can result from one of three events described in
Section 3.3: Casing Defect, Maximum Number of Retreads, or Wear Beyond the Legal Limit.
When inspection intervals are relatively short, only two stopping criteria emerge: the maximum number of retreads and, consequently, carcass anomalies. The occurrence of these anomalies is directly correlated with the number of retreads through the decision variable d_RetreadSuccessRate, which explains the decrease in this criterion with the increase in inspection intervals.
As the inspection interval increases, a shift occurs in the distribution of failure causes. Initially dominated by casing defects and the maximum number of retreads, tire failures progressively become more influenced by wear exceeding the legal limit. For this chosen value of safety thickness, i.e., 2 mm, we note in
Figure 3 the appearance of the “wear beyond legal limit” criterion from inspections carried out every 2000 km and beyond. This trend suggests that while shorter inspection intervals ensure a higher probability of maintaining retreadable casings, they may also lead to more frequent maintenance interventions, which could increase operational costs.
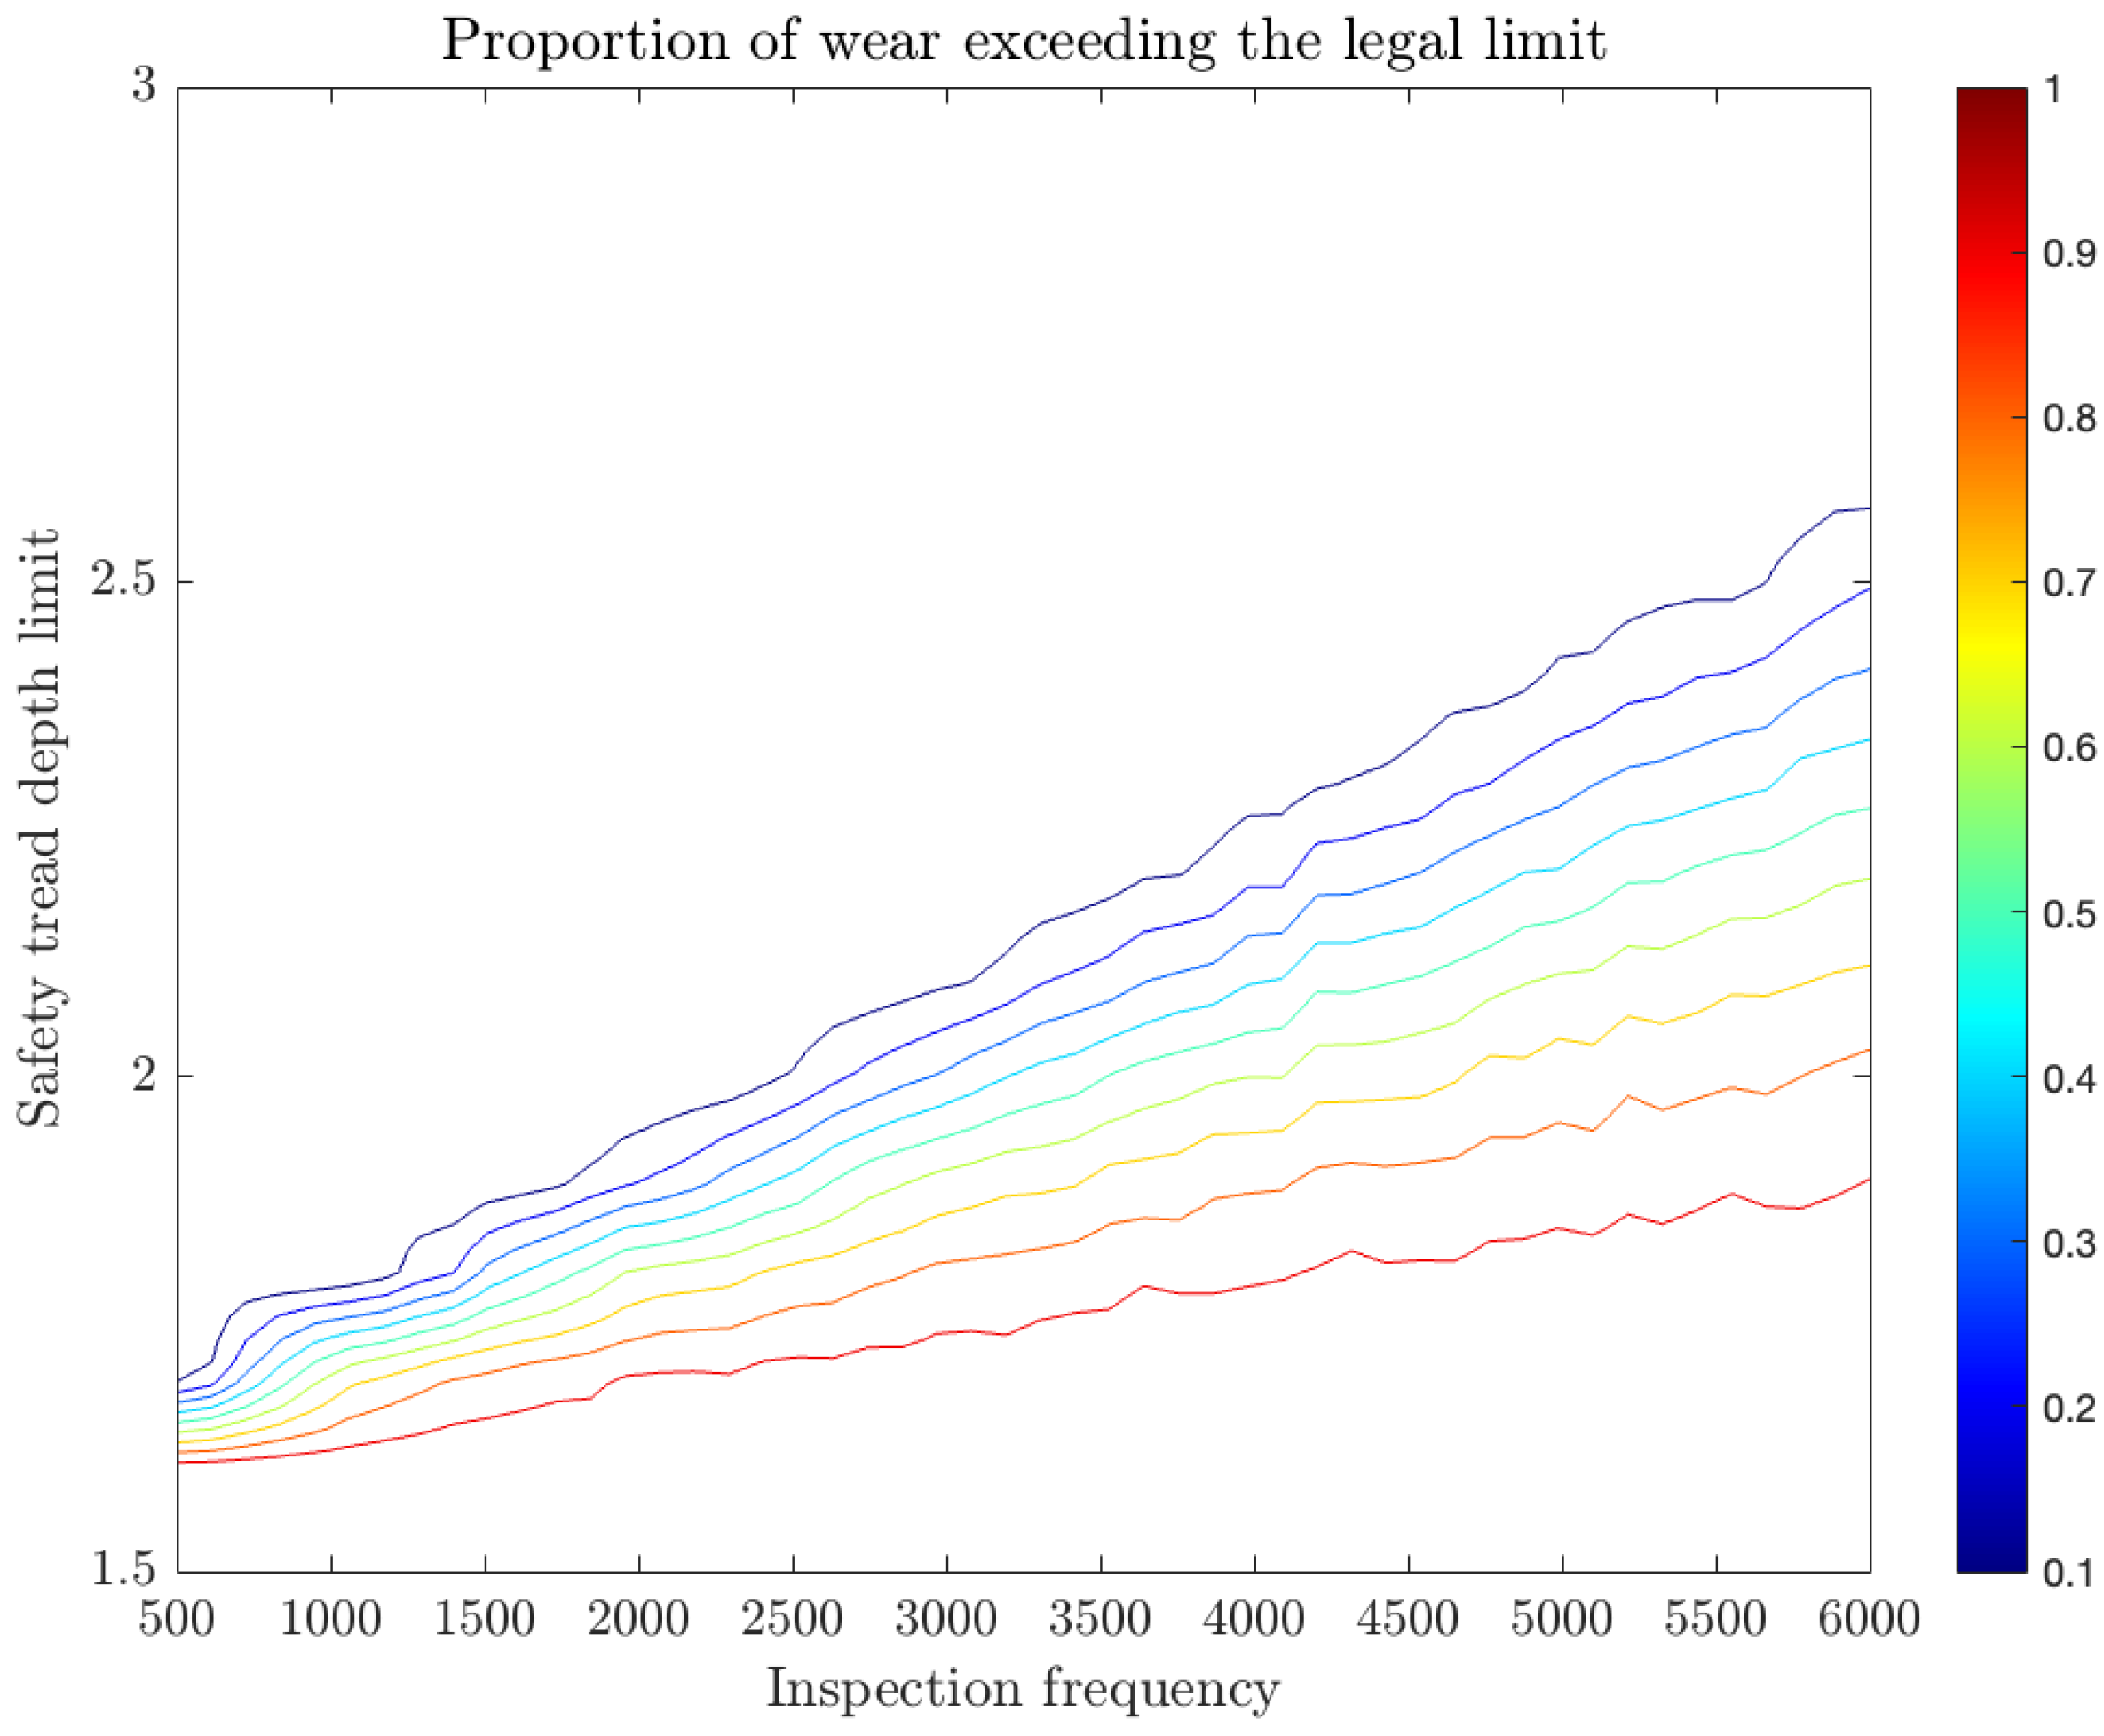
If a strong constraint is imposed, such as limiting the proportion of tires exceeding the legal wear limit to a maximum of x%, an upper bound on the inspection frequency can be established as a function of the decision variable d_SafetyTreadDepth. By defining this threshold, maintenance strategies can be adjusted to balance safety compliance with economic efficiency.
Figure 4 is particularly informative, as it depicts the Pareto fronts illustrating the probabilities of exceeding the legal limit as a function of inspection frequency and the specified safety tread depth limit, but for a single retread with a success rate set at 97%. The contour plot provides further insights into this relationship in the context of optimizing maintenance strategies. It enables a more nuanced understanding of the trade-offs involved in different parameter selections, aiding in the development of targeted maintenance policies. It represents the probability of exceeding the legal wear threshold, with different levels indicated by the color scale: warmer colors (red/yellow) correspond to a higher probability of exceeding the limit, while cooler colors (blue/green) indicate a lower risk.
The Pareto front highlights the trade-off between inspection frequency and tread depth limit: optimizing these two parameters can help maintain compliance with safety standards while minimizing unnecessary maintenance costs. Specifically, we observe that lower safety tread depth limits require more frequent inspections to keep the probability of exceeding legal wear low, whereas higher limits allow for more extended inspection intervals at the cost of increased material consumption.
Overall, this figure supports decision-making by providing a structured approach to determining an optimal balance between inspection schedules and tread depth thresholds, ensuring both safety and cost efficiency. Such visual representations are instrumental in guiding fleet managers toward selecting the most appropriate strategies based on their operational constraints and risk tolerance.
The retreading operation allows for a multi-life tire to have its existing tread replaced with a new one, provided that the tire’s casing is suitable. The complexity of tire life optimization emerges from the intricate interactions between multiple decision variables. Key factors—including inspection frequency, safety tread depth limit, and retread success rate—do not operate in isolation but form a sophisticated, interconnected system where variations in one parameter substantially impact the overall performance and cost-effectiveness. According to various suppliers, casings generally offer a high probability (typically greater than 95 %) for successful retreading operations. However, it is important to account for the risk that a casing may no longer be suitable for retreading, further impacting the average cost per km.
In this regard,
Figure 5 presents a scatterplot based on the values from
Table 4, limited here to the top 1% of the best solutions, i.e., 48 solutions out of a total of 4800 combinations. Each point represents a triplet based on the three previously mentioned decision variables. The selected solutions are only those for which the tread band meets the safety threshold by at least 98%. Colder colors represent solutions with the lowest costs, reinforcing their relative economic advantage.
We observe that these solutions only start appearing for periodic inspections set at 4000 km, meaning that the safety threshold is at least 2 mm, as recalled by the Pareto front in
Figure 4. Already, we can see that these solutions contrast with the single-lifetime tire, where the best solution was obtained for the lowest inspection frequency, namely 500 km.
A deeper analysis of
Figure 5 reveals that the most cost-effective solutions tend to cluster within specific ranges of decision variables. First, higher retread success rates (above 96%) are a common feature among the best solutions, confirming the strong impact of retreading on cost reduction. Second, the inspection frequency appears to have a nonlinear effect: while too frequent inspections increase maintenance costs without significant performance gains, excessively long intervals lead to greater wear beyond the legal limit. The optimal balance seems to lie between 5500 km and 7500 km, where the lowest cost values are observed.
Regarding safety tread depth, values around 2.60 mm to 2.70 mm are particularly favorable, offering an efficient trade-off between durability and material consumption. Interestingly, solutions with deeper treads (above 2.80 mm) do not necessarily lead to better cost performance, likely due to increased material use and higher replacement frequency. Conversely, shallower treads (below 2.50 mm) tend to be associated with higher wear beyond the legal limit, emphasizing the importance of staying within a narrow optimal range.
These findings highlight the complexity of optimizing tire management under the TaaS model. Unlike the single-use tire scenario, where minimizing inspection frequency was a dominant strategy, the interplay between retread success rate, inspection intervals, and tread depth creates a multidimensional decision problem. The results suggest that small adjustments in one variable can have cascading effects on cost, safety, and sustainability, underscoring the need for a carefully balanced approach.
Table 4 presents the 10 best solutions. While the differences between these solutions remain small, the cost advantage of the TaaS model becomes particularly evident when compared to the single-use tire scenario. Specifically, the best single-use tire solution results in an average cost per kilometer of EUR 0.0103, whereas the TaaS model achieves EUR 6.1285
, leading to a cost reduction of approximately 40.5%. In addition, the results reveal several key insights into the relationship between inspection frequency, safety tread depth, retread success rate, and overall performance. First, maximizing the retread success rate significantly reduces costs, as demonstrated by the strong presence of high success rates (above 96%) in the best solutions. Additionally, inspection frequency plays a crucial role, with most optimal solutions falling between 5500 km and 7500 km, suggesting that intermediate intervals strike a balance between maintenance expenses and tire longevity.
Finally, while the total cost per kilometer varies only slightly across the best solutions (ranging from to ), the impact on safety is much more pronounced. These results suggest that minor adjustments to inspection frequency, tread depth, or retread success rate can significantly influence cost performance, but they may also have critical consequences on tire wear compliance and safety, especially when it comes to the overall durability of the tires. Moreover, the cost advantage of the TaaS model becomes particularly evident when compared to the single-use tire scenario. In this case, the best solution for the single-life tire yields an average cost per kilometer estimated at 0.0103, whereas the TaaS model achieves , representing a cost reduction of approximately 40.5%. This cost advantage not only contributes to economic efficiency but also promotes the long-term sustainability of tire maintenance strategies. Therefore, selecting the optimal maintenance strategy requires careful consideration of both economic and regulatory factors to ensure a well-balanced approach between cost efficiency and safety.


