1. Introduction
Coffee (
Coffea spp.) production plays a pivotal role in the socio-economic and cultural landscape of Mexico, in particular, the States of Oaxaca, Chiapas, Puebla, and Veracruz, where it serves as a primary source of income and a strong cultural identity for more than half a million smallholder producers [
1]. Shade-grown agroforestry systems, located within the transition zone between temperate and tropical dry deciduous forests at altitudes of 600–1200 m, dominate Mexican coffee farming. Its geographical location makes production particularly vulnerable to climate change-induced extreme weather events, such as prolonged droughts or heavy rainfall. Plant diseases and pests, such as coffee leaf rust, pose additional risks to coffee producers that are exacerbated by climate change and socio-economic disruptions [
2]. Smallholder producers often lack sufficient access to information and knowledge, hindering their ability to adapt their practices to the new and rapidly changing environmental conditions. They, therefore, benefit from decision-making support tools that are grounded in scientific evidence and offer technological assistance to farmers for sustainable development.
The SABERES project (
https://saberesmx.org/) aims to address this issue by developing a platform that serves as an interface between farmers, scientists, and policymakers. It leverages cutting-edge machine learning and user-centric tools to enhance productivity and help producers adapt to changing climatic conditions. Specifically, the project introduces an innovative Seq2Seq-LSTM model to predict short-term coffee yields in Mexico. The model integrates municipal-level agricultural data from the Mexican Agricultural Census (SIAP) and weather information from the National Water Commission (CONAGUA), covering shade-grown coffee production and climatic variables from 2003 to 2023. Preliminary results have validated the model’s accuracy in replicating reported yields in Oaxaca over the past five years, while its predictions for the next two years exhibit promising reliability and actionable insights for local farmers. To ensure accessibility and impact, the predictive model will be embedded within the SABERES mobile application. This application will provide yield forecasts and recommendations for sustainable farming practices while also serving as a platform for farmers to report their practices and contribute data for model refinement. The app’s integration with a platform called PIAS (Planeación Integrada para la Agricultura Sostenible) and its online monitoring system will further facilitate progress tracking and impact assessment.
This paper addresses the pressing challenges faced by coffee farmers in Mexico by synthesizing state-of-the-art machine learning methodologies with localized data and farmer-oriented tools. It offers a scalable framework for leveraging AI in agricultural sustainability. The following sections outline the methodology, results, and implications of this transformative approach.
2. Materials and Methods
Recent advancements in artificial intelligence (AI) and machine learning (ML) have demonstrated remarkable potential in optimizing resource allocation. Gong in [
3] showcased a time-series model with the ability to enhance load forecasting in power grids, while Cui in [
4] integrated residual mechanisms to improve prediction accuracy and robustness.
The Seq2Seq (sequence-to-sequence) model was first proposed by Cho et al. [
5] to address the challenge of phrase-based machine translation. At its core, a Seq2Seq model consists of two neural networks: an encoder and a decoder. The encoder processes the input sequence (e.g., an English sentence) and transforms it into a condensed mathematical representation, often referred to as a context vector. This vector captures the meaning and structure of the input data. The decoder then takes this representation and generates the corresponding output sequence, such as the translated sentence in French. A long short-term memory (LSTM) network, introduced by Hochreiter and Schmidhuber [
6], is a type of recurrent neural network (RNN) that addresses critical challenges in training, allowing the model to maintain relevant information across time steps and selectively forget or update it through its specialized gates. For example, in a language modeling task, given the phrase “The concert was so”, an LSTM retains the context about the subject and sentiment to predict the next word, such as “amazing”. This ability to selectively remember and forget information makes LSTMs highly effective for applications like speech recognition, text generation, and time-series forecasting.
Seq2Seq models can be enhanced with mechanisms like attention layers and residual connections, further improving their predictive accuracy and robustness. Studies have shown that Seq2Seq-LSTM models outperform traditional methods, such as autoregressive integrated moving average (ARIMA) and standard LSTM architectures, in tasks like electricity load forecasting and retail demand prediction, providing improved accuracy and robustness under uncertain conditions [
7,
8].
Various methodologies, including traditional statistical models and machine learning techniques, have been used to forecast coffee production. Previous studies have demonstrated the usefulness of these approaches, though each presents advantages and limitations in terms of accuracy, generalization ability, and adaptability to changing conditions.
For instance, applying Seq2Seq-LSTM models has enhanced crop price prediction and planning in multi-farmer contexts, addressing objectives like maximizing profits while ensuring ecological sustainability [
9]. Similarly, hybrid models combining deep learning with reinforcement learning, such as double deep Q-learning (DDQN), have demonstrated success in optimizing crop planning and rotational benefits, showcasing the flexibility and scalability of AI-driven solutions in agriculture [
10,
11]. These models have also been successfully applied to household energy management, where Seq2Seq architectures combined with Q-learning have improved load prediction and optimized energy consumption in smart home settings [
10,
11].
A systematic analysis of deep learning-based crop yield prediction highlighted the growing significance of convolutional neural networks (CNNs) and long short-term memory (LSTM) models in estimating crop yields, particularly for staple crops such as wheat and maize. These models effectively integrate remote-sensing data, satellite imagery, and climatic variables, enhancing predictive accuracy compared with traditional methods. However, challenges, such as the availability of high-quality data, model interpretability, and computational costs, remain significant obstacles. The study emphasized the need for hybrid approaches and dynamic spatiotemporal modeling techniques to better capture crop evolution across multiple seasons, representing a key direction for future research in precision agriculture [
12].
Khabarov [
13] utilized the CAF2014 model to simulate coffee agroforestry systems, examining its applicability for assessing climate change impacts and enhancing decision making in agricultural management. This process-based model simulates coffee yields by incorporating climate, soil management, and cultivation practices, providing quantifiable estimates of production potential [
13]. The study highlighted the importance of calibrating and validating models to more accurately reflect local conditions, as simulations can overestimate real yields due to excluding factors such as pests, diseases, and socio-economic constraints [
13]. Additionally, findings suggest that shaded coffee systems may offer added benefits in climate change scenarios, improving soil moisture retention and reducing foliage degradation [
13]. These insights underscore the importance of incorporating advanced modeling techniques into decision-support platforms for coffee producers.
Udiani [
14] applied support vector regression (SVR) with different kernel types to predict Arabica coffee production in Bali, Indonesia. Their results showed acceptable accuracy, with a mean absolute percentage error (MAPE) of 5.14% for the best model. However, while SVR models effectively capture nonlinear patterns, their ability to handle long-term temporal dependencies is limited compared with recurrent neural network architectures such as LSTMs.
Murali [
15] analyzed coffee production in Kerala using time-series models, including ARIMA and SARIMA. These approaches have been widely used due to their robustness in predicting stationary data and their ability to model trends and seasonality. However, they present limitations when dealing with abrupt changes in climatic conditions or incorporating multiple exogenous variables, as they require extensive preprocessing to ensure data stationarity.
Kittichotsatsawat in [
16] compared the performance of ARIMA with artificial neural networks (ANNs) for predicting Arabica coffee yields in Thailand. Their study concluded that ANN models outperformed ARIMA in terms of accuracy, achieving a coefficient of determination (R
2) of 0.9299, compared with 0.7041 for ARIMA. This finding confirms that neural networks can capture more complex relationships between input variables and improve forecasting accuracy, especially in agricultural systems influenced by multiple factors.
2.1. The Used Data
To predict coffee yields using our Seq2Seq-LSTM methodology, we integrated data from two key national sources: CONAGUA (
https://www.gob.mx/conagua, accessed on 30 January 2025) and SIAP (Servicio de Información Agroalimentaria y Pesquera) (
https://www.gob.mx/siap, accessed on 30 January 2025). CONAGUA plays a vital role in managing and protecting the country’s water resources. It operates a network of environmental data acquisition stations strategically located nationwide to monitor key variables, including rainfall, maximum and minimum temperatures, humidity, evaporation, river flow, and water quality. These stations provide critical, real-time data that support informed decision making for sustainable water management and help address challenges such as droughts and floods. SIAP is a government agency responsible for gathering, analyzing, and disseminating data on agriculture, fisheries, and rural development. It provides valuable insights to farmers, policymakers, and researchers, enabling them to make informed decisions that optimize resource use, improve food security, and adapt to climate challenges.
From 1980 to 2023, the data indicate that both the maximum and minimum monthly average temperatures in Chiapas increased gradually, suggesting a broader warming trend in the region. The recorded maximum temperatures have increased from around 30 °C in the early 1980s to consistently exceeding 31 °C in recent years, while minimum temperatures have risen from about 17 °C to nearly 19 °C. Moreover, the monthly precipitation, also given as a monthly average value for Chiapas, has fluctuated significantly—from as low as ~48 mm in 1994 to more than 180 mm in 2020—indicating high variability in rainfall patterns. During periods of higher precipitation or extreme temperatures, coffee productivity often experiences notable declines. At the same time, the harvested area has expanded from around 140,000 hectares in the 1980s to over 240,000 hectares in the 2020s, illustrating increased farming activities despite challenges in yield outcomes. Overall, while agricultural expansion continues, the observed decline in productivity, from averages of 3.0–4.0 tons per hectare in the 1980s to below 2.0 tons per hectare since 2008, raises concerns about the climate’s impact on coffee farming. Warmer conditions and variable rainfall appear to contribute to stress on coffee crops, underscoring the need for adaptive measures, such as improved irrigation, disease management, and the development of more resilient coffee varieties. Addressing these challenges proactively could help stabilize or even enhance yields, ensuring the viability of coffee production in Chiapas in the face of ongoing climatic shifts.
The collected data have been instrumental in training our Seq2Seq-LSTM methodology. By feeding this historical data into the model, we can capture the temporal patterns and relationships between climatic variables (such as temperature fluctuations and rainfall extremes) and the outcomes of coffee yield. The Seq2Seq-LSTM methodology allows us to understand and predict future coffee yields based on historical climatic trends. This approach enables more accurate predictions of future coffee yields, helping farmers and stakeholders anticipate climate impacts, plan resource allocation, and adopt best practices for sustainable production in Chiapas.
2.2. Model Selection
In this study, we implemented the LSTM, ARIMA, and Seq2Seq-LSTM models to predict coffee yields using the historical database from Bali, as referenced in [
14]. For the LSTM architecture, we utilized three hidden layers with 128, 64, and 32 neurons, respectively, followed by a dense layer with six outputs. The Seq2Seq-LSTM architecture was defined as follows: the encoder consisted of layers with 128, 64, and 32, while the two decoders had 32 layers each, followed by a dense layer for six outcomes. For ARIMA, we defined six steps for forecasting.
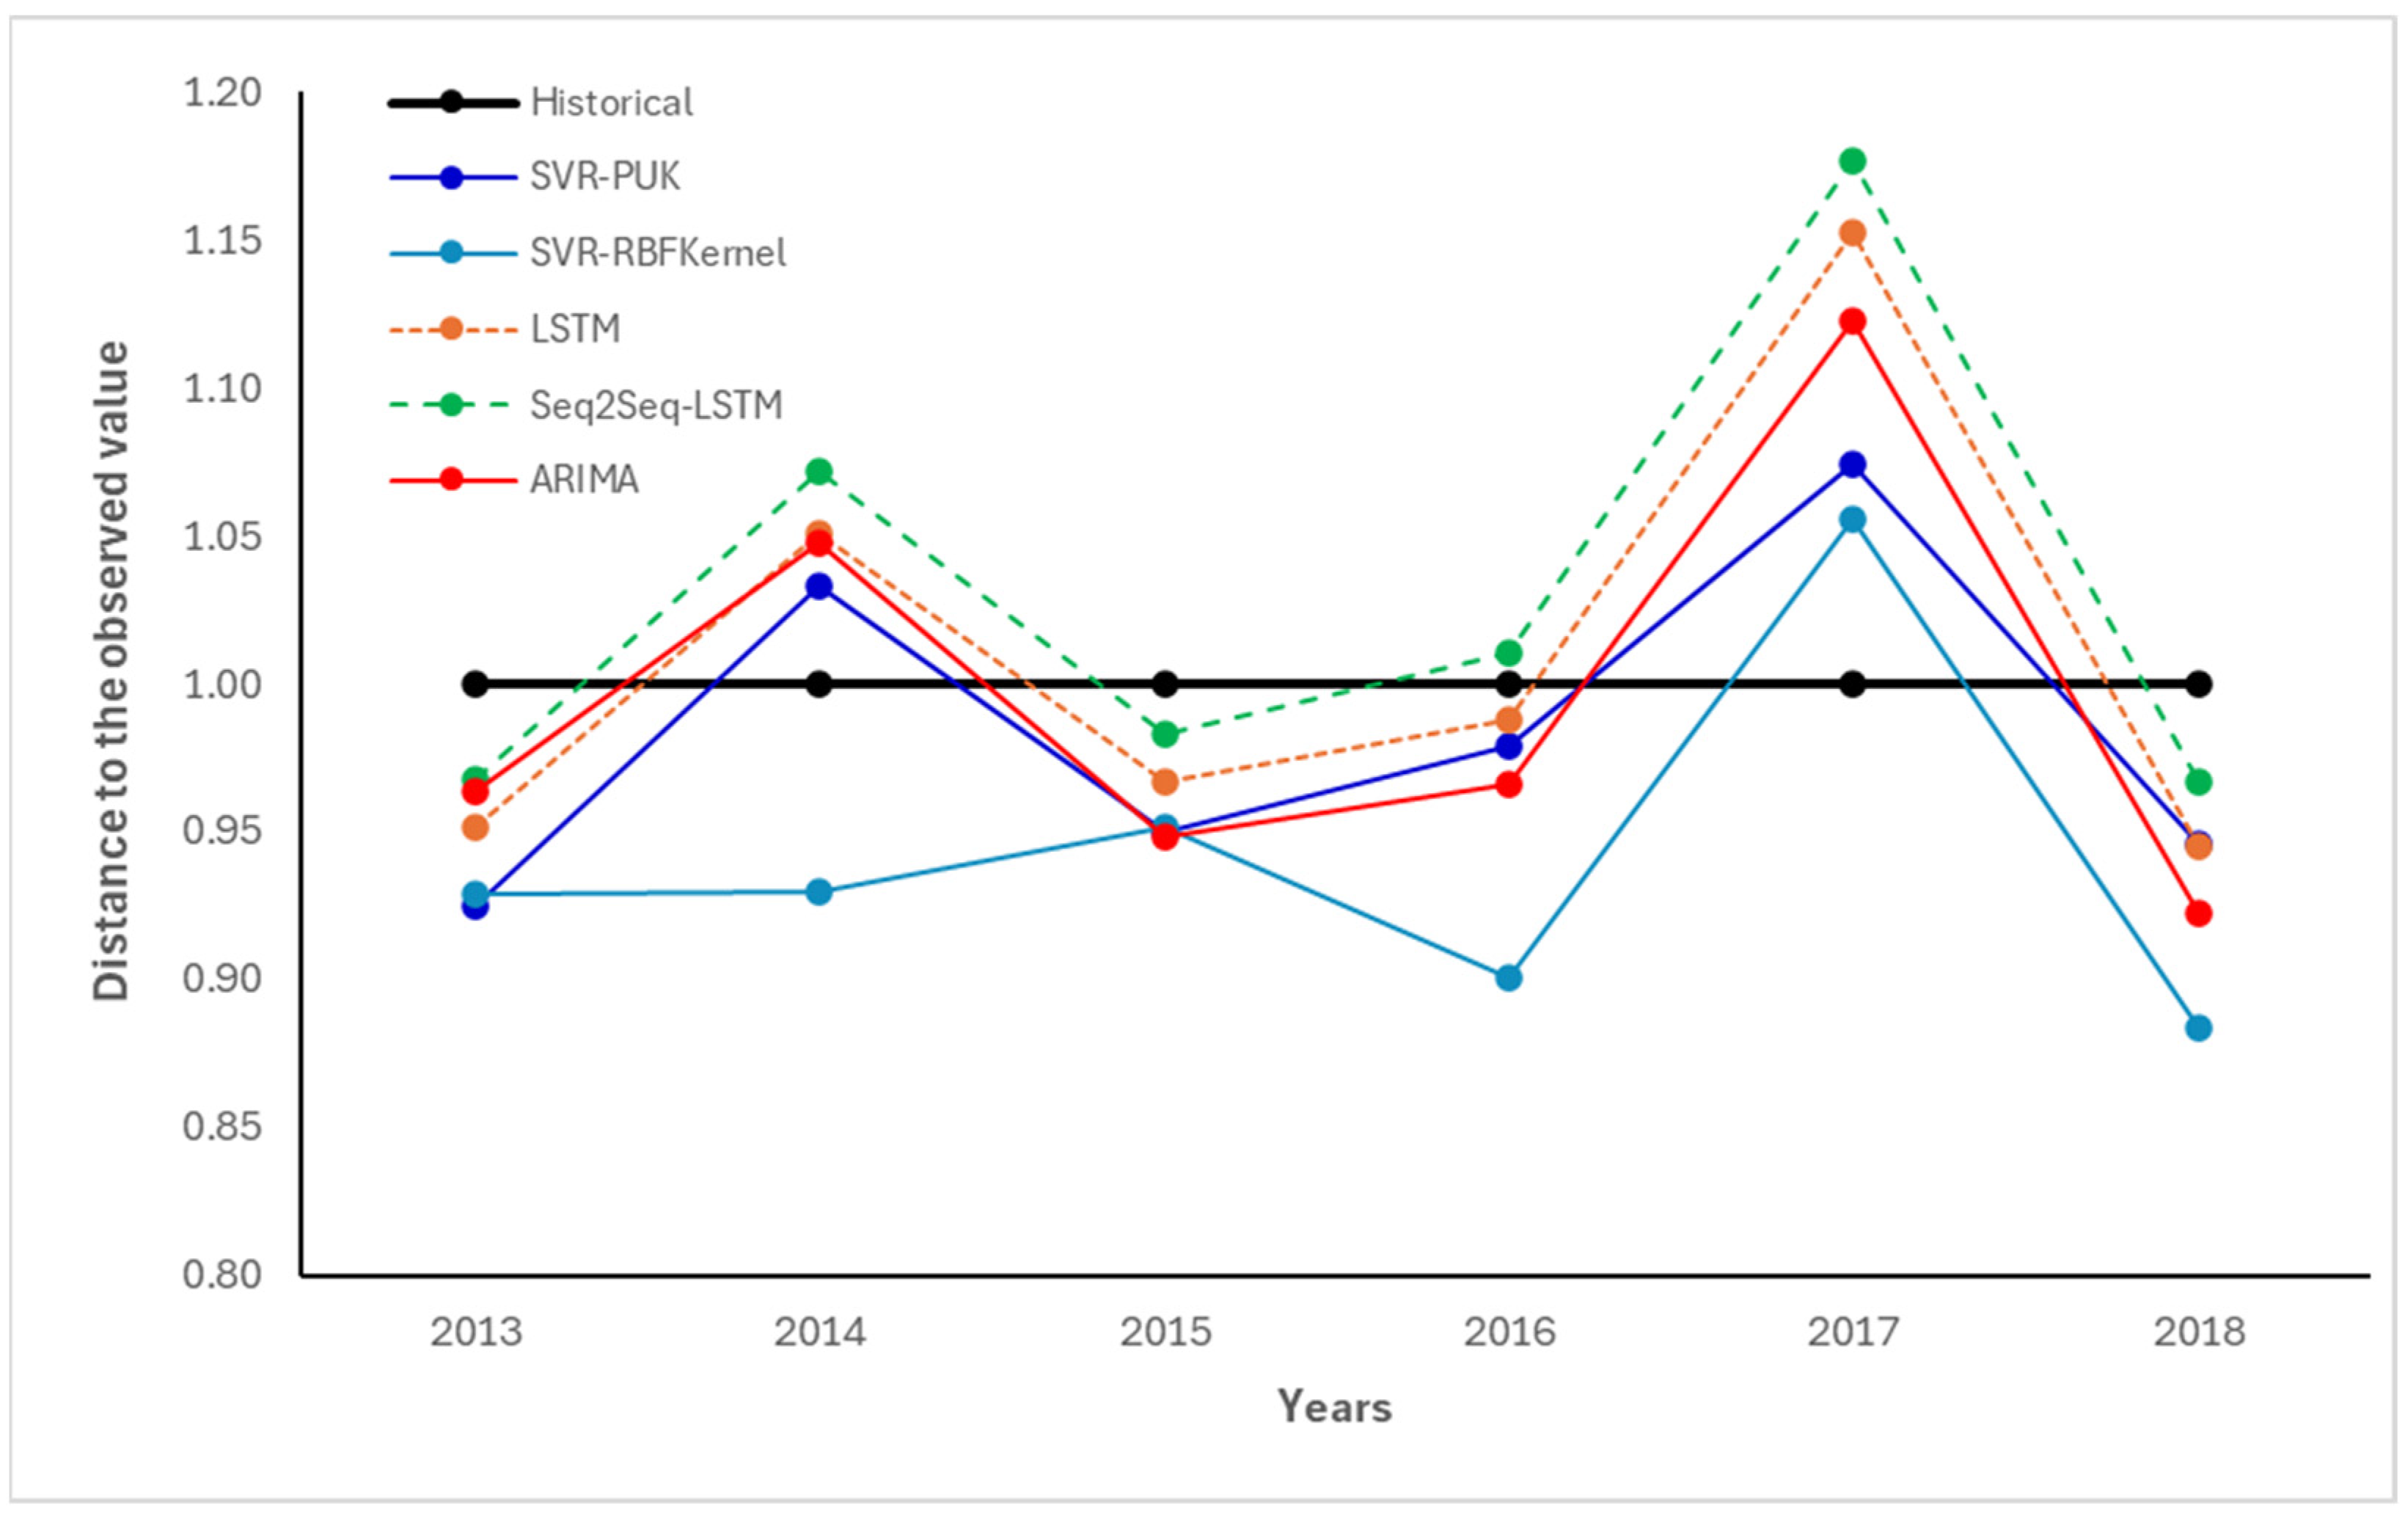
Figure 1 presents the forecasting results for the same years analyzed in [
14], a benchmark comparison of five forecasting methods applied to coffee yield prediction in Bali, Indonesia, from 2013 to 2018, alongside results obtained using the LSTM, ARIMA, and Seq2Seq-LSTM models. The vertical axis represents the normalized distance to the observed value, with the horizontal black line marking the ideal baseline (i.e., a perfect match with the historical yield). The methods compared included SVR-PUK (dark blue), SVR-RBF Kernel (light blue), LSTM (orange dashed line), Seq2Seq-LSTM (green dashed line), and ARIMA (red). The figure highlights the architecture that best forecasted coffee yields for Bali. The LSTM architecture improves upon the results reported in [
14], though with a slightly higher variance, and Seq2Seq-LSTM emerged as the most accurate model overall for the forecasted years. Seq2Seq-LSTM produced the closest match to the historical values in most years, particularly 2014, 2015, and 2016, maintaining consistent proximity to the ideal distance of 1.0 and demonstrating strong generalization. Among classical models, SVR-RBF Kernel and ARIMA showed comparatively lower accuracy in several years—especially 2016 and 2018—indicating limitations in capturing long-range temporal dependencies. While SVR-PUK performed relatively well in 2013, its performance degraded in subsequent years.
2.3. Seq2Seq-LSTM for Short-Term Coffee Yield Predictions
Seq2Seq’s capability to map variable-length sequences to fixed-length vectors and then transform them back into sequences makes it highly suitable for tasks like statistical machine translation. Additionally, the model employs gating mechanisms within its hidden units, inspired by LSTM, to enhance memory capacity and facilitate easier training, thereby enabling better handling of long-term dependencies. The diagram of the Seq2Seq architecture is shown in
Figure 2. The foundational structure of Seq2Seq consists of two neural networks: an encoder and a decoder, designed to effectively handle variable-length input and output sequences, respectively. The encoder processes a source sequence and maps it onto a fixed-length vector representation, capturing the relevant information of the input sequence. The decoder then uses this fixed-length vector to generate an output sequence. In the case of natural language processing (NLP), the decoder predicts the following word in the sequence based on the previous word, the previously generated hidden state, and the context vector from the encoder. This process continues until the entire target sequence is generated.
The Seq2Seq-LSTM algorithm (Algorithm 1) described here implements a Seq2Seq (encoder–decoder) model with an LSTM-based architecture. The Seq2Seq-LSTM algorithm consists of the key steps 1–2: The model is constructed using the Seq2Seq architecture, with LSTM layers in both the encoder and decoder. Steps 3–4: The model is trained with a checkpoint callback to save the best model based on validation loss. Step 5: The best model is loaded for predictions. Step 6: Future predictions are made iteratively by feeding the predicted value back into the model to predict the next time step. Step 7: The scaler transforms the values back into the original scale.
| Algorithm 1: Seq2Seq-LSTM for Coffee Yield Forecasting in Chiapas |
Data = augment_data(X, y, noise_level = 0.02, n_augments = 2)
1. **Define Encoder-Decoder Model:**
Encoder:
- encoder_inputs = Input(shape = (time_steps, num_features))
- encoder_lstm = LSTM(128, return_state = True)
- encoder_outputs, state_h, state_c = encoder_lstm(encoder_inputs)
- encoder_states = [state_h, state_c]
Decoder:
- decoder_inputs = RepeatVector(1)(encoder_outputs) # Repeat context for single output
- decoder_lstm_1 = LSTM(128, return_sequences = True)
- decoder_outputs = decoder_lstm_1(decoder_inputs, initial_state = encoder_states)
- decoder_lstm_2 = LSTM(64, return_sequences = True)
- decoder_outputs = decoder_lstm_2(decoder_outputs)
- decoder_lstm_3 = LSTM(32, return_sequences = False)
- decoder_outputs = decoder_lstm_3(decoder_outputs)
- decoder_dense = Dense(1)
- decoder_outputs = decoder_dense(decoder_outputs)
2. **Compile Model:**
- model = Model([encoder_inputs], decoder_outputs)
- model.compile(optimizer = ‘adam’, loss = ‘mean_squared_error’)
3. **Define Model Checkpoint for Saving Best Model:**
- checkpoint_filepath = models + f”bestModel_{current_time}_TimeStep-{time_steps}.keras”
- model_checkpoint_callback = ModelCheckpoint(filepath = checkpoint_filepath, save_best_only = True, monitor = ’val_loss’, mode = ’min’, verbose = 1)
4. **Train Model:**
- history = model.fit(X_train, y_train, epochs = 150, batch_size = 16, validation_data = (X_test, y_test), verbose = 2, callbacks = [model_checkpoint_callback])
5. **Load Best Model:**
- best_model = load_model(checkpoint_filepath)
6. **Iterative Prediction for Future Time Steps:**
- secuencia_actual = data_scaled[-time_steps:, :−1] # Last ’time_steps’ as input
- secuencia_actual = expand_dims(secuencia_actual, axis = 0) # Add batch dimension for model input
- predicciones_futuras = []
- n_outputs = 2 # Number of future years to predict
For i = 1 to n_outputs:
- prediccion = best_model.predict(secuencia_actual)[0, 0] # Predict next value
- append(predicciones_futuras, prediccion)
- new_sequence = concatenate([secuencia_actual[:, −1, :−1, [prediccion]]], axis = 1) # Update input sequence
- new_sequence = reshape(new_sequence, (1, 1, num_features))
- secuencia_actual = concatenate([sequence_actual[:, 1:, :], new_sequence], axis = 1) # Append new prediction
7. **Inverse Transform Predictions:**
- predictions = scaler.inverse_transform(concatenate([zeros((n_outputs, 4)), array(predicciones_futuras).reshape(−1, 1)], axis = 1))[:, −1] |
To determine the optimal configuration for the Seq2Seq-LSTM architecture, we tested various sequence lengths. These results, shown in
Figure 3, underscore the superiority of deep learning architectures, particularly Seq2Seq-LSTM, for modeling sequential agricultural data. The vertical axis represents the normalized distance to the observed value (actual yield), with the historical data baseline shown in black at a value of 1.0. The lines represent different sequence lengths: 4 years (blue), 6 years (orange), 8 years (green), and all − 1 years (red dashed line), indicating a model trained using all available data except for the target year. Our analysis revealed that using the maximum data sequence provided the best fit for forecasting. The chart illustrates how shorter sequence lengths (4 and 6 years) consistently yielded predictions closer to the observed yields, with distances generally below the historical baseline. These configurations showed greater accuracy, particularly from 2013 to 2016 and again in 2018. The model with 6-year sequences (orange) achieved a strong balance between accuracy and temporal coverage. Conversely, models with longer input sequences (8 and all − 1) tended to deviate more from the observed values, particularly in 2014 and 2017, possibly due to overfitting to long-term trends or sensitivity to early years with different conditions. While the maximum sequence model (all − 1) performed best on average across years, its variability suggests it may not always be ideal for near-term predictions.
Building on these findings, we will apply the best approach to develop a new Seq2Seq-LSTM model for forecasting coffee yields in Chiapas, Mexico, incorporating the optimal sequence length established through this comparative evaluation.
3. Results
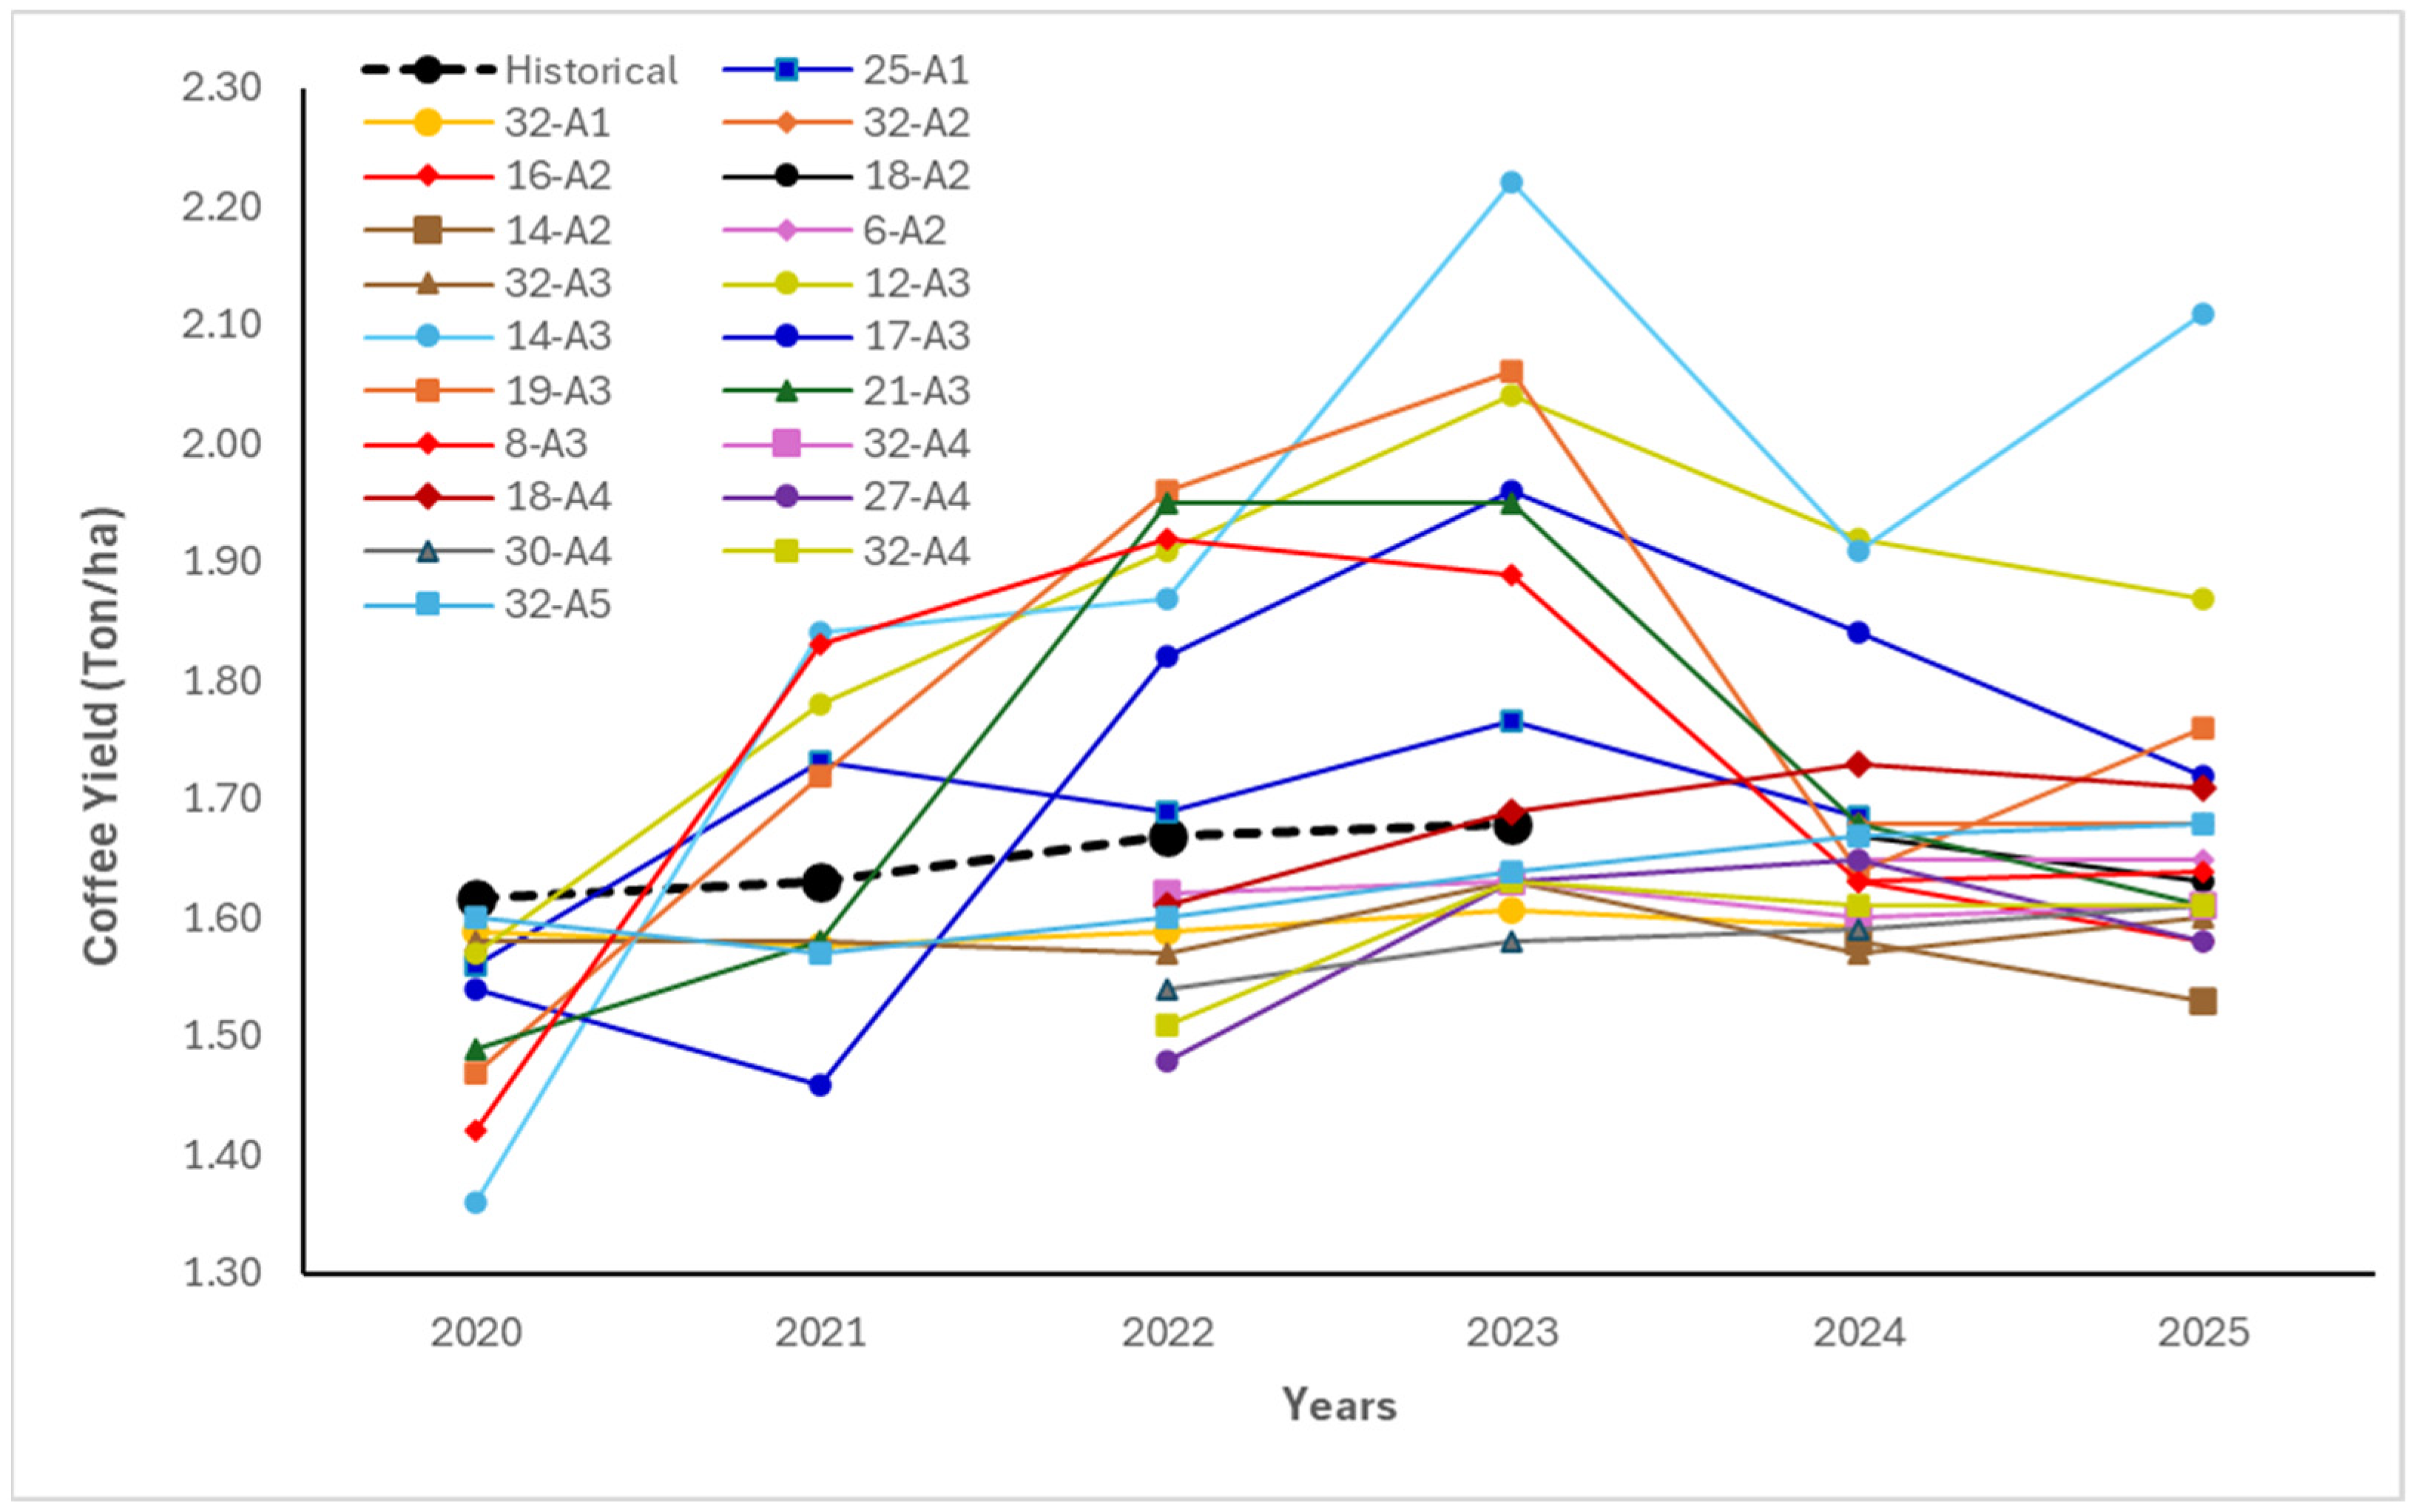
Table 1 illustrates the architectures used (A1, A2, A3, A4, and A5) to identify the optimal Seq2Seq-LSTM model in combination with an LSTM-Gaussian model (32-A5) for predicting coffee yields in Chiapas, Mexico. We ran the models with these configurations combined with the sequence layers shown in
Table 1. The figure shows the historical vs. yield predictions for 2024 and 2025 across the architectures.
Figure 4 shows the coffee yield forecasts (Ton/ha) for the years 2020–2025 generated by multiple model configurations (labeled by unique IDs such as 32-A1, 14-A2, etc.), compared against the historical average trend (dashed black line). Each colored line represents a distinct configuration or experimental pathway within the ensemble modeling framework, while the dashed line denotes the observed historical trend based on SIAP/CONAGUA data. The chart displays historical data for yearly forecasting comparisons. For some architectures, forecasts are generated for varying time ranges, depending on model convergence and configuration. Despite these differences, the chart reveals that most model architectures yielded promising results, with the majority of predicted values aligning closely with historical trends. This consistency suggests that the models—particularly those with well-tuned parameters—can reliably forecast coffee yields, even across multi-year horizons. Additionally, the figure highlights the forecast variability among the models, particularly in the years 2022–2024, indicating differences in sensitivity to input features and model structure. Several configurations (e.g., 32-A5 and 25-A1) projected significant growth, while others (e.g., 16-A2 and 30-A4) remained more conservative. Importantly, the models tended to reconverge toward the historical average in 2020 and 2025, implying generalization stability over longer horizons.
Once the Seq2Seq architecture was identified as the most suitable for forecasting coffee yields, we extended the approach by implementing a Gaussian Seq2Seq-LSTM model, which outperformed all other evaluated configurations. To enhance model robustness, we applied data augmentation techniques and divided the dataset into 70% training, 15% validation, and 15% testing subsets.
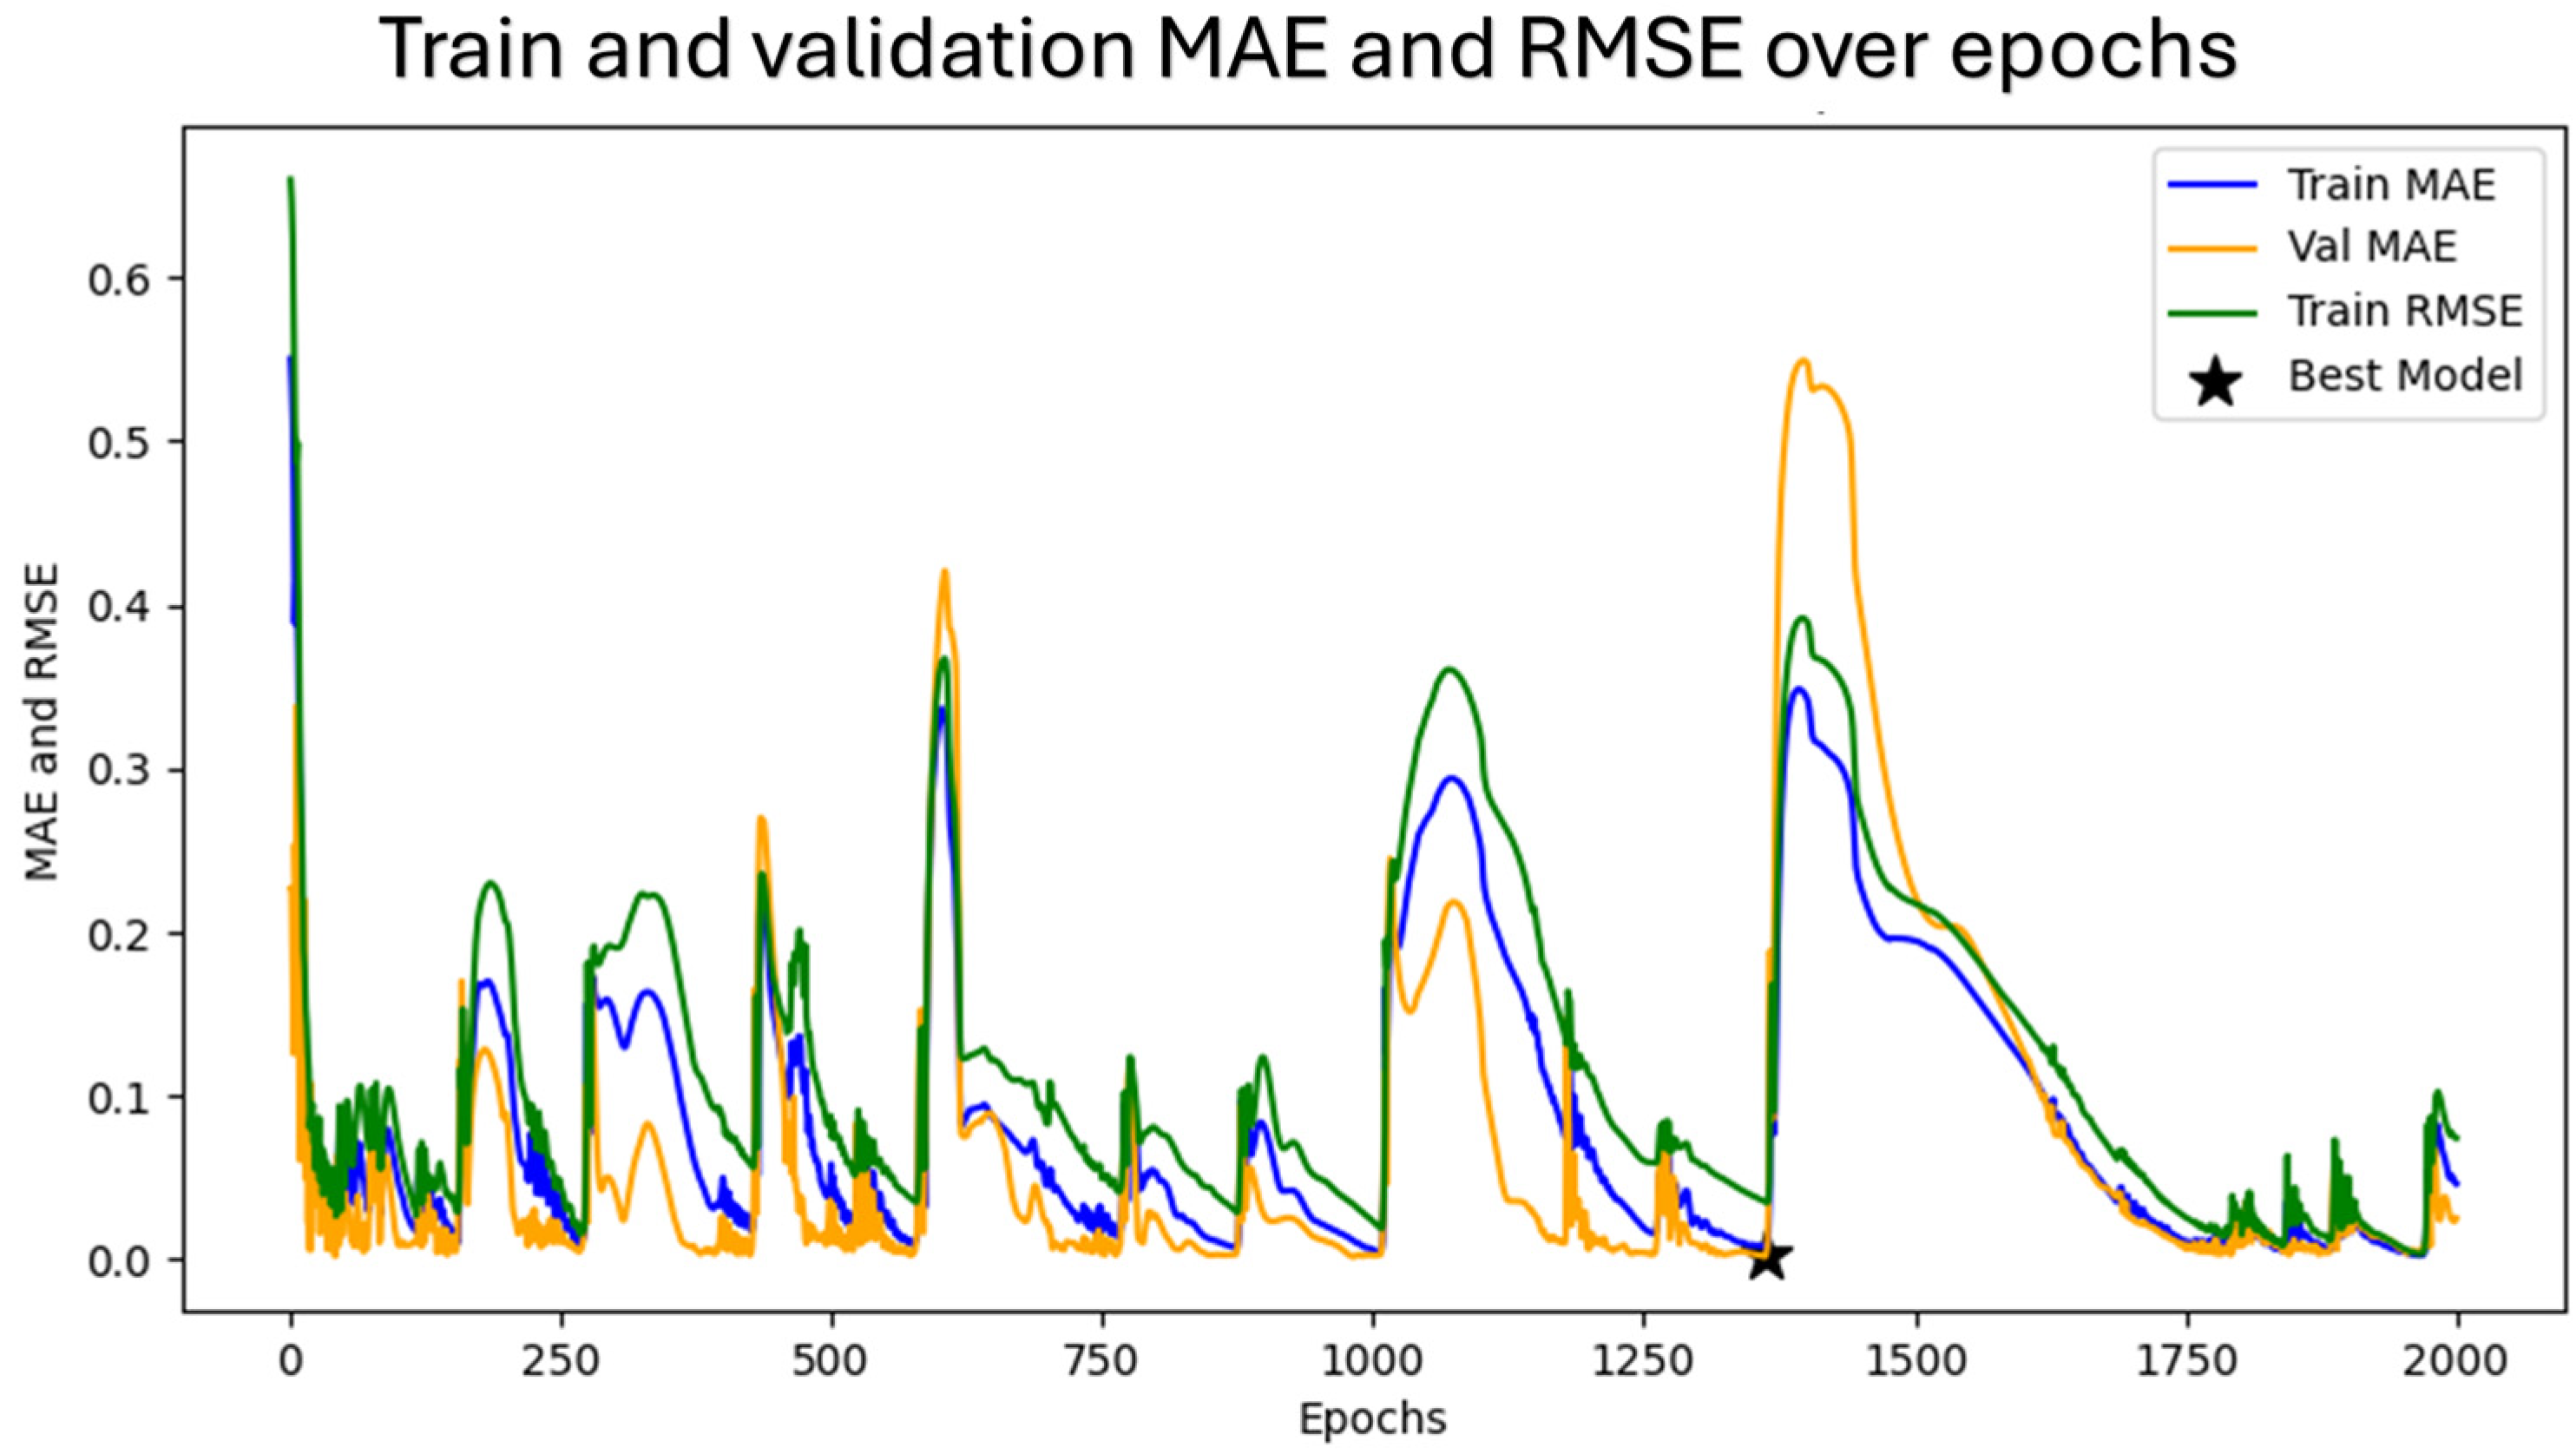
Figure 5 presents the evolution of training and validation metrics across 2000 epochs for the Gaussian LSTM model. The blue line shows the mean absolute error (MAE) on the training set, the orange line represents the MAE on the validation set, and the green line indicates the root-mean-squared error (RMSE) on the training set. The black star marks the epoch at which the model achieved the best validation loss and was selected for inference.
The figure reveals distinct training phases, with multiple cycles of rapid convergence followed by re-divergence, likely due to the stochastic nature of the optimizer and the augmented data. Despite these fluctuations, the model consistently returned to lower error levels, particularly after 1200 epochs, indicating improved generalization.
The RMSE curve (green) shows a higher sensitivity to outliers than the MAE, as expected. Notably, the MAE for both training and validation stabilized below 0.05 in the final epochs, suggesting high precision in yield estimation. The minimal validation MAE gap toward the end of training reflected strong generalization without signs of overfitting.
This training profile confirms that the model benefited from extended training with early stopping, and the final model selection was justified by its robust performance on unseen validation samples.
We evaluated predicted versus observed coffee yields using the proposed Gaussian Seq2Seq-LSTM model across the test set (2012–2023) and forecast horizon (2024–2025) (
Figure 6). The red dashed line represents the model’s predicted yield, while the blue solid line indicates the actual yield recorded for each year. Visual alignment between the predicted and observed lines highlights the model’s strong year-to-year tracking ability.
The model demonstrated high accuracy during stable yield periods, such as 2012–2013 and 2019–2023, with predictions closely matching the actual values. Slight underestimations occurred during periods of yield recovery or decline (e.g., 2014–2017), possibly due to nonlinear shifts in agronomic or climatic conditions that were not fully captured by the input features.
The one-step-ahead forecast (black star) for 2024 and the two-step-ahead forecast (purple star) for 2025 suggest a continued upward trend in productivity, extending the positive trend observed since 2020. The relatively small deviation between the actual and predicted values throughout the test period reflects the model’s robust generalization capacity. To improve interpretability, the vertical axis is restricted to a realistic yield range (1–3 Ton/ha).
4. Discussion
This study highlights the strong performance of Seq2Seq-LSTM models in forecasting short-term Arabica coffee yields, particularly in the context of smallholder farming systems in Chiapas, Mexico. The high fidelity of predictions across historical and forecast periods confirms the model’s ability to capture temporal dynamics influenced by climatic variability and agronomic factors.
Compared with traditional methods like ARIMA and even standard LSTM architectures, the Seq2Seq-LSTM model demonstrated superior generalization and robustness, especially in its Gaussian configuration. The validation metrics further support this conclusion, including low MAE and RMSE scores and the model’s responsiveness to training improvements over 2000 epochs. These results are consistent with prior work emphasizing the advantages of sequence-to-sequence learning in capturing long-range dependencies in time-series data across various fields, including energy and agriculture [
7,
11].
The comparative analysis of model configurations also revealed that the choice of input sequence length significantly impacted model accuracy. Notably, configurations using longer historical sequences (e.g., five or more years) offered improved performance, although excessive sequence lengths led to marginal overfitting in some cases. This finding is critical for practical applications, suggesting a trade-off between temporal depth and predictive generalizability.
The integration of climate and agricultural data from SIAP and CONAGUA not only enhances prediction accuracy but also provides localized insights. The observed inverse relationship between yield and extreme climatic events—particularly temperature spikes and precipitation anomalies—underlines the relevance of climate-smart modeling. The model’s ability to anticipate such patterns empowers smallholders to adopt adaptive strategies, such as adjusting irrigation schedules, planting dates, or crop management techniques.
Importantly, this research contributes to the growing field of AI-driven agricultural decision-support systems. By embedding the model within the SABERES platform, it transforms from a theoretical tool into a practical solution tailored to the needs of coffee producers in vulnerable regions. The app’s two-way data sharing further strengthens the modeling approach by enabling continuous refinement through farmer feedback, a critical feature for ensuring long-term model relevance and trust.
However, some limitations must be acknowledged. First, while the model performs well under historical conditions, it may be less reliable under extreme or unprecedented climate scenarios not represented in the training data. Second, the model does not yet incorporate biophysical constraints, such as pest outbreaks, soil degradation, or socio-economic disruptions, which can strongly affect yields. Future work could further integrate external factors such as disease incidence or market dynamics to enrich the predictive framework.
Finally, although this study focused on Chiapas, the framework is adaptable to other regions with similar data availability. Expanding the model’s geographical scope would enhance its utility and could offer valuable comparative insights for cross-regional planning and resilience building in coffee production.
5. Conclusions
This study employed forecasting models, including LSTM, ARIMA, and Seq2Seq-LSTM, to predict coffee yields, focusing on the Seq2Seq-LSTM architecture. Evaluating these models with the historical database from Bali, along with national data from Mexican institutions such as SIAP for the Censo Agropecuario and CONAGUA for environmental data, revealed that Seq2Seq-LSTM delivers the most reliable forecasting results.
This study emphasizes the importance of selecting optimal configurations and sequence lengths. Specifically, using the maximal data sequence yielded the best performance for both the Seq2Seq-LSTM and Gaussian models, outperforming the tested configurations. Integrating national data further enhanced the model’s predictive capability by providing comprehensive, local climate and environmental inputs, thereby improving the accuracy of the forecasts.
Furthermore, this study emphasizes the importance of making science-based decision-making tools accessible to smallholder coffee producers operating in remote regions that are particularly sensitive to specific climate and environmental conditions, and where specific farming practices, such as shade-grown coffee production, are vulnerable to climate change-driven extreme weather events. Embedding the forecasting method into a mobile app as part of the SABERES project enables farmers to use this tool to anticipate adverse weather impacts, optimize resource allocation, and adapt management practices. Farmers are encouraged to report their progress and upload farm-specific characteristics, such as farm size and practices, to the PIAS online platform. This enables the LSTM method to tailor yield predictions to the specific farm on a continuous basis. Such technology-driven assistance could, therefore, be a valuable addition to the technical assistance typically provided by local farmers’ organizations (FOs). A feature to the application that identifies income and costs for farmers based on yield and price changes is planned to be added in the future. The resulting cost–benefit analysis would help farmers identify economic risks and help financing institutions better target the specific financial needs of smallholder coffee producers.
In conclusion, this research highlights the effectiveness of Seq2Seq-LSTM models in agricultural yield forecasting, particularly in regions such as Chiapas, Mexico, by incorporating national data from SIAP and CONAGUA. These results offer valuable insights for the continued development of precise and reliable forecasting models, contributing to more effective agricultural management in coffee-producing regions.


 ,
, 


