Abstract
Corporate debt financing capacity is a critical factor for a firm’s survival and development. As climate change intensifies, examining the impact of climate risk on corporate debt financing is crucial for addressing climate change challenges. This study integrates data from the China Climate Risk Index (2007–2021) and A-share-listed companies on the Shanghai and Shenzhen stock exchanges, providing an in-depth analysis of the effects of climate risk on corporate debt financing and its underlying mechanisms. The research finds that climate risk significantly inhibits corporate debt financing, with a notable suppressive effect on both long-term and short-term debt financing. Mechanism tests indicate that climate risk suppresses corporate debt financing by weakening firm profitability, reducing asset turnover rates, increasing earnings uncertainty, and raising external financing costs. The moderating effect indicates that national climate risk responses mitigate the impact of climate risk on short-term debt financing while significantly suppressing long-term debt financing. Furthermore, corporate environmental information disclosure demonstrates a stronger inhibitory effect on short-term debt financing when climate risk is elevated. The study provides practical insights for firms and policymakers to address financing constraints under climate risks.
1. Introduction
The “Global Risks Report 2025”, released by the World Economic Forum, highlights climate change as the most significant risk impacting global economic development and social stability. Climate risk is generally categorized into physical risks and transition risks. Physical risks refer to the direct economic losses caused by climate change, while transition risks are associated with asset stranding due to policy adjustments and technological advancements. Climate risks, including climate change, greenhouse gas emissions, and extreme weather events, have caused substantial economic losses worldwide. The “2024 Natural Disaster Loss Report”, released by Munich Re, states that the global economic losses caused by natural disasters and severe weather in 2024 amounted to approximately USD 320 billion. The intensifying impacts of climate risks on industries worldwide have led to declines in agricultural productivity, reduced labor efficiency, tangible asset losses, and significant disruptions to corporate infrastructure, production processes, and operating costs [1,2,3]. Climate disasters have increased global supply chain costs, which, in turn, exacerbate the economic burden of future extreme heat risks. This impact is particularly pronounced in major manufacturing countries such as China and the United States [4]. These escalating climate risks pose severe survival challenges for small businesses, many of which struggle to quickly restore supply chains or adjust production lines, leading to financial distress and even bankruptcy. Therefore, against the backdrop of global climate change, it is crucial to closely examine the impact of climate risk on businesses.
With the intensification of climate change, extreme weather events in China have become more frequent and widespread, highlighting the growing risks associated with climate change. These risks pose severe challenges to the stable operation of China’s real economy and the business activities of enterprises. According to statistics from the China Meteorological Yearbook, since the beginning of this century, China has suffered annual economic losses exceeding CNY 300 billion due to climate change and meteorological disasters. The “China Corporate Climate Risk Report 2023” further indicates that the increase in extreme weather events has become a major challenge for approximately 40% to 50% of enterprises. As the world’s second-largest economy and largest carbon emitter, China is advancing climate strategies through policies like carbon trading, green finance, and corporate emission disclosures. This institutional transition, while guiding the economy toward low-carbon development, has also introduced new frictions in corporate financing—carbon-intensive industries are facing the dual pressures of surging financing costs and declining credit availability.
Against this backdrop, this study aims to systematically examine how climate risk affects corporate debt financing capacity and explore the underlying mechanisms. By identifying how corporate financing capacity changes under climate risk shocks, we seek to reveal how firm-specific characteristics—such as size, ownership structure, and industry type—moderate the financing effects of climate risk, thereby providing theoretical support for the development of a more resilient climate finance policy framework.
This research carries significant theoretical and practical implications. Currently, studies on the impact of climate change on corporate financial behavior remain relatively scarce, particularly in emerging markets, where the mechanisms linking climate risk to debt financing have not been systematically analyzed. By focusing on the overall impact of climate risk on financing capacity and its mechanisms, this paper extends the existing literature, which primarily centers on financing costs. Moreover, the study sheds light on the pathways through which climate risk influences corporate debt financing, offering policy-relevant insights for governments and firms in advancing green finance, and improving climate risk governance. This study focuses on China—a representative emerging economy and the world’s largest carbon emitter—which offers valuable insights for other developing countries undergoing climate transition.
As global climate change intensifies, climate risk has emerged as a critical external factor affecting corporate sustainability [2]. Existing studies generally classify climate risk into the following two categories: physical risks, which refer to direct economic losses caused by extreme climate events such as floods, droughts, and typhoons, and transition risks, which involve asset stranding and valuation fluctuations arising from stricter carbon emission policies, changes in market expectations, or technological substitution during the low-carbon transition [1]. Research shows that extreme weather events increase production costs, reduce asset utilization efficiency, and expose traditional energy assets to stranding risks [5,6]. Production disruptions, supply chain breakdowns, and asset damage caused by extreme weather weaken corporate debt repayment capacity and cash flow stability, thereby increasing default risks [7]. Additionally, transition risk aggravates financing constraints and reduces profitability, significantly raising corporate cost of debt financing [8,9,10,11,12,13]. The transition pressures brought about by China’s low-carbon policies compel firms to bear high compliance costs and capital expenditures during their green transformation, resulting in asset revaluation and increasing financing pressure [14]. Huang et al. [15] pointed out that environmental regulations intensify pressure on corporate balance sheets and may trigger financial risk contagion. Wang et al. [16] discovered that green finance can foster a synergistic governance mechanism between carbon reduction and pollution control, thus alleviating firms’ financing pressure during the transition process to some extent.
Building on this, the literature has further explored how external financing markets perceive and respond to the business uncertainty driven by climate risk, thereby affecting corporate financing abilities [17,18,19,20,21,22]. As financial markets’ awareness of climate risk becomes more explicit, banks and financial institutions are incorporating corporate environmental performance into credit assessments. For example, Chava [12] found that firms with high carbon emissions face significantly higher financing costs in capital markets. Javadi and Masum [23] further confirmed that in regions frequently affected by natural disasters, banks impose a “risk premium” by raising interest rates, requiring collateral, or tightening covenants in response to climate risk. This risk pricing mechanism puts firms in high-carbon industries or climate-vulnerable regions at a disadvantage in debt financing [24]. On this basis, Huang et al. [25] found that regional carbon emission differences and local governance indirectly influence corporate financing through banks’ risk assessments.
Furthermore, Some studies focus on the impact of corporate environmental disclosure and climate governance on corporate debt financing capacity. Environmental information disclosure serves as a key communication channel through which firms convey their climate-related risks and response capabilities to external markets, and the quality of such disclosure directly impacts financing outcomes. Prior studies have suggested that high-quality disclosure helps mitigate information asymmetry between firms and investors or creditors, thereby reducing financing costs [26,27]. However, in the context of elevated climate risk, opaque or unverifiable disclosures may be misinterpreted as negative signals, exacerbating credit tightening and raising financing costs [28,29,30]. Meanwhile, some research has begun to focus on the role of proactive corporate climate actions in financing. Jiang et al. [31] found that firms actively engaged in climate action are able to send signals of operational stability to creditors, thus obtaining lower financing costs and higher debt ratios.
In summary, although the current literature has made preliminary progress in examining the financing implications of climate risk, several research gaps remain, as follows: (1) There is a lack of systematic investigation into the overall changes in corporate debt financing capacity. Existing studies mainly focus on financing costs (e.g., loan interest rates or credit spreads), while comprehensive analysis of debt financing volume and accessibility is still insufficient. (2) There is a lack of in-depth analysis of firm-level heterogeneity factors, such as ownership structure, firm size, and industry type. (3) Empirical findings on how environmental information disclosure mediates the relationship between climate risk and financing are still highly divergent.
Therefore, this paper empirically examines the impact of climate risk on corporate debt financing using data from China’s A-share-listed companies (2007–2021). The results show that climate risk significantly reduces total debt financing, as well as both long-term and short-term debt. The mechanism analysis reveals that return on assets, earnings volatility, asset turnover, and debt financing costs are potential channels through which climate risk affects financing. Heterogeneity analysis indicates that climate risk has no significant effect based on firm size or climate-sensitive industry, but state-owned enterprises are more effectively withstand the impact of climate risk on debt financing. Moderating effects reveal that the climate performance index strengthens the suppression of long-term debt financing, while environmental information disclosure exacerbates the suppression of short-term debt financing.
Compared to the existing literature, this paper makes the following key contributions: First, it extends the theoretical framework by linking climate risk and corporate financing, providing direct evidence that climate risk suppresses corporate debt financing. Previous studies have focused on the impact of climate risk on financing costs. Second, it reveals the multiple mechanisms through which climate risk affects corporate debt financing. Based on data from Chinese listed companies, the paper identifies how climate risk impacts financing channels and internal operations, including profitability, asset turnover, uncertainty, and financing costs. Third, it identifies the moderating effects of national climate responses and corporate environmental disclosures on the relationship between climate risk and debt financing. These findings provide important policy insights and offering practical guidance for businesses.
The remaining structure of this paper is as follows: Section 2 presents the theoretical analysis and hypothesis development; Section 3 outlines the research design, including sample selection, data sources, variable selection and explanation, and model construction. Section 4 provides an empirical results analysis. Section 5 presents a heterogeneity analysis. Section 6 examines the impact pathways of climate risk on corporate financing, along with the effects of climate change performance and environmental information disclosure. Section 7 concludes with findings and policy implications.
2. Theoretical Analysis and Research Hypothesis
2.1. Climate Risk and Corporate Debt Financing
Climate risk typically impacts corporate assets and operations through physical risks and transition risks, weakening banks’ willingness to lend, increasing the difficulty of corporate debt financing, and ultimately affecting corporate debt financing decisions and behaviors. On the one hand, extreme climate events—such as floods, hurricanes, and droughts—directly damage fixed assets and disrupt supply chains [23,24], while long-term physical risks—such as rising temperatures and abnormal precipitation—undermine corporate operational efficiency by increasing equipment wear and labor costs [32]. Extreme climate events can reduce labor availability, increase production costs, lower asset utilization efficiency, and render some traditional energy assets stranded [33,34]. The production disruptions, supply chain breakdowns, and asset damages caused by extreme weather events weaken corporate debt repayment capacity and cash flow stability, thereby increasing their default risk [2].
On the other hand, during the transition to a low-carbon economy, transition risks—such as carbon pricing, emission regulations, and shifts in market preferences—may lead to asset stranding and valuation fluctuations for firms [8,9,10]. Do et al. [7] find that transition risks accelerate the stranding of assets in carbon-intensive industries through policy regulations (e.g., carbon trading) and technological iteration, resulting in revenue declines for high-emission firms. In China, transition risks brought about by low-carbon policies force firms to bear higher compliance costs and capital expenditures during the green transition, leading to asset revaluation and increased financing pressure [14]. Huang et al. [15] point out that environmental regulations intensify pressure on corporate balance sheets and may trigger the spread of financial risks. He and Zhang [35] find that China’s carbon-trading policy imposes relatively limited fiscal constraints on high-emission state-owned enterprises. Wang et al. [36] find that green finance can foster a coordinated governance mechanism between carbon reduction and pollution control, thereby alleviating, to some extent, the financing pressure faced by firms during the transition. In addition, the shift in consumer preferences toward low-energy products and the adoption of new technologies increase the obsolescence of existing resources and equipment, causing high-carbon enterprises to face revenue declines, rising costs, and deteriorating business performance. Therefore, in the long run, climate risk will impact corporate asset value and operational performance through multiple channels, ultimately affecting firms’ debt repayment capabilities.
Bank loans are a primary source of external financing for enterprises. As businesses that manage operational risks, banks remain highly sensitive to various risk factors. Climate risk, which causes damage to corporate assets and declines in operational performance, reduces a company’s willingness and ability to repay loans [17], thereby amplifying the default risk in the bank’s loan portfolio [18]. This leads to banks exhibiting loan reluctance behavior, severely inhibiting companies’ ability to secure external financing. As climate risk intensifies, governments and financial regulators worldwide have gradually placed significant emphasis on financial risks arising from climate issues [37]. Financial institutions, particularly in the banking sector, have incorporated climate risk into their lending decision-making process, reducing their climate risk exposure by increasing loan interest rates, tightening loan contract terms, lowering loan amounts, and decreasing approval rates [20,21,22].
Thus, climate risk causes multiple negative impacts on corporate assets and operational performance, significantly affecting corporate debt repayment capacity. Financial institutions, such as banks, may choose to reduce loan disbursements to avoid potential non-performing loans, which in turn suppresses corporate debt financing. Based on the analysis above, the following hypothesis is proposed.
Hypothesis 1.
Climate risk suppresses corporate debt financing.
2.2. Mechanisms of Climate Risk on Corporate Debt Financing
Climate risk will affect corporate debt financing willingness and ability through various channels, thereby inhibiting corporate debt financing.
Firstly, climate risks may curb corporate debt financing by eroding profitability. Extreme weather or prolonged climatic shifts can damage infrastructure, reduce productivity, and weaken firms’ repayment capacity, prompting lenders like commercial banks to restrict credit to mitigate default risks. Declining profitability also tarnishes corporate reputation, indirectly impairing external financing access. These dual mechanisms—direct credit constraints and indirect reputational harm—underscore climate risks’ threat to sustainable corporate borrowing.
Secondly, climate risk may increase the uncertainty of corporate revenue and, thus, affects debt financing ability. In the long term, the uncertainty of future revenue increases, since enterprises cannot accurately predict future climate risk or natural disasters. Additionally, under the impact of climate risk, resource price fluctuations and supply instability may create significant uncertainties in production costs and resource acquisition [15]. The increase in revenue volatility caused by climate change raises corporate operational difficulties, making capital markets more cautious about investing in related enterprises, meaning corporations will face greater financing difficulties.
Thirdly, climate risks may escalate corporate financing costs, thereby impairing debt financing capacity. Heightened climate uncertainties have shifted investor preferences toward firms with robust environmental, social, and governance (ESG) performance, constraining financing access for enterprises exposed to significant climate risks with inadequate mitigation strategies. Concurrently, financial institutions adopt risk-pricing mechanisms—including elevated interest rates, stringent collateral requirements, and restrictive debt covenants [20]—to hedge against climate-induced default risks. These compensatory measures substantially inflate debt financing costs. Within a cost–benefit analysis framework, the increased financial burdens from higher borrowing costs, and contractual constraints reduce firms’ debt financing incentives, ultimately disrupting corporate debt financing activities.
Extreme climate events can directly devastate production facilities, triggering operational paralysis, supply chain disruptions, and logistical bottlenecks that amplify production and operational costs. Additionally, firms may face forced retrofitting or replacement of carbon-intensive assets (e.g., high-emission facilities and equipment), resulting in asset redundancy, underutilization, and diminished efficiency in asset deployment. These dynamics collectively erode asset utilization efficiency and turnover rates, prolonging the conversion of assets into cash flows. Insufficient cash flow exacerbates liquidity constraints, undermining debt repayment capacity. Consequently, investors and financial institutions increasingly question firms’ operational resilience and asset management competence, heightening barriers to securing debt financing.
Therefore, climate risk may inhibit corporate debt financing through multiple channels, including impacting profitability, revenue uncertainty, external financing costs, and asset turnover speed. Based on the above analysis, the following hypotheses are proposed:
Hypothesis 2.
Climate risk inhibits corporate debt financing by reducing profitability.
Hypothesis 3.
Climate risk inhibits corporate debt financing by increasing revenue uncertainty.
Hypothesis 4.
Climate risk inhibits corporate debt financing by increasing external financing costs.
Hypothesis 5.
Climate risk inhibits corporate debt financing by reducing asset turnover speed.
2.3. Impact of Climate Risk Response and Environmental Information Disclosure
To mitigate the long-term effects of climate change, more and more countries and governments are implementing various policies and measures to address climate change. As the largest developing country and carbon emitter, China has actively participated in global climate governance and implemented a series of climate policies, such as carbon emission trading, carbon pricing, and green finance to alleviate the impact of climate risk, and the enterprises financing environment has undergone profound changes. First, under the carbon peak emission requirements and the carbon-trading market mechanism, enterprises face stricter environmental compliance requirements, and high-carbon emission enterprises bear higher operational costs, which may further exacerbate the negative impact of climate risk on corporate debt financing. In addition, frequent changes and uncertainty in climate policies may lead to new compliance costs or adjustments in operational models for enterprises. Financial institutions may require higher risk premiums to offset potential losses caused by climate policy changes. On the other hand, with the implementation of national green finance policies, enterprises may alleviate financing pressure by issuing green bonds or obtaining green loans. Therefore, climate risk response may play a moderating role in the impact of climate risk on corporate debt financing.
To achieve climate and environmental governance goals, regulatory authorities have clearly established environmental information disclosure requirements for listed companies. Environmental information disclosure is an essential means for enterprises to communicate with external investors and is a strategic behavior to reduce external financing costs and improve stock liquidity [26,27]. First, environmental information disclosure covers the climate risk faced by enterprises and their mitigation measures, which can partially alleviate the inhibiting effect of climate risk on corporate debt financing. For example, by disclosing risk conditions, emission reduction strategies, and response measures, enterprises provide financial institutions with information about their climate risk exposure, effectively reducing internal and external information asymmetry, which helps companies secure bank loans in a climate-risk environment. However, the process of environmental information disclosure itself may incur costs. Disclosing climate risk conditions may expose potential environmental liabilities, intensifying public concerns about corporate risk-bearing capacity, which can negatively impact debt financing. In addition, environmental information disclosure may affect corporate reputation and market image, which in turn influences debt financing channels and conditions. Enterprises with comprehensive disclosures and operations aligned with green development are more likely to obtain financing from financial institutions. In contrast, companies facing severe climate risk may expose their climate risk conditions more fully through disclosure, leading financial institutions to reduce their credit supply.
Based on the above analysis, the following hypotheses are proposed:
Hypothesis 6.
Climate risk response has a moderating effect on the relationship between climate risk and corporate debt financing.
Hypothesis 7.
Environmental information disclosure has a moderating effect on the relationship between climate risk and corporate debt financing.
3. Research Design
3.1. Variable Selection and Description
3.1.1. Dependent Variables
The dependent variables in this study are selected from the following three perspectives: overall debt financing, long-term debt financing, and short-term debt financing. Specifically, the variables are defined as follows. Debt Financing means the ratio of the sum of short-term borrowings, current portion of long-term borrowings, long-term borrowings, bonds payable, and long-term payables to total assets. Long-term debt financing means the ratio of the sum of long-term borrowings, bonds payable, and long-term payables to total assets. Short-term debt financing means the ratio of the sum of short-term borrowings and the current portion of long-term borrowings to total assets.
3.1.2. Core Independent Variable
Climate risk is the key independent variable in this study. We employ the Climate Risk Index (CRI), published by the environmental organization Germanwatch, serves as a proxy for climate risk. The CRI is constructed based on the actual occurrence of weather-related disasters (e.g., number of deaths and economic losses), long-term trends, and vulnerability indicators. It provides measurements and rankings of climate risk for over 130 countries and regions worldwide, offering a high degree of objectivity and international comparability. The CRI not only quantifies the impacts of extreme weather events—such as fatalities and economic losses—but also captures both the absolute and relative effects of these events. It ranks countries based on the following four key indicators: (1) total number of deaths, (2) deaths per 100,000 inhabitants, (3) total economic losses (in US dollars, adjusted for purchasing power parity), and (4) losses as a percentage of GDP. The index reflects the actual impacts of extreme climate events over time, rather than being based on subjective evaluations or indirect estimations, thus offering a strong empirical foundation. Accordingly, this study uses the annual CRI values for China as a national-level proxy for climate risk.
3.1.3. Control Variables
To accurately identify the impact of climate risk on corporate debt financing, this paper selects a series of control variables. The scale of an enterprise (LOGSIZ) is closely related to corporate goodwill and directly affects corporate financing outcomes, with larger firms typically possessing higher credit ratings and more collateral assets [38], as measured by the natural logarithm of total assets. Firm growth () influences its future development prospects and profitability. High-growth firms tend to have more stable future cash flows and lower default risks, making it easier for them to gain the trust of banks and other financial institutions. Firm growth () is measured by the price-to-book ratio, which reflects the corporate growth potential. Tobin Q (), the ratio of a firm’s market value to its replacement cost, is often used to assess whether a firm is overvalued and plays a key role in corporate financing decisions [39]. A firm’s profitability is an important indicator of its debt repayment capacity and directly influences the lending willingness of banks. Profitability is measured by the return on assets (), which is calculated as net income divided by total assets. Revenue volatility () reflects the uncertainty of a firm’s operations, and creditors generally prefer firms with more stable business performance. Free cash flow () reflects corporate ability to meet its debt obligations, calculated as the operating cash flow minus capital expenditures, divided by total assets. Intangible asset ratio () measures the proportion of intangible assets to total assets, indicating the corporate asset structure and impact of intangible assets on financial health. The shareholding ratio of the largest shareholder () reflects the concentration of corporate ownership, measured by the ratio of the number of shares held by the largest shareholder to the total number of shares of the enterprise [40].
3.2. Sample Selection and Data Sources
The core explanatory variable, climate risk, is sourced from Germanwatch, which has published climate risk data for over 130 countries and regions from 2007 to 2021. Therefore, this study selected the annual data of listed companies in the Shanghai and Shenzhen A-share markets from 2007 to 2021 as the initial sample. The data were then processed according to the following criteria: (1) samples with missing data for key variables were excluded and (2) samples with fewer than five years of observation were excluded. The final datasets included data from 4952 listed companies from 2007 to 2021, yielding a total of 43,830 observations. Data on corporate debt financing capacity and other control variables were sourced from CSMAR, while macroeconomic variables were obtained from the National Bureau of Statistics.
3.3. Model Construction
To test the proposed research hypotheses, this study examines the impact of climate risk on corporate debt financing, long-term debt financing, and short-term debt financing. Three regression models were established as follows:
The dependent variables in models (1) to (3) are corporate debt financing, long-term debt financing, and short-term debt financing, respectively. The core explanatory variable is the lagged climate risk. The control variables include (the logarithm of firm size), (Tobin’s Q), (firm free cash flow), (book-to-market ratio), (annual earnings volatility), (return on total assets), (intangible assets ratio), and (proportion of shares held by the largest shareholder). A detailed explanation of these variables can be found in the earlier section on variable selection and description. represents the firm-specific effects, and denotes the error term.
3.4. Descriptive Statistics of Variables
Table 1 reports the descriptive statistics of the variables selected for this study, including the mean, standard deviation, minimum, and maximum, as well as the 25th, 50th, and 75th percentiles for each variable. In Table 1, the mean value of corporate debt financing is 0.151, and the mean value of CRI (Climate Risk Index) is 0.325. The mean value of is 0.075, while the mean value of is 0.106, indicating that the proportion of short-term financing is higher than that of long-term financing for the sample firms.

Table 1.
Descriptive statistics of variables.
4. Empirical Analysis
4.1. Results of the Regression: Impact of Climate Risk on Corporate Debt Financing
Table 2 reports the estimated results of the impact of climate risk on corporate debt financing. The dependent variable, in column (1), is corporate debt financing, while the dependent variables, in columns (2) and (3), are long-term debt financing and short-term debt financing, respectively. All regressions include control variables, account for a firm’s fixed effects, and employ firm-level clustered robust standard errors. The estimated results in column (1) show that the regression coefficient for climate risk is −0.1299 and is significant at the 1% level. This implies that when the climate risk increases by one unit (e.g., from 0.3 to 0.4), the corporate debt financing capacity decreases by approximately 1.3 percentage points on average. The results in columns (2) and (3) show that the regression coefficients for climate risk are −0.0322 and −0.0662, respectively, and both are significant at the 1% level, suggesting that long-term debt financing declines by 0.0322 and short-term debt financing decreases by 0.0662. This indicates that in the face of climate risks, corporate long- and short-term financing capabilities decline, which may weaken their liquidity management and emergency response abilities. Hypothesis 1 is validated for total debt, long-term debt, and short-term debt. These findings indicate that climate risk has a significant negative impact on corporate debt financing, which is reflected in both long-term and short-term debt financing.
Table 2.
The impacts of climate risk on corporate debt financing.
4.2. Endogenous Problem
Although the benchmark regression in the previous section demonstrates that climate risk has a significant impact on corporate debt financing, a potential endogenous problem in the experimental design may lead to biased regression estimates. Climate risk is a composite index that may be influenced by environmental pressures. To address this potential endogenous problem, this study selects regional carbon emission intensity (), defined as the ratio of regional carbon emissions to regional GDP, and population density () as instrumental variables and estimates the main regression using the 2SLS (two-stage least squares) method. Since the carbon emission intensity in the region where a firm is located is highly correlated with climate risk, and higher carbon emission intensity increases the likelihood of climate risk. While the regional carbon emission intensity is not directly related to local corporate financing, it serves as a valid instrument. Additionally, population density is highly correlated with climate risk [41], but it is unlikely to directly affect corporate debt financing. The original data on regional carbon emission intensity were sourced from the China Environmental Statistics Yearbook, while population density data were sourced from the National Bureau of Statistics.
Panel A of Table 3 reports the first-stage regression results of the 2SLS method. The estimation results show that the instrumental variables and are significantly positively correlated with . Panel B of Table 3 reports the second-stage regression results of the 2SLS method. The Kleibergen–Paap rk LM statistic result suggests that the instrumental variables pass the under-identification test, while the Hansen J statistic result indicates that they pass the over-identification test, with the regressions of corporate debt financing, long-term debt financing, and short-term debt financing, in columns (1) to (3), verifying the significant negative correlation between climate risk and corporate debt financing.
Table 3.
Mitigating the endogenous problem: 2SLS method. Panel A: first-stage results of the 2sls method; Panel B: second-stage results of the 2SLS method.
4.3. Robustness Test
To assess the robustness of the estimation results of models (1) to (3), we tested it by controlling for the macroeconomic environment, replacing the dependent variable and excluding the effect of the COVID-19 Pandemic.
4.3.1. Robustness Test: Controlling for the Macroeconomic Environment
Macroeconomic conditions may influence corporate financing levels [42]. To control for the impact of the macroeconomic environment, this study follows the approach in [6] and uses the real GDP growth rate () as the macroeconomic variable, with the national-level real GDP growth rate serving as a proxy. After controlling for both firm-level and macroeconomic factors, the regression of models (1) to (3) are re-estimated. Table 4 reports the regression results. In the regression of corporate debt financing, long-term debt financing, and short-term debt financing in columns (1) to (3), the climate risk variables remain significantly negative, and the results are consistent with those from the benchmark regression.
Table 4.
Robustness test controlling for the GDP’s growth rate.
4.3.2. Robustness Test: The Effects of Climate Risk with Varying Lag Structures on Corporate Debt Financing
In the benchmark regression, the climate risk variable is represented by the lagged climate risk (t − 1 period). In examining the impact of climate risk on corporate debt financing, this study employs contemporaneous, one-period lagged, two-period lagged, and three-period lagged climate risk variables. Table 5, Table 6 and Table 7 report the regression results, respectively. The results show that all coefficients are negative and statistically significant, with the effect peaking at the two-period lag.
Table 5.
The current impact of climate risk on corporate debt financing.
Table 6.
The impact of climate risk with a two-period lag on corporate debt financing.
Table 7.
The impact of climate risk with a three-period lag on corporate debt financing.
This finding suggests that climate risk has significant lagged and cumulative effects on corporate debt financing behavior. One possible explanation is that climate risks—particularly transition risks such as new regulatory policies, carbon pricing mechanisms, and shifts in investor preferences—often require time to be fully reflected in corporate credit ratings, investor sentiment, and financial institutions’ risk assessments. In the early stages, due to rigid internal adjustment mechanisms or overly optimistic short-term expectations, firms may not immediately modify their financing strategies. However, as the adverse effects of climate risks gradually emerge—such as tightening regulations, rising environmental compliance costs, or changing stakeholder expectations—firms tend to face increasing financing constraints in subsequent periods.
The stronger effect observed for the second-period lag may reflect a delayed response from financial institutions to climate-related risks. Banks and other creditors typically reassess a firm’s credit risk based on recent financial performance and industry trends, which often take time to reflect the impact of climate shocks. Meanwhile, it also takes time for investors to internalize environmental risks into their pricing models, especially in emerging markets where environmental information disclosure mechanisms and climate governance frameworks are still in development.
4.3.3. Robustness Test Excluding the Impact of the COVID-19 Pandemic (2019–2021)
Given the widespread impact of the COVID-19 pandemic on corporate operations, which may interfere with the validity of the empirical conclusions in this study, the samples from 2020 onward are excluded, and models (1) to (3) are re-estimated. The results are shown in Table 8. The estimation results show that the coefficients for climate risk exhibit only minor changes, and they remain significant at the 1% level, indicating that the main conclusions of this study remain unchanged.
Table 8.
Robustness test, excluding the impact of the COVID-19 Pandemic.
5. Heterogeneity Test
5.1. Climate Risk and Enterprise Scale
Banks mitigate loan risks by setting collateral thresholds, requiring borrowers to provide sufficient assets. Large enterprises can lower financing costs by pledging fixed assets, whereas small enterprises, often lacking such assets, face greater financing constraints [43]. Additionally, large enterprises benefit from stronger reputations, giving them an advantage in securing financing, a benefit not shared by smaller firms. To assess whether climate risk affects corporate debt financing differently by firm size, this study categorized firms annually into the following two groups: the top 30% as large enterprises and the rest as small enterprises. Grouped regressions were then conducted using models (1) to (3).
Table 9 reports the regression results. Columns (1) to (3) show the results for large enterprises, while columns (4) to (6) present the results for small enterprises. In all regressions, the climate risk variables are significantly negative, indicating that the negative impacts of climate risk on corporate debt financing, long-term debt financing, and short-term debt financing are significant for both large and small enterprises. These results suggest that enterprise scale does not significantly alter the negative impact of climate risk on corporate debt financing.
Table 9.
The heterogeneous impact from the perspective of enterprise scale.
5.2. Climate Risk and Ownership
State-owned enterprises (SOEs) typically have financing advantages over non-state-owned enterprises (non-SOEs) [44], primarily due to government backing and a “soft budget constraint”. In the face of deteriorating operational conditions or potential debt default caused by climate risk, the government may provide subsidies and guarantees to SOEs, reducing bankruptcy risk and easing creditors’ concerns [45]. To investigate the role of ownership in the impact of climate risk on corporate debt financing, this study classified firms as state-owned or non-state-owned based on the ownership of the actual controller. Grouped regressions were then performed using models (1) to (3).
Table 10 presents the regression results. Columns (1) to (3) report the results for SOEs, while columns (4) to (6) show the results for non-SOEs. The coefficient for the SOEs was insignificant, suggesting that SOEs demonstrate significant resilience to climate risk. In contrast, the coefficient for non-SOEs was significantly negative, indicating that climate risk significantly reduces both overall and long-term debt financing, as well as short-term debt financing. This highlights that non-SOEs face greater challenges in debt financing under climate risk.
Table 10.
The heterogeneous impact from the perspective of enterprise ownership.
5.3. Climate Risk and Climate-Sensitive Industries
Climate risk is increasingly becoming a legal responsibility for many climate-sensitive enterprises [46]. Climate-sensitive industries have distinct characteristics, with their production capacity and profit models significantly impacted by climate change. When climate risk is high, climate-sensitive firms may face greater environmental risks and income volatility, raising concerns among financial institutions [47,48]. This study refers to Battiston et al. [49] and other related research, and selected the following nine industries based on the CSRC (China Securities Regulatory Commission) industry classification: mining; electricity, heat, gas, and water production and supply; real estate; construction; transportation, storage, and postal services; agriculture, forestry, animal husbandry, and fishery; water conservancy, environment, and public facility management; health and social work; and manufacturing. Within the manufacturing sector, six sub-industries were selected: ferrous metal smelting and rolling processing; manufacture of alcoholic beverages, soft drinks, and refined tea; automobile manufacturing; paper and paper products; petroleum processing, coking, and nuclear fuel processing; and printing and reproduction of recorded media. A total of 944 listed companies were included in the sample. These industries are carbon-intensive and closely related to climate risk.
To examine whether climate risk has a heterogeneous impact on debt financing for climate-sensitive enterprises, this study constructs the variable to distinguish climate-sensitive enterprises from non-climate-sensitive ones. A firm is classified as climate-sensitive if it belongs to a climate-sensitive industry, where if the firm belongs to a climate-sensitive industry, and otherwise. Furthermore, the interaction term between climate risk and climate-sensitive firms () is added to the baseline regressions for re-estimation. Table 11 reports the regression results. In columns (1) to (3), the climate risk variables remain significantly negative, consistent with the benchmark regression results. However, the interaction term between climate-sensitive firms and climate risk () is not significant in columns (1) to (3), indicating that the impact of climate risk on financing for both climate-sensitive and non-climate-sensitive firms does not exhibit significant heterogeneity.
Table 11.
The heterogeneous impact from a climate-sensitive perspective.
To further explore the heterogeneous responses of various industries to climate risk, we classified firms into 11 sectors based on the CSRC Industry Classification Standard. These sectors include the following: agriculture, forestry, animal husbandry and fishery; mining; manufacturing; production and supply of electricity, heat, gas, and water; construction; wholesale and retail trade; transportation, storage, and postal services; accommodation and catering services; information transmission, software, and information technology services; financial industry; and real estate. We then conducted industry-specific regressions to examine the differential effects of climate risk across these sectors. Table 12 reports the regression results. The results of the industry heterogeneity analysis indicate that climate risk significantly affects debt financing in the manufacturing, electricity, retail, information services, and real estate sectors, while its impact on the transportation sector is mainly reflected in short-term financing. High-carbon industries are more constrained in debt financing due to increased carbon compliance costs and policy pressure, whereas industries with better environmental information disclosure tend to have greater access to financing.
Table 12.
The impact of climate risk on Corporate debt financing across industries.
5.4. Implementation of the Carbon-Trading Policy
China launched its pilot carbon emissions trading policy in 2013, aiming to guide high-emission enterprises in controlling carbon emissions and enhancing green governance through market-based mechanisms. The implementation of the carbon-trading policy may influence corporate debt financing capacity through multiple channels. On the one hand, the policy increases carbon costs and compliance pressure, especially for carbon-intensive industries, imposing financial burdens and heightening financing uncertainty. On the other hand, as part of the green finance framework, carbon trading may improve financing accessibility for firms with a strong environmental performance. Based on the timeline for the implementation of China’s carbon emissions trading policy, this paper divides the study period into the following two phases: pre-policy phase (2007–2012) and post-policy phase (2013–2021). A segmented regression analysis is then conducted to examine the differences in the impact of climate risk on corporate debt financing before and after the introduction of the carbon-trading policy.
Table 13 reports the regression results. In columns (1)–(6), the coefficients of climate risk are significantly negative, indicating that climate risk suppresses corporate financing ability, consistent with the baseline regression results. However, in the post-policy implementation stage, the absolute values of the regression coefficients for debt financing and short-term debt financing are larger, and the significance is stronger. This suggests that after the carbon emission trading policy was implemented (2013–2021), the suppressive effect of climate risk on corporate debt financing and short-term debt financing was significantly strengthened. This change may be attributed to the carbon-trading mechanism increasing the carbon compliance costs of enterprises, making their financial conditions and risk exposures more easily identifiable by financial institutions. Additionally, compared to long-term financing, short-term financing is more directly affected by market expectations, information changes, and risk repricing. After the implementation of the carbon-trading policy, financial markets’ attention to climate risk increased, and financial institutions may respond more quickly to climate-related information in short-term credit approvals, making short-term debt financing more sensitive to climate risks.
Table 13.
The heterogeneous impact of the implementation of the carbon-trading policy.
Figure 1 demonstrates the differential impacts of climate risk on corporate debt financing before and after the introduction of the carbon trading tax. Post-implementation, the effect of climate risk becomes more pronounced for total and short-term debt financing, whereas a slight decline is observed in its impact on long-term debt financing.
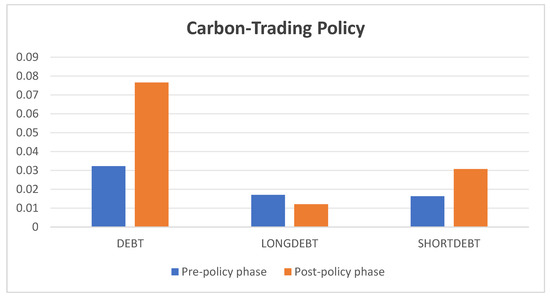
Figure 1.
The impact of climate risk on corporate debt financing.
6. Further Analysis
6.1. Mechanism Analysis
What is the mechanism through which climate risk affects corporate debt financing? Based on the theoretical framework discussed earlier, factors such as corporate profitability, return uncertainty, external financing costs, and capital turnover rate may be potential channels of influence. First, to examine the impact of climate risk on corporate profitability, following the approach of Doan [50], the return on assets () is used as the dependent variable, and the lagged climate risk variable is taken as the core explanatory variable. The following regression model is established:
where, in this equation, represents the return on assets. Based on the theoretical analysis presented earlier, it is expected that will be significantly negative, meaning that an increase in climate risk will significantly reduce the firm’s return on assets.
Second, to examine the impact of climate risk on return uncertainty, following the approach of Huang [10], the annual earnings volatility is used as the dependent variable, with the lagged climate risk variable as the core explanatory variable. The following regression model is established:
where represents the return volatility. Based on the theoretical analysis above, it is expected that will be significantly positive, meaning that an increase in climate risk will significantly exacerbate the firm’s earnings uncertainty.
Third, to examine the impact of climate risk on external financing costs, following the approach of Gomes [51], the cost of debt financing is used as the dependent variable, with the lagged climate risk variable as the core explanatory variable. The following regression model is established:
where represents the cost of debt financing. Based on the theoretical analysis, it is expected that will be significantly positive, meaning that an increase in climate risk will significantly raise the cost of corporate debt financing.
Fourth, to examine the impact of climate risk on asset turnover, following the approach of Cline et al. [52], the total asset turnover is used as the dependent variable, with the lagged climate risk variable as the core explanatory variable. The following regression model is established:
In this equation, represents the asset turnover rate. Based on the theoretical analysis presented earlier, it is expected that will be significantly negative, meaning that an increase in climate risk will significantly reduce the firm’s asset turnover rate.
Table 14 presents the estimated effects of climate risk on corporate financial outcomes. Column (1) shows that climate risk negatively impacts the return on assets, with a coefficient of −0.0626 and significant at the 1% level. Column (2) indicates that climate risk increases earnings volatility, with a coefficient of 0.1342, also significant at the 1% level. Column (3) reveals that climate risk raises debt financing costs, with a coefficient of 0.1612 and significant at the 10% level, suggesting reduced access to both long- and short-term financing. Column (4) demonstrates that climate risk significantly lowers asset turnover, with a coefficient of −2.3830 and significant at the 1% level. These findings suggest that heightened climate risk weakens sales performance, slows cash flow, and damages corporate reputation, ultimately constraining debt financing. Thus, climate risk significantly impedes corporate debt financing, as evidenced by reductions in profitability, asset turnover, and increases in financing costs.
Table 14.
Mechanism test of the impact of climate risk on corporate debt financing.
6.2. Climate Risk Response
To examine whether national-level climate risk responses alleviate or exacerbate the impact of climate risk on corporate debt financing, this study employed the Climate Change Performance Index (CCPI) and its interaction with climate risk variables in a regression analysis. To address the potential endogenous problems between CCPI and CRI, this study regressed CCPI on CRI and used the residual from this regression as a proxy variable () in the model. The specific regression model is as follows:
where denotes the climate change performance variable lagged by one period and denotes the interaction term between the climate change performance variable lagged by one period and the climate risk variable lagged by one period.
Table 15 presents the results of the moderating effect of climate risk response. The coefficient of the climate change performance is significantly negative in column (2) and positive in column (3) but not significant in column (1), indicating that it suppresses long-term debt financing while promoting short-term debt financing, supporting Hypothesis 6. An enhanced climate change performance mitigates the adverse effects of climate risk on short-term financing through mechanisms such as green credit. However, in the long run, it increases transition pressure and production costs, further constraining long-term debt financing. Consequently, firms experience a rise in short-term debt financing, a decline in long-term debt financing, and no significant impact on overall debt financing.
Table 15.
The impact of climate change performance on corporate debt financing.
6.3. Environmental Information Disclosure
The existing literature has shown that environmental information disclosure can serve as a strategic behavior to reduce corporate external financing costs and enhance stock liquidity [26,27]. Based on this logic, environmental information disclosure is expected to have a positive impact on corporate financing. However, some studies have revealed that under conditions of heightened climate risk, environmental information disclosure may expose firms to the climate-related risks. Excessive disclosure or poor disclosure quality may heighten investor concerns, thereby leading to short-term financing difficulties [28,29,30]. To examine the actual effect of environmental information disclosure on the relationship between climate risk and corporate debt financing, this study introduces the environmental information disclosure variable ENVREP, which indicates whether a company discloses environmental information in its annual report (where disclosure is denoted by ENVREP = 1 and non-disclosure by ENVREP = 0). Moreover, the interaction term between ENVREP and the climate risk variable LCRI is created, denoted as LCRI_ENV. The regression model is as follows:
Table 16 presents the regression results. The coefficients of LCRI_ENV are insignificant in columns (1) and (2) but significantly positive in column (3), indicating that environmental information disclosure significantly restrains short-term debt financing. In column (3), the coefficient of ENVREPP is 0.0362, while that of LCRI_ENV is −0.1022, suggesting that under high climate risk, the negative impact of environmental disclosure on short-term debt financing outweighs its positive effect. These findings support Hypothesis 7 in the context of short-term debt financing. When climate risk is high, corporate environmental disclosures may heighten public concerns, further restricting short-term debt financing. These counterintuitive results may be explained by the following: In China, environmental information disclosure is primarily policy-driven and lacks unified, authoritative standards. As a result, corporate disclosures are often vague and of low credibility, failing to effectively reduce financing uncertainty and potentially heightening investor concerns. Under high climate risk, low-quality disclosure—characterized by limited transparency or the absence of concrete mitigation strategies—may be perceived as a risk signal, further constraining firms’ access to short-term debt financing. In addition, corporate green transitions often require substantial short-term investment, and China’s green finance market is still in a developmental stage, and both financial institutions and investors have limited capacity to interpret and utilize environmental information effectively, which further weakens firms’ short-term financing capacity.
Table 16.
The impact of environmental information disclosure on corporate debt financing.
7. Conclusions and Policy Implications
7.1. Conclusions
Based on a sample of Chinese A-share-listed companies on the Shanghai and Shenzhen stock exchanges from 2007 to 2021, this study empirically examines the impact of climate risk on corporate debt financing and its underlying mechanisms, leading to the following conclusions: First, climate risk significantly inhibits corporate debt financing, exerting a notable suppressive effect on both long-term and short-term debt financing. Second, the impact of climate risk does not exhibit significant differences concerning firm size or industry classification as climate-sensitive or non-climate-sensitive. However, a notable disparity exists in terms of ownership structure. Compared with non-SOEs, SOEs demonstrate a greater capacity to withstand the adverse effects of climate risk on debt financing, potentially due to their stronger resource acquisition capabilities. Third, climate risk constrains corporate debt financing through multiple channels, including weakening firms’ profitability, reducing asset turnover rates, increasing earnings uncertainty, and raising external financing costs. Fourth, national climate risk response policies mitigate the adverse effects of climate risk on short-term debt financing but concurrently suppress long-term debt financing. Additionally, corporate environmental information disclosure intensifies the inhibitory effect of climate risk on short-term debt financing during periods of heightened climate risk.
7.2. Policy Implications
Based on the study’s findings, both governments and enterprises should adopt targeted measures to address the challenges posed by climate risk. The specific recommendations are as follows: For governments, first, integrate climate risk into corporate credit rating systems. Regulatory authorities should collaborate with rating agencies to develop a climate resilience score, which evaluates a firm’s creditworthiness under climate risk by considering factors such as climate risk exposure, historical disaster response capacity, and carbon emission intensity. This would enable financial institutions, especially banks, to provide appropriate financing support under controlled risk conditions.
Second, develop differentiated green financial instruments to enhance the resilience of non-state-owned enterprises. Since non-SOEs are generally more vulnerable to climate risk compared to state-owned enterprises, targeted government support is essential. This may include establishing green credit enhancement platforms and green loan guarantee funds aimed particularly at small and non-SOEs. These initiatives would strengthen corporate capacity to invest in green technologies and manage climate-related risks, thereby improving their creditworthiness and access to financing under climate uncertainty.
Third, optimize the structure of green bonds and green credit by distinguishing between short-term and long-term financing instruments. As national climate policies appear to positively moderate short-term debt financing but potentially suppress long-term borrowing, financing tools should be designed based on maturity. For short-term needs, instruments such as emergency disaster relief funds, climate risk early warning systems, and green liquidity support programs can be utilized. For long-term financing, mechanisms such as green insurance, carbon asset-backed collateral, and re-guarantee frameworks can help enterprises diversify and manage long-term risk exposures.
Fourth, strengthen environmental information disclosure regulations and incentive mechanisms to improve disclosure quality and relevance. Our findings suggest that under high climate risk, poor-quality or low-transparency disclosures may increase short-term financing constraints due to investor misinterpretation. To address this, regulatory agencies should guide firms in shifting from merely compliant disclosure toward high-quality, decision-useful reporting. This includes clarifying disclosure standards, introducing quantitative metrics (e.g., results of climate stress testing), and encouraging disclosure of mitigation/adaptation strategies and risk buffering pathways, thereby reducing market uncertainty regarding firms’ climate-related performance.
For enterprises, first, strengthen climate risk management and assessment. Firms should enhance climate risk management by conducting regular climate risk assessments, identifying and evaluating potential physical and transition risks. Second, enhance climate risk adaptation capabilities. Enterprises should adopt proactive measures to address climate risks, including improving infrastructure resilience, optimizing supply chains, enhancing asset turnover rates and operational efficiency, and refining asset allocation strategies. These measures can help mitigate the adverse effects of climate risks and strengthen corporate profitability and financial stability. Third, improve environmental information disclosure. Firms should actively disclose climate-related environmental information to enhance their corporate social responsibility and public image. This transparency can improve trust among external investors, banks, and financial institutions, ultimately facilitating more favorable financing conditions. Fourth, align with national climate policies to drive green transformation. Enterprises should actively respond to national climate policies by formulating and implementing green transition and low-carbon development strategies. By leveraging technological innovation to upgrade production models, deepening energy conservation and emission reduction practices, and building a competitive edge in the green economy, firms can establish a solid foundation for long-term sustainable development.
7.3. Limitations and Future Research Directions
Climate policies vary across countries and regions, leading to differences in corporate financing costs, investment returns, and risk management requirements, which in turn affect firms’ financing capacity. This study is based on data from A-share-listed companies in China, and the findings are influenced by specific institutional settings and market structures. Caution should be taken when generalizing the results to other contexts. Future research could further explore corporate financing behavior under different climate conditions and financial systems, assess the heterogeneous impacts of climate risk under varying environmental policy intensities (e.g., carbon tax, emissions trading, and ESG regulation). In addition, the impact of climate risk may vary across firms with different levels of technological maturity or innovation capacity. Technologically advanced firms may exhibit greater flexibility in adapting to climate risks, which could make them less vulnerable to external climate-related factors. Future research could further explore this aspect in greater depth.
Author Contributions
Conceptualization, X.Q.; methodology, X.Q.; formal analysis, X.Q.; writing—original draft preparation, X.Q.; writing—review and editing, X.Q. and X.L.; supervision, Y.Z.; funding acquisition, Y.Z. All authors have read and agreed to the published version of the manuscript.
Funding
This research was funded by the Humanities and Social Science Fund of the Ministry of Education of China, under grant no. 21YJA630128, and the Emergency Management Project of the National Natural Science Foundation of China, under grant no. 72141019.
Institutional Review Board Statement
Not applicable.
Informed Consent Statement
Not applicable.
Data Availability Statement
The data in this study are mainly from the Germanwatch, China National Bureau of Statistics, and China Economic Database and the China Stock Market & Accounting Research Database (CSMAR).
Conflicts of Interest
The authors declare no conflicts of interest.
References
- O’Neill, B.C.; Oppenheimer, M.; Warren, R.; Hallegatte, S.; Kopp, R.E.; Pörtner, H.O.; Scholes, R.; Birkmann, J.; Foden, W.; Licker, R.; et al. IPCC Reasons for Concern Regarding Climate Change Risks. Nat. Clim. Chang. 2017, 7, 28–37. [Google Scholar] [CrossRef]
- Liang, R.; Chen, B. Evaluation of Global Extreme Weather Event GDP Loss Rates under Climate Change. Syst. Eng. Theory Pract. 2019, 39, 557–568. [Google Scholar]
- Chen, G.; Ding, S.; Zhao, X.; Jiang, X. China’s Green Finance Policies, Financing Costs, and Corporate Green Transformation—From the Perspective of Central Bank Collateral Policies. Financ. Res. 2021, 498, 75–95. [Google Scholar]
- Sun, Y.; Zhu, S.; Wang, D.; Duan, J.; Lu, H.; Yin, H.; Tan, C.; Zhang, L.; Zhao, M.; Cai, W.; et al. Global Supply Chains Amplify Economic Costs of Future Extreme Heat Risk. Nature 2024, 627, 797–804. [Google Scholar] [CrossRef]
- Garbarino, N.; Guin, B. High Water, No Marks? Biased Lending After Extreme Weather. J. Financ. Stab. 2021, 54, 100874. [Google Scholar] [CrossRef]
- Dessaint, O.; Matray, A. Do Managers Overreact to Salient Risks? Evidence from Hurricane Strikes. J. Financ. Econ. 2017, 126, 97–121. [Google Scholar] [CrossRef]
- Do, V.; Nguyen, T.H.; Truong, C.; Vu, T. Is Drought Risk Priced in Private Debt Contracts? Int. Rev. Financ. 2021, 21, 724–737. [Google Scholar] [CrossRef]
- Wu, H.; Cai, G.; Xu, X. The Impact of Macroeconomic Cycles on Corporate External Financing. Financ. Res. 2015, 8, 109–123. [Google Scholar]
- Zhang, C.; Liu, G. Research on the Investment and Financing Decision Mechanisms of China’s Real Industry Sector—Based on the Perspectives of Economic Policy Uncertainty and Financing Constraints. Econ. Res. 2018, 53, 51–67. [Google Scholar]
- Liu, R.; Huang, J. Local Industrial Policies and Bond Financing Costs. Chin. Ind. Econ. 2023, 6, 118–136. [Google Scholar]
- Liu, G.; Cheng, F.; Yao, S.; Zhang, J. Local Government Debt Governance and the Improvement of Corporate Investment and Financing Term Mismatch. Manag. World 2022, 38, 71–89. [Google Scholar]
- Chava, S. Environmental Externalities and Cost of Capital. Manag. Sci. 2014, 60, 2223–2247. [Google Scholar] [CrossRef]
- Huang, H.H.; Kerstein, J.; Wang, C. The Impact of Climate Risk on Firm Performance and Financing Choices: An International Comparison. J. Int. Bus. Stud. 2018, 49, 633–656. [Google Scholar] [CrossRef]
- Fan, W.; Wang, F.; Zhang, H.; Yan, B.; Ling, R.; Jiang, H. Is Climate Change Fueling Commercial Banks’ Non-Performing Loan Ratio? Empirical Evidence from 31 Provinces in China. Int. Rev. Econ. Financ. 2024, 96, 103585. [Google Scholar]
- Huang, H.H.; Kerstein, J.; Wang, C.; Wu, F. Firm Climate Risk, Risk Management, and Bank Loan Financing. Strateg. Manag. J. 2022, 43, 2849–2880. [Google Scholar] [CrossRef]
- Wang, Y.; Li, X.; Zhang, L. Achieving Synergy Between Carbon Mitigation and Pollution Reduction: Does Green Finance Matter? J. Environ. Manag. 2023, 342, 118356. [Google Scholar]
- Dafermos, Y.; Nikolaidi, M.; Galanis, G. Climate Change, Financial Stability, and Monetary Policy. Ecol. Econ. 2018, 152, 219–234. [Google Scholar] [CrossRef]
- Zhang, D.; Wu, Y.; Ji, Q.; Guo, K.; Lucey, B. Climate Impacts on the Loan Quality of Chinese Regional Commercial Banks. J. Int. Money Financ. 2024, 140, 102975. [Google Scholar] [CrossRef]
- Chen, Y.L. Current Key Issues in Global Central Bank Research. Financ. Res. 2020, 2, 1–14. [Google Scholar]
- Huang, B.; Punzi, M.T.; Wu, Y. Do Banks Price Environmental Transition Risks? Evidence from a Quasi-Natural Experiment in China. J. Corp. Financ. 2021, 69, 101983. [Google Scholar] [CrossRef]
- Nguyen, D.D.; Ongena, S.; Qi, S.; Sila, V. Climate Change Risk and the Cost of Mortgage Credit. Rev. Financ. 2022, 26, 1509–1549. [Google Scholar] [CrossRef]
- Duan, T.; Li, F.W. Climate Change Concerns and Mortgage Lending. J. Empir. Financ. 2024, 75, 101445. [Google Scholar] [CrossRef]
- Javadi, S.; Masum, A.A. The Impact of Climate Change on the Cost of Bank Loans. J. Corp Financ. 2021, 69, 102019. [Google Scholar] [CrossRef]
- Ehlers, T.; Packer, F.; De Greiff, K. The Pricing of Carbon Risk in Syndicated Loans: Which Risks Are Priced and Why? J. Bank. Financ. 2022, 136, 106180. [Google Scholar] [CrossRef]
- Huang, J.; Lu, H.; Du, M. Regional Differences in Agricultural Carbon Emissions in China: Measurement, Decomposition, and Influencing Factors. Land 2025, 14, 682. [Google Scholar] [CrossRef]
- Aerts, W.; Cormier, D.; Magnan, M. Corporate Environmental Disclosure, Financial Markets, and the Media: An International Perspective. Ecol. Econ. 2008, 64, 643–659. [Google Scholar] [CrossRef]
- Brooks, C.; Oikonomou, I. The Effects of Environmental, Social, and Governance Disclosures and Performance on Firm Value: A Review of the Literature in Accounting and Finance. Br. Account. Rev. 2018, 50, 1–15. [Google Scholar] [CrossRef]
- Meng, J.; Zhang, Z. Corporate Environmental Information Disclosure and Investor Response: Evidence from China’s Capital Market. Energy Econ. 2022, 108, 105886. [Google Scholar] [CrossRef]
- Orlitzky, M. Corporate Social Responsibility, Noise, and Stock Market Volatility. Acad. Manag. Perspect. 2013, 27, 238–254. [Google Scholar] [CrossRef]
- Jiang, Y.; Luo, L.; Xu, J.; Shao, X. The Value Relevance of Corporate Voluntary Carbon Disclosure: Evidence from the United States and BRIC Countries. J. Contemp. Account. Econ. 2021, 17, 100279. [Google Scholar] [CrossRef]
- Jiang, F.; Kim, K.A.; Zhang, M. Corporate Commitment to Climate Change Action, Carbon Risk Exposure, and a Firm’s Debt Financing Policy. Bus. Strateg. Environ. 2021, 30, 3919–3936. [Google Scholar]
- Pankratz, N.; Bauer, R.; Derwall, J. Climate Change, Firm Performance, and Investor Surprises. Manag. Sci. 2023, 69, 7352–7398. [Google Scholar] [CrossRef]
- Somanathan, E.; Somanathan, R.; Sudarshan, A.; Tewari, M. The Impact of Temperature on Productivity and Labor Supply: Evidence from Indian Manufacturing. J. Polit. Econ. 2021, 129, 1797–1827. [Google Scholar] [CrossRef]
- Zhao, H.; Wu, C.; Wen, Y. Determinants of Corporate Fossil Energy Assets Impairment and Measurement of Stranded Assets Risk. Energies 2023, 16, 6340. [Google Scholar] [CrossRef]
- He, X.; Zhang, Y. The Impact of Carbon Emission Trading on the Financing Constraints of High-Emission Enterprises. Financ. Res. Lett. 2024, 67, 103456. [Google Scholar] [CrossRef]
- Ozkan, A.; Temiz, H.; Yildiz, Y. Climate risk, corporate social responsibility, and firm performance. Br. J. Manag. 2023, 34, 1791–1810. [Google Scholar] [CrossRef]
- Ramadorai, T.; Zeni, F. Climate Regulation and Emissions Abatement: Theory and Evidence from Firms’ Disclosures. J. Financ. Econ. 2019, 134, 249–270. [Google Scholar] [CrossRef]
- Liu, X.G.; Liu, J.T. Labor Costs and Financing Constraints of Small and Medium-Sized Enterprises. Financ. Res. 2020, 9, 117–135. [Google Scholar]
- Li, M.N.; Chu, Y.Q.; Wang, L.Y. The Relationship Between Different Dimensions of Patent Quality and Tobin’s Q. Sci. Res. 2019, 37, 1164–1173, 1202. [Google Scholar]
- He, D.X.; Zeng, M.; Zhang, S.N. How Does State Capital Equity Participation Affect Private Enterprises?—A Study Based on the Debt Financing Perspective. Manag. World 2022, 38, 189–207. [Google Scholar]
- Albouy, D.; Graf, W.; Kellogg, R.; Wolff, H. Climate Amenities, Climate Change, and American Quality of Life. J. Assoc. Environ. Resour. Econ. 2016, 3, 205–246. [Google Scholar] [CrossRef]
- Davis, E.P.; Stone, M.R. Corporate Financial Structure and Financial Stability. J. Financ. Stabil. 2004, 1, 65–91. [Google Scholar] [CrossRef]
- Dang, C.; Li, Z.F.; Yang, C. Measuring Firm Size in Empirical Corporate Finance. J. Bank. Financ. 2018, 86, 159–176. [Google Scholar] [CrossRef]
- Matuszak, P.; Kabaciński, B. Non-Commercial Goals and Financial Performance of State-Owned Enterprises—Some Evidence from the Electricity Sector in the EU Countries. J. Compar. Econ. 2021, 49, 1068–1087. [Google Scholar] [CrossRef]
- Lin, Y.F.; Li, Z.Y. Policy Burdens, Moral Hazard, and Budget Soft Constraints. Econ. Res. 2004, 2, 17–27. [Google Scholar]
- Frumhoff, P.C.; Heede, R.; Oreskes, N. The Climate Responsibilities of Industrial Carbon Producers. Clim. Chang. 2015, 132, 157–171. [Google Scholar] [CrossRef]
- Gundlach, J. Climate Risks Are Becoming Legal Liabilities for the Energy Sector. Nat. Energy 2020, 5, 94–97. [Google Scholar] [CrossRef]
- Jaffe, A.M. Financial Herding Must Be Checked to Avert Climate Crashes. Nat. Energy 2020, 5, 101–103. [Google Scholar] [CrossRef]
- Battiston, S.; Mandel, A.; Monasterolo, I.; Schütze, F.; Visentin, G. A Climate Stress-Test of the Financial System. Nat. Clim. Chang. 2017, 7, 283–288. [Google Scholar] [CrossRef]
- Doan, T. Financing Decision and Firm Performance: Evidence from an Emerging Country. Manag. Sci. Lett. 2020, 10, 849–854. [Google Scholar] [CrossRef]
- Gomes, J.F.; Yaron, A.; Zhang, L. Asset Pricing Implications of Firms’ Financing Constraints. Rev. Financ. Stud. 2006, 19, 1321–1356. [Google Scholar] [CrossRef]
- Cline, B.N.; Fu, X.; Tang, T. Shareholder Investment Horizons and Bank Debt Financing. J. Bank. Financ. 2020, 110, 105656. [Google Scholar] [CrossRef]
Disclaimer/Publisher’s Note: The statements, opinions and data contained in all publications are solely those of the individual author(s) and contributor(s) and not of MDPI and/or the editor(s). MDPI and/or the editor(s) disclaim responsibility for any injury to people or property resulting from any ideas, methods, instructions or products referred to in the content. |
© 2025 by the authors. Licensee MDPI, Basel, Switzerland. This article is an open access article distributed under the terms and conditions of the Creative Commons Attribution (CC BY) license (https://creativecommons.org/licenses/by/4.0/).