Abstract
The development of artificial intelligence as the core driving force for industrial upgrading in the era of smart manufacturing and its large-scale application are reshaping the pattern of urban industrial production and energy consumption, with far-reaching impacts on the realization of regional carbon emission reduction targets. To effectively measure the impact of Artificial Intelligence Development Level (AIDL) on the Carbon Emission Intensity (ICE) of Chinese cities, this study empirically examines the influence of AI development level on carbon emission intensity using panel data from 275 Chinese cities during the period from 2007 to 2019. Employing a Spatial Durbin Model and a Mediation Effect Model to conduct empirical testing, the results reveal that AI development level has a negative impact on carbon emission intensity, thereby suppressing the increase in carbon emission intensity. AI development level mitigates carbon emission intensity through two pathways: enhancing the level of technological innovation and optimizing industrial structure, exhibiting a reverse mediation effect with impact coefficients of −0.6216 and −0.5682, respectively, both statistically significant at the 1% level. Based on the empirical findings and the mediation effect analysis, this paper proposes corresponding policy recommendations. This study highlights the critical role of advancements in artificial intelligence and the application strategies of smart industrial robots in fostering sustainable smart cities. The findings support further exploration of AI’s impact on the environment and offer new perspectives for achieving urban sustainability.
1. Introduction and Literature Review
With the rapid development of the Chinese economy, the gross domestic product is accompanied by a significant increase in carbon emission intensity. This trend not only exacerbates the greenhouse gas effects of energy consumption but also poses severe challenges to ecological sustainability and climate governance [1]. The rising carbon emission intensity further highlights the imbalance in regional governance, where some cities and provinces face greater carbon emission pressures amid high economic growth [2]. Balancing economic development with carbon reduction has become a critical issue that China urgently needs to address [3]. As the world’s largest energy consumer and carbon emitter [4], China plays a pivotal role in international climate governance while confronting domestic challenges such as a single energy consumption structure and high-energy-intensive industries [5]. Traditional energy-saving and emission-reduction measures, such as administrative production restrictions, energy efficiency standards, and financial subsidies, have gradually revealed limitations in flexibility and effectiveness in the face of increasingly complex energy demands and diverse production models [6]. In response, the Chinese government has recently prioritized energy-saving and emission-reduction initiatives, actively promoting energy structure adjustments, increasing investment in renewable energy [7], and leveraging technological innovation to enhance energy efficiency [8]. These efforts aim to achieve a synergistic development between economic growth and carbon emission reduction.
Against the backdrop of accelerating global climate governance, carbon emission reduction has become a core challenge for China to realize economic transformation and sustainable development [9]. According to the statistics of Chinese government agencies, by the end of 2023, China’s total energy consumption will reach 5.72 billion tons of standard coal, and although the intensity of carbon emissions per unit of GDP has been reduced to less than 0.5 tons per 10,000 yuan, it is still higher than the global average [10], which highlights the urgency of balancing the pressures of economic growth and emission reduction under the framework of the “dual-carbon” goal [2]. Currently, the research paradigm of carbon emissions in the international academic community is undergoing a profound transformation: the focus of the research has been expanded from the single emission assessment to the comprehensive analysis of carbon footprint, carbon emission intensity and efficiency, and more attention is being paid to the dynamic coupling of regional synergistic governance and market mechanisms [11], while Chinese scholars focus on the optimization of the effectiveness of low-carbon technological innovations and intelligent governance methods, which provides theoretical support to the synergistic development of the economy and the environment [12]. It is noteworthy that the breakthrough development of AI technology has provided a new path for cracking the above problems—deep learning, reinforcement learning, and generative adversarial networks have not only promoted the leapfrog progress in the fields of image recognition, natural language processing, and so on [13,14], but also empowered the development of AI technology through the optimization of energy management, the reconstruction of industrial processes and the construction of pollution monitoring platforms and other application scenarios in depth. It also deeply empowers carbon governance through application scenarios such as energy management optimization, industrial process reconstruction and pollution monitoring platform construction [15,16,17]. For example, the real-time pollution source tracking and trend prediction system based on big data significantly improves the intelligence level of environmental regulation [18], while the machine learning-driven statistical data analysis strengthens the scientific and implementation accuracy of policy formulation [19]. The technological empowerment of AI is not only reflected in the promotion of stable economic growth through industrial restructuring but also in the multiplier effect of environmental governance through the construction of smart cities and the diffusion of technological innovations, which provides policy insights with both theoretical depth and practical value for the realization of the regional synergistic emission reduction and the goal of the “dual-carbon” strategy.
On the other hand, the impact of the practical application of AI in industrial industries on urban energy consumption and carbon emissions has become an increasingly hot research topic in the international academic community. Research indicates that AI applications, by driving transformations in industrial and energy structures, can effectively mitigate imbalances in carbon emissions [20]. In the manufacturing sector, the application of industrial robots has become an effective means of reducing carbon emissions. Driven by AI, industrial robots significantly reduce energy consumption during production processes, thereby lowering carbon emissions [21]. In the field of intelligent manufacturing, especially among A-share listed companies, AI has enhanced the level of corporate intelligence, achieving efficient energy use and reduced carbon emissions during production [13,22]. In the construction industry, AI has also played a positive role, effectively reducing carbon emissions while improving energy efficiency [23]. As AI applications become widespread across countries, they play a crucial role in modern manufacturing, not only improving production efficiency and product quality but also significantly influencing carbon emissions and energy consumption. Studies suggest that the AI-driven industrial robots assist enterprises in achieving energy savings and emission reductions more effectively, which becomes more pronounced as robot density increases [21]. Furthermore, AI optimizes production processes and enhances energy efficiency, which improves productivity, product quality, and raw material utilization while reducing carbon emissions [12,24]. Wang further proposes that the application of AI in routine tasks gradually replaces low-skilled labor, and the significant externalities of this labor force upgrade can enhance urban energy and environmental performance through multiple channels [25]. However, some studies highlight that AI applications inevitably lead to increased energy consumption and carbon emissions during production and implementation, particularly in energy-intensive industries, where this issue is especially pronounced [26]. This indicates that while AI technologies hold significant potential for energy conservation and emission reduction, the energy consumption and carbon emissions associated with their full lifecycle require further evaluation and optimization.
From the above literature review, it is evident that the current research mainly focuses on the role of AI in microeconomic activities. However, existing empirical studies have limitations in scope and driving factors, failing to fully consider the multifaceted factors influencing urban carbon emissions. Given the comprehensive impact of AI development level on carbon emission intensity, future research should integrate the actual state of AI development in China, analyze urban economic control variables in depth, and systematically assess its comprehensive and sustained effects on carbon emission intensity.
2. Research Framework and Hypotheses
2.1. Construction of the Research Framework
To examine the driving factors of carbon emission intensity, this study establishes a research framework and employs the Spatial Durbin Model, the Mediation Effect Model, and related testing models for systematic analysis. The goal is to comprehensively complete the planned examination tasks and ensure the authenticity and reliability of the results, thereby proposing targeted optimization strategies for driving factors based on practical conditions. Figure 1 outlines the specific research pathways.
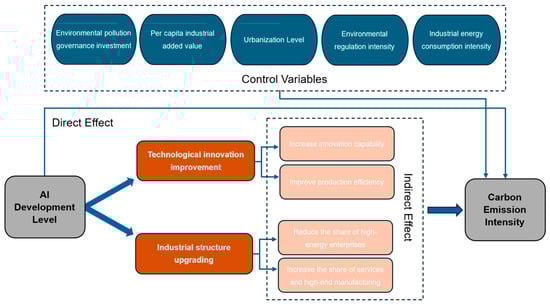
Figure 1.
Framework diagram of the research idea.
2.2. Direct Impact Mechanism of AI Development Level on Carbon Emission Intensity
AI dramatically reduces carbon emission intensity through a variety of paths, according to empirical data from its implementation in energy consumption and carbon emission intensity management practices. These include optimizing carbon emission management strategies, enhancing energy conservation, reducing emissions, and improving energy utilization efficiency [24,27]. Furthermore, existing studies reveal that the impact of AI development level on carbon emission intensity exhibits pronounced heterogeneity. This heterogeneity enables policymakers and managers to implement tailored energy-saving and emission-reduction strategies based on regional disparities in AI-driven carbon emission control, thereby further reducing carbon emission intensity [28,29,30]. Based on the theoretical analysis above, this study posits the following hypothesis:
Hypothesis 1:
AI development level can inhibit the enhancement of carbon emission intensity.
2.3. Indirect Impact Mechanism of AI Development Level on Carbon Emission Intensity
Beyond its direct effects on carbon emission intensity, AI development level exerts indirect impacts on carbon emission intensity through mediating variables. These mediating variables influence carbon emission intensity reduction mechanisms, with the primary factors being technological innovation and industrial structure upgrading.
- Suppression of carbon emission intensity through technological innovation improvement
The application of AI development level in industrial production promotes innovation in manufacturing processes and workflows, thereby enhancing enterprises’ self-innovation capacities. This advancement reduces carbon emissions by optimizing energy efficiency, refining production techniques, and driving energy structure optimization. Furthermore, innovative technologies facilitate the recycling and utilization of carbon emissions, fostering the adoption of green production and consumption models. Collectively, these factors lower carbon emission intensity, providing robust support for low-carbon development. The enhancement of technological innovation levels aligns with increased production efficiency, effectively reducing associated carbon emissions [11,22].
Hypothesis 2a:
AI development level suppresses carbon emission intensity through technological innovation improvement.
- 2.
- Suppression of carbon emission intensity through industrial structure upgrading
The upgrading of industrial structure reduces the share of high-energy-consuming and high-pollution businesses, directing economic development towards low-energy, low-pollution pathways, thus decreasing total carbon emissions [31]. Service and high-end manufacturing growth further diminish reliance on traditional high-carbon industries, leading to the “lightweighting” of economic activities. Optimizing the energy structure also plays a pivotal role in industrial upgrading by substituting fossil fuels with cleaner alternatives, thereby reducing carbon emissions. Through the elimination of outdated production capacities and the minimization of resource wastage, industrial structure upgrading ultimately fosters a low-carbon and efficient economic growth model [32,33].
Hypothesis 2b:
AI development level suppresses carbon emission intensity through industrial structure upgrading.
2.4. Spatial Spillover Effects of AI Development Level on Carbon Emission Intensity
The AI development level generates spatial spillover effects on carbon emission intensity. As an advanced productivity tool, AI technology enhances local enterprises’ production efficiency and carbon reduction capabilities while facilitating the diffusion of advanced technologies to neighboring enterprises. This diffusion occurs through channels such as talent mobility, technological collaboration, and knowledge sharing [33]. Such spillover effects enable inter-regional enterprises to emulate and learn from advanced processes, progressively optimizing resource allocation and energy efficiency across entire industrial chains, thereby reducing carbon emission intensity on a broader spatial scale [34]. Moreover, carbon dioxide emissions are not confined to specific regions but exhibit substantial spatial mobility and diffusion. Inter-regional carbon emissions interact through mechanisms such as atmospheric transmission, influencing the carbon emission intensity of adjacent areas. Consequently, while AI technology fosters green transformation in local regions, it may also indirectly enhance carbon reduction efficiency in other regions via spatial spillover effects [35,36]. Based on the analysis above, this study proposes the following hypothesis:
Hypothesis 3:
AI development level exerts spatial spillover effects on the carbon emission intensity of neighboring cities.
3. Empirical Model Design
Based on the theoretical analysis and research hypotheses, the primary objective of this study is to empirically test both the direct and indirect effects of the AI development level on carbon emission intensity. To achieve this, a standard panel regression model is initially constructed to conduct an empirical analysis. If is used to represent the carbon emission intensity, the model expression is as follows:
In the equation, is the independent variable and represents AI development level, and is the control variable. denotes the city and denotes the year; denotes the intercept term; denotes individual fixed effects; denotes time fixed effects; denotes error term; and are regression coefficients for variables. When only considering the explanatory variable AI development level, it is the test Equation (1). If a control variable is added one by one on the basis of considering the explanatory variable, the test Equations (2)–(6) are formed. This study has a total of five control variables, and the two-way fixed effects model with five control variables is as follows:
In the above equation, IEPG represents investment in environmental pollution governance, IVAP denotes per capital industrial added value, UL indicates the level of urbanization, ERI reflects the intensity of environmental regulation, and IECI stands for industrial energy consumption intensity. To examine the impact of the two mediating variables hypothesized earlier on carbon emission intensity, the theoretical model incorporates industrial structure upgrading (ISU) and technological innovation improvements (TII) as mediating variables, collectively represented as MV. By integrating MV into Equation (1), the mediating effects on carbon emission intensity are tested, leading to the formulation of a refined testing model.
By substituting the dependent variable with the mediating variable and employing a stepwise testing method, a mediation effect model is constructed. Based on Equation (3), the following model is developed:
In Equation (4), denotes the intercept term; are regression coefficients for variables.
Based on the Spatial Durbin Model (SDM) framework, this study systematically assesses the spatial spillover effect of the AI development level on carbon emission intensity and its heterogeneous mechanism of action. By constructing the SDM containing full drivers, focusing on the spatial correlation characteristics among variables. This study also conducted the corresponding tests, which are detailed in Section 5.2, to confirm the non-degradability of the SDM compared with the spatial lag model and the spatial error model. The SDM is as follows:
In the above equation, is the spatial autoregressive coefficient; are regression coefficients for variables; are spatial lag term coefficients; denotes individual fixed effects; denotes time fixed effects; denotes error term; denotes spatial weight matrix.
4. Measurement Methods for Key Variables
4.1. Measurement of Carbon Emission Intensity
The measurement of carbon emissions, specifically CO2 emissions, is primarily calculated based on energy consumption. This is due to the dominance of energy-related carbon emissions in China, particularly the overwhelming share of coal in energy consumption. Following the guidelines proposed by the IPCC and considering China’s specific circumstances, the calculation of greenhouse gas emissions, namely total carbon emissions, involves converting the consumption of various types of energy into carbon emissions using corresponding emission coefficients, and then summing them. The specific calculation formula is as follows:
In the above formula, represents carbon emissions generated by energy consumption of city; represents the type of energy consumption; represents the energy conversion standard coal reference factor, based on data from China Energy Statistical Yearbook; represents the carbon emission factor for energy, using data sourced from IPCC 2006 Guidelines for National Greenhouse Gas Inventories. The constants 44 and 12 represent the molecular weight of carbon dioxide and the atomic weight of carbon, respectively, with their ratio (44/12) serving as a conversion factor. Refer to Table 1 for specific coefficients.

Table 1.
Carbon emission conversion factor table.
Regarding the calculation of carbon emission intensity, which refers to the scale of CO2 emissions generated per unit of GDP. The calculation formula is as follows:
In the above equation, represents carbon emission intensity of city; and are the carbon emissions and gross product of city, respectively.
4.2. Measurement of AI Development Level
For the measurement of the AI development level in this study, three main approaches are commonly used in the academic literature. The first approach focuses on the installation density of industrial robots as the core variable. The second approach uses the number of artificial intelligence patents granted as a measure. The third approach involves constructing a composite index to calculate the AI development level [37,38,39]. This study adopts the industrial robot installation density at the city level for measurement. Referring to the method proposed by Acemoglu and Restrepo [40], we use the Bartik instrumental variable to integrate the 31 sub-sectors of China’s national economic industry classification and match them with the manufacturing sectors in the FIR data. This allows us to obtain the installation volumes of industrial robots in various manufacturing sectors across China. We then calculate the proportion of employment in each manufacturing sector relative to the national total employment in each city. This proportion is multiplied by the number of robots installed in each manufacturing sector, ultimately yielding the industrial robot installation volume for each city in China. The specific AI development level calculation formula is as follows:
In the above equation, is used to denote the quantity of industrial robots that were installed in city in year ; represents city employment totals in year ; is the proportion of the employment totals in the industry in city of year to the number of employed people in the industry in China in year ; is the total number of industrial robots that were installed in the industry in year .
5. Empirical Analysis Results
5.1. Data Source and Variable Descriptive Statistics
Data from 275 cities in China were selected for this study, which covers the period 2007–2019. Industrial robots’ data are from the International Federation of Robotics (IFR). Other data are from China Regional Economic Statistics Yearbook, China Environmental Yearbook, China Intellectual Property Office Patent Database, and China Provincial and Municipal Statistical Yearbooks. Some of the missing data are filled in by linear interpolation. Due to the large size of the data, it is impossible to list all the statistical information one by one. Therefore, this paper provides a basic descriptive statistical analysis. The specific statistical results are detailed in Table 2.
Table 2.
Variable descriptive statistics table.
In the table above, please refer to Section 4.1 and Section 4.2 for the measurement of the values of carbon emission intensity and the AI development level. TII is calculated from the ratio of R&D expenditures to GDP; ISU is calculated from the ratio of value added of tertiary industry to value added of secondary industry; IEPG is calculated from the ratio of value added of the total investment in industrial pollution control to GDP; IVAP is calculated from the ratio of per capita industrial added value to per capita GDP; UL is calculated from the ratio of population in urban districts to total population; ERI is calculated from the ratio of environmental protection tax to GDP; IECI is calculated from the ratio of industrial energy consumption to resident population.
5.2. Spatial Correlation Test
This study hypothesizes that there is a spatial correlation between the level of AI development and urban carbon emission intensity in different regions. To verify this hypothesis, this paper constructs a spatial adjacency matrix and analyzes it using the spatial autocorrelation test. The specific Moran’s I test results are shown in Table 3.
Table 3.
Spatial autocorrelation test.
In Table 3, the Moran’s l indices of AI development level and carbon emission intensity in 2007–2019 both passed 5% confidence tests of Moran’s l, indicating that AI development level and carbon emission intensity both have strong spatial positive autocorrelation, and there is obvious spatial agglomeration in both variables.
In this study, the Lagrange Multiplier (LM), Likelihood Ratio (LR), and Hausman tests were used to assess the validity of the variable models and to test the existence of spatial effects and the reasonableness of the model selection. The LM test was used to determine whether there were spatial lag effects or spatial error effects and to test whether the dependent variable was affected by adjacent areas. The LR test is mainly used to test whether the Spatial Durbin Model (SDM) can be reduced to a spatial lag model (SAR) or a spatial error model (SEM) so as to determine the optimal spatial econometric model. The Hausman test is used to distinguish between fixed-effect and random-effect models to ensure the reasonableness of the model setting. The results of the relevant tests are summarized in Table 4.
Table 4.
Model selection test.
In Table 4, both the LM error test and the robust LM error test are significant at the 1% significance level, indicating strong spatial correlation of the error terms and supporting the use of a spatial error model. In contrast, the LM lag test and the robust LM lag test are significant, but the spatial lag effect is weak. The LR test shows that the SDM cannot degenerate into a spatial lag model or a spatial error model. The results of Hausman’s test are significant, which supports that the fixed effect is better than the random effect. Therefore, the SDM combined with fixed effects was chosen in this study to more accurately portray the spatial spillover effect of the AI development level on carbon emission intensity.
5.3. Test Results of the Spatial Durbin Panel Model
Based on the analysis, fixed effects may be divided into direct and indirect impacts. To investigate the effects, the test model (5) is used after effect decomposition. Table 5 lists the test outcomes.
Table 5.
Decomposition test results for fixed effects in the spatial Durbin panel model.
The empirical results are presented with four decimal places. The results show that AI development level has the largest negative impact on carbon emission intensity, with a coefficient of −0.5228, followed by IEPG with a coefficient of −0.4627; ERI has the smallest negative impact, with a coefficient of −0.3328. The positive impact factors in order are as follows: IECI (coefficient 0.3979), IVAP (coefficient 0.3815), and UL (coefficient 0.3617). Table 4 shows that the lag term of ICE is significantly positive, indicating a clear spatial spillover effect.
5.4. Fixed Effects Test Results for Different Combinations of Variables
This paper uses the above benchmark regression Formula (2), and adopts the two-way fixed effect model to test the influencing factors of carbon emission intensity. In order to improve the testing effect, the influencing factors are divided into two groups, and the detailed grouping is shown in the above model design section. Six test models were utilized to conduct the benchmark regression test, and the specific test results are shown in Table 6.
Table 6.
The fixed effects model test for the combination of variables.
The test results of M (1) indicate that AIDL has an impact on ICE with influence coefficients of −0.5016. M (2)’s test findings show that AIDL and IEPG jointly affect ICE with influence coefficients of −0.5054 and −0.5013. M (3) shows that AIDL, IEPG, and IVAP together affect ICE with effect coefficients of −0.5126, −0.5156, and 0.5009. AIDL and IEPG reduce ICE, lowering urban ICE. M (4) shows that AIDL, IEPG, IVAP, and UL together affect ICE with effect coefficients of −0.5317, −0.5208, 0.5083, and 0.5026. The test results of M (5) primarily reflect the joint influence of the variables AIDL, IEPG, IVAP, UL, and ERI on ICE, with influence coefficients of −0.5375, −0.5308, 0.5235, 0.5156, and −0.5014, respectively. Finally, the test results of M (6) reflect the joint influence of all driving factors on energy consumption carbon emission intensity, with corresponding influence coefficients of −0.5563, −0.5387, 0.5237, 0.5186, −0.5076, and 0.4986. It is evident that the test results of Model (6) represent the final findings.
5.5. Results of Mediation Effect Test
The theoretical analysis earlier suggested that the AI development level impacts carbon emission intensity through two mechanisms: enhancing innovation levels and promoting industrial structure upgrading. Accordingly, this study employs a mediation effect model to empirically examine the interaction pathways between the AI development level and carbon emission intensity. Based on the design of mediation variables and the selected mediation model, the results of the mediation effect analysis are presented in Table 7.
Table 7.
Test results of mediating variables.
The results in Table 7 clearly indicate that the mediation effect of ISU on ICE is −0.6216, while the mediation effect of TII on ICE is −0.5682. This demonstrates that the mediation variables contribute to the reduction in ICE in Chinese cities.
6. Discussion of Research Results
6.1. Discussion on the Robustness Test Results
To evaluate the impact of the AI development level on carbon emission intensity, robustness tests were conducted on selected variables and constructed empirical models. These tests assess the explanatory power and resilience of the models, ensuring that results remain stable when parameters are adjusted. Various methods are available for robustness testing; this study employs Instrumental Variable Method, Lag Period Testing Method, and Data Period Shortening Method. Detailed results presented in Table 8.
Table 8.
Robustness test results.
The results in Table 8 indicate that none of the three methods show changes in signs or loss of significance, demonstrating that the robustness tests are effective, and both the variables and the model are reliable.
6.2. Discussion on Heterogeneity Testing
Heterogeneity tests assess whether significant differences exist between samples, examining the impact of sample differences on result significance. This study classifies 275 cities in 30 provinces of China into two groups based on average GDP: high-tier cities with GDP above average, totaling about 105 cities, and low-tier cities with GDP below average, totaling about 170 cities. Additionally, cities are divided by geographic location into coastal cities, totaling about 35, and inland cities, totaling about 240. The heterogeneity test results for these classifications are presented in Table 9.
Table 9.
Results of heterogeneity test for AI development level.
According to the results in Table 9, the inhibition effect of AI development level on carbon emission intensity is significantly stronger in high-tier cities than in low-tier cities, with the inhibition coefficient in high-tier cities being −0.734 and in low-tier cities −0.526. The inhibition coefficient in coastal cities is −0.683, while in inland cities it is −0.516. This indicates that the economic development level in coastal cities is notably higher than in inland cities. In terms of significance testing, the effect of AI development level in high-tier and coastal cities is significant, passing the 1% significance test, whereas in low-tier and inland cities, the results are weaker, passing only the 5% and 10% significance tests, respectively.
6.3. Discussion on Endogeneity Testing
In analyzing the impact of AI development level on urban carbon emission intensity, the issue of variable endogeneity cannot be overlooked. Although the empirical model in this study includes key variables, omitted variables may still introduce biases to the regression results. The study chose the Two Stage Least Squares of Instrumental Variables Regression method. In the first stage, the AI development level is lagged and used as an instrumental variable (LR), and the endogenous variable (AIDL) is regressed to generate a fitted value (LR2). In the second stage, the fitted value (LR2) is then regressed on ICE instead of the original endogenous variable (AIDL), and the Wear Instrument Test is conducted.
According to the results in Table 10, the estimated coefficients in the first and second stages are significantly positive at the 1% and 5% levels, respectively. The LR F-statistic in the first stage is 41.37, far exceeding the critical value of 10, indicating strong relevance between the instrumental variables and the endogenous variables, qualifying them as strong instruments. The second weak instrument test (Cragg-Donald Wald F statistic) yields a value of 974.412 in the first stage, surpassing the 10% significance level critical value of 16.8. Similarly, the Kleibergen-Paap rk LM statistic is 285.637, also exceeding the critical value of 16.8, further confirming the strength of the instruments and ruling out the issue of weak instruments. In summary, across different instrumental variable estimations, AI development level consistently demonstrates a positive impact on carbon emission intensity, aligning with the baseline regression results.
Table 10.
Results of endogeneity test.
7. Conclusions and Policy Suggestions
To examine the effective impact of AI development level on urban carbon emission intensity, this study utilizes a Spatial Durbin Panel Model, a validated Fixed Effects Model, and basic statistical data to calculate carbon emission intensity, followed by empirical testing of its influence. The findings reveal that the three driving factors—AI development level, environmental pollution governance investment, and environmental regulation intensity—have a negative impact on urban carbon emission intensity, effectively suppressing the increase in carbon emission intensity from energy consumption. In contrast, the other three driving factors per capita—industrial added value, urbanization level, and industrial energy consumption intensity—show the opposite effect on carbon emission intensity. The study also finds that industrial structure upgrading and technological innovation have a mediation inhibitory effect on urban carbon emission intensity, with corresponding coefficients of −0.6216 and −0.5682, both significant at the 1% level. Based on these findings, the study proposes the following policy recommendations to maximize the continued reduction of carbon emission intensity in Chinese cities.
First of all, the government of the central and western regions should strengthen the policy support for the industrial robotics industry in order to narrow the regional development gap. At present, China’s industrial robot application is mainly concentrated in the eastern coastal region, showing obvious regional imbalance characteristics. Jiangsu Province issued the “Jiangsu Province Robotics Industry Innovation and Development Action Plan” proposed that by 2025, the province’s robotics industry chain scale to reach CNY 200 billion, while creating a benchmark demonstration of the application of scenarios in order to enhance the industry’s independent innovation capability. In addition, Zhejiang Province launched the “Zhejiang humanoid robot industry innovation and development implementation plan”, which clearly put forward that, by 2027, high-level innovation carriers and R and D institutions will be formed, and major scientific and technological projects will be implemented in order to promote the scale of development of the robotics industry. Drawing on the experience of the eastern region, the central and western regions should be combined with their own industrial characteristics, the introduction of targeted support policies to accelerate the popularization and application of industrial robots in the manufacturing industry, and help the transformation and upgrading of the regional manufacturing industry.
In order to accelerate the process of carbon reduction, the government should promote the application of artificial intelligence in energy-consuming industries, focusing on the promotion of AI-driven energy management systems in the iron and steel, chemical, and building materials sectors to optimize production processes and reduce energy consumption. In addition, a special fund should be set up for the research and development of green AI technologies, and universities, research institutes, and enterprises should work together on key technologies such as renewable energy forecasting and carbon capture and storage (CCUS) so as to speed up the process of marketization of these technologies. In terms of regional collaborative emission reduction, an “AI carbon emission reduction collaborative platform” can be established in Beijing–Tianjin–Hebei, Chengdu–Chongqing, and other city clusters to share energy consumption data and optimize spatial spillover effects, and at the same time, differentiated emission reduction policies should be formulated according to the regional development level, and AI emission reduction contributions should be incorporated into the carbon market to incentivize enterprises to adopt intelligent low-carbon technologies, and to promote cross-region collaborative emission reduction.
Author Contributions
Conceptualization, X.Y.; formal analysis, X.Y.; funding acquisition, T.S. investigation, X.Y.; methodology, X.Y. and T.S.; project administration, T.S.; resource, X.Y. and T.S.; software, X.Y.; supervision, T.S.; validation, X.Y. and T.S.; visualization, X.Y.; writing—original draft preparation, X.Y. and T.S.; writing—review and editing, X.Y. and T.S. All authors have read and agreed to the published version of the manuscript.
Funding
This study was supported by the National Social Science Fund of China (approval number: 19BJL035).
Institutional Review Board Statement
Not applicable.
Informed Consent Statement
Not applicable.
Data Availability Statement
The data presented in this study are available on request from the corresponding author.
Conflicts of Interest
The authors declare no conflicts of interest.
Abbreviations
The following abbreviations are used in this manuscript:
| AIDL | Artificial Intelligence Development Level |
| ICE | Carbon Emission Intensity |
References
- Sun, W.; Huang, C. Predictions of carbon emission intensity based on factor analysis and an improved extreme learning machine from the perspective of carbon emission efficiency. J. Clean. Prod. 2022, 338, 130414. [Google Scholar] [CrossRef]
- Lo, K.; Broto, V.C. Co-Benefits, Contradictions, and Multi-Level Governance of Low-Carbon Experimentation: Leveraging Solar Energy for Sustainable Development in China. Glob. Environ. Change 2019, 59, 101993. [Google Scholar] [CrossRef]
- Sheng, P.; Lu, D. Low-carbon development and carbon reduction in China. Clim. Dev. 2015, 8, 472–479. [Google Scholar] [CrossRef]
- Kong, H.; Shi, L.; Da, D.; Li, Z.; Tang, D.; Xing, W. Simulation of China’s Carbon Emission based on Influencing Factors. Energies 2022, 15, 3272. [Google Scholar] [CrossRef]
- Shao, S.; Chen, Y.; Li, K.; Yang, L.L. Market Segmentation and Urban CO2 Emissions in China: Evidence from the Yangtze River Delta Region. J. Environ. Manag. 2019, 248, 109324. [Google Scholar] [CrossRef]
- He, A.P.; Xue, Q.H.; Zhao, R.J.; Wang, D.P. Renewable Energy Technological Innovation, Market Forces, and Carbon Emission Efficiency. Sci. Total Environ. 2021, 796, 148908. [Google Scholar] [CrossRef]
- Zhu, W.; Dong, W.; Qin, G.; Yang, Y. Coordinated carbon reduction mechanism and policy design to achieve carbon peak and neutrality goals in the Yangtze River Delta. Sustain. Energy Technol. Assess. 2023, 56, 103113. [Google Scholar] [CrossRef]
- Shao, J.; Wang, L. The role of different paths of technological progress in improving China’s energy efficiency. Energy Environ. 2022, 35, 2008–2030. [Google Scholar] [CrossRef]
- Yang, Y.; Su, X. Spatial correlation network structure of carbon emission reduction capacity on urban agglomerations and its driving factors: A perspective of Sustainable Development Goals. Sustain. Cities Soc. 2024, 113, 105646. [Google Scholar] [CrossRef]
- Guo, X.D.; Xiao, B.W.; Song, L.F. Emission reduction and energy-intensity enhancement: The expected and unexpected consequences of China’s coal consumption constraint policy. J. Clean. Prod. 2020, 271, 122691. [Google Scholar] [CrossRef]
- Li, C.; Xia, W.; Wang, L. Synergies of green policies and their pollution reduction effects: Quantitative analysis of China’s green policy texts. J. Clean. Prod. 2023, 412, 137360. [Google Scholar] [CrossRef]
- Dong, F.; Li, Y.; Zhang, X.; Zhu, J.; Zheng, L. How does industrial convergence affect the energy efficiency of manufacturing in newly industrialized countries? Fresh evidence from China. J. Clean. Prod. 2021, 316, 128316. [Google Scholar] [CrossRef]
- Lv, H.; Shi, B.; Li, N.; Kang, R. Intelligent manufacturing and carbon emissions reduction: Evidence from the use of industrial robots in China. Int. J. Environ. Res. Public Health 2022, 19, 15538. [Google Scholar] [CrossRef]
- Yu, L.; Wang, Y.; Wei, X.; Zeng, C. Towards low-carbon development: The role of industrial robots in decarbonization in Chinese cities. J. Environ. Manag. 2023, 330, 117216. [Google Scholar] [CrossRef]
- Yan, P.; Abdulkadir, A.; Luley, P.P.; Rosenthal, M.; Schatte, G.A.; Grewe, B.F.; Stadelmann, T. A comprehensive survey of deep transfer learning for anomaly detection in industrial time series: Methods, applications, and directions. IEEE Access 2024, 12, 3768–3789. [Google Scholar] [CrossRef]
- Yu, J.; Li, S.; Liu, X.; Li, H.; Ma, M.; Liu, P.; You, L. Residual squeeze-and-excitation convolutional auto-encoder for fault detection and diagnosis in complex industrial processes. Eng. Appl. Artif. Intell. 2024, 136, 108872. [Google Scholar] [CrossRef]
- Ning, J.; Pang, S.; Arifin, Z.; Zhang, Y.; Epa, U.P.K.; Qu, M.; Zhao, J.; Zhen, F.; Chowdhury, A.; Guo, R.; et al. The diversity of artificial intelligence applications in marine pollution: A systematic literature review. J. Mar. Sci. Eng. 2024, 12, 1181. [Google Scholar] [CrossRef]
- Liu, W.; Zhao, J.; Du, L.; Padwal, H.H.; Vadivel, T. Intelligent comprehensive evaluation system using artificial intelligence for environmental evaluation. Environ. Impact Assess. Rev. 2021, 86, 106495. [Google Scholar] [CrossRef]
- Zhang, J. Optimization of the environmental protection tax system design based on artificial intelligence. Front. Environ. Sci. 2023, 10, 1076158. [Google Scholar] [CrossRef]
- Zhao, C.; Li, Y.; Liu, Z.; Ma, X. Artificial intelligence and carbon emissions inequality: Evidence from industrial robot application. J. Clean. Prod. 2024, 438, 140817. [Google Scholar] [CrossRef]
- Zhang, L.; Shen, Q. Carbon emission performance of robot application: Influencing mechanisms and heterogeneity characteristics. Discret. Dyn. Nat. Soc. 2023, 2023, 4380575. [Google Scholar] [CrossRef]
- Chen, Y.; Jin, S. Artificial intelligence and carbon emissions in manufacturing firms: The moderating role of green innovation. Processes 2023, 11, 2705. [Google Scholar] [CrossRef]
- Ding, C.; Ke, J.; Levine, M.; Zhou, N. Potential of artificial intelligence in reducing energy and carbon emissions of commercial buildings at scale. Nat. Commun. 2024, 15, 5916. [Google Scholar] [CrossRef]
- Liu, M.; Li, Y. Environmental regulation and green innovation: Evidence from China’s carbon emissions trading policy. Financ. Res. Lett. 2022, 48, 103051. [Google Scholar] [CrossRef]
- Wang, T.; Zhang, Y.; Liu, C. Robot adoption and employment adjustment: Firm-level evidence from China. China Econ. Rev. 2024, 84, 102137. [Google Scholar] [CrossRef]
- Ahmad, U.; Raza Naqvi, S.; Ali, I.; Saleem, F.; Taqi Mehran, M.; Sikandar, U.; Juchelková, D. Biolubricant production from castor oil using iron oxide nanoparticles as an additive: Experimental, modelling and tribological assessment. Fuel 2022, 324, 124565. [Google Scholar] [CrossRef]
- Huang, G.; He, L.Y.; Lin, X. Robot adoption and energy performance: Evidence from Chinese industrial firms. Energy Econ. 2022, 107, 105837. [Google Scholar] [CrossRef]
- Liu, J.; Liu, L.; Qian, Y.; Song, S. The effect of artificial intelligence on carbon intensity: Evidence from China’s industrial sector. Socio-Econ. Plan. Sci. 2022, 83, 101002. [Google Scholar] [CrossRef]
- Luccioni, A.; Lacoste, A.; Schmidt, V. Estimating Carbon Emissions of Artificial Intelligence. IEEE Technol. Soc. Mag. 2020, 39, 48–51. [Google Scholar] [CrossRef]
- Sharma, N.; Singh, U.; Mahapatra, S.S. Prediction of cost and emission from Indian coal-fired power plants with CO2 capture and storage using artificial intelligence techniques. Front. Energy 2019, 13, 149–162. [Google Scholar] [CrossRef]
- Wu, L.; Sun, L.; Qi, P.; Ren, X.; Sun, X. Energy endowment, industrial structure upgrading, and CO2 emissions in China: Revisiting resource curse in the context of carbon emissions. Resour. Policy 2021, 74, 102329. [Google Scholar] [CrossRef]
- Zhao, J.; Jiang, Q.; Dong, X.; Dong, K.; Jiang, H. How does industrial structure adjustment reduce CO2 emissions? Spatial and mediation effects analysis for China. Energy Econ. 2022, 105, 105704. [Google Scholar] [CrossRef]
- Jiang, H.; Chen, Z.; Liang, Y.; Zhao, W.; Liu, D.; Chen, Z. The impact of industrial structure upgrading and digital economy integration on China’s urban carbon emissions. Front. Ecol. Evol. 2023, 11, 1231855. [Google Scholar] [CrossRef]
- Zhao, X.; Xu, H.; Yin, S.; Zhou, Y. Threshold effect of technological innovation on carbon emission intensity based on multi-source heterogeneous data. Sci. Rep. 2023, 13, 19054. [Google Scholar] [CrossRef]
- Liu, F.; Liu, C. Regional disparity, spatial spillover effects of urbanisation and carbon emissions in China. J. Clean. Prod. 2019, 241, 118226. [Google Scholar] [CrossRef]
- Paul, D.; Dieudonné, T.; Guillaume, C. Method and evaluations of the effective gain of artificial intelligence models for reducing CO2 emissions. J. Environ. Manag. 2023, 331, 117261. [Google Scholar] [CrossRef]
- Marvin, M. A Selected Descriptor-Indexed Bibliography to the Literature on Artificial Intelligence. IRE Trans. Hum. Factors Electron. 1961, HFE-2, 39–55. [Google Scholar]
- House, R.W.; Rado, T. An approach to artificial intelligence. IEEE Trans. Commun. Electron. 1964, 83, 111–116. [Google Scholar] [CrossRef]
- Kezban, A.; Kubra, T.; Cagri, Q.; Boran, S.; Kirsal, E.Y. Design and simulation of global model for carbon emission reduction using IoT and artificial intelligence. Procedia Comput. Sci. 2022, 204, 627–634. [Google Scholar] [CrossRef]
- Acemoglu, D.; Restrepo, P. Robots and jobs: Evidence from US labor markets. J. Political Econ. 2020, 128, 2188–2244. [Google Scholar] [CrossRef]
Disclaimer/Publisher’s Note: The statements, opinions and data contained in all publications are solely those of the individual author(s) and contributor(s) and not of MDPI and/or the editor(s). MDPI and/or the editor(s) disclaim responsibility for any injury to people or property resulting from any ideas, methods, instructions or products referred to in the content. |
© 2025 by the authors. Licensee MDPI, Basel, Switzerland. This article is an open access article distributed under the terms and conditions of the Creative Commons Attribution (CC BY) license (https://creativecommons.org/licenses/by/4.0/).