Article

Environmentally Sustainable Lithium Exploration: A Multi-Source Remote Sensing and Comprehensive Analysis Approach for Clay-Type Deposits in Central Yunnan, China

1
Faculty of Land Resource Engineering, Kunming University of Science and Technology, Kunming 650093, China
2
Center for Spatial Information Technology, Yunnan Satellite Remote Sensing Technology Application Engineering Center, Kunming 650118, China
3
School of Surveying and Information Engineering, West Yunnan University of Applied Sciences, Dali 671000, China
4
Geological Exploration Institute, 209 Geological Brigade of Nuclear Industry of Yunnan Province, Kunming 650032, China
5
Sichuan Provincial Engineering Laboratory of Monitoring and Control for Soil Erosion in Dry Valley, School of Geographical Sciences, China West Normal University, Nanchong 637009, China
*
Author to whom correspondence should be addressed.
Sustainability 2025, 17(8), 3732; https://doi.org/10.3390/su17083732
Submission received: 10 March 2025 / Revised: 9 April 2025 / Accepted: 15 April 2025 / Published: 21 April 2025

Abstract

:
Carbonate-hosted clay-type lithium deposits have emerged as strategic resources critical to the global energy transition, yet their exploration faces the dual challenges of technical complexity and environmental sustainability. Traditional methods often entail extensive land disruption, particularly in ecologically sensitive ecosystems where vegetation coverage and weathered layers hinder mineral detection. This study presents a case study of the San Dan lithium deposit in central Yunnan, where we propose a hierarchical anomaly extraction and multidimensional weighted comprehensive analysis. This comprehensive method integrates multi-source data from GF-3 QPSI SAR, GF-5B hyperspectral, and Landsat-8 OLI datasets and is structured around two core parts, as follows: (1) Hierarchical Anomaly Extraction: Utilizing principal component analysis, this part extracts hydroxyl and iron-stained alteration anomalies. It further employs the spectral hourglass technique for the precise identification of lithium-rich minerals, such as montmorillonite and illite. Additionally, concealed structures are extracted using azimuth filtering and structural detection in radar remote sensing. (2) Multidimensional Weighted Comprehensive Analysis: This module applies reclassification, kernel density analysis, and normalization preprocessing to five informational layers—hydroxyl, iron staining, minerals, lithology, and structure. Dynamic weighting, informed by expert experience and experimental adjustments using the weighted weight-of-evidence method, delineates graded target areas. Three priority target areas were identified, with field validation conducted in the most promising area revealing Li2O contents ranging from 0.10% to 0.22%. This technical system, through the collaborative interpretation of multi-source data and quantitative decision-making processes, provides robust support for exploring carbonate-clay-type lithium deposits in central Yunnan. By promoting efficient, data-driven exploration and minimizing environmental disruption, it ensures that lithium extraction meets the growing demand while preserving ecological integrity, setting a benchmark for the sustainable exploration of clay-type lithium deposits worldwide.

1. Introduction

Lithium (Li) has emerged as a strategically critical metal, with increasingly broad applications in new energy, pharmaceuticals, the nuclear industry, and aerospace, garnering global attention as a key resource [1,2]. In recent years, carbonate clay-type lithium deposits discovered in Southwest China have demonstrated substantial development potential due to their large scale, stable distribution, and low extraction costs [3]. However, the region’s fragmented terrain and dense vegetation pose significant challenges to traditional exploration methods, leading to inefficiencies in the process [4,5,6,7].
Remote sensing technologies, with their extensive coverage, multi-level spatiotemporal resolution, and capabilities for multidimensional information fusion, offer a promising new paradigm for mineral exploration in complex geological environments [8,9]. Over the last decade, remote sensing technology has increasingly been applied to lithium exploration, focusing primarily on two deposit types: (1) pegmatite-type lithium deposits, studied using multispectral data (ASTER, Landsat, Sentinel-2) through RGB combinations and selective principal component analysis (PCA) methods [10,11,12] and (2) salt lake brine-type lithium resources, mapped using thermal infrared bands to detect temperature changes and water chemistry associated with lithium concentration [13,14]. In contrast, carbonate-hosted clay-type lithium deposits present a unique challenge due to the fine-grained nature of lithium in clay minerals, which requires multi-source data detection to capture subtle mineralogical variations [3,15,16]. Recent advances in remote sensing for lithium exploration have focused on three main approaches: (1) the multispectral detection of lithium-bearing pegmatites using band ratio and PCA techniques [10,17]; (2) the hyperspectral identification of lithium-associated minerals like cookeite and lepidolite [18,19]; and (3) integrated machine learning-based mapping [20,21,22], in which support vector machines (SVMs) improved lithium-pegmatite mapping accuracy by 22% compared to traditional PCA.
However, current research on carbonate clay-type lithium deposits faces two main challenges. First, existing methods mainly focus on distinct lithological boundaries in low-vegetation areas, which contrasts with the challenge of detecting diffusely distributed Li⁺ ions in phyllosilicate lattices beneath dense vegetation [20]. While vegetation suppression techniques such as phased vegetation masking and mixed-pixel spectral unmixing have been demonstrated in similar geological contexts, dense vegetation cover necessitates more advanced suppression methods [21,23,24]. Second, exploration efforts for carbonate clay-type lithium deposits continue to rely largely on single data sources. This limitation has spurred interest in integrating multi-platform remote sensing data to overcome the limitations of individual sources and improve exploration accuracy and efficiency, and the synergistic use of multispectral, hyperspectral, and radar data allows for the comprehensive extraction of ore-bearing layers, mineralization alteration signatures, and structural features that control ore formation [25,26,27]. Furthermore, the integration of field validation, petrological, and geochemical analysis improves the reliability of remote sensing-based exploration and facilitates the precise delineation of potential mineral targets [28]. Despite these advancements, the integration of multi-source remote sensing data, collaborative modeling, and quantitative weight allocation remains insufficiently explored. No existing approach simultaneously integrates radar, hyperspectral, and multispectral data to resolve issues of spectral mixing and structural control in clay-type lithium exploration.
This study introduces an innovative approach to lithium exploration in San Dan Town in central Yunnan, utilizing hierarchical anomaly extraction and multidimensional weighted comprehensive analysis. This method leverages multi-source data including GF-3 QPSI SAR, GF-5B hyperspectral, and Landsat-8 OLI datasets and is structured around two core parts: (1) Hierarchical Anomaly Extraction: This part extracts hydroxyl and iron-stained alteration anomalies from multispectral data, identifies six types of lithium-rich minerals and four types of lithium-rich rock alteration information from hyperspectral data, and detects linear structural information from radar data. (2) Multidimensional Weighted Comprehensive Analysis: This part constructs a dynamic weight fusion approach, assigning weights to different informational layers (alteration 45%, lithology 30%, and structure 25%) to build a predictive model of potential lithium-bearing areas. Through this comprehensive analysis of the regional ore-forming potential, we delineate prospective mineralized zones. This approach not only enhances the efficiency of lithium exploration but also minimizes environmental disruption, aligning with principles of sustainable development. By setting a new benchmark for green mineral exploration, this method paves the way for the sustainable and responsible development of clay-type lithium deposits worldwide.

2. Materials and Methods

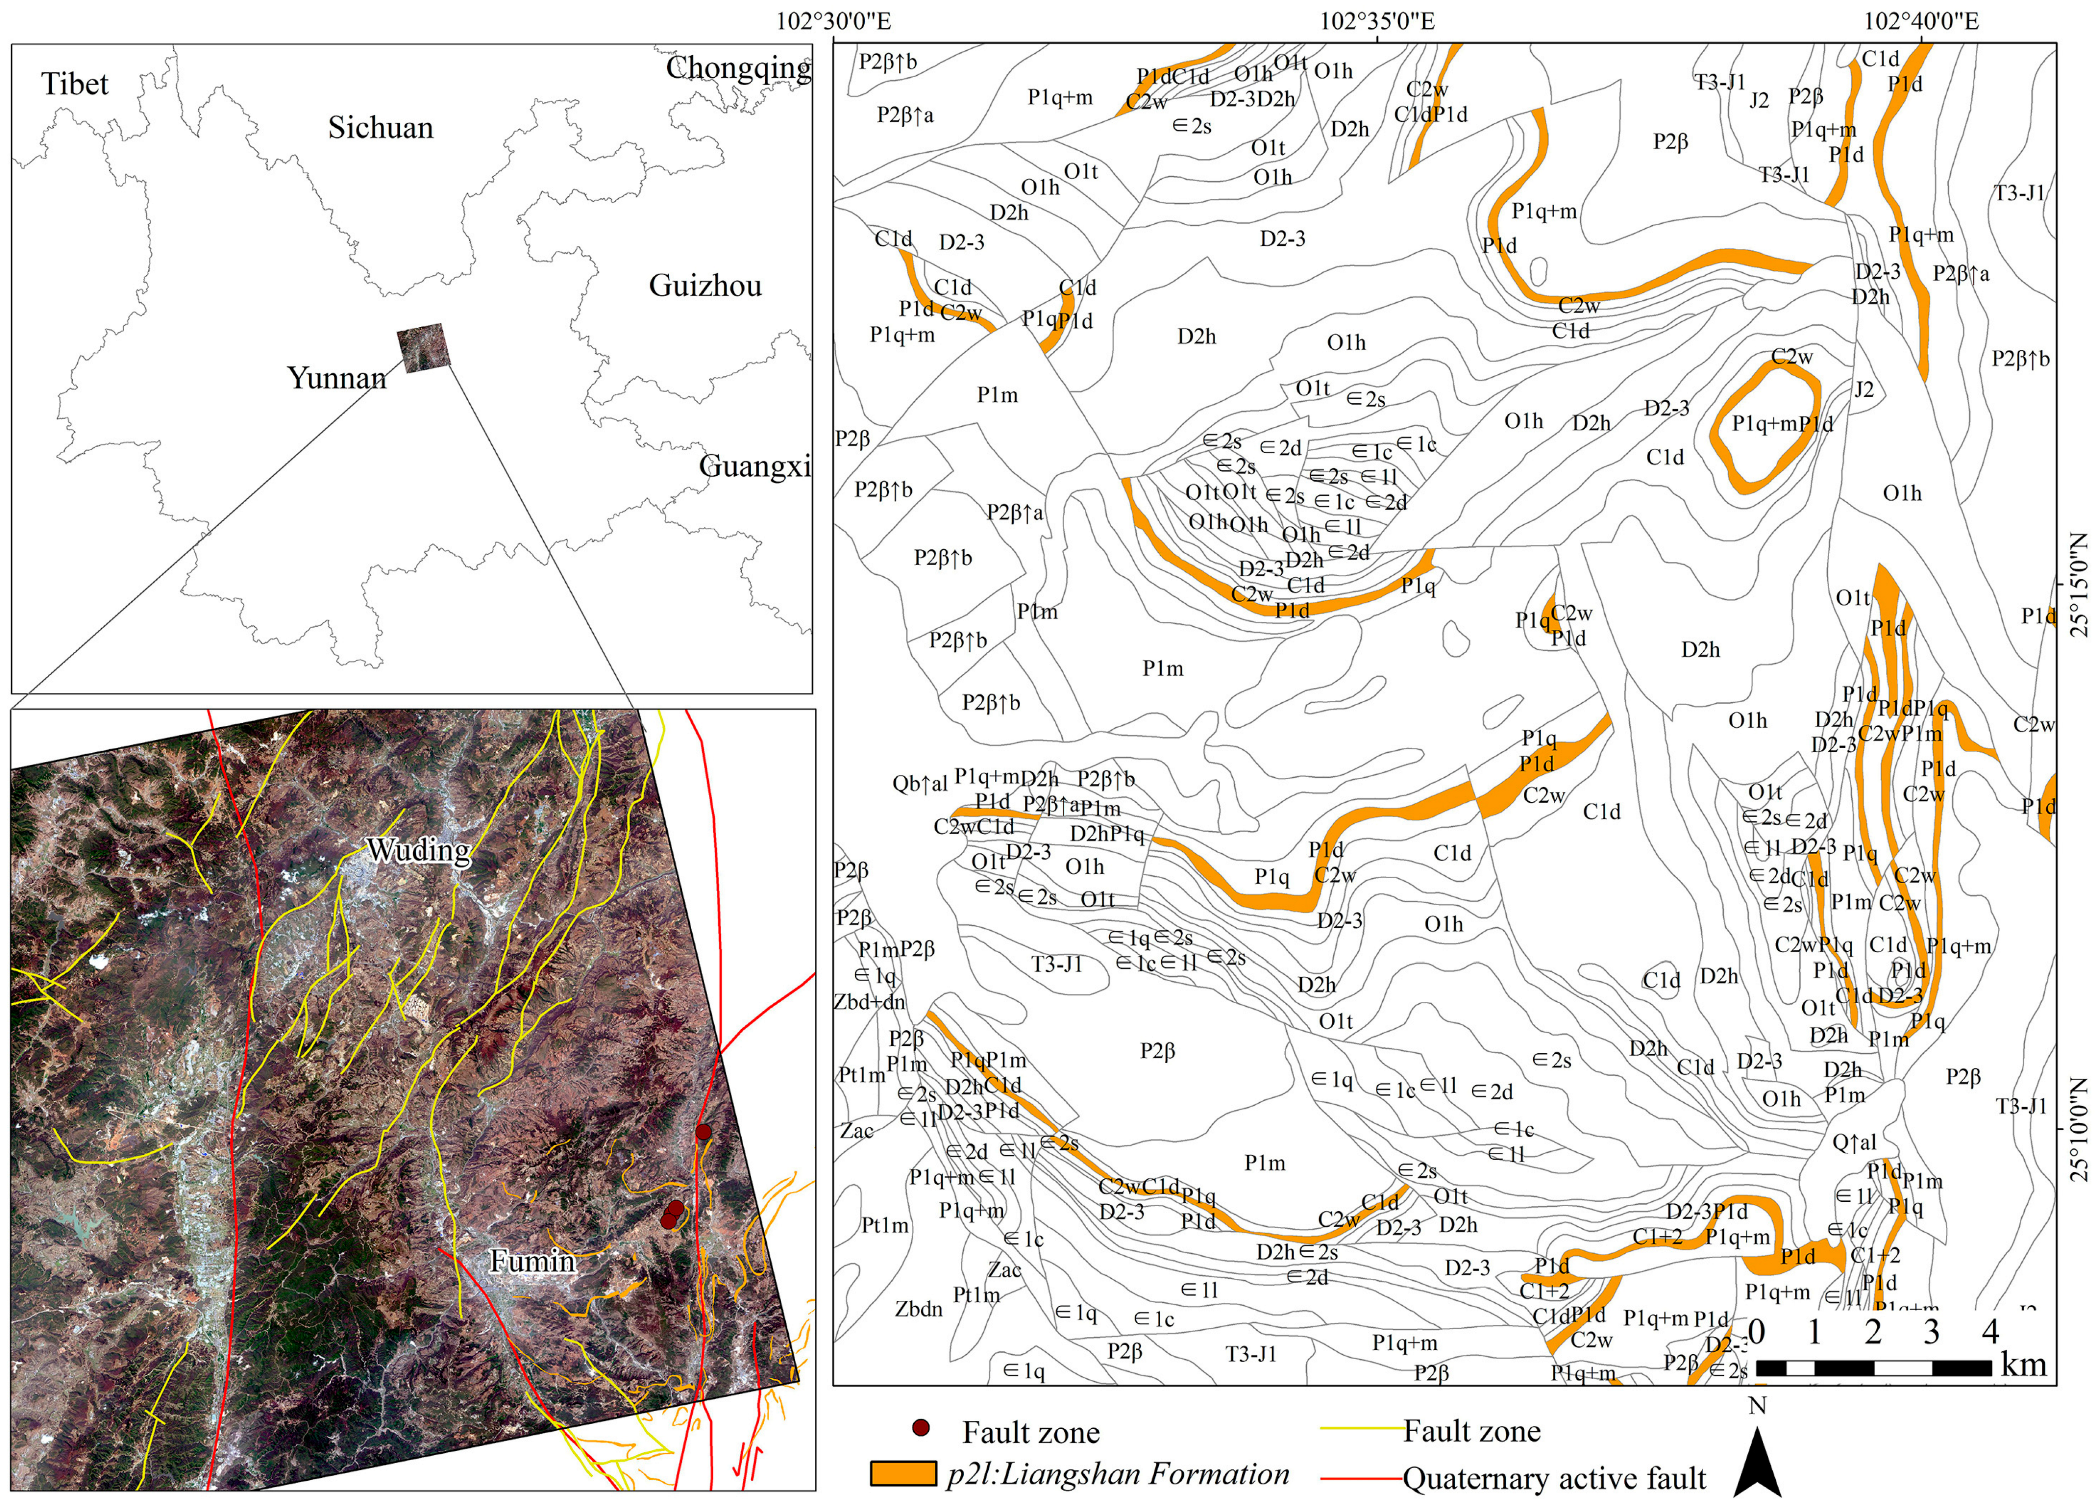
2.1. Geological Setting of the Area

The study area is located in San Dan Town, Fumin County, Kunming City, Yunnan Province (Figure 1), situated at the southwestern margin of the Yangtze Block (102°21′–102°47′ E, 25°08′–25°37′ N). The main structural feature is a near-north–south trending fault formed during the Yanshanian period, with rock strata generally dipping towards the northeast and southeast. Recent research in this area has identified high-grade, large-reserve bauxite and coal-associated sedimentary clay-type lithium deposits [3]. These deposits primarily occur in the Middle Permian Daishitou Formation (P1d), also known as the Liangshan Formation (P2l), within a coastal–lacustrine depositional environment. The average thickness ranges from 5 to 20 m, extensively covering the weathered and eroded surfaces of older strata such as that from the Weining Formation to the Dengying Formation. The lithology mainly comprises sandy shale with limestone lenses, bauxite, and inferior coal seams. Integrated analysis of geophysical and geochemical characteristics reveals that the area’s ore-hosting lithostratigraphic assemblage, mineralization timing, depositional environment, sedimentary provenance, and paleogeographic features bear similarities to those at Xiaoshiqiao [15] and Anning [29], indicating significant ore-forming potential in the region.
The stratigraphic framework in the study is described as follows:
Precambrian: Heishantou (Pt2hs), Meidian (Pt2m), and Liubatang (Pt2lb) Formations of the Kunyang Group.
Sinian: Lower Sinian Chengjiang (Z2c), Upper Sinian Doushantuo (Z2d), Guanyinya (Z2gz), and Dengying (Z2dn) Formations.
Cambrian: Lower Cambrian Yuhucun (Є1y), Qiongzhusi (Є1q), and Canglangpu (Є1c) Formations.
Devonian: Middle Devonian Haikou (D2h) and Upper Devonian Zaige (D₃z) Formations.
Carboniferous: Lower Carboniferous Wanshoushan (C1w) and Shangsi (C1s), Middle Carboniferous Weining (C2w) Formations.
Permian: Middle Permian Liangshan (P2l) and Yangxin (P2y), Upper Permian Emeishan Basalt (P2e) Formations.
Triassic: Upper Triassic Shezi (T₃s) Formation.
Jurassic: Lower Jurassic Fengjiahe (J1f) and Middle Jurassic Zhanghe (J2z) Formations.

2.2. Data and Preprocessing

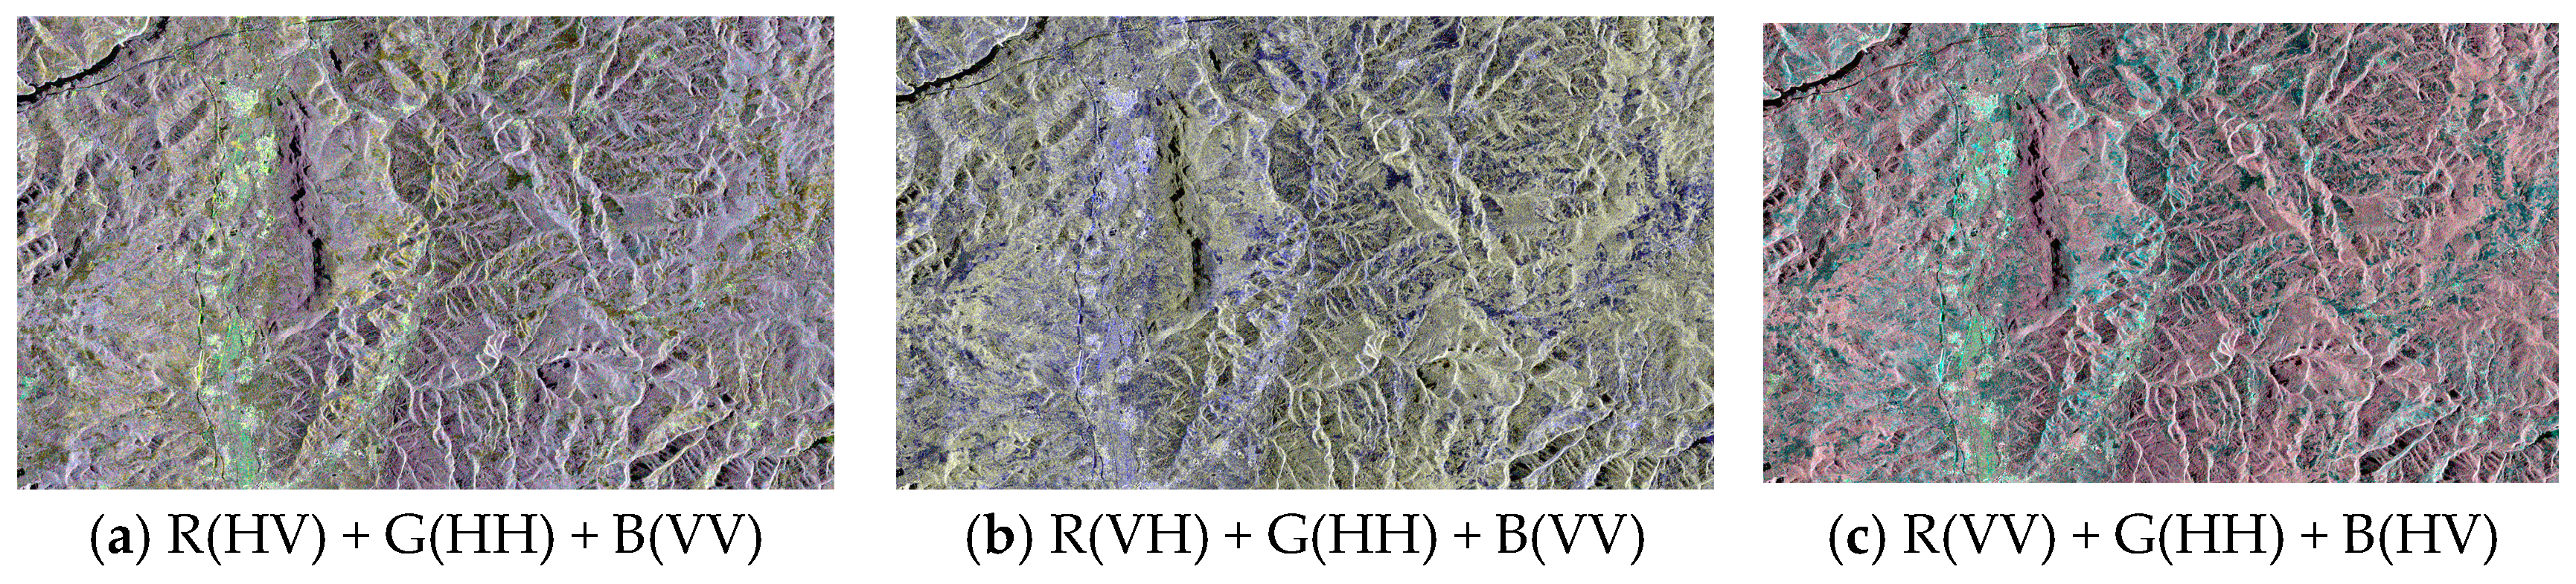
2.2.1. Remote Sensing Data

The rapid advancement of satellite technologies, including multispectral, hyperspectral, and radar technologies, has facilitated the synergistic application of multi-source data, demonstrating significant advantages in resource exploration. This study employs radar data from GF-3 QPSI (fully polarized), hyperspectral data from GF-5B AHSI (on a co-source platform), and multispectral data from Landsat-8 OLI (for auxiliary correction), to construct a multi-source cooperative exploration technology system.
(1)
GF-3 QPSI
For this study, Level 1A data from GF-3 QPSI, covering both dry and rainy seasons (15 July 2019, 10 March 2022, 4 February 2024, 24 March 2024, 18 May 2024), were selected for the temporal analysis of fault structures. Due to the substantial speckle noise associated with the SAR imaging mechanism of GF-3, which impacts the interpretability of surface features, several preprocessing steps were undertaken in ENVI 5.6 Sarscape software. These included data importation, multi-looking, filtering, linear stretching, and geocoding. A Lee filter was utilized to suppress noise, and a 30-meter resolution DEM provided by ALOS (Tsukuba, Japan) was used for the terrain correction of the SAR images, resulting in geocoded data that enhanced the precision and reliability of subsequent analyses.
(2)
GF-5B AHSI
The GF-5B satellite with Visible and Shortwave Infrared Hyperspectral Imager (AHSI) features 330 spectral bands covering a spectral range from 400 to 2500 nanometers, with spectral resolutions of 5 nanometers (VNIR) and 10 nanometers (SWIR), and a spatial resolution of 30 m over a swath width of 60 km. The AHSI data offer high spatial and spectral resolutions, a high temporal resolution, and high calibration accuracy, which are particularly effective in detecting subtle differences between minerals such as dolomite and calcite and in identifying the substitution of silica and alumina in micas [6,30,31]. The GF-5B AHSI hyperspectral data used in this study are Level 1 products, acquired on 21 March 2024. Preprocessing included radiometric calibration, atmospheric correction, orthorectification, terrain correction, image registration, and mosaic cropping [32].
(3)
Landsat 8 OLI
The Landsat-8 OLI sensor primarily consists of nine spectral bands, including a panchromatic band with a spatial resolution of 15 m and eight bands in the Visible–Near-Infrared (VNIR) and Short-Wave Infrared (SWIR) ranges, each with a spatial resolution of 30 m (see Table 1). For this study, Landsat-8 data captured on 29 May 2024 were selected. To enhance the data quality and applicability, preprocessing steps such as radiometric correction, atmospheric correction, geometric correction, band combination, terrain correction, and enhancement were applied. The data selected were cloud-free and of high quality, with parameters as shown in Table 1.

2.2.2. Field Sampling Data and Preprocessing

(1)
Mineral Specimen Collection and Analysis
The study area is characterized by thick vegetation cover and intense surface weathering. The initial sampling involved the collection of mineral specimens from surface rocks. Samples were dried and ground in the laboratory, and the lithium oxide (Li2O) content was determined using an Inductively Coupled Plasma Optical Emission Spectrometer (ICAP 7000, Thermo Fisher Scientific, Wartham, MA, USA), following the methodologies outlined in Analysis of Rocks and Minerals (4th Edition) [34] and the national standard “Chemical Analysis Methods for Lithium Ores” (GB/T17413.3-2010) [35].
(2)
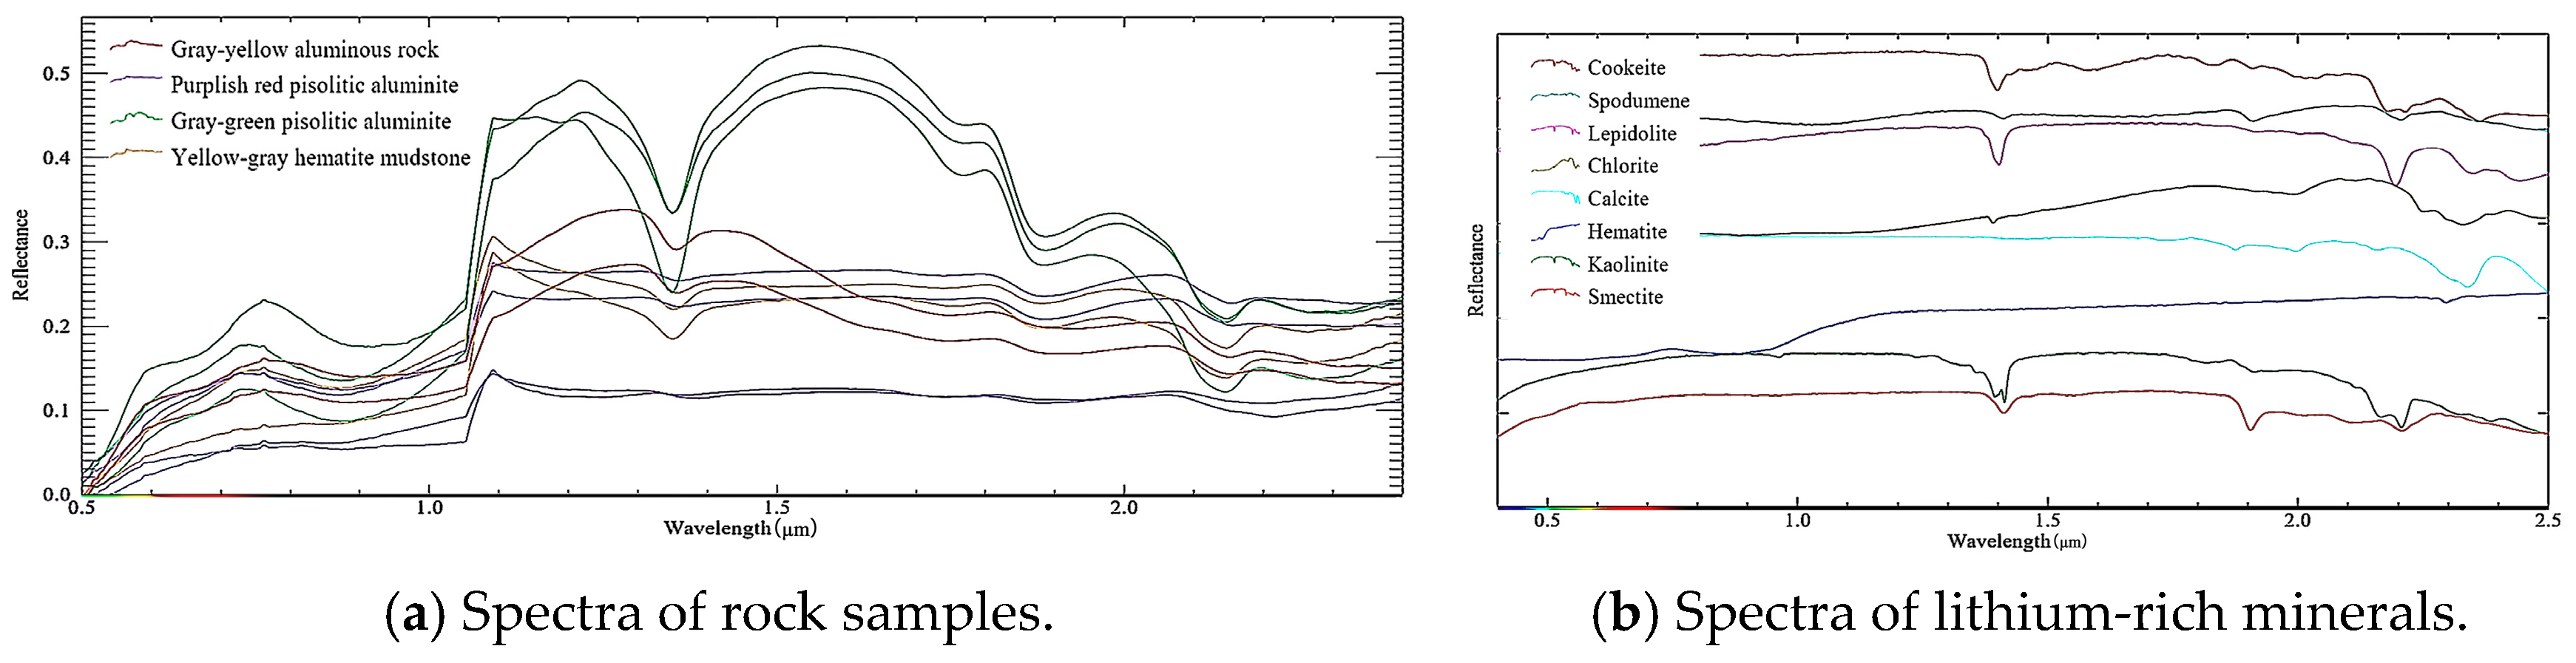
Rock Sample Data Collection
Rock spectral data were collected using the iSpecField-WNIR-HRs, a portable ground spectrometer from LiSenOptics, Shenzhen, China (Table 2). This device spans a spectral range of 200–2500 nm and is equipped with a 2048-pixel BT-CCD and a 512-pixel InGaAs detector, featuring an autofocus camera, a GPS, and a signal-to-noise ratio of VNIR > 1000:1, SWIR > 600:1. It also includes GPS positioning (accuracy < 2 m) and the real-time analysis software SpecAnalysis 0.5.2. Due to the influence of surface weathering debris morphology (particle size 5–20 cm), the original spectral data exhibited stepladder-like noise in the 1100–1200 nm range, as illustrated in Figure 2a. The dataset was processed using Savitzky–Golay filtering to smooth the data and exclude wavelengths below 400 nm (due to atmospheric scattering interference) and above 2450 nm (thermal noise), ensuring data reliability.

2.2.3. Spectral Collection of Lithium-Rich Minerals

The study area, which contains lithium–aluminum laterite systems, is primarily composed of aluminous claystone, ferruginous claystone, and bauxite. The mineralogical assemblage is centered around lithium-bearing clay minerals (smectite, illite, and kaolinite), and is associated with monohydrate alumina, hematite, and accessory minerals (rutile, pyrite, etc.) [36]. Smectite is commonly coexistent with kaolinite, muscovite, greenalite, hematite, and bauxite within the claystone. Mineralized outcrops often manifest as nodular ferruginous aluminous laterite, bauxite, and ferruginous claystone, serving as indicators for mineral exploration [6]. Based on the spectral analysis of field samples, this study extracted six categories of standard spectra for lithium-rich minerals from the USGS V6 spectral library (minerals beckman 3375.sli), as illustrated in Figure 2b. The characteristic absorption peaks are summarized in Table 3.

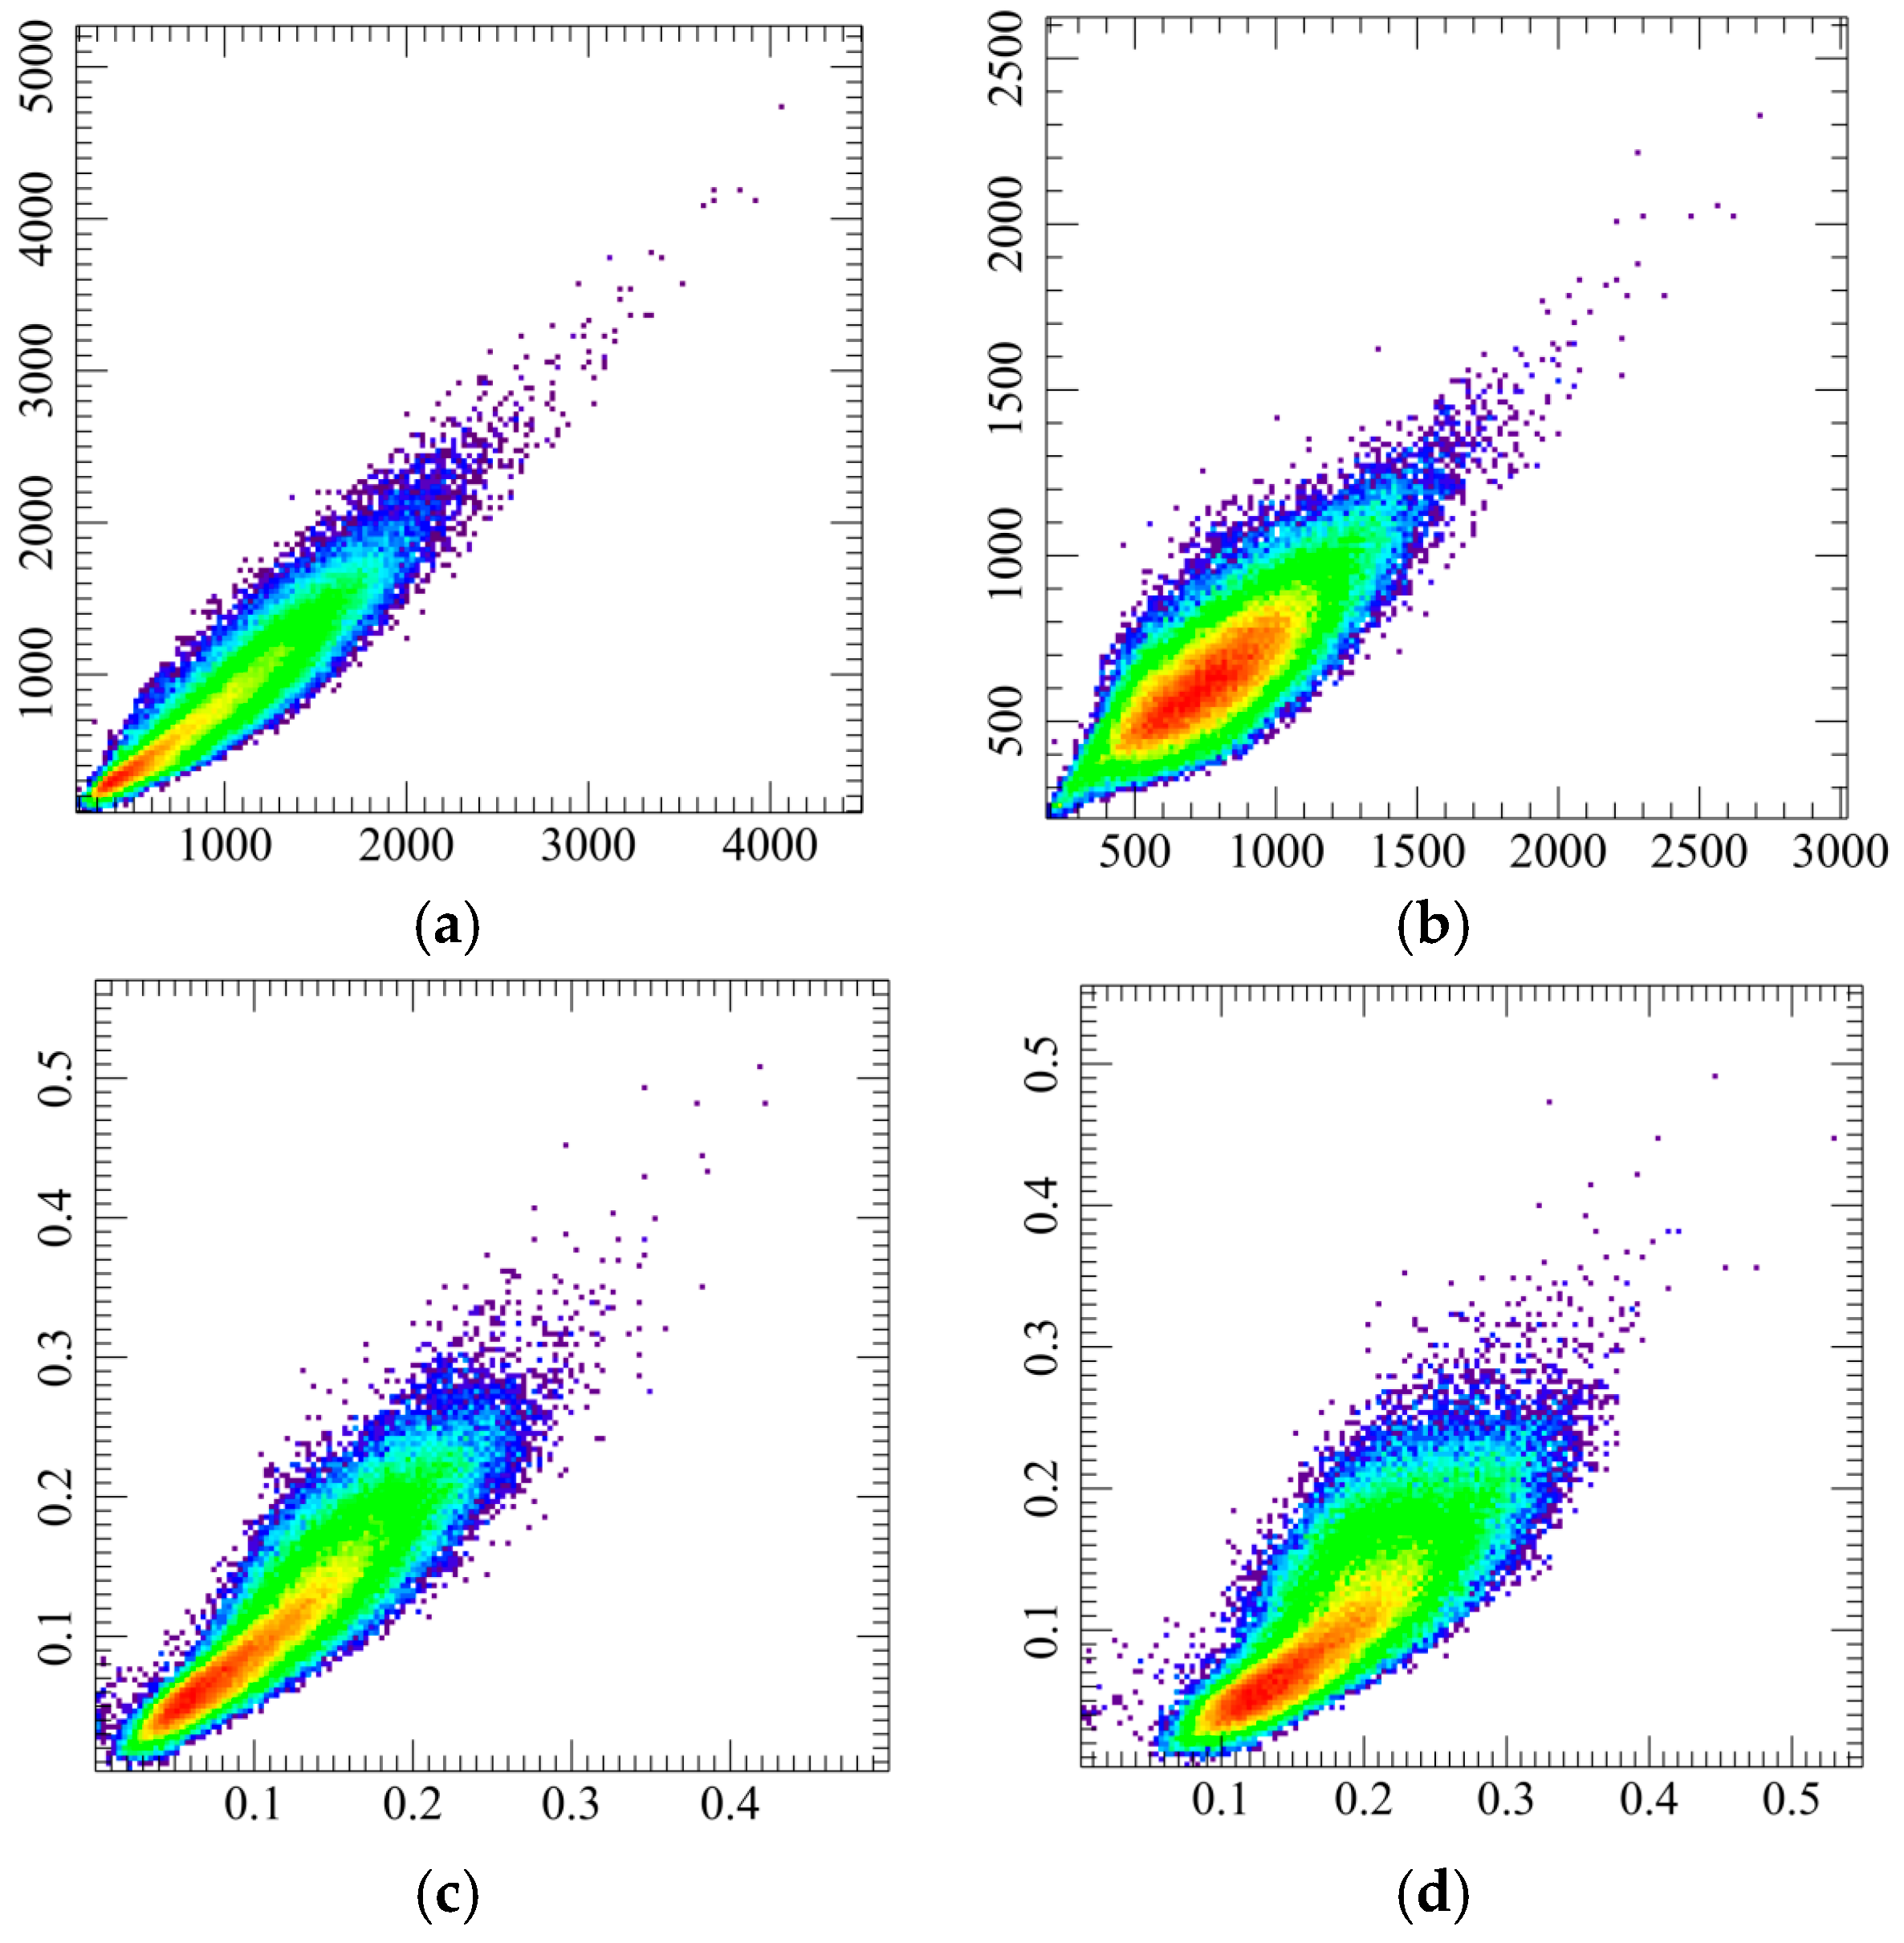
2.3. Vegetation Suppression

The study area is characterized by extensive vegetation coverage, which obscures the weak spectral signals associated with clay-type mineralization alterations. These signals, identifiable through spectral absorption features indicative of specific minerals, frequently encounter interference from both vegetation and Quaternary overburden. To counteract this interference, vegetation suppression techniques are crucial as they enhance the spectral signatures of the underlying rock and improve the precision of alteration detection. To address the challenge of extracting concealed clay-type mineralization alterations in areas of high vegetation coverage, this study introduces a Multi-source Remote Sensing Collaborative Vegetation Suppression (MRSC-VS) strategy [37,38].
For the Landsat 8 data, vegetation spectral interference within multispectral and hyperspectral images was mitigated using the red and near-infrared bands. For the GF-5B data, a vegetation suppression method based on linear spectral unmixing was employed to obtain composite spectra of non-vegetation endmembers (NVEs) for each band. This method adheres to the linear spectral mixture model:
S N v e g , i = D N - f v e g S v e g i = 1 m f i
where DN represents the digital number of pixel values in each band, fveg denotes the abundance of vegetation endmembers, Sveg indicates the average spectral index of vegetation endmembers per band, SNveg,i corresponds to the composite spectrum of the i-th non-vegetation endmember, fi signifies the abundance of the i-th non-vegetation endmember, and m represents the number of non-vegetation endmembers.
The experimental procedure begins by calculating the Normalized Difference Vegetation Index (NDVI) from preprocessed GF-5B data, followed by applying linear spectral unmixing to generate maps of vegetation endmember abundance and derive the vegetation endmember spectrum S v e g . The NDVI is calculated using the following formula:
NDVI = N I R - R e d N I R + R e d
where NIR represents the near-infrared band value, and Red represents the red band value of the satellite imagery.
Subsequently, the composite spectra of non-vegetation endmembers (SNveg,i) are calculated for each band. The original band data are then replaced with SNveg,i, and the modified spectra are integrated with unprocessed bands into a unified dataset. A statistical evaluation of the results is conducted; if the outcomes are suboptimal, an iterative optimization loop is initiated to refine the abundance of vegetation endmembers (fveg) and spectrum (Sveg) until satisfactory results are obtained.

2.4. Alteration Information Extraction

Secondary minerals, resulting from wall-rock alteration, exhibit significant distinctions from the primary wall-rock in terms of color, mineral structure, and chemical composition [18]. Remote sensing alteration extraction identifies the spatial distribution characteristics of mineralization-altered zones, providing essential indicators for mineral exploration. This study leverages the strengths of multispectral (Landsat 8) and hyperspectral (GF-5B) data, utilizing PCA to isolate hydroxyl alteration signals. Combined with the spectral hourglass approach, this methodology facilitated the identification of six mineral alteration types and four rock alteration types within the GF-5B dataset.

2.4.1. Extraction of Mineralization and Alteration Anomalies

PCA is employed for multispectral remote sensing data to reduce dimensionality by transforming correlated spectral band information into a series of uncorrelated components orthogonally. The first few components, which exhibit significant correlation, are retained to enhance the efficiency of alteration detection.
Iron-stained alteration is predominantly attributed to Fe3+ minerals such as limonite, hematite, goethite, and jarosite. These minerals are characterized by distinctive absorption peaks at 850 nm and 950 nm. Hydroxyl alteration, resulting from lattice vibrations within clay minerals like kaolinite, dickite, and muscovite, manifests diagnostic absorption features near 1400 nm, 2200 nm, and 2300 nm. Utilizing the spectral response characteristics of VNIR (400–1000 nm) and SWIR (1000–2500 nm), optimal bands from Landsat 8 OLI were chosen for the extraction of alterations. For iron-stained alteration, bands B1 (433–453 nm), B2 (450–515 nm), B4 (640–670 nm), and B5 (850–880 nm) were integrated for PCA to mitigate interference from hydroxyl (B6) and carbonate (B7) signals. The spectral contributions of Fe3+-bearing minerals in B1 and B4 oppose those in B2 and B5, with PC4 displaying the highest absolute eigenvalue. Consequently, PC4 was utilized to delineate iron-stained alteration.
Hydroxyl and carbonate minerals demonstrate high reflectance in Band 6 but exhibit strong absorption features in Band 7 (2200 nm wavelength). To enhance the brightness contrast, the Band6/Band7 ratio is employed, and Bands 2, 5, 6, and 7 are selected for PCA.
A statistical analysis of eigenvectors (Table 4) and the spectral characteristics of hydroxyl alteration minerals reveal that PC4 is particularly effective for identifying hydroxyl-related anomalies, owing to its unique properties: the contribution coefficients of Band 6 and Band 7 are inversely related to that of Band 5, with PC4 demonstrating the highest absolute contribution value. The opposing signs between Band 6 and Band 7 further affirm PC4′s aptitude in mapping hydroxyl alteration anomalies.
Classification thresholds for hydroxyl and iron-stained minerals were established using k multiples of the standard deviation (SD) [13]. For hydroxyl minerals, k values of 2, 2.5, and 3 were utilized (SD = 49.8725), while for iron-stained minerals, k values of 1.5 and 2.5 were adopted (SD = 9.0625). These thresholds enable the categorization of alteration intensity into distinct levels based on deviations from the mean. The specific classification criteria for both iron-stained and hydroxyl minerals are summarized in Table 5.

2.4.2. Hyperspectral Hourglass Method

The fundamental objective of hyperspectral mineral identification is the classification of endmember spectra through the application of various methodologies to achieve accurate mineral classification and extraction from imagery. One prevalent technique in this realm is the spectral hourglass approach [36], which synthesizes feature extraction, endmember spectral selection, and spectral matching into a coherent workflow. The following critical steps are integral to our study’s methodology:
Minimum Noise Fraction (MNF) Rotation—This step effectively differentiates between image noise and signals, thereby reducing noise interference and compressing high-dimensional data into a more manageable low-dimensional space. It surpasses PCA in the processing of hyperspectral data.
Pixel Purity Index (PPI)—This index identifies pure pixels by statistically projecting image data onto random vectors and tallying occurrences of extreme pixels.
n-Dimensional Visualization—This process facilitates the extraction of endmember spectra from the identified pure pixels.
Spectral Angle Mapper (SAM)—This method quantifies spectral similarities by calculating the angular difference between vectors (as shown in Equation (2)). Smaller angles suggest higher similarity and a greater probability of the spectra belonging to the same material class.
S A M ( x , y ) = cos 1 ( i = 1 n x i y i i = 1 n x i 2 i = 1 n y i 2 )
where x represents the pixel’s spectral vector, and y denotes the reference spectral vector.
Endmember spectra for six minerals—smectite, kaolinite, hematite, calcite, lepidolite, and spodumene—were extracted from GF-5B hyperspectral imagery and cross-referenced with the USGS V6 spectral library. Additionally, field-measured rock spectra (11 spectra from four types: gray-yellow aluminous rocks, purplish-red pisolitic aluminous rocks, gray-green pisolitic aluminous rocks, and yellow-gray hematite-bearing mudstones) were integrated to enhance the mapping of mineral and rock alterations. The SAM method was then applied to quantify the spectral similarity between the extracted endmembers and reference spectra, facilitating the precise identification of alteration patterns. This hybrid approach combines laboratory-standard spectral signatures with site-specific lithological variations to improve classification accuracy.

2.5. Structural Interpretation

We synthesized false-color composite imagery using the R(HV) + G(HH) + B(VV) polarization combination through multiple experimental (Figure 3) trials to enhance the visibility of topographic and geomorphic features.
HV-polarized data underwent directional filtering across four orientations—N0° (N-S), N45° (NE-SW), N90° (E-W), and N135° (NW-SE)—utilizing a 3 × 3 kernel matrix. This process generated images with enhanced directional contrast and improved edge definition. These images were subsequently analyzed using the LINE module of PCI Geomatica, 2020, where linear structural features were extracted via edge detection and line detection algorithms, parameterized by six key variables, as detailed in Table 6.

2.6. Comprehensive Analysis of Multifactorial Information

This study integrates multi-geospatial information layers (hydroxyl alteration, iron staining, mineral composition, lithology, and tectonic structures) utilizing methods such as reclassification, kernel density analysis, and normalization. Expert knowledge and experimental adjustments enabled the assignment of weights to each layer. The weighted weight-of-evidence approach facilitated the delineation of multi-level prospecting targets. The workflow included the following steps:
(1)
Normalization: Each layer was normalized using the following equation:
X n = X X m i n X m a x X m i n
where Xn is the normalized value, X is the original value, and Xmax and Xmin are the maximum and minimum values of the layer, respectively.
(2)
Kernel Density Analysis: This highlighted the spatial clustering patterns of features related to mineralization.
(3)
PCA: This integrated information from six layers (hydroxyl, iron staining, minerals, lithology, structures, and stratigraphy) to enhance extraction of mineral and alteration features. The prospecting potential score, S, was calculated as follows:
S = j = 1 n W j X j
where X j is the normalized value of the j-th layer.
(4)
Threshold-Based Targeting: High-potential zones were identified by defining thresholds for S.
The multifactor information was analyzed using ArcGIS 10.8 software.
The technical approach of the study is shown in Figure 4.

3. Results

3.1. Vegetation Suppression Effects

The effects of vegetation suppression on multispectral and hyperspectral remote sensing images are shown in Figure 5. Both Landsat 8 and GF-5B data exhibited similar characteristics post vegetation suppression. The 2D scatter plot represents the correlation strength between two spectral bands. The color gradient of the data points progresses from blue, green, yellow to red, with higher-density areas tending towards red and lower-density areas towards blue. High-density regions typically correspond to background materials (bare soil or vegetation), while discrete points may indicate anomalies (mineralized alteration zones). As can be seen, the image after vegetation suppression shows a richer pattern of discrete signals.

3.2. Alteration Anomaly Extraction

The original scatterplot (Figure 5a) of Landsat 8 data displays an elliptical distribution with overlapping vegetation and mineral alteration signatures. The post-suppression scatterplot (Figure 5b) shows spatially prominent anomalous signals with expanded coverage, indicating enhanced surface reflectance due to reduced vegetation coverage, thereby exposing underlying surfaces such as soil and rock. The post-suppression scatterplot (Figure 5d) demonstrates redistributed cluster patterns compared to the original data of GF-5B (Figure 5c), where high-density clusters (red/yellow) exhibit reduced coverage or spatial reorganization, and low-density regions (blue) expand significantly, reflecting suppressed vegetation reflectance and enhanced lithological signatures.
Alteration anomalies extracted from vegetation-suppressed Landsat-8 multispectral and GF-5B hyperspectral data are depicted in Figure 6. For the Landsat-8 data, PCA was effectively used to isolate iron-stained alterations (Figure 6a) and hydroxyl-bearing alterations (Figure 6b). This was achieved by leveraging eigenvector weighting on Fe3+-sensitive visible bands (0.45–0.69 μm) and clay mineral diagnostic shortwave infrared (SWIR) bands (2.1–2.3 μm), respectively.
For the GF-5B hyperspectral data, the Spectral Hourglass Method was used to identify six mineral alteration types: kaolinite, smectite, chlorite, lepidolite, spodumene, and cookeite (Figure 6c), along with four field-validated lithological alteration types: gray-yellow aluminous rocks, purple-red oolitic aluminous rocks, gray-green oolitic aluminous rocks, and yellow-gray hematite-bearing mudstones (Figure 6d). The spatial consistency between the hydroxyl anomalies observed in multispectral data and the hyperspectral-derived alteration minerals, such as kaolinite–chlorite assemblages, underscores the reliability of these methodologies. Regions that display pronounced iron alteration anomalies, hydroxyl anomaly clusters, and hyperspectral-identified alteration zones, as shown in Figure 6a,b, are prioritized as high-potential targets for further mineral exploration.

3.3. Structural Interpretation of Remote Sensing Data

The study area has experienced multiple phases of tectonic and magmatic activities, whereby structural systems predominantly governed the ore formation processes. An analysis of the spatial relationship between structural formations and zones of mineralization and alteration is of critical theoretical importance for prospecting via remote sensing. Notably, intense structural deformation can disrupt pre-existing sedimentary layers, highlighting the necessity of investigating the detailed structural architecture for effective mineral exploration.
The orientation-specific linear structures were quantitatively analyzed in terms of population, cumulative length, and mean length, with the results summarized in Table 7.
As depicted in Figure 7, the filtered density distribution and rose diagram exhibit azimuthal anisotropy of geological lineaments, with orientations primarily in the NE-SW direction (45°), both in terms of quantity and cumulative length. This orientation aligns with the principal tectonic stress orientation. Spatial analysis based on Geographic Information System (GIS) further quantifies structural density, revealing the highest value (90 m/km2) along the NE-SW axis, indicative of intense fracturing associated with compressional stress regimes. In contrast, structures orientated in the N-S direction show a significantly lower density, consistent with limited strain accumulation in orthogonal stress domains. This directional dominance underscores a stress-controlled structural evolution, where NE-SW orientated features dominate regional fluid migration and seismic hazard potential.

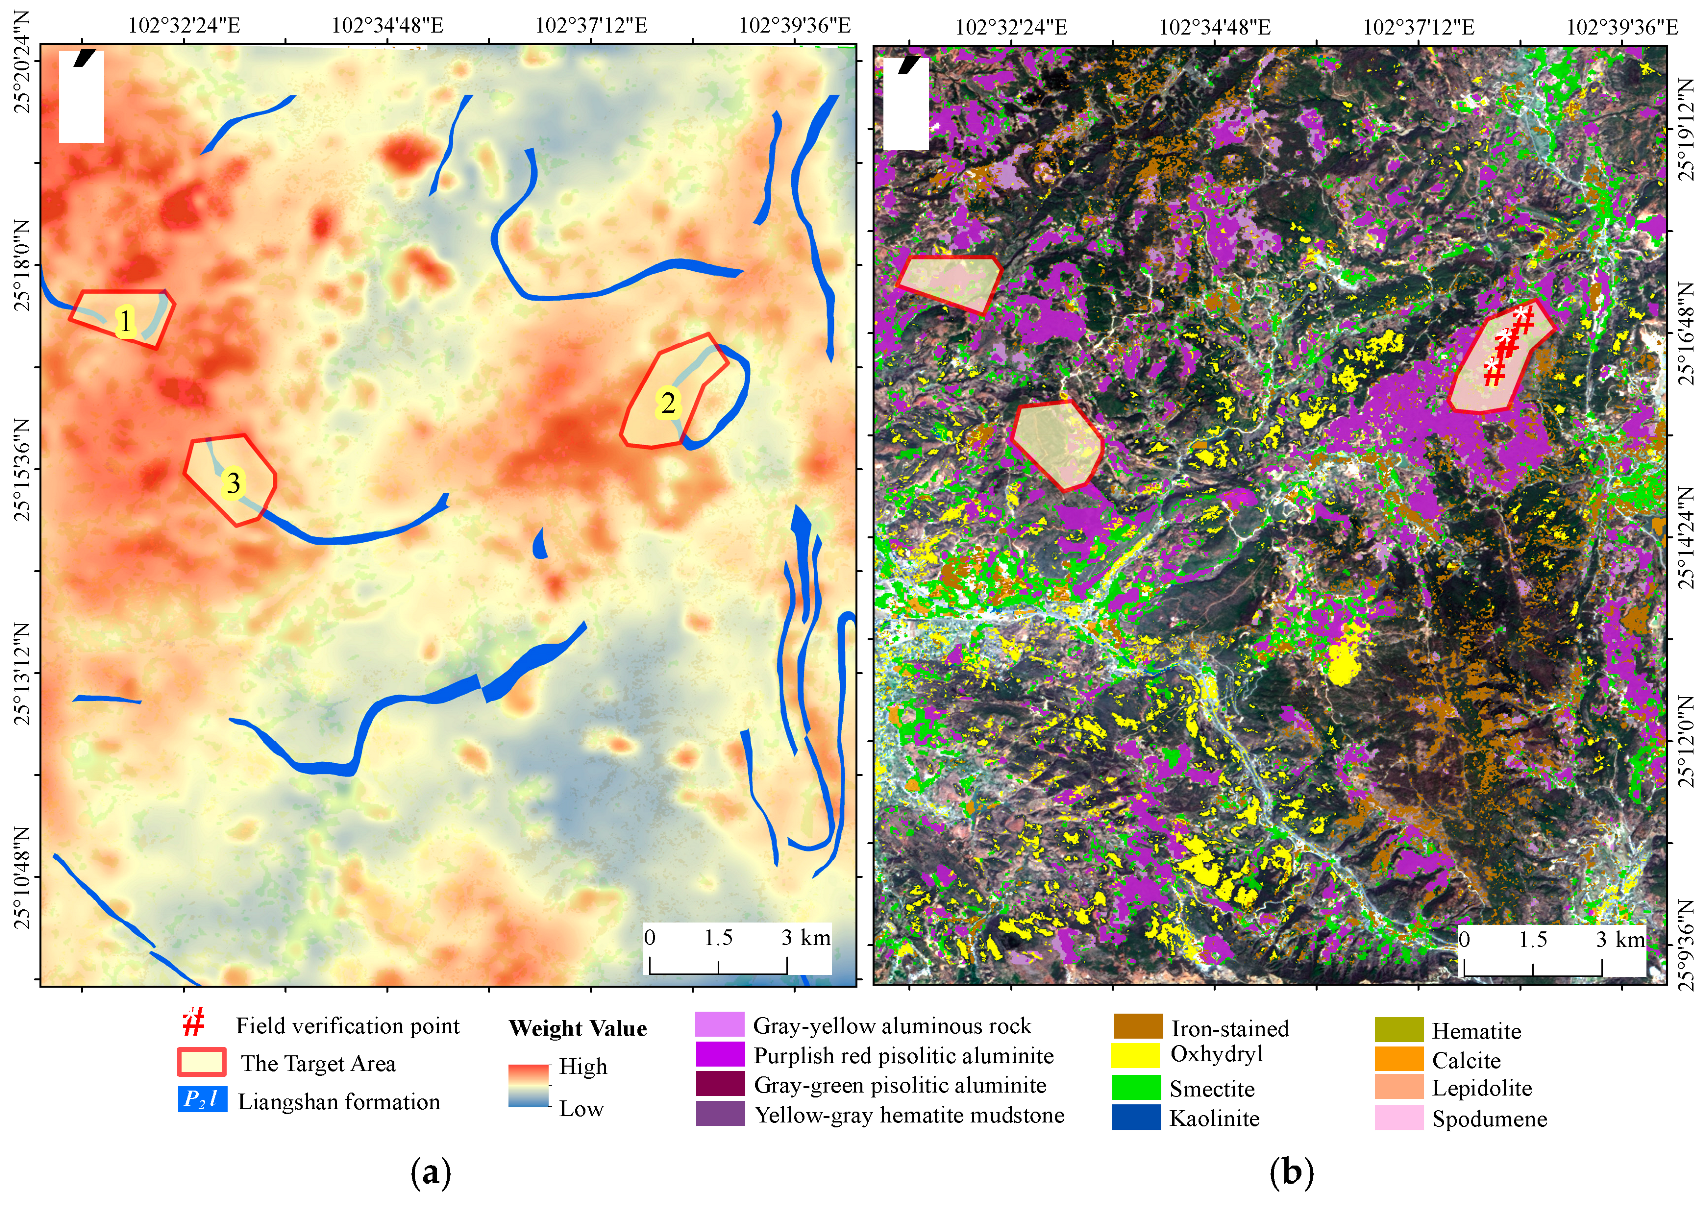
3.4. Comprehensive Analysis of Multiple Information Sources and Optimization

Single-factor extraction has proven to be insufficient for practical applications. This study integrates data on hydroxyl anomalies, iron-staining intensity, mineral assemblages, and rock alteration patterns through multivariate analysis, delineating high-priority exploration zones characterized by synergistic anomalies in iron-hydroxyl enrichment, lithium-bearing lithology, and linear structure density (Figure 8, Table 8).
Figure 9 delineates the boundaries for field investigations, with sampling locations detailed in Figure 10.

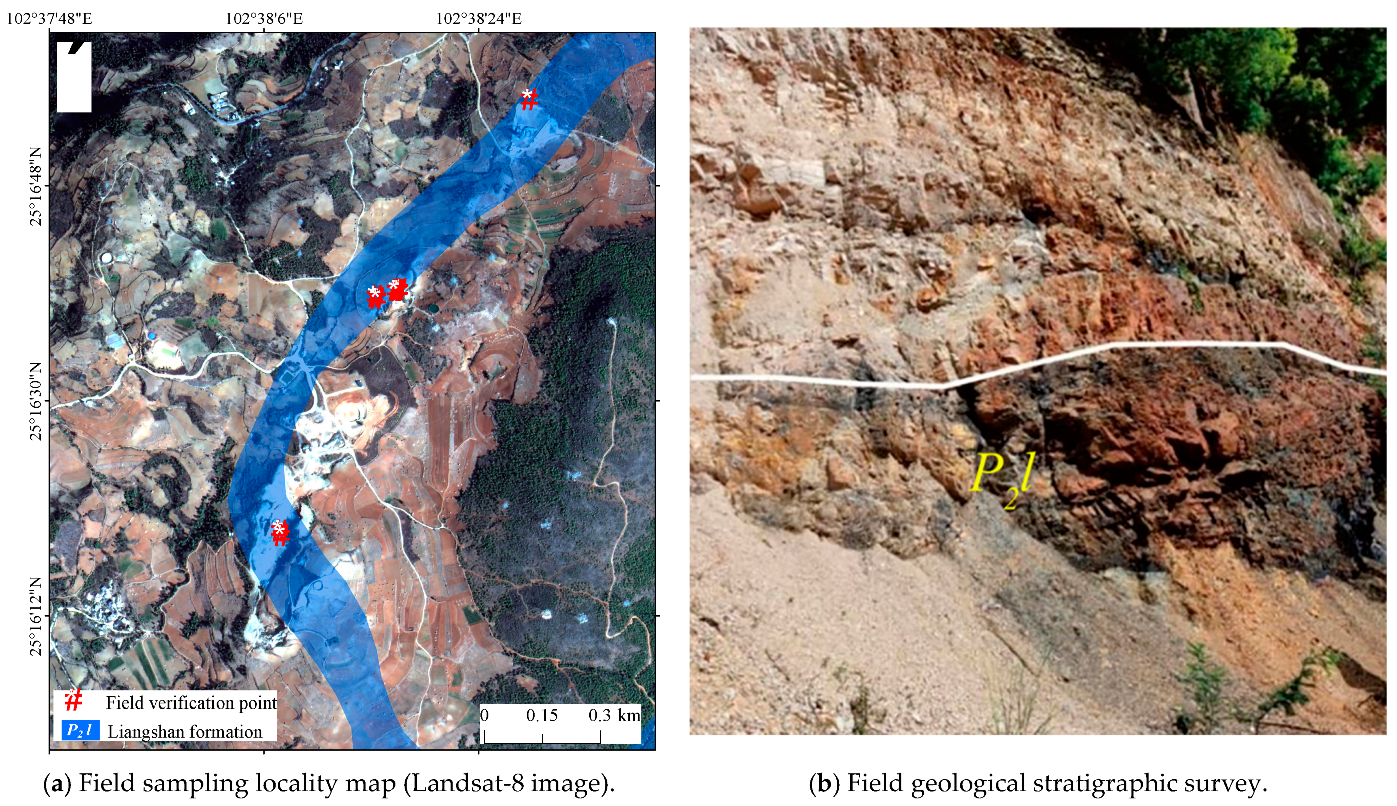
3.5. Field Verification

Figure 11 presents the lithium content results from the field sampling; the results demonstrate significant Li2O enrichment (0.10–0.22%) in claystone sequences, spatially correlating with remote sensing anomalies and confirming the reliability of the target areas through systematic geological surveys and laboratory assays.

4. Discussion

This study systematically evaluates the applicability and potential of multi-source remote sensing data in the exploration of carbonate-hosted clay-type lithium deposits. In contrast with previous studies that primarily relied on single-source hyperspectral data [10], our integrated approach—combining GF-3 SAR, GF-5B hyperspectral, and Landsat-8 OLI data—demonstrates significantly enhanced anomaly detection capabilities in densely vegetated regions. Field validation confirmed that the identified claystone sequences exhibit Li2O enrichment averaging 0.21%, which is consistent with the 0.18–0.25% range reported by Wen et al. [3] for the Daoshitou Formation in Yunnan, and notably higher than the 0.12–0.15% reported by Cui et al. and Yin [15,16] for similar deposits in the Guizhou Basin. These findings underscore the regional metallogenic differences and validate the effectiveness of the proposed methodology.
Moreover, this study introduces a prospecting strategy centered on “multi-source remote sensing, hierarchical extraction, and dynamic weighting”, which has proven effective in accurately delineating mineralization zones. This methodology offers a rapid, adaptable, and environmentally sustainable approach to the exploration of carbonate-hosted clay-type lithium deposits, especially in geologically complex and vegetation-rich areas.
(1)
Validation and Application of Multi-source Remote Sensing in Collaborative Mineral Exploration. A hierarchical anomaly extraction strategy was developed by integrating diverse data types and techniques: PCA-based detection of hydroxyl and iron-staining anomalies, spectral hourglass processing for precise identification of lithium-bearing minerals such as montmorillonite and illite, and radar image decomposition to enhance the detection of concealed structural features. The synergistic analysis of multispectral, hyperspectral, and radar data—complemented by detailed field validation—demonstrated strong spatial consistency between predicted anomalies and measured Li2O content in claystone layers, thereby validating the method’s reliability in rugged, vegetated terrain.
(2)
Multidimensional Weighted Comprehensive Analysis. We propose a preprocessing protocol-kernel density-normalization joint preprocessing protocol for Multi informational layers, including hydroxyl, iron-staining, mineralogy, lithology, and structural features. This protocol was integrated with expert-driven dynamic weighting to develop a robust, hierarchical model for target zone delineation.
(3)
Future research should focus on three key areas to further advance this field:
Firstly, explore advanced weighted fusion algorithms leveraging machine learning and deep learning to better integrate datasets and enhance their synergistic value.
Secondly, strengthen the coupling of remote sensing data with geological information by incorporating multidisciplinary methods—such as petrology, geochemistry, and structural geology—to achieve more comprehensive mineralization models.
Thirdly, utilizing high-resolution imagery and advanced sensors will improve the timeliness and accuracy of data acquisition, thereby providing more robust technical support for the exploration of carbonate-hosted clay-type lithium deposits.
By focusing on these areas, we can further enhance the sustainability and efficiency of lithium exploration, aligning with principles of sustainable development.

5. Conclusions

In this study, we proposed and validated a comprehensive strategy—hierarchical anomaly extraction and multidimensional weighted comprehensive analysis—for the exploration of carbonate-hosted clay-type lithium deposits. This integrated approach combines multi-source data and advanced analytical techniques, demonstrating considerable promise in overcoming the limitations of traditional exploration methods. The key conclusions drawn from our research are as follows:
(1)
The integration of GF-3 QPSI SAR, GF-5B hyperspectral, and Landsat-8 OLI datasets proved highly effective in identifying and delineating lithium-rich mineralization zones. By combining these diverse data sources, our approach significantly improves the accuracy and reliability of exploration efforts, making it a powerful tool for detecting mineralization in complex environments.
(2)
The reclassification–kernel density–normalization preprocessing protocol, combined with expert-driven dynamic weighting, offers a flexible and adaptable approach to target zone delineation. Field validation confirmed that the hierarchical anomaly extraction method reliably predicts the presence of Li2O in claystone layers, ensuring that the exploration process is both precise and efficient.
(3)
This approach aligns with the goals of green mining, reducing environmental impact by promoting data-driven exploration methods that minimize the need for intrusive, destructive practices. It sets out new ideas for sustainable and environmentally responsible exploration, contributing to the long-term viability of clay-type lithium deposits and supporting the global shift toward renewable energy sources.
To further enhance the methodology, future studies should focus on optimizing multi-source data fusion techniques through the development of more advanced algorithms. The integration of geological context into multidisciplinary knowledge systems will also be crucial in improving the overall accuracy of exploration. Additionally, leveraging high-resolution imagery and cutting-edge sensors can significantly improve the timeliness and precision of data acquisition, enabling more effective monitoring of exploration sites. By addressing these areas, future research can continue to advance the sustainability and efficiency of lithium exploration, contributing to the global energy transition while preserving ecological balance and minimizing the environmental footprint of resource extraction.

Author Contributions

Conceptualization, Y.L., X.Y. and S.G.; Data curation, X.D. and Y.S.; Funding acquisition, Y.W.; Methodology, Y.L. and Z.L.; Validation, C.M.; Writing—original draft, Y.L.; Writing—review and editing, Y.L. and L.H. All authors have read and agreed to the published version of the manuscript.

Funding

This work was supported by the National Natural Science Foundation of China under grant [42367066] and [62361058] and Major Science and Technology Special Projects and Key R & D Projects in Yunnan Province in 2024 [202403ZC380001].

Institutional Review Board Statement

Not applicable.

Informed Consent Statement

Not applicable.

Data Availability Statement

The original contributions presented in this study are included in the article material. Further inquiries can be directed to the corresponding author.

Acknowledgments

We would like to thank the editors and reviewers, who provided constructive comments and suggestions. Meanwhile, we give special thanks for the data support provided by the China Platform of Earth Observation System (www.cpeos.org.cn/home) and Geospatial Data Cloud websites (www.gscloud.cn).

Conflicts of Interest

The authors declare no conflicts of interest.

References

  1. Liu, X.; Wang, C.L.; Liu, X.L.; Liu, D.H.; Yan, K.; Liu, S.H.; Liu, Y.T. Main Types, Distribution, Development and Utilization of Lithium Deposits in China. Geol. China 2024, 51, 811–832. [Google Scholar] [CrossRef]
  2. Schulz, K.J.; DeYoung, J.H.; Seal, R.R.; Bradley, D.C. Critical Mineral Resources of the United States: Economic and Environmental Geology and Prospects for Future Supply; U.S. Geological Survey Professional Paper 1802; U.S. Geological Survey: Reston, VA, USA, 2017. [Google Scholar] [CrossRef]
  3. Wen, H.J.; Luo, C.G.; Du, S.J.; Yu, W.X.; Gu, H.N.; Ling, K.Y.; Cui, Y.; Li, Y.; Yang, J.H. Carbonate-Hosted Clay-Type Lithium Deposit and Its Prospecting Significance. Chin. Sci. Bull. 2020, 65, 53–59. [Google Scholar] [CrossRef]
  4. Zhang, Q.D.; Li, D.Z.; Li, Z.W.; Wang, D.H.; Yu, Y.F.; Zhu, X.Q.; Cai, Q.Y.; Li, M. Geochemical Characteristics and Genesis of Lithium-Rich Clay Rocks in the Pudi Area of Northwestern Guizhou. Earth Sci. Front. 2024, 31, 258–280. [Google Scholar]
  5. Xiao, B.; Gong, D.X.; Tian, E.Y.; Yu, L.M.; Chen, C.H.; Huang, C.C.; Zhang, J.; Zou, H. Study on Metallogenic Characteristics of Clay-Type Lithium Deposits in Guizhou Province. Geol. Rev. 2024, 70 (Suppl. S1), 73. [Google Scholar] [CrossRef]
  6. Chen, X.; Tian, Y.G.; Cheng, J.L.; Li, W.Z.; Geng, Q.W.; Jiang, J.M.; Li, H.; Wu, F. Lithium Enrichment in the Clay Rocks of Liangshan Formation and Prospecting Prediction in Central Yunnan Province. Geol. Resour. 2023, 32, 705–712. [Google Scholar] [CrossRef]
  7. Du, W.Y.; Li, Y.M.; Zhou, B.; Fan, C.; Zeng, X.H.; Liu, J.; Liu, S.X.; Liu, L.; Liu, W.W.; Wei, S.H.; et al. Mineralization Characteristics and Prospecting Potential of Clay-Type Lithium in Southwestern Hubei. Resour. Environ. Eng. 2022, 36, 562–571. [Google Scholar] [CrossRef]
  8. Tong, Q.X.; Zhang, B.; Zhang, L.F. Current Progress of Hyperspectral Remote Sensing in China. J. Remote Sens. 2016, 20, 689–707. [Google Scholar] [CrossRef]
  9. Gürbüz, A.; Gürbüz, E. Remote Sensing Approaches for Mapping Quaternary Deposits: A Synthesis. Phys. Chem. Earth Parts A/B/C 2022, 126, 103128. [Google Scholar] [CrossRef]
  10. Cardoso-Fernandes, J.; Teodoro, A.C.; Lima, A. Remote Sensing Data in Lithium (Li) Exploration: A New Approach for the Detection of Li-Bearing Pegmatites. Int. J. Appl. Earth Obs. Geoinf. 2019, 76, 10–25. [Google Scholar] [CrossRef]
  11. Romppanen, S.; Pölönen, I.; Häkkänen, H.; Kaski, S. Optimization of Spodumene Identification by Statistical Approach for Laser-Induced Breakdown Spectroscopy Data of Lithium Pegmatite Ores. Appl. Spectrosc. Rev. 2023, 58, 297–317. [Google Scholar] [CrossRef]
  12. Jiang, G.; Zhou, K.F.; Wang, J.L.; Bai, Y.; Sun, G.Q.; Wang, W. Identification of Lithium-Beryllium Granitic Pegmatites Based on Deep Learning. Earth Sci. Front. 2023, 30, 185–196. [Google Scholar] [CrossRef]
  13. Li, S.Y.; Xiang, J.; Yan, X.; Chen, J. Research on the Monitoring Method of Lithium Mineral Capacity of Salt Lakes Based on Satellite Remote Sensing: A Case Study of Atacama Salt Lake. China Min. Mag. 2025, 34, 107–115. [Google Scholar]
  14. Soliman, N.; Salem, S.; Attwa, M.; El Bastawesey, M. Mapping Potential Salt Minerals over Wadi El Natrun Saline Lakes, Egypt, Using Remote Sensing and Geophysical Techniques. Arab. J. Geosci. 2021, 14, 1987. [Google Scholar] [CrossRef]
  15. Cui, Y.; Wen, H.J.; Yu, W.X.; Luo, C.G.; Du, S.J.; Ling, K.Y.; Xu, F.; Yang, J.H. Study on the Occurrence State and Enrichment Mechanism of Lithium in Lithium-Rich Clay Rock Series of the Daoshitou Formation of Lower Permian in Central Yunnan. Acta Petrol. Sin. 2022, 38, 2080–2094. [Google Scholar] [CrossRef]
  16. Yin, C.T. Yunnan Dianzhong Clay-Type Lithium Deposit Remote Sensing Extraction and Quantitative Inversion of Lithium Content. Ph.D. Thesis, Chang’an University, Xi’an, China, 2024. [Google Scholar] [CrossRef]
  17. Tang, S.L.; Cao, J.N.; Wang, K. Remote Sensing Mineralization Alteration Information Extraction Based on PCA, Multilevel Segment Method, and SVM. Natl. Remote Sens. Bull. 2021, 25, 653–664. [Google Scholar] [CrossRef]
  18. Kitchat, K.; Chiu, Y.-L.; Lin, Y.-C.; Sun, M.-T.; Wada, T.; Sakai, K.; Ku, W.-S.; Wu, S.-C.; Jeng, A.A.-K.; Liu, C.-H. PedCross: Pedestrian Crossing Prediction for Auto-Driving Bus. IEEE Trans. Intell. Transp. Syst. 2024, 25, 8730–8740. [Google Scholar] [CrossRef]
  19. Ye, B. Remote Sensing Ore-Indicating Information Extraction and Metallogenic Prediction of Granitic Pegmatite-Type Lithium Deposits: A Case Study of Dahongliutan Area, Xinjiang. Ph.D. Thesis, China University of Geosciences (Beijing), Beijing, China, 2022. [Google Scholar] [CrossRef]
  20. Cardoso-Fernandes, J.; Teodoro, A.C.; Lima, A.; Roda-Robles, E. Semi-Automatization of Support Vector Machines to Map Lithium (Li) Bearing Pegmatites. Remote Sens. 2020, 12, 2319. [Google Scholar] [CrossRef]
  21. Shirmard, H.; Farahbakhsh, E.; Müller, R.D.; Chandra, R. A Review of Machine Learning in Processing Remote Sensing Data for Mineral Exploration. Remote Sens. Environ. 2022, 268, 112750. [Google Scholar] [CrossRef]
  22. Li, Y.; Yuan, X.; Gan, S.; Mu, C.; Liu, Q.; Wang, Y. Hyperspectral Inversion of Li2O Content in Clay Lithium Ore Cores Based on FOD and GA-XGBoost. Int. J. Remote Sens. 2025, 46, 2984–3003. [Google Scholar] [CrossRef]
  23. Feng, X.; Tian, A.; Fu, C. Hyperspectral Prediction Model of Soil Cu Content Based on WOA-SPA Algorithm. Int. J. Remote Sens. 2024, 45, 6408–6424. [Google Scholar] [CrossRef]
  24. Carranza, E.J.M.; Laborte, A.G. Data-Driven Predictive Mapping of Gold Prospectivity, Baguio District, Philippines: Application of Random Forests Algorithm. Ore Geol. Rev. 2015, 71, 777–787. [Google Scholar] [CrossRef]
  25. Hegab, M.A.E.-R. Mineral Exploration and Environmental Impact Assessment in the Jabal Hamadat Area, Central Eastern Desert, Egypt, Using Remote Sensing and Airborne Radiometric Data. Sci. Rep. 2024, 14, 21986. [Google Scholar] [CrossRef] [PubMed]
  26. Hajaj, S.; El Harti, A.; Jellouli, A. Assessment of Hyperspectral, Multispectral, Radar, and Digital Elevation Model Data in Structural Lineaments Mapping: A Case Study from Ameln Valley Shear Zone, Western Anti-Atlas Morocco. Remote Sens. Appl. Soc. Environ. 2022, 27, 100819. [Google Scholar] [CrossRef]
  27. Jellouli, A.; El Harti, A.; Adiri, Z.; Chakouri, M.; El Hachimi, J.; Bachaoui, E.M. Application of Optical and Radar Satellite Images for Mapping Tectonic Lineaments in Kerdous Inlier of the Anti-Atlas Belt, Morocco. Remote Sens. Appl. Soc. Environ. 2021, 22, 100509. [Google Scholar] [CrossRef]
  28. Feng, Y.; Dai, J.; Bai, L.; Wu, C. Prospecting Prediction for the Yulong Metallogenic Belt in Tibet Based on Remote Sensing Alteration Information and Structural Interpretation. Remote Sens. 2024, 16, 1343. [Google Scholar] [CrossRef]
  29. Cheng, Y.M.; Zhai, X.; Li, W.Q.; Yang, X.; Zhao, Y.L.; Cui, Y.L.; Zhai, J.W.; Zheng, X.J. A Major Breakthrough in Prospecting of Carbonate-Hosted Clay-Type Lithium Deposit in Anning Area, Yunnan Province. Miner. Explor. 2024, 15, 161–163. [Google Scholar] [CrossRef]
  30. Tan, H.J.; Qiu, K.F.; Liu, H.C.; Zhang, P.C.; Fu, J.N.; Wang, R.; Luo, J.X.; Shi, Y.M. Alteration Characteristics of Wall Rocks in the Liba Orogenic Gold Deposit, West Qinling: Based on Information Extraction from GF-5B Spaceborne Hyperspectral Data. Acta Petrol. Sin. 2024, 40, 1784–1800. [Google Scholar] [CrossRef]
  31. Wang, X.; Wang, H.P.; Wang, R.; Wu, Z.J.; Gao, F.L.; Kang, N.; Wan, F.L.; Wang, Y.L.; Yang, H.; Liu, J. Geological Interpretation of Remote Sensing Images Based on Data Fusion of GF-2 and Landsat 8: A Case Study of the Wafangdian 1:50,000 Quadrangle Map. Geol. Rev. 2019, 65, 918–928. [Google Scholar] [CrossRef]
  32. Bai, L.Y.; Dai, J.J.; Wang, N.; Li, B.L.; Liu, Z.B.; Li, Z.J.; Chen, W. Extraction of Mineral Alteration Information and Mineralization Prospecting Analysis Based on GF-5 Hyperspectral in Zhule-Mangla, Tibet. Geol. China 2024, 51, 995–1007. [Google Scholar] [CrossRef]
  33. Tu, K.; Wen, Q.; Shen, H.; Yu, F.; Gu, X.Z. A New Method of Structural Interpretation in Meadow Covering Based on GF-3 Pol-SAR Images. J. Remote Sens. 2019, 23, 243–251. [Google Scholar] [CrossRef]
  34. China Geological Survey. Analysis of Rocks and Minerals, 4th ed.; Geological Publishing House: Beijing, China, 2011. [Google Scholar]
  35. GB/T 17413.3-2010; General Administration of Quality Supervision, Inspection and Quarantine of China & Standardization Administration of China. Chemical Analysis Methods for Lithium Ores—Part 3: Determination of Lithium Content. Standards Press of China: Beijing, China, 2010.
  36. Zhang, Q.D.; Jiang, S.Y.; Wang, W.; Ge, W. Current Status and Prospect of Researches on Sediment-Hosted Li Deposits in Bauxite Formations and Coal-Bearing Strata in China. Bull. Miner. Petrol. Geochem. 2024, 43, 90–101. [Google Scholar] [CrossRef]
  37. Zhao, H.Q.; Gao, W.; Yang, T.Y.; Liu, S.; Zhao, X.S. Alteration Information Extraction Based on Multispectral Differential Vegetation Suppression Method. J. Min. Sci. Technol. 2020, 5, 364–373. [Google Scholar] [CrossRef]
  38. Yu, L.; Porwal, A.; Holden, E.J.; Dentith, M.C. Suppression of Vegetation in Multispectral Remote Sensing Images. Int. J. Remote Sens. 2011, 32, 7343–7357. [Google Scholar] [CrossRef]
Figure 1. Geological setting of the study area (based on a 1:20 geological map).
Sustainability 17 03732 g001
Figure 2. Spectra of samples.
Sustainability 17 03732 g002
Figure 3. RGB color combinations of different polarization modes of GF-3.
Sustainability 17 03732 g003
Figure 4. Research workflow.
Sustainability 17 03732 g004
Figure 5. Post-suppression effects (x-axis, 0.654 μm; y-axis, 2.201 μm). (a) The original scatterplot of Landsat 8 data, (b) the post-suppression scatterplot of Landsat 8 data, (c) the original data scatterplot of GF-5B, (d) the post-suppression scatterplot of GF-5B.
Sustainability 17 03732 g005
Figure 6. Results of alteration information extraction.
Sustainability 17 03732 g006
Figure 7. Radar azimuth filtering results. (a) Azimuth filtering result for N0° (N-S), (b) azimuth filtering result for N45° (NE-SW), (c) azimuth filtering result for N90° (E-W), and (d) azimuth filtering result for N135° (NW-SE).
Sustainability 17 03732 g007
Figure 8. Filtered density distribution and rose diagram. (a) Structural density and rose plot for N0° (N-S). (b) Structural density and rose plot for N45° (NE-SW). (c) Structural density and rose plot for N90° (E-W). (d) Structural density and rose plot for N135° (NW-SE).
Sustainability 17 03732 g008
Figure 9. Target delineation: (a) Three target areas are calibrated according to evidence layer weighting and expert knowledge; (b) continuous zone 2 was selected as the field verification zone.
Sustainability 17 03732 g009
Figure 10. Field verification area.
Sustainability 17 03732 g010
Figure 11. Field validation of ore-bearing horizon: section sampling and assay results. (a) Light gray bauxitic claystone (Li2O: 0.10%). (b) Carbonaceous claystone (Li2O: 0.19%). (c) Light grayish-white bauxitic claystone (Li2O: 0.12%). (d) Light grayish-white bauxitic claystone (Li2O: 0.13%). (e) Light grayish clay rock (Li2O: 0.20%). (f) Light gray alumina clay rock (Li2O: 0.22%).
Sustainability 17 03732 g011
Table 1. Characteristic parameters of remote sensing data.
Satellite SensorData TimeSpatial Resolution/mSpectral Range, Wavelength/μmBandWidth/kmData Sources
GF-3 QPSI [33]10 March 2022
24 March 2024
8 mBand C--30https://www.cpeos.org.cn/home
GF-5B AHSI [30]21 March 202430 m0.38~2.5 μm: VNIR 0.38–1.025, SWIR 1.01–2.533060
Landsat-8 OLI [28]29 May 2024Pan, 15 m
Other, 30 m
Coastal 0.43–0.45; Blue 0.45–0.51; Green 0.53–0.59; Red 0.64–0.67; NIR 0.85–0.88; SWIR1 1.58–1.65; SWIR2 2.11–2.29; Pan 0.50–0.68; Cirrus 1.36–1.38990https://www.cpeos.org.cn/home
Table 2. Partial information on rock specimens.
Rock TypeLi2O ContentSample PhotoRock TypeLi2O ContentSample Photo
Gray-yellow aluminous rock0.68%Sustainability 17 03732 i001Gray-green pisolitic aluminite0.12%Sustainability 17 03732 i002
Purplish red pisolitic aluminite0.30%Sustainability 17 03732 i003Yellow-gray hematite mudstone0.14%Sustainability 17 03732 i004
Table 3. Common lithium-rich minerals and their absorption peak positions.
MineralsAbsorption Peak Positions
Smectite1.412, 1.906, 2.205, 2.215
Kaolinite1.400, 2.205–2.160
Hematite2.297
Calcite2.338
Lepidolite1.400, 2.194, 2.345
Spodumene1.905, 2.205
Table 4. PCA components for iron alteration and hydroxyl alteration.
EigenvectorsIron AlterationHydroxyl Alteration
Band 1Band 2Band 4Band 5Band 2Band 5Band 6Band 7
PC1−0.1583−0.1797−0.3505−0.90540.13240.70660.59930.3521
PC2−0.5812−0.5811−0.42350.38090.19510.6690−0.6171−0.3655
PC3−0.4211−0.30820.8322−0.18740.7088−0.1669−0.31680.6077
PC4−0.67810.7315−0.07190.00130.6648−0.15900.3996−0.6108
Table 5. Classification thresholds for iron-stained and hydroxyl minerals.
Mineral TypeStandard Deviation k ValuesThreshold Range
Hydroxyl49.87199.75
1.5124.68
2149.62
Iron-Stained9.061.513.59
2.522.66
Note: Thresholds are calculated as mean ± (k × SD).
Table 6. Parameters of the LINE module and their values used in research.
ParameterSignificanceUnitDescriptionValue
RadiFilter RadiusPixelCanny edge detection, gradient calculation of gaussian filter radius12
GthrEdge Gradient Threshold--The minimum gradient value of edge detection; the greater the value, the fewer edges in the image50
LthrCurve Length ThresholdPixelConsidered the minimum length of a linear construction25
FthrLine Fitting Threshold--The maximum error allowed when a line segment is fitted to form a linear construct3
AthrAngle Difference ThresholdPixelDefines the angle that cannot be exceeded between the two multisegment lines to be joined. When the angle is greater than the value between 2 lines, do not connect operations20
DthrConnection Distance ThresholdPixelSpecifies the maximum distance between two line segments to be connected. If the distance exceeds this value, the connection is not connected1
Table 7. Parameters controlling the LINE module for lineament extraction.
Filtering DirectionN0° (N-S)N45° (NE-SW)N90° (E-W)N135° (NW-SE)
Num78,64674,48374,48374,483
Max_Length4474.4108425841.8180965841.8180965841.818096
Min_Length139.4115978137.3552379137.3552379137.3552379
Mean298.9301953294.7153861294.7153861294.7153861
Sum23,509,664.1421,951,286.121,951,286.121,951,286.1
Table 8. Comprehensive evaluation weighting and scoring criteria.
Evidence LayerScoreWeight (%)
Hydroxyl alteration (normal diagnostic indicator)Low110
Middle2
High3
Iron stain alteration (normal diagnostic indicator)Low110
Middle2
High3
Mineral alteration (significant diagnostic indicator)Smectite130
Kaolinite1
Hematite1
Calcite1
Lepidolite1
Spodumene1
Rock alteration (significant diagnostic indicator, the analytical score represents the measured Li2O concentration within rock samples)Gray-yellow aluminous rock0.6830
Purplish red pisolitic aluminite0.30
Gray-green pisolitic aluminite0.12
Yellow-gray hematite mudstone0.14
Structural line *120
* These are significant diagnostic indicators in magmatic–hydrothermal systems, yet they exhibit limited efficacy in sediment-hosted deposits due to subdued geochemical contrast and syngenetic mineralization processes.
Disclaimer/Publisher’s Note: The statements, opinions and data contained in all publications are solely those of the individual author(s) and contributor(s) and not of MDPI and/or the editor(s). MDPI and/or the editor(s) disclaim responsibility for any injury to people or property resulting from any ideas, methods, instructions or products referred to in the content.

